Article

Proposal and Investigation of a Convolutional and LSTM Neural Network for the Cost-Aware Resource Prediction in Softwarized Networks †

by
Vincenzo Eramo
*,
Francesco Valente
,
Tiziana Catena
and
Francesco Giacinto Lavacca
Department of Information Engineering, Electronic, Telecommunication, “Sapienza” University of Rome, Via Eudossiana 18, 00184 Rome, Italy
*
Author to whom correspondence should be addressed.
This paper is an extended version of paper published in the AEIT International Annual Conference held in Virtual Edition, 4–8 October 2021.
Future Internet 2021, 13(12), 316; https://0-doi-org.brum.beds.ac.uk/10.3390/fi13120316
Submission received: 29 November 2021 / Revised: 10 December 2021 / Accepted: 14 December 2021 / Published: 16 December 2021
(This article belongs to the Section Internet of Things)

Abstract

:
Resource prediction algorithms have been recently proposed in Network Function Virtualization architectures. A prediction-based resource allocation is characterized by higher operation costs due to: (i) Resource underestimate that leads to quality of service degradation; (ii) used cloud resource over allocation when a resource overestimate occurs. To reduce such a cost, we propose a cost-aware prediction algorithm able to minimize the sum of the two cost components. The proposed prediction solution is based on a convolutional and Long Short Term Memory neural network to handle the spatial and temporal correlations of the need processing capacities. We compare in a real network and traffic scenario the proposed technique to a traditional one in which the aim is to exactly predict the needed processing capacity. We show how the proposed solution allows for cost advantages in the order of 20%.

1. Introduction

The main advantages of NFV is the flexibility in allocating processing and bandwidth resources [1,2] and the possibility of running the Virtual Network Function Instances (VNFIs) where and when needed and appropriately dimensioning their memory, disk and processing resources. This increased flexibility allows to efficiently handle the traffic variations and it is achieved by applying some techniques: (i) The vertical scaling [3], whereby cloud resources are reconfigured, e.g., by changing the number of processing cores to the VNFIs as traffic changes; (ii) the VNFI migration [4], whereby the NFVI-PoP executing the VNFI is changed over time with the possibility of performing resource consolidation and consequently achieving cost saving.
We have proposed the Asymmetric Traffic Prediction-based Allocation (ATPA) algorithm [5,6,7] in which the resources are allocated on the basis of a traffic prediction based on both resource allocation and QoS degradation costs. The allocation cost is the rent cost of the processing cores. The QoS penalty cost is a compensation cost for the user when cloud resources are under-allocated and QoS degradation (i.e., packet loss or delay increase) occurs. The prediction models used in [5] are based on both traditional (i.e., Seasonal AutoRegressive Integrated Moving Average) and Artificial Intelligence (AI)-based (i.e., Long Short Term Memory) models.
In this paper we follow a different approach and we propose the Asymmetric Processing Resource Prediction-based Allocation (APRPA) algorithm. Based on the measurement of processing capacities required by the VNFIs in measurement periods, APRPA evaluates the processing capacities to be allocated to the VNFIs in time instants after the measurement times. Unlike all the solutions proposed in the literature, APRPA does not aim at predicting the needed processing capacities (it would be impossible to exactly do that because of the non-predictable components of traffic) but at over-allocating or under-allocating the cloud resources according to the values of the allocation and QoS penalty costs.
The advantages of APRPA with respect to ATPA are the following:
  • its resource-based prediction allows for a more implementable and European Telecommunications Standards Institute (ETSI)-compliant solution; in particular we highlight which are the ETSI functional blocks that may be involved in the allocation and prediction procedure;
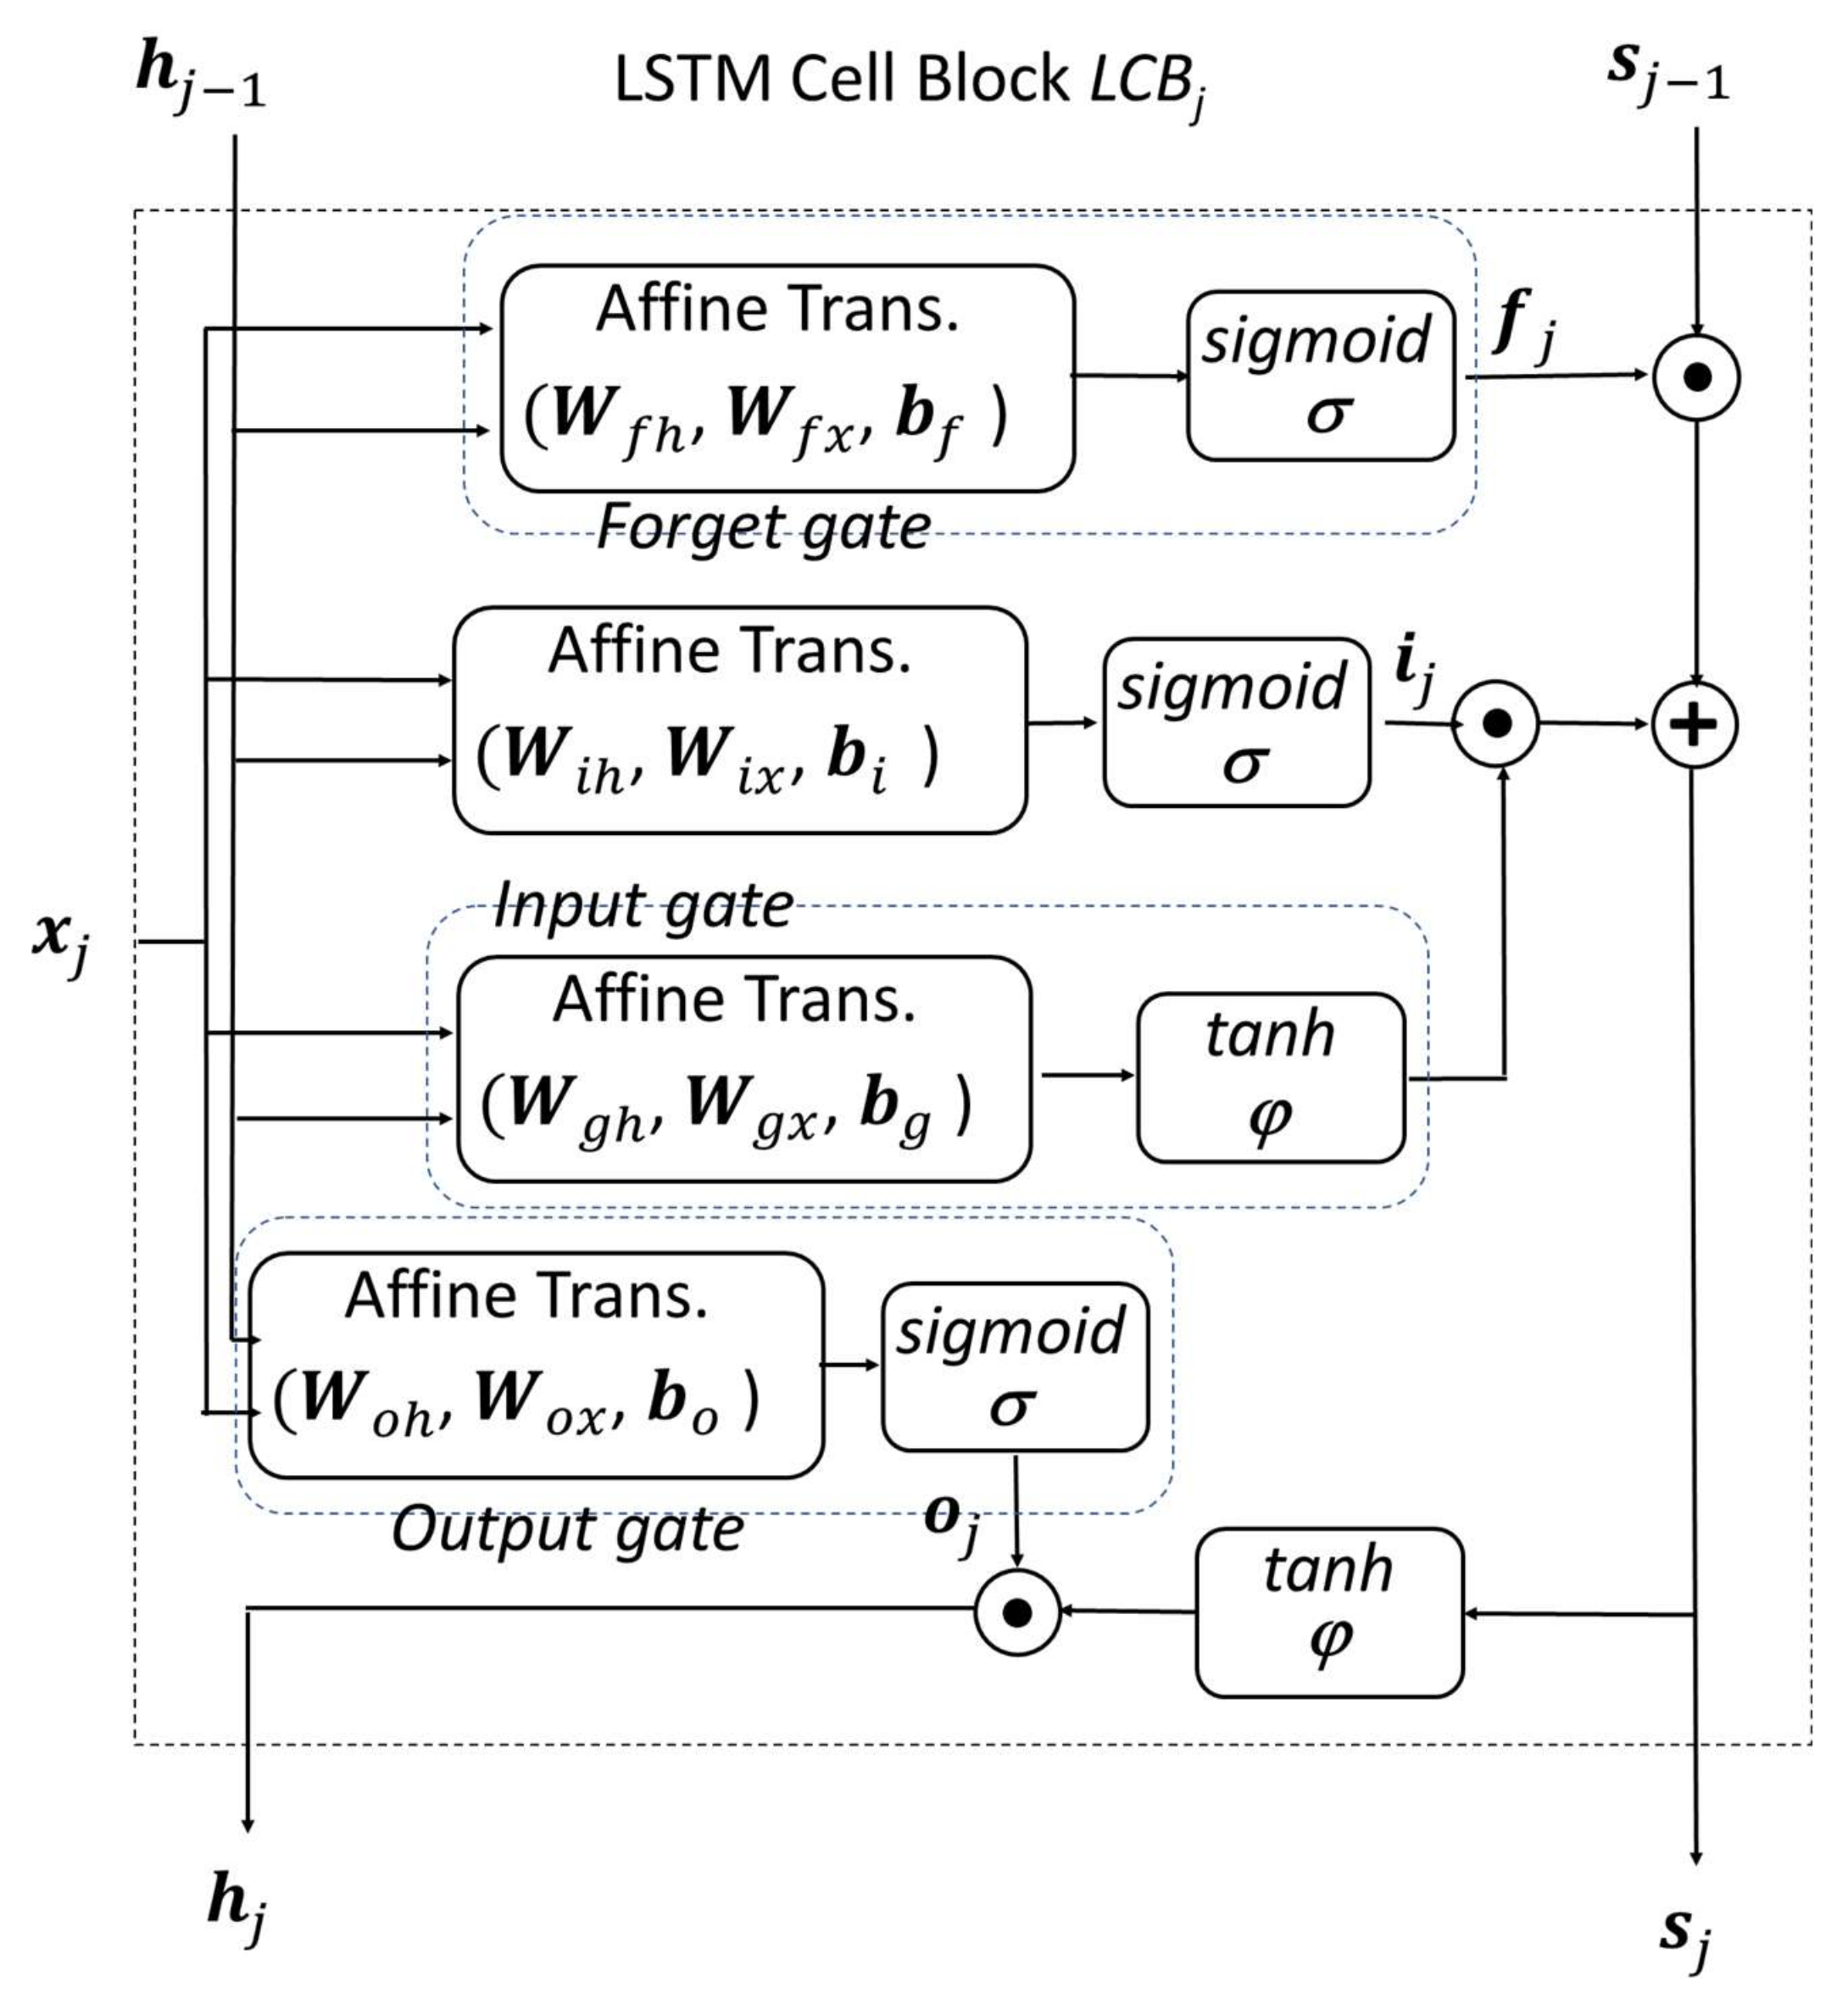
  • APRPA is based on a convolutional and Long Short Term Memory (LSTM) neural network able to handle both spatial correlations of the processing capacities of the VNFIs located in each NFVI-PoP and the temporal correlation in a single VNFI; conversely ATPA performs a simple traffic prediction with a LSTM neural network able to handle temporal correlation only;
  • APRPA allows for a more accurate prediction, consequence of multiple SFCs sharing a single VNFI that leads to the prediction of an aggregated requested processing capacity; conversely ATPA predicts the traffic of a single SFC.
The main contributions of the manuscript are the following: (i) a resource allocation framework aiming at allocating the cloud resources so as to minimize a cost function depending on both the allocation and QoS degradation costs; (ii) a simulation study of the proposed allocation framework and its effectiveness evaluation with respect to the ATPA algorithm and the Symmetric Processing Resource Prediction-based Allocation (SPRPA) [8] benchmark algorithm in which the allocation is performed by applying a traditional approach in which the aim is to exactly predict the needed processing capacity and based on the minimization of the Root Mean Squared Error.
The related work and the research contributions are illustrated in Section 2. The NFV architecture with Artificial Intelligence (AI)-based resource allocation is discussed in Section 3. We describe the cost-aware convolutional and LSTM-based resource allocation framework in Section 4. The main numerical results are shown in Section 5. We report the main conclusions in Section 6.

2. Related Work and Research Contribution

The evolution towards high bandwidth and QoS services drives technological evolution towards the design and implementation of fifth generation (5G/6G) broadband wireless networks. Ref. [9] Among these technologies, NFV is one of the most important and consists in decoupling the software running the service functions from the hardware platform.
NFV is now considered a key technology for the development of access [10] and core [1] network segments. Since the NFV paradigm has been introduced by ETSI [11,12], many resource orchestration algorithms have been proposed and investigated [13,14]. Most of them are based on knowledge of traffic and solving optimization problems and/or heuristics. Offline [15] and Online [16,17] algorithms have been considered. When traffic variations occur, resource reconfiguration algorithms [18] have been proposed. Most of them are based on a reactive approach according to which resources are reconfigured as soon as traffic changes are detected. These solutions have proven to be ineffective due to the high time required to reconfigure cloud resources which can be in the order of ten minutes [19]. Recently prediction-based proactive approaches have been proposed [19,20]. Both traditional and Artificial Intelligence techniques are used to estimate traffic and/or needed resources.
Tang et al. [21] propose a traffic prediction method for scaling resources in NFV environments based on traffic modeling with an Autoregressive Moving Average (ARMA); the predicted traffic values are obtained by minimizing the Root Mean Squared Error (RMSE).
Oliveira et al. [22] present a joint approach of an Adaptive Demand Forecasting model and an Slice Allocation algorithm in softwarized networks; they apply three of the most popular forecasting techniques: Autoregressive Integrated Moving Average (ARIMA), Holt-Winters and Neural Network Auto-Regressive (NNAR); all of the three forecast methodologies are based on the minimization of the RMSE.
Among the solutions based on the prediction of the resources to be allocated, Farahnakian et al. [23] propose regressive algorithms for estimating memory and processing consumption in cloud datacenters. Some solutions [19,24,25] have been proposed on the prediction of host load in cloud infrastructures; these solutions are based on time series forecasting with LSTM recurring neural networks; however, all are based on minimizing the RMSE.
Subramanya et al. [26] propose prediction-based VNFI scaling solutions in virtualized Mobile Edge Computing (MEC) environments; the prediction is performed by applying some types of neural networks (convolutional and LSTM) and with the application of federated machine learning; the objective is to scale the resources by either maximizing the Quality of Service or minimizing the operational cost of the service provider; the optimization is performed by minimizing symmetric loss function as the RMSE, MAE (Mean Absolute Error) and Huber function.
We have proposed the ATPA algorithm based on Seasonal Auto-Regressive Integrated Moving Average (SARIMA) [5,6] prediction with asymmetric loss function; because estimation errors are inevitable and because the error sign can have an impact on the network cost depending on the resource allocation and QoS degradation costs, we have proposed a solution in which the defined loss function gives higher (lower) weight to errors that result in a higher (lower) network cost. We have shown how the proposed solution allows for 30% network cost reduction with respect to the case in which a symmetric cost function as RMSE is chosen.
Moreover, all the necessary cloud resource prediction techniques proposed in literature are always based on symmetrical cost functions i.e., RMSE and MAE. For this reason we propose the APRPA algorithm in which the allocation is based on both the VNFI processing capacities prediction and a convolutional and LSTM resource allocation framework in which the cloud resources are allocated based on the minimization of a asymmetric cost function depending on the cloud resource allocation and QoS degradation costs. The solution may be extended to any prediction framework. Finally we also show an extension of the ETSI NFV architecture supporting the proposed solution.

3. NFV Network Architecture with AI-Based Resource Allocation

An example of ETSI compliant NFV network [11,12] is reported in Figure 1. It is composed by NFVI-PoPs interconnected by a network infrastructure. The interconnection of the NFVI-PoPs is accomplished by means of either electrical [27] or optical [28,29] networks. Let G ¯ = ( U ¯ , L ¯ ) denote the graph in which U ¯ = U ¯ N P U ¯ S characterizes the set of NFVI-PoPs ( U ¯ N P ) and the set of network switches ( U ¯ S ) and L ¯ characterizes the set of network links. We assume that the NFVI-PoP u ¯ U ¯ N P is equipped with N u ¯ cores. In view of a multi-provider scenario we assume that the processing resource costs may be different for the various NFVI-PoPs and denote with c c o r e u ¯ the cost of renting one core per one hour ($/h) for the NFVI-PoP u ¯ U ¯ N P . The NFVI-PoPs are able to instantiate VNF Instance (VNFI) than can execute a given Service Function (SF), i.e., Firewall, Proxy, DPI,... We assume that the VNFIs can belong to Q types; the i -th ( i [ 1 . . Q ] ) ) type VNFI is characterized by the allocation of n i c processing cores when the maximum processing capacity (Gbps) C i p r , m a x is provided by the VNFI. The traffic variation is handled by a vertical scaling technique [3] that assigns more/less cores when the traffic increases/decreases. In particular we assume that the i -th ( i [ 1 . . Q ] ) type VNFI can work in n i c operation modes. The j -th ( j [ 1 . . n i c ] ) operation mode is characterized by the allocation of j cores and the guarantee of a processing capacity of C i , j p r = j C i p r , m a x n i c .
The instantiated VNFIs are shared for the execution of SFs belonging to a set given of N Service Function Chains (SFC). The i -th ( i [ 1 . . N ] ) SFC is characterized by an ordered set of M i SFs.
The following functional blocks are reported in Figure 1 [11]:
  • the VNF Manager (VNFM) manages the lifecycle of VNFIs; it is provided with a Monitoring Agent (MA) whose task is to measure the processing capacity used by the VNFI;
  • the Virtual Infrastructure Manager (VIM) controls and manages the NFVI-PoP resources; it is provided with an Allocation Agent (AA) whose task is to collect the data measured by the VNFIs and execute the algorithm for evaluating the processing capacities to be allocated to the VNFIs;
  • the NFV Orchestrator (NFVO) manages the lifecycle of Network Services; it is provided with a Reconfiguration and Placement Agent (RPA) whose task is to execute an algorithm for the resource reconfiguration and the VNFI placement on the basis of the processing capacities to be allocated to the VNFIs.
The proposed procedure consists of four main steps:
  • Step-1: The MAs continuously monitor on a periodic basis with duration T m and using the Ve-Vnfm-vnf ETSI interface [12] the processing capacity required by the VNFI; let us consider the reference NFVI-PoP u ¯ U ¯ N P of Figure 1 and let N V N F I u ¯ be the number of instantiated VNFIs. Next we denote with c h , j u ¯ ( u ¯ U ¯ N P ; h [ 1 . . N V N F I u ¯ ] ; j [ 1 . . ) ) the processing capacity measured for the h -th VNFI in the j -th Monitoring Interval (MI) that is in t [ ( j 1 ) T m , j T m ) ;
  • Step-2: The measured processing capacities c h , j u ¯ are retrieved on the Vi-Vnfm ETSI interface [12] from the AA that trains a neural network in order to determine the processing capacity to be allocated to the VNFIs; we assume the allocation procedure is performed on a periodic basis with duration T a ; we denote with S the ratio of T a to T m and with c ^ h , n S u ¯ ( u ¯ U ¯ N P ; h [ 1 . . N V N F I u ¯ ] ; n [ 1 . . ) ) the processing capacity to be allocated to the h -th VNFI in t [ n T a , ( n + 1 ) T a ] ; c ^ h , n S is evaluated by a neural network based on knowledge of the required processing capacities required and measured in L previous MIs that is the values { c h , j u ¯ , h [ 1 . . N V N F I u ¯ ] ; j [ n S . . n S L + 1 ] } .
  • Step-3: The NFVO receives on the Or-Vi interface [12] from all of the VIMs the processing capacities c ^ h , n S u ¯ ( u ¯ U ¯ N P ; h [ 1 . . N V N F I u ¯ ] ; n [ 1 . . ) ) to be allocated and decides if new VNFI placement, VNFI migration and updating of processing capacity allocated to the VNFI have to be performed.
  • Step-4: The placement and reconfiguration operations are conducted through the VIM and using the Or-Vi and Nf-Vi interfaces.
The determination of the processing capacities c ^ h , n S u ¯ ( u ¯ U ¯ N P ; h [ 1 . . N V N F I u ¯ ] ; n [ 1 . . ) ) to be allocated to the VNFIs are determined by a convolutional and LSTM neural network and trained by minimizing the network cost. Such a cost is characterized by two components: The first one is the cloud resource allocation cost; the second one occurs when the resources are under-allocated and QoS degradation is introduced for a fraction of the offered traffic.
Finally many reconfiguration and placement algorithms have been proposed in literature [30]. The goal of this paper is not to propose a new one. We adopt a simple reconfiguration algorithm, inherited from [27] in which migrations are not involved and allowing us to verify the effectiveness of the proposed allocation procedures.

4. Convolutional/LSTM-Based Resource Allocation Framework

The loss function depends on two factors: The first one is the cloud resource allocation cost; the second one is the QoS degradation cost which occurs when the resources are under-allocated and QoS degradation is introduced for a fraction of the offered traffic.
To express the allocation cost we introduce the parameter C R A , i u ¯ ( i [ 1 . . Q ] ; u ¯ U ¯ N P ) which is referred to as allocation cost per Mb of traffic, it is expressed in ($/Mb) and it characterizes the cost of processing one Mb of traffic for the i-th type VNFI in the NFVI-PoP u ¯ U ¯ N P ; its expression is given by:
C R A , i u ¯ = c c o r e u ¯ n i c C i p r , m a x i [ 1 . . Q ] u ¯ U ¯ N P
The QoS degradation cost characterizes the compensation cost due to a user when the processing resources are under-allocated; the QoS degradation may involve the loss and/or the delay of processing tasks and the service providers have to compensate a user when the task average delay, a given delay percentile or the loss are increased with respect to the ones agreed in the Service Level Agreement; the expression of the QoS degradation cost is complex and depends on the several factors: (i) The chosen task queuing model; (ii) the traffic model at packet level that is trivial to assume, as often done in the literature, according to exponential distributions; (iii) a cost model which translates the QoS degradation in a monetary cost. The definition of these aspects is out of the scope of the paper and we assume a simple cost model in which the QoS degradation cost in an allocation interval depends linearly on the following parameters: (i) the unallocated processing capacity (Mbps); (ii) the duration of the interval; (iii) the degradation cost C Q o S per Mbit of traffic which is expressed in ($/Mb) and characterizes a compensation cost due to a user when one Mb of traffic does not receive the agreed QoS. We will carry out an analysis in which the parameter C Q o S is varied so as to evaluate scenarios with more or less monetary penalty when QoS constrains are not satisfied. Finally we point out that the solution can easily be extended to the case where more sophisticated QoS cost models are used.
Next we propose a neural network trained with a loss function that takes into account both resource allocation and QoS degradation costs. The inputs of the neural network are the measured VNFI processing capacities in an NFVI-PoP. The outputs are the processing capacities to be allocated in an allocation period. These capacities will be supported by allocating a sufficient number of cores to the VNFIs.
The considered neural network is composed by two main stages: (i) a convolutional layer able to handle the spatial correlations among the processing capacities required by the VNFIs running in a same NFVI-PoPs; (ii) an LSTM layer able to handle the temporal correlation of processing capacities of a same VNFI in different monitoring periods.
We describe the neural network architecture in Section 4.1, while the structure of the loss function used for the training is described in Section 4.2.

4.1. Convolutional/LSTM Neural Network

The neural network architecture is illustrated in Figure 2. It is composed by six stages referred to as normalization, convolutional, flatten, LSTM, feed-forward and de-normalization.
The normalization layer provides to normalize in the range [0, 1] the measured processing capacities; Let us denote with c j u ¯ and c j u ¯ , n o r the vector of the measured processing capacities and the one of their normalization, respectively, in the j-th MI for the NFVI-PoP u ¯ U ¯ N P . The normalized processing capacity vector c j u ¯ , n o r is evaluated according to the following expression:
c j u ¯ , n o r = 1 C m a x C m i n ( c j u ¯ C m i n o N V N F I u ¯ ) j [ n . . n L + 1 ]
where o N V N F I u ¯ denotes a ones’ vector of size N V N F I u ¯ , C m i n and C m a x denote the minimum and maximum processing capacities, respectively.
The 1-D convolutional layer aims at extracting the spatial features; convolutions are performed between the normalized capacity vector c j u ¯ , n o r and N F Kernel filters referred to as k i i [ 1 . . N F ] . The convolution vectors d j , i u ¯ are evaluated according to the following expression:
d j , i u ¯ = c j u ¯ , n o r k i j [ n . . n L + 1 ] ; i [ 1 . . N F ]
where the symbol ⊗ denotes the convolution operator. The size of the vectors d j , i u ¯ ( j [ n . . n L + 1 ] ; i [ 1 . . N F ] ) equals N V N F I u ¯ S F + 1 if Kernel of size S F are used. The outputs of the 1-D convolutional layer are the matrices D j u ¯ j [ n . . n L + 1 ] ; each of them has as rows the convolution vectors evaluated in the corresponding monitoring interval.
As the input of each LSTM cell accepts only vectors, the LSTM layer is preceded by a flatten one whose function is to place for the j-th monitoring interval the rows of the matrix D j u ¯ in the vector x j of size ( N V N F I u ¯ S F + 1 ) N F .
The LSTM layer is used to handle the temporal correlations. LSTM is a variant of the recurrent neural network (RNN), has special designs for overcoming the gradient vanishing problem that troubles conventional RNNs. LSTMs have shown their strength in handling sequential data, and have been applied successfully in various tasks, such as image captioning, language modeling, video analysis [31] etc. The LSTM layer has as inputs the vectors x j ( j [ n S . . n S L + 1 ] ) . The final output h n S is processed by a feed forward neural network which evaluates the vector c ^ n S u ¯ , n o r of normalized processing capacity values.
In the LSTM Cell Block L C B j , shown in Figure 3, the state variable s j ( j [ n S . . n S L + 1 ] ) in the j-th MI is updated according to the knowledge of the spatial feature x j evaluated in the j-th MI, the output h j 1 and the state variable s j 1 of the LSTM Cell Block L C B j 1 . The LSTM innovative idea is to introduce the forget and input gates that decide which components of the state vector have to be deleted (forget gate) and preserved (input gate). An output gate is also introduced that controls what information encoded in the state variable is sent to the output h j of the LSTM Cell Block L C B j . The updating of the state s j and the evaluation of the output h j are performed according to the following expressions:
i j f j o j = σ W i x W i h W f x W f h W o x W o h x j h j 1 + b i b f b o
s j = f j s j 1 + i j φ ( W g h h j 1 + W g x x j + b g )
h j = o j φ ( s j )
where W i x , W i h , W f x , W f h , W o x , W o h , W g x , W g h are weight matrices for the corresponding inputs, b i , b f , b o and b i are the bias vectors, ⊙ denotes the Hadamard product, φ ( ) and σ ( ) denote the tanh and sigmoid activation functions.
Finally the Feed Forward layer outputs the normalized processing capacities c ^ n S u ¯ , n o r and the de-normalization one provides the not normalized processing capacities c ^ n S u ¯ to be allocated in the allocation period. They are achieved from the following expression:
c ^ j u ¯ = C m i n o N V N F I u ¯ + c ^ j u ¯ , n o r ( C m a x C m i n ) j [ n . . n L + 1 ]

4.2. Training Algorithm

Though the model is composed of two different kinds of network architectures, i.e., the Convolutional and LSTM Neural Networks, it can be jointly trained with one loss function. In order to our neural network to predict by taking account the sign of prediction error, its loss function cannot be symmetrical as in classical predictors such as Root Mean Squared Error (RMSE) or the Mean Absolute Error (MAE). We define an asymmetrical one that weighs allocation errors e h , n S + j = c h , n S + j u ¯ c ^ h , n S u ¯ ( h [ 1 . . N V N F I u ¯ ] ; j [ 1 . . S ] ) differently. In particular a positive error corresponds to resource under-allocation and leads to QoS degradation with a cost penalty of C Q o S for each Gbit not allocated. Conversely negative errors lead to over-allocation problems and to higher costs of allocated capacity resources; in particular for each Gbit of over-allocated capacity the cost is given by C R A , i u ¯ expressed by (1) for the i-th ( i [ 1 . . Q ] ) type VNFI belonging to the NFVI-PoP u ¯ U ¯ N P . For this reason the expression of the loss function J is the following:
J = 1 P n P J n S
J n S = 1 S N V N F I u ¯ h = 1 N V N F I u ¯ j = 1 S ( C Q o S I ( e h , n S + j ) e h , n S + j C R A , h ( ) , u ¯ I ( e h , n S + j ) e h , n S + j )
where J n S denotes the average weighted error in the allocation period t [ n T a , ( n + 1 ) T a ) , P denotes the collection of time points when the allocations are conducted of training samples, P denotes the number of training samples, I ( x ) is the indicator function and C R A , h ( ) , u ¯ depend on the VNFI type and can expressed as:
C R A , h ( ) , u ¯ = i = 1 Q C R A , i u ¯ α i , h u ¯ h [ 1 . . N V N F I u ¯ ] u ¯ U ¯ N P
where α i , h u ¯ is a binary variable assuming the value 1 if the h-th VNFI of the NFVI-PoP u ¯ U ¯ N P is of i-th type; otherwise its value is zero
Finally the training of the neural network is performed by applying the RMSprop algorithm proposed by Tieleman and Hinton [32].

5. Numerical Results

The performance of the APRPA algorithm is compared to the ones of two benchmark algorithms: (i) SPRPA in which the allocation is performed by applying a traditional approach with the objective to exactly predict the needed processing capacity and based on the minimization of the Root Mean Squared Error; (ii) ATPA [5,6] in which the resources are allocated on the basis of a traffic prediction based on both resource allocation and QoS degradation costs.
The comparison is carried out for the USAnet network of Figure 4 with 24 switches and 47 links.
It is equipped with five NFVI-PoPs, all provided with the same number N c o r e = 48 of cores. The core costs are chosen according to real prices [33] and their values are differentiated and equal to c c o r e ( 1 ) = 4.56 · 10 3 $/h, c c o r e ( 2 ) = 6.40 · 10 3 $/h, c c o r e ( 3 ) = 8.95 · 10 3 $/h, c c o r e ( 4 ) = 1.25 · 10 2 $/h and c c o r e ( 5 ) = 1.75 · 10 2 $/h for the NFVI-PoP 1 , NFVI-PoP 2 , NFVI-PoP 3 , NFVI-PoP 4 and NFVI-PoP 5 , respectively. We assume that Q = 4 types of VNFIs can be instantiated. The i -th type VNFI is executing Firewall (FW), Intrusion Detection System (IDS), Network Address Translator (NAT) and Proxy SFs for i equal to 1, 2, 3 and 4, respectively. We report in Table 1 the processing capacity and the allocated cores for the various operation modes of the VNFIs.
The chosen core cost leads to the values C R A , j u ¯ ( j [ 1 . . Q ] ; u ¯ U ¯ N P ) of resource allocation costs reported in Table 2 for the various VNFI types and NFVI-PoPs. The costs are evaluated according to the expression (1).
Finally the network links are provided with a capacity of 100 Gbps.
The SFC bandwidths are characterized by real traffic values extracted by the database [34] with average bandwidths evaluated in intervals of duration 10 min. The SFCs are offered for each tuple of nodes of the USAnet network and are composed by four SFs executed according to the following order: Firewall, IDS, NAT and PROXY.
The SFCs are routed by applying the heuristic proposed in [27] aiming at minimizing the cloud resource cost and respecting the processing and bandwidth capacity constraints. The application of the heuristic also allows for the VNFI placement by determining how many VNFIs to use and where to instantiate them.
The monitoring procedure is performed by the MAs every T m = 10 min. The VIM determines the processing capacities to be allocated to the VNFIs of an NFVI-PoP for a time period T a equal to 10 min, 30 min and 60 min to which correspond values of the parameter S equal to 1, 3 and 6, respectively. The high number of hyperparameters makes their optimization not as simple as in [35]. Their choice has been optimized for each of the five NFVI-PoPs and for each value of S. It has been performed as follows:
  • the look-back parameter L has been choice by studying the partial autocorrelation function (PACF) [36] of the processing capacities of the training set; it has been chosen the first value in which the PACF has a negligible value ( 10 2 );
  • the Kernel filter size S F has been chosen equal to the number of VNFIs executing in each NFVI-PoP;
  • the remaining hyperparametrs (the number N n r of neurons of the LSTM layer, the number N F of Kernel filters and the batch size N s z ) have been chosen by performing a sensitivity analysis with the KerasTuner software [37]. KerasTuner is an easy-to-use, scalable hyperparameter optimization framework that solves the pain points of hyperparameter search. Easily configure the search space with a define-by-run syntax, then leverage one of the available search algorithms to find the best hyperparameter values for the models. We have chosen the KerasTuner option that performs the hyperparameter optimization with the Hyperband algorithm.
We report in Table 3 the values of the optimized hyperparameters for each of the five NFVI-PoPs and a value S equal to 1.
Finally the total number N e p of epochs is determined by applying a early stopping procedure and using the validation set. The effectiveness of the APRPA algorithm is studied in Figure 5 where we report over time (expressed in multiples of T m ) the required processing capacity and the ones to be allocated to a Firewall VNFI in the NFVI-PoP 1 . The allocation time T a is chosen equal to 60 min that leads to a value of S equal to 6. We report four allocation curves: (i) the first one when SPRPA is applied and the loss function of the Convolutional/LSTM neural network is characterized by the conventional Root Mean Squared Error (RMSE); (ii) the other three are ones achieved by applying the APRPA solution and characterized by the Asymmetric Mean Absolute Error (AMAE) that appropriately weights the resource allocation and QoS degradation costs. The choice of the core costs and the VNFI type leads to an average allocation cost C ¯ R A equal to 1.86 10 5 $/Gb. The QoS degradation cost C Q o S is chosen equal to 9.30 10 6 $/Gb, 9.30 10 5 $/Gb, 9.30 10 4 $/Gb for the three curves, respectively, that is values lower than, equal to and higher than the average allocation cost of the NFVI-PoP 1 . From Figure 5 we can remark that: (i) when the QoS degradation cost C Q o S equals the average resource allocation cost we have similar values of allocated capacities for the APRPA and SPRPA algorithms; (ii) when the QoS degradation cost is lower (higher) than the average allocation cost, we can observe that APRPA solution tends to allocate less (more) processing resources with respect to the SPRPA one.
We report in Figure 6 the total network cost as a function of the QoS degradation cost C Q o S for the RMSE and AMAE solutions when the allocation time T a is chosen equal to 10 min, 30 min and 60 min to which correspond values of the parameter S equal to 1, 3 and 6, respectively. The total network cost is given by the sum of the costs of the VNFIs executed in all of the NFVI-PoPs. The values of normalized RMSE and AMAE of the SPRPA and APRPA algorithms for the five NFVI-PoPs are reported in Table 4 to show the prediction effectiveness in the case of S equal to 1, 3 and 6 and QoS degradation costs C Q o S equal to 1.85 · 10 5 $/Gb, 1.85 · 10 4 $/Gb, 5.56 · 10 4 $/Gb and 9.26 · 10 4 $/Gb.
We also report the two total resource allocation and QoS degradation cost components in Figure 7 and Figure 8, respectively. We show the results in the case of interest in which the QoS degradation cost C Q o S is higher than the average allocation cost C ¯ R A .
We can observe that for both SPRPA and APRPA solutions a decrease in T a leads to lower total costs. As a matter of example, when C Q o S equals 7.41 10 4 $/Gb and the APRPA solution is applied, the total cost equals 219 $, 255 $ and 266 $ for T a equal to 10 min, 30 min and 60 min, respectively. The reason of this cost decrease is consequence of the possibility to allocate cloud resources so as to appropriately follow the required processing capacity.
Figure 6 again confirms how the minimization of a loss function taking into account both the allocation and QoS degradation costs allows for better performance in term of total network cost. For instance when T a and C Q o S are equal to 60 min and 4.63 10 4 $/Gb, respectively, the total network cost is equal to 425 $ and 248 $, respectively, for SPRPA and APRPA. The only minimization of the RMSE may lead to worse performance because of the error sign that differently impacts on the total network cost when the allocation and QoS degradation costs are different.
In particular we can notice from Figure 6 how the increase in C Q o S leads to a rapid increase in the total network cost in the SPRPA solution because it is not able to limit the total QoS degradation cost as highlighted in Figure 8. Conversely the APRPA solution is able to apply the appropriate countermeasures, to over-allocate the processing resource and to reduce the total QoS degradation cost as highlighted in Figure 7 and Figure 8 where we notice an increase in total resource allocation cost (due to the resource over-allocation) and a decrease in total QoS degradation cost.
Finally the APRPA algorithm is compared with our previous ATPA solution [5,6] in Figure 9 in which traffic prediction is only performed. We can observe the better performance of APRPA with 10% gain. The main reason is that APRPA performs a prediction on processing capacities requested by aggregated traffic; convesely ATPA performs the forecast on the single SFC only.

6. Conclusions

A Convolutional/LSTM neural network for the processing capacity prediction in NFV networks has been proposed and evaluated. We have described how the prediction procedure may be supported in an ETSI NFV architecture. The allocation framework decides the amount of processing resources to allocate to each VNFI based on the monitoring of the processing capacities required by the VNFIs in past time intervals. The Convolutional/LSTM neural network is characterized by a loss function that allows for a minimization of the allocation and QoS penalty cost. We have shown how the proposed solution outperforms the traditional ones.

Author Contributions

Methodology, V.E. and T.C.; Software, F.G.L., T.C. and F.V.; Writing original draft, V.E.; Writing review & editing, V.E. All authors have read and agreed to the published version of the manuscript.

Funding

This research received no external funding.

Institutional Review Board Statement

Not applicable.

Informed Consent Statement

Not applicable.

Data Availability Statement

Not applicable, the study does not report any data.

Conflicts of Interest

The authors declare no conflict of interest.

References

  1. Mijumbi, R.; Serrat, J.; Gorricho, J.; Bouten, N.; De Turck, F.; Boutaba, R. Network Function Virtualization: State-of-the-art and Research Challenges. IEEE Commun. Surv. Tutor. 2016, 18, 236–262. [Google Scholar] [CrossRef] [Green Version]
  2. Eramo, V.; Miucci, E.; Ammar, M. Study of Migration Policies in Energy-Aware Virtual Router Networks. IEEE Commun. Lett. 2014, 18, 1919–1922. [Google Scholar] [CrossRef]
  3. Eramo, V.; Lavacca, F.G. Proposal and Investigation of a Reconfiguration Cost Aware Policy for Resource Allocation in Multi-Provider NFV Infrastructures Interconnected by Elastic Optical Networks. J. Light. Technol. 2019, 37, 4098–4114. [Google Scholar] [CrossRef]
  4. Yi, B.; Wang, X.; Huang, M.; Li, K. Design and Implementation of Network-Aware VNF Migration Mechanism. IEEE Access 2020, 8, 44346–44358. [Google Scholar] [CrossRef]
  5. Eramo, V.; Lavacca, F.G.; Catena, T.; Di Giorgio, F. Reconfiguration of Optical-NFV Network Architectures Based on Cloud Resource Allocation and QoS Degradation Cost-Aware Prediction Techniques. IEEE Access 2020, 8, 200834–200850. [Google Scholar] [CrossRef]
  6. Eramo, V.; Lavacca, F.G.; Catena, T.; Perez Salazar, P.J. Application of a Long Short Term Memory neural predictor with asymmetric loss function for the resource allocation in NFV network architectures. Comput. Netw. 2021, 193, 108104–108116. [Google Scholar] [CrossRef]
  7. Eramo, V.; Lavacca, F.G.; Catena, T.; Perez Salazar, P.J. Proposal and Investigation of an Artificial Intelligence (AI)-Based Cloud Resource Allocation Algorithm in Network Function Virtualization Architectures. Future Internet 2020, 12, 196. [Google Scholar] [CrossRef]
  8. Eramo, V.; Valente, F.; Lavacca, F.G.; Catena, T. Cost-Aware and AI-based Resource Prediction in Softwarized Networks. In Proceedings of the 2021 AEIT International Annual Conference, Virtual, 4–8 October 2021. [Google Scholar]
  9. Trakadas, P.; Sarakis, L.; Giannopoulos, A.; Spantideas, S.; Capsalis, N.; Gkonis, P.; Karkazis, P.; Rigazzi, G.; Antonopoulos, A.; Cambeiro, M.A.; et al. A Cost-Efficient 5G Non-Public Network Architectural Approach: Key Concepts and Enablers, Building Blocks and Potential Use Cases. Sensors 2021, 21, 5578. [Google Scholar] [CrossRef]
  10. Eramo, V.; Listanti, M.; Lavacca, F.G.; Iovanna, P.; Bottari, G.; Ponzini, F. Trade-Off Between Power and Bandwidth Consumption in a Reconfigurable Xhaul Network Architecture. IEEE Access 2016, 4, 9053–9065. [Google Scholar] [CrossRef]
  11. Chiosi, M.; Clarke, D.; Feder, J.; Cui, C.; Benitez, J.; Michel, U.; Fumui, M.; Delisle, D.; Guardini, I.; Lopez, D.; et al. Network Functions Virtualization: An Introduction, Benefits, Enablers, Challenges and Call for Action; Technical Report; ETSI—European Telecommunications Standards Institute: Darmstadt, Germany, 2012. [Google Scholar]
  12. ETSI Industry Specification Group (ISG) NFV. ETSI Group Specifications on Network Function Virtualization. January 2015. Available online: https://docbox.etsi.org/ISG/NFV/Open/Published/ (accessed on 15 November 2021).
  13. Mostafavi, S.; Hakami, V.; Sanaei, M. Quality of service provisioning in network function virtualization: A survey. Computing 2021, 103, 917–991. [Google Scholar] [CrossRef]
  14. Umrao, B.K.; Yadav, D.K. Algorithms for functionalities of virtual network: A survey. J. Supercomput. 2021, 77, 7368–7439. [Google Scholar] [CrossRef]
  15. Yang, S.; Li, F.; Trajanovski, S.; Chen, X.; Wang, Y.; Fu, X. Delay-Aware Virtual Network Function Placement and Routing in Edge Clouds. IEEE Trans. Mob. Comput. 2021, 20, 445–459. [Google Scholar] [CrossRef] [Green Version]
  16. Zu, J.; Hu, G.; Yan, J.; Tang, S. A community detection based approach for Service Function Chain online placement in data center network. Comput. Commun. 2021, 169, 168–178. [Google Scholar] [CrossRef]
  17. Qiao, W.; Liu, Y.; Lu, Y.; Li, X.; Yan, J.; Yao, Z. A Novel Approach for Service Function Chain Embedding in Cloud Datacenter Networks. IEEE Commun. Lett. 2021, 25, 1134–1138. [Google Scholar] [CrossRef]
  18. Varasteh, A.; Madiwalar, B.; Van Bemten, A.; Kellerer, W.; Mas-Machuca, C. Holu: Power-Aware and Delay-Constrained VNF Placement and Chaining. IEEE Trans. Netw. Serv. Manag. 2021, 18, 1524–1539. [Google Scholar] [CrossRef]
  19. Schneider, S.; Puthenpurayil Satheeschandrany, N.; Peuster, M.; Karl, H. Machine Learning-Based Method for Prediction of Virtual Network Function Resource Demands. In Proceedings of the 2020 IEEE Conference on Network Softwarization (NetSoft), Ghent, Belgium, 29 June–3 July 2020. [Google Scholar]
  20. Li, B.; Lu, W.; Liu, S.; Zhu, Z. Deep-Learning-Assisted Network Orchestration for On-Demand and Cost-Effective vNF Service Chaining in Inter-DC Elastic Optical Networks. IEEE J. Opt. Commun. Netw. 2018, 10, D29–D41. [Google Scholar] [CrossRef]
  21. Tang, H.; Zhou, D.; Chen, D. Dynamic Network Function Instance Scaling Based on Traffic Forecasting and VNF Placement in Operator Data Centers. IEEE Trans. Parallel Distrib. Syst. 2019, 30, 530–543. [Google Scholar] [CrossRef]
  22. Oliveira, D.H.L.; de Araujo, T.P.; Gomes, R.L. An Adaptive Forecasting Model for Slice Allocation in Softwarized Networks. IEEE Trans. Netw. Serv. Manag. 2021, 18, 94–103. [Google Scholar] [CrossRef]
  23. Farahnakian, F.; Pahikkala, T.; Liljeberg, P.; Plosila, J.; Hieu, N.T.; Tenhunen, H. Energy-Aware VM Consolidation in Cloud Data Centers Using Utilization Prediction Model. IEEE Trans. Cloud Comput. 2019, 7, 524–536. [Google Scholar] [CrossRef]
  24. Yang, Q.; Zhou, Y.; Yu, Y.; Yuan, J.; Xing, X.; Du, S. Multi-step-ahead Host Load Prediction using Autoencoder and Echo State Networks in Cloud Computing. J. Supercomput. 2015, 71, 3037–3053. [Google Scholar] [CrossRef]
  25. Nguyen, H.M.; Kalra, G.; Kim, D. Host Load Prediction in Cloud Computing using Long Short-Term Memory Encoder-Decoder. J. Supercomput. 2019, 75, 7592–7605. [Google Scholar] [CrossRef]
  26. Subramanya, T.; Riggio, R. Centralized and Federated Learning for Predictive VNF Autoscaling in Multi-Domain 5G Networks and Beyond. IEEE Trans. Netw. Serv. Manag. 2021, 18, 63–78. [Google Scholar] [CrossRef]
  27. Eramo, V.; Lavacca, F.G. Computing and Bandwidth Resource Allocation in Multi-Provider NFV Environment. IEEE Commun. Lett. 2018, 22, 2060–2063. [Google Scholar] [CrossRef]
  28. Matera, F.; Schiffini, A.; Guglielmucci, M.; Settembre, M.; Eramo, V. Numerical Investigation on Design of Wide Geographical Optical Transport Networks Based on n× 40 Gbit/s Transmission. J. Light. Technol. 2003, 21, 456–465. [Google Scholar] [CrossRef]
  29. Eramo, V.; Listanti, M. Input Wavelength Conversion in Optical Packet Switches. IEEE Commun. Lett. 2003, 7, 281–283. [Google Scholar] [CrossRef]
  30. Yi, B.; Wang, X.; Li, K.; Das, S.K.; Huang, M. A comprehensive survey of Network Function Virtualization. Comput. Netw. 2018, 133, 212–262. [Google Scholar] [CrossRef]
  31. Kong, W.; Dong, Z.Y.; Jia, Y.; Hill, D.J.; Xu, Y.; Zhang, Y. Short-Term Residential Load Forecasting Based on LSTM Recurrent Neural Network. IEEE Trans. Smart Grid 2019, 10, 841–851. [Google Scholar] [CrossRef]
  32. Tieleman, T.; Hinton, G. Lecture 6.5-rmsprop: Divide the gradient by a running average of its recent magnitude. Coursera Neural Netw. Mach. Learn. 2012, 4, 26–31. [Google Scholar]
  33. EC2—Amazon Web Services. Available online: https://aws.amazon.com/ec2/ (accessed on 15 November 2021).
  34. SND-lib. Available online: http://sndlib.zib.de/home.action (accessed on 15 November 2021).
  35. De Giorgi, M.G.; Quarta, M. Hybrid MultiGene Genetic Programming-Artificial neural networks approach for dynamic performance prediction of an aeroengine. Aerosp. Sci. Technol. 2020, 103, 105902. [Google Scholar] [CrossRef]
  36. Brockwell, P.J.; Davis, R.A. Introduction to Time Series and Forecasting; Springer: Berlin/Heidelberg, Germany, 2016. [Google Scholar]
  37. KerasTuner. Available online: https://github.com/keras-team/keras-tuner (accessed on 15 November 2021).
Figure 1. ETSI Compliant NFV Network Architecture with AI-based Resource Allocation.
Futureinternet 13 00316 g001
Figure 2. Convolutional/LSTM neural network for the processing resource allocation in the NFVI-PoP u ¯ U ¯ N P .
Futureinternet 13 00316 g002
Figure 3. LSTM Cell Block L C B j .
Futureinternet 13 00316 g003
Figure 4. USAnet network equipped with five NFVI-PoPs.
Futureinternet 13 00316 g004
Figure 5. Required and allocated capacities over time to a Firewall VNFI in the NFVI-PoP 1 . Monitoring and Allocation Times T m and T a are chosen equal to 10 min and 60 min, respectively. Four allocation curves are reported: The one based on RMSE and the ones based on AMAE with C Q o S = 9.30 · 10 6 $/Gb, C Q o S = 9.30 · 10 5 $/Gb and C Q o S = 9.30 · 10 4 $/Gb.
Futureinternet 13 00316 g005
Figure 6. Comparison of the SPRPA and APRPA algorithms in terms of total cost as a function of the QoS degradation cost C Q o S when the MI duration T m equals 10 min and the allocation time T a is chosen to be 10 min ( S = 1 ), 30 min ( S = 3 ) and 60 min ( S = 6 ).
Futureinternet 13 00316 g006
Figure 7. Comparison of the SPRPA and APRPA algorithms in terms of total allocation Cost as a function of the QoS degradation cost C Q o S when the MI duration T m equals 10 min and the allocation time T a is chosen to be 10 min ( S = 1 ), 30 min ( S = 3 ) and 60 min ( S = 6 ).
Futureinternet 13 00316 g007
Figure 8. Comparison of the SPRPA and APRPA algorithms in terms of total QoS degradation Cost as a function of the QoS degradation cost C Q o S when the MI duration T m equals 10 min and the allocation time T a is chosen to be 10 min ( S = 1 ), 30 min ( S = 3 ) and 60 min ( S = 6 ).
Futureinternet 13 00316 g008
Figure 9. Comparison of the ATPA and APRPA algorithms in terms of total Cost as a function of the QoS degradation cost C Q o S when the MI duration T m equals 10 min and the allocation time T a is chosen to be 10 min ( S = 1 ), 30 min ( S = 3 ) and 60 min ( S = 6 ).
Futureinternet 13 00316 g009
Table 1. Four VNFI types are considered. The maximum processing capacities C i p r , m a x ( i [ 1 . . Q ] ) are 900 Mbps, 600 Mbps, 900 Mbps and 600 Mbps when the number of cores allocated n i c ( i [ 1 . . Q ] ) equals 4, 8, 2 and 4, respectively. The table reports the processing capacities C i , j p r ( i [ 1 . . Q ] , j [ 1 . . n i c ] ) expressed in Mbps when vertical scaling techniques are applied and for the various operation modes of the VNFIs.
Number of Allocated Cores12345678
1-st type VNFI (Firewall)225450675900
2-nd type VNFI (IDS)75150225300375450525600
3-rd type VNFI (NAT)450900
4-th type VNFI (PROXY)150300450600
Table 2. Values of the resource allocation costs C R A , j u ¯ ( j [ 1 . . Q ] ; u ¯ U ¯ N P ) expressed in $/Gb.
NFVI-PoP 1 NFVI-PoP 2 NFVI-PoP 3 NFVI-PoP 4 NFVI-PoP 5
1-st type VNFI (Firewall) 5.64 · 10 6 7.90 · 10 6 1.11 · 10 5 1.55 · 10 5 2.17 · 10 5
2-nd type VNFI (IDS) 1.69 · 10 5 2.37 · 10 5 3.32 · 10 5 4.64 · 10 5 6.50 · 10 5
3-rd type VNFI (NAT) 2.82 · 10 6 3.95 · 10 6 5.53 · 10 6 7.74 · 10 6 1.08 · 10 5
4-th type VNFI (PROXY) 8.46 · 10 6 1.18 · 10 5 1.66 · 10 5 2.32 · 10 5 3.25 · 10 5
Table 3. Values of Optimized Hyperparameters for each of the five NFVI-PoPs of Figure 4 and a value of S equal to 1.
N nr L N F S F N sz
NFVI-PoP 1 334081024
NFVI-PoP 2 1940161024
NFVI-PoP 3 3840321024
NFVI-PoP 4 3440321024
NFVI-PoP 5 394016824
Table 4. Values of normalized RMSE and AMAE of the APRPA and APRPA algorithms, respectively, in the case of S equal to 1, 3 and 6 and QoS degradation costs C Q o S equal to 1.85 10 5 $/Gb, 1.85 10 4 $/Gb, 5.56 10 4 $/Gb and 9.26 10 4 $/Gb.
SPRPA (S = 1)APRPA (S = 1)SPRPA (S = 3)APRPA (S = 3)SPRPA (S = 6)APRPA (S = 6)
C Q o S = 1.85 · 10 5 2.29 · 10 1 3.04 · 10 3 3.23 · 10 1 4.45 · 10 3 3.67 · 10 1 5.09 · 10 3
C Q o S = 1.8 · 10 4 2.29 · 10 1 7.07 · 10 3 3.23 · 10 1 1.09 · 10 2 3.67 · 10 1 1.25 · 10 2
C Q o S = 5.56 · 10 4 2.29 · 10 1 7.55 · 10 3 3.23 · 10 1 1.09 · 10 2 3.67 · 10 1 1.43 · 10 2
C Q o S = 9.26 · 10 4 2.29 · 10 1 7.65 · 10 3 3.23 · 10 1 1.11 · 10 2 3.67 · 10 1 1.35 · 10 2
Publisher’s Note: MDPI stays neutral with regard to jurisdictional claims in published maps and institutional affiliations.

