
A Sign of Things to Come: Predicting the Perception of Above-the-Fold Time in Web Browsing


1
School of Computer Science, University College Dublin, D04 N2E5 Dublin 4, Ireland
2
School of Electrical and Electronic Engineering, University College Dublin, D04 N2E5 Dublin 4, Ireland
*
Author to whom correspondence should be addressed.
Future Internet 2021, 13(2), 50; https://0-doi-org.brum.beds.ac.uk/10.3390/fi13020050
Submission received: 18 January 2021
/
Revised: 8 February 2021
/
Accepted: 12 February 2021
/
Published: 17 February 2021
(This article belongs to the Special Issue Quality of Experience (QoE) Management in Softwarized Network Environments)
Abstract
:Content is a key influencing factor in Web Quality of Experience (QoE) estimation. A web user’s satisfaction can be influenced by how long it takes to render and visualize the visible parts of the web page in the browser. This is referred to as the Above-the-fold (ATF) time. SpeedIndex (SI) has been widely used to estimate perceived web page loading speed of ATF content and a proxy metric for Web QoE estimation. Web application developers have been actively introducing innovative interactive features, such as animated and multimedia content, aiming to capture the users’ attention and improve the functionality and utility of the web applications. However, the literature shows that, for the websites with animated content, the estimated ATF time using the state-of-the-art metrics may not accurately match completed ATF time as perceived by users. This study introduces a new metric, Plausibly Complete Time (PCT), that estimates ATF time for a user’s perception of websites with and without animations. PCT can be integrated with SI and web QoE models. The accuracy of the proposed metric is evaluated based on two publicly available datasets. The proposed metric holds a high positive Spearman’s correlation () with the Perceived ATF reported by the users for websites with and without animated content. This study demonstrates that using PCT as a KPI in QoE estimation models can improve the robustness of QoE estimation in comparison to using the state-of-the-art ATF time metric. Furthermore, experimental result showed that the estimation of SI using PCT improves the robustness of SI for websites with animated content. The PCT estimation allows web application designers to identify where poor design has significantly increased ATF time and refactor their implementation before it impacts end-user experience.
1. Introduction
As internet plays an increasingly important role in almost every workplace around the globe, web applications have gained a substantial role in streamlining different organizational, business, or personal processes. The success of web applications significantly depends on an providing a good user experience [1,2]. Measuring the performance of web browsing is essential to understand how to improve the end-users’ perceived quality or Quality of Experience (QoE) [3,4]. According to Callet et al. [5], QoE considers influence factors beyond service [5], i.e., context, user, content, and system factors. QoE covers the entire service experience and measures the degree of delight or annoyance of a user while using a service [5].
In web browsing, when a web page is requested, the browser follows a process to fetch and render the web content on the user’s screen. The end-user’s QoE is partly dependant on how fast the visible page content is rendered in the browser [6]. Researchers have been actively developing metrics and models to estimate QoE of web browsing. Quality metrics (objective and subjective) and models are the critical components of web QoE analysis. Quality metrics measure the efficiency and performance of web applications. QoE models utilize objective quality metrics to estimate the perceived quality [7,8].
In 2012, Google introduced SpeedIndex (SI) [9] to estimate how fast a web page is visually completed, starting from the time that a URL is requested (URL request time) until the time that the visual content is completely painted on the current view-port of the screen (Above-the-fold (ATF) Time) [9]. In a user study conducted by the authors [10], however, it was established that if the website has an animation in the ATF area, the estimated ATF time may not accurately match completed ATF time reported by users. An inaccurate estimation of ATF will impact the perceived performance estimation metrics, like SI and QoE models, that rely on ATF estimation [10,11].
Motivated by our previous findings [10], in this paper, a visual metric that estimates ATF time in accordance with the users’ perception is proposed. In order to differentiate it from ATF, which is an under-specified term, the metric is referred to as Plausibly Complete Time (PCT) as it is the time as which the metric predicts a page load to have plausibly competed rendering ATF content. PCT is designed to estimate the perceived ATF time for websites with different content characteristics, focusing on animated and non-animated content classes. The accuracy of the metric is evaluated based on data collected in the subjective study described in Reference [10] and a public dataset composed of page load data from 83 commercial websites [6]. The analysis shows that the proposed metric, PCT, is highly correlated with the perceived ATF time reported by the subjective study. Using PCT as a KPI in the IQX QoE model (exponential Interdependency of Quality of eXperience and QoS [7]) improves the robustness of QoE estimation in comparison to the objective ATF time. (Robustness in this paper refers to better approximating the performance under various network conditions and content characteristics (e.g., websites with or without animations).) Furthermore, it is observed that the estimation of SI using PCT improves the robustness of SI’s speed estimation for webpages with and without animated contents.
Research Questions
To conduct the study, the following research questions are formulated:
- Is it possible to develop a robust objective ATF metric with a consistent estimation behavior for both animated and non-animated content?
- Is it possible to integrate the proposed metric with SI to passively estimate the perceived performance of interactive web applications?
2. Background
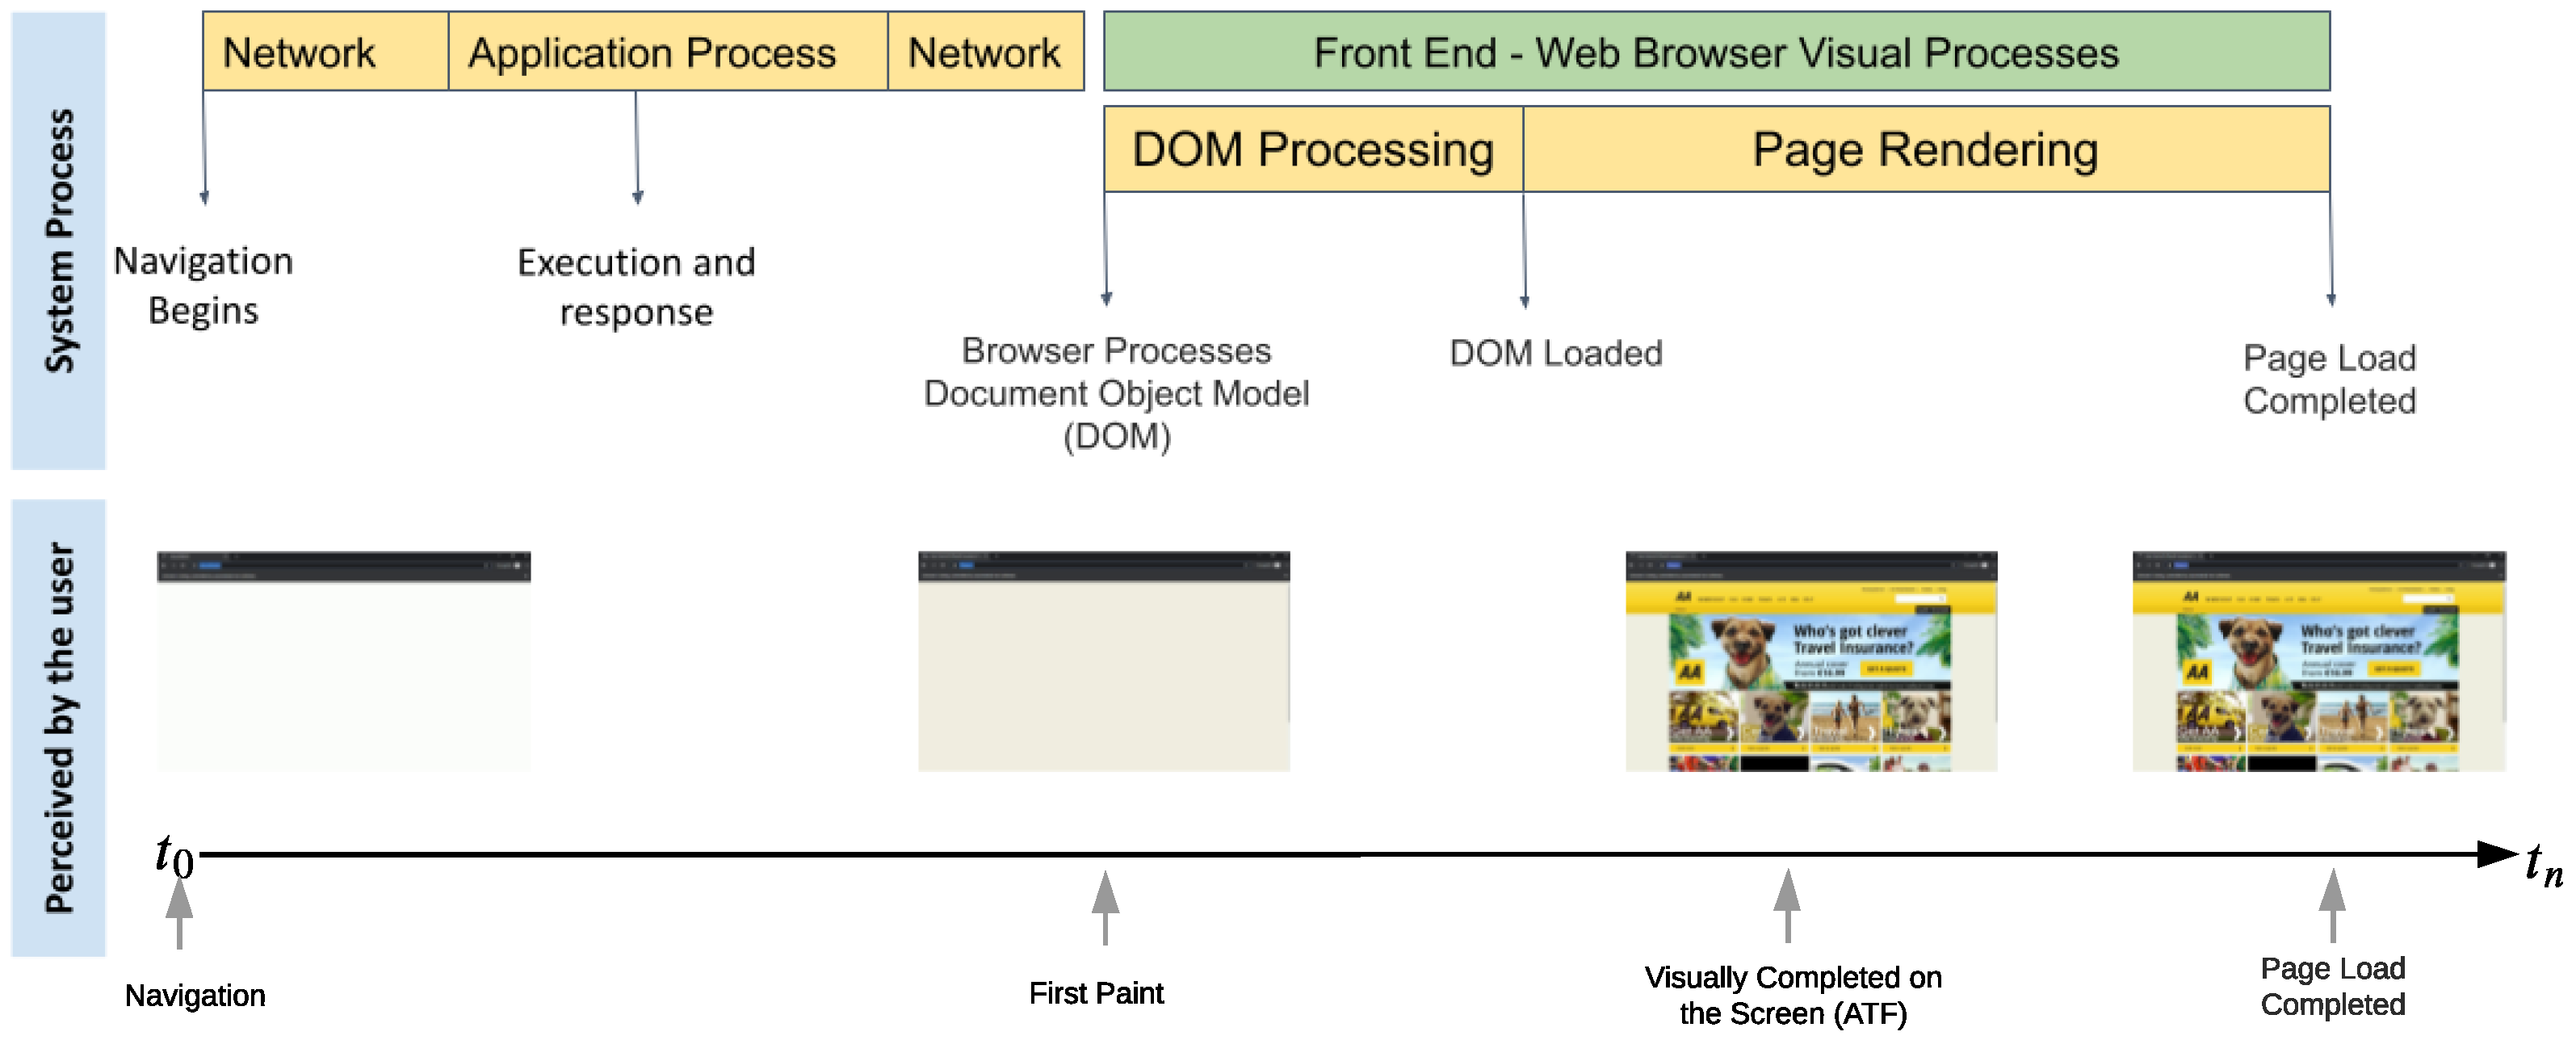
In Figure 1, the loading process of a web page is illustrated. When a user first navigates to a website, a TCP or a UDP connection is made to the web server. The connection will be used for the data transport between the application server and the user’s browser. The web application server processes the request and sends a response back to the browser. The browser then constructs a Document Object Model (DOM) and starts rendering the web page on the user’s screen. Depending on how the web application is designed, the browser may paint the visual elements all at once, or at different points in time. At the time the browser completes painting the current viewport, the user perceives the website as visually complete (ATF time) and may already start interacting with the HTML elements [11]. The browser, however, may still load more visual and non-visual objects until the page gets fully loaded.
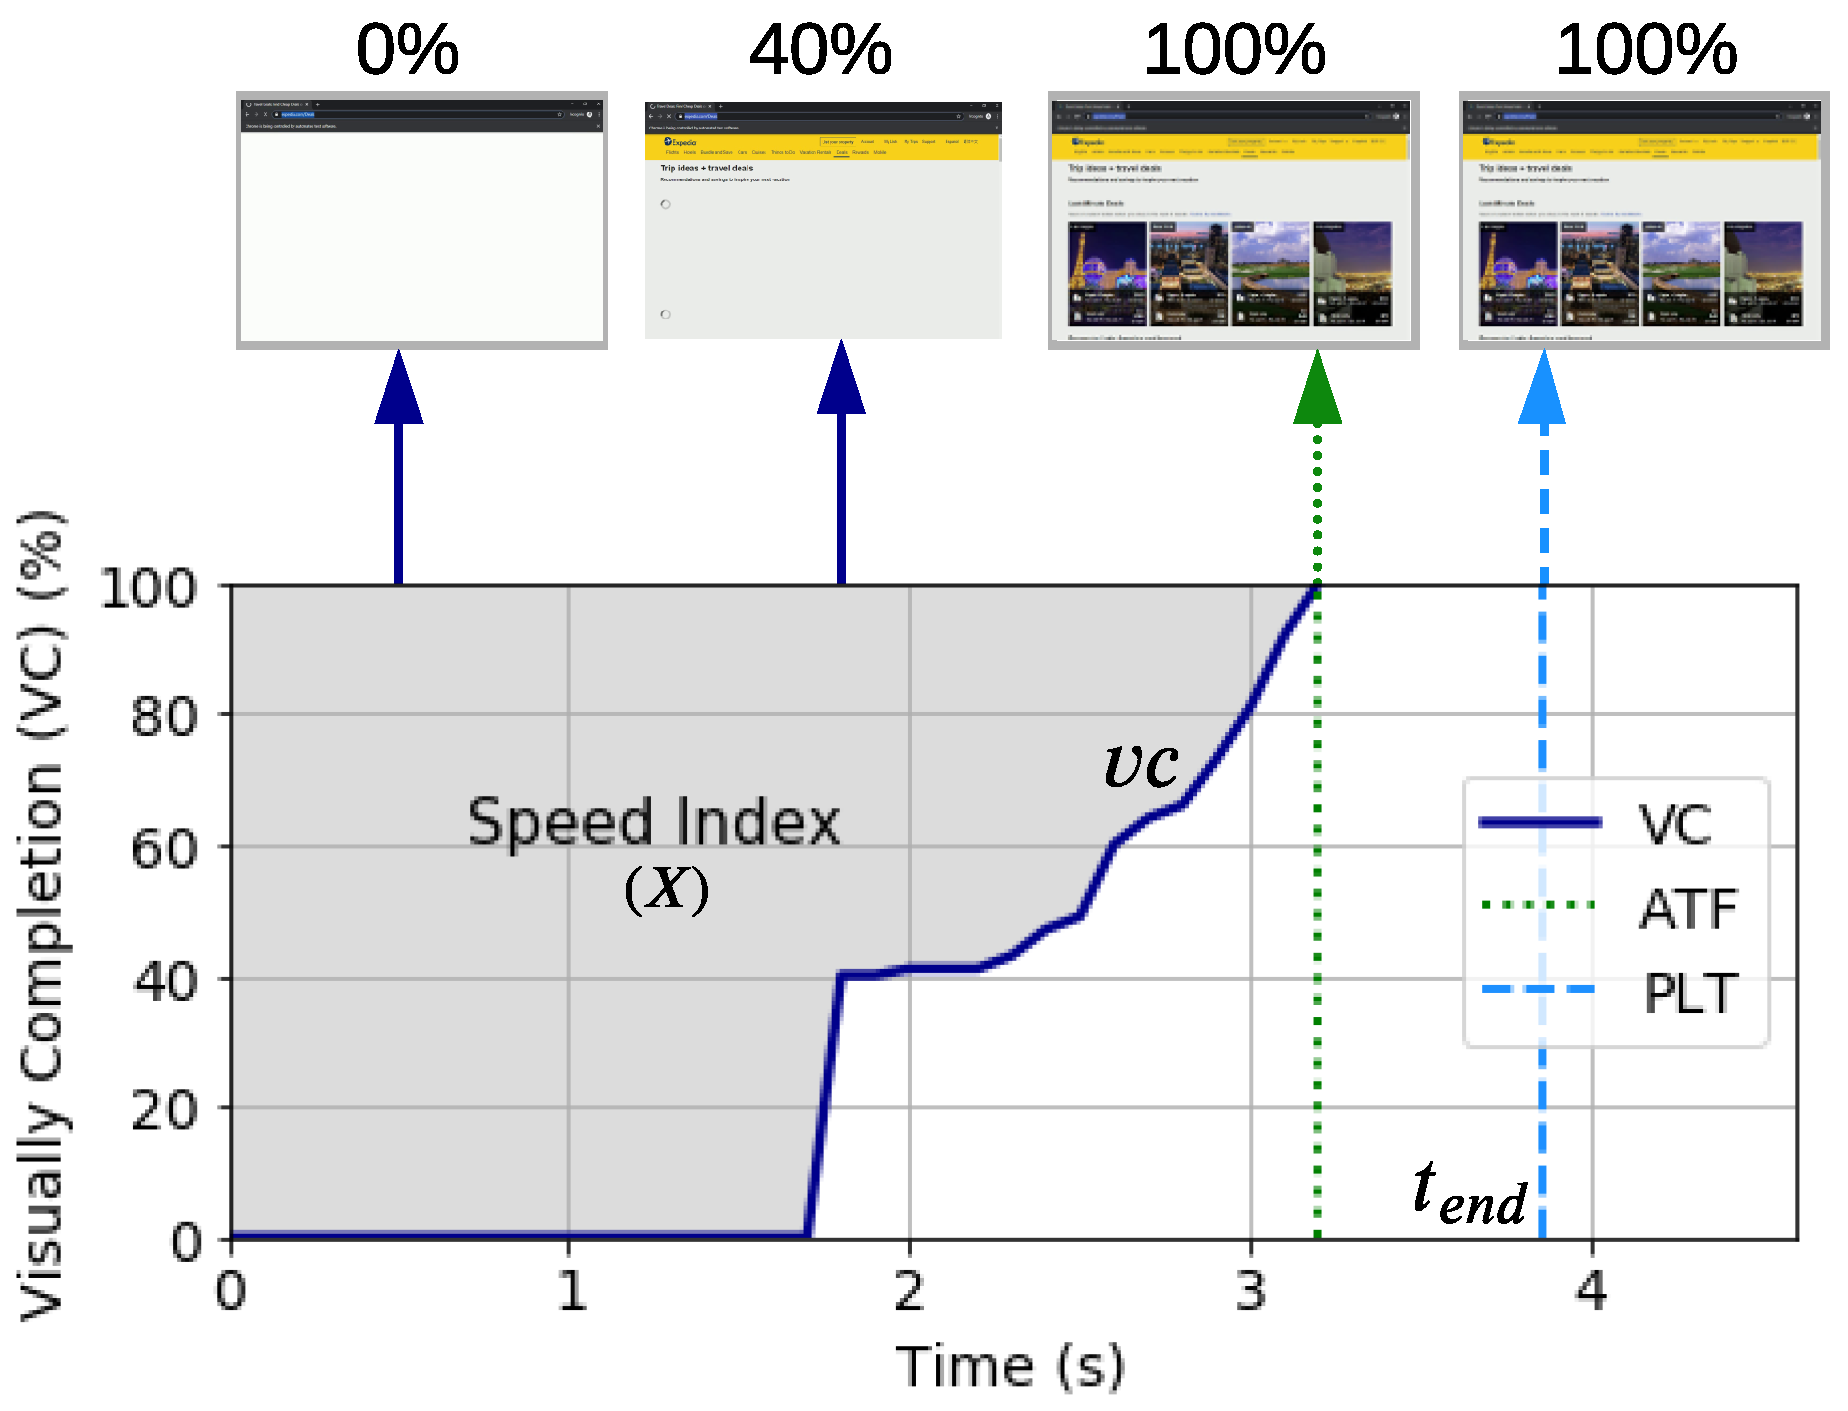
ATF time can be used as an independent KPI, or as an input to time integral metrics for QoE estimation [6,11]. The time integral metrics (e.g., SI) quantify how fast a web page is visually loaded by tracking the visual progress of a web page over time (see the gray area in Figure 2). SI uses the following equation to estimate the visual loading speed of a website:
where X is the estimated speed, is the time the last event occurs, and is the time evolution of the Visual Completion (VC) to reach (as shown in Figure 2, it calculates area above-the-curve). For example, PLT is generally considered as the time, while is the visual completion progress ratio of the web page over time. The VC progress ratio of SI is calculated based on a comparison of Mean Pixel Histogram Difference (MPHD) between the current state of the web page at time t and the state of the page at the PLT. SI uses a series of snapshots (at a rate of 10 frames per second) from the time that the URL is requested until PLT. The frames are analyzed in the same order to determine the VC progress ratio over time. The time that VC progress reaches 100% is referred to as Objective ATF time [12].
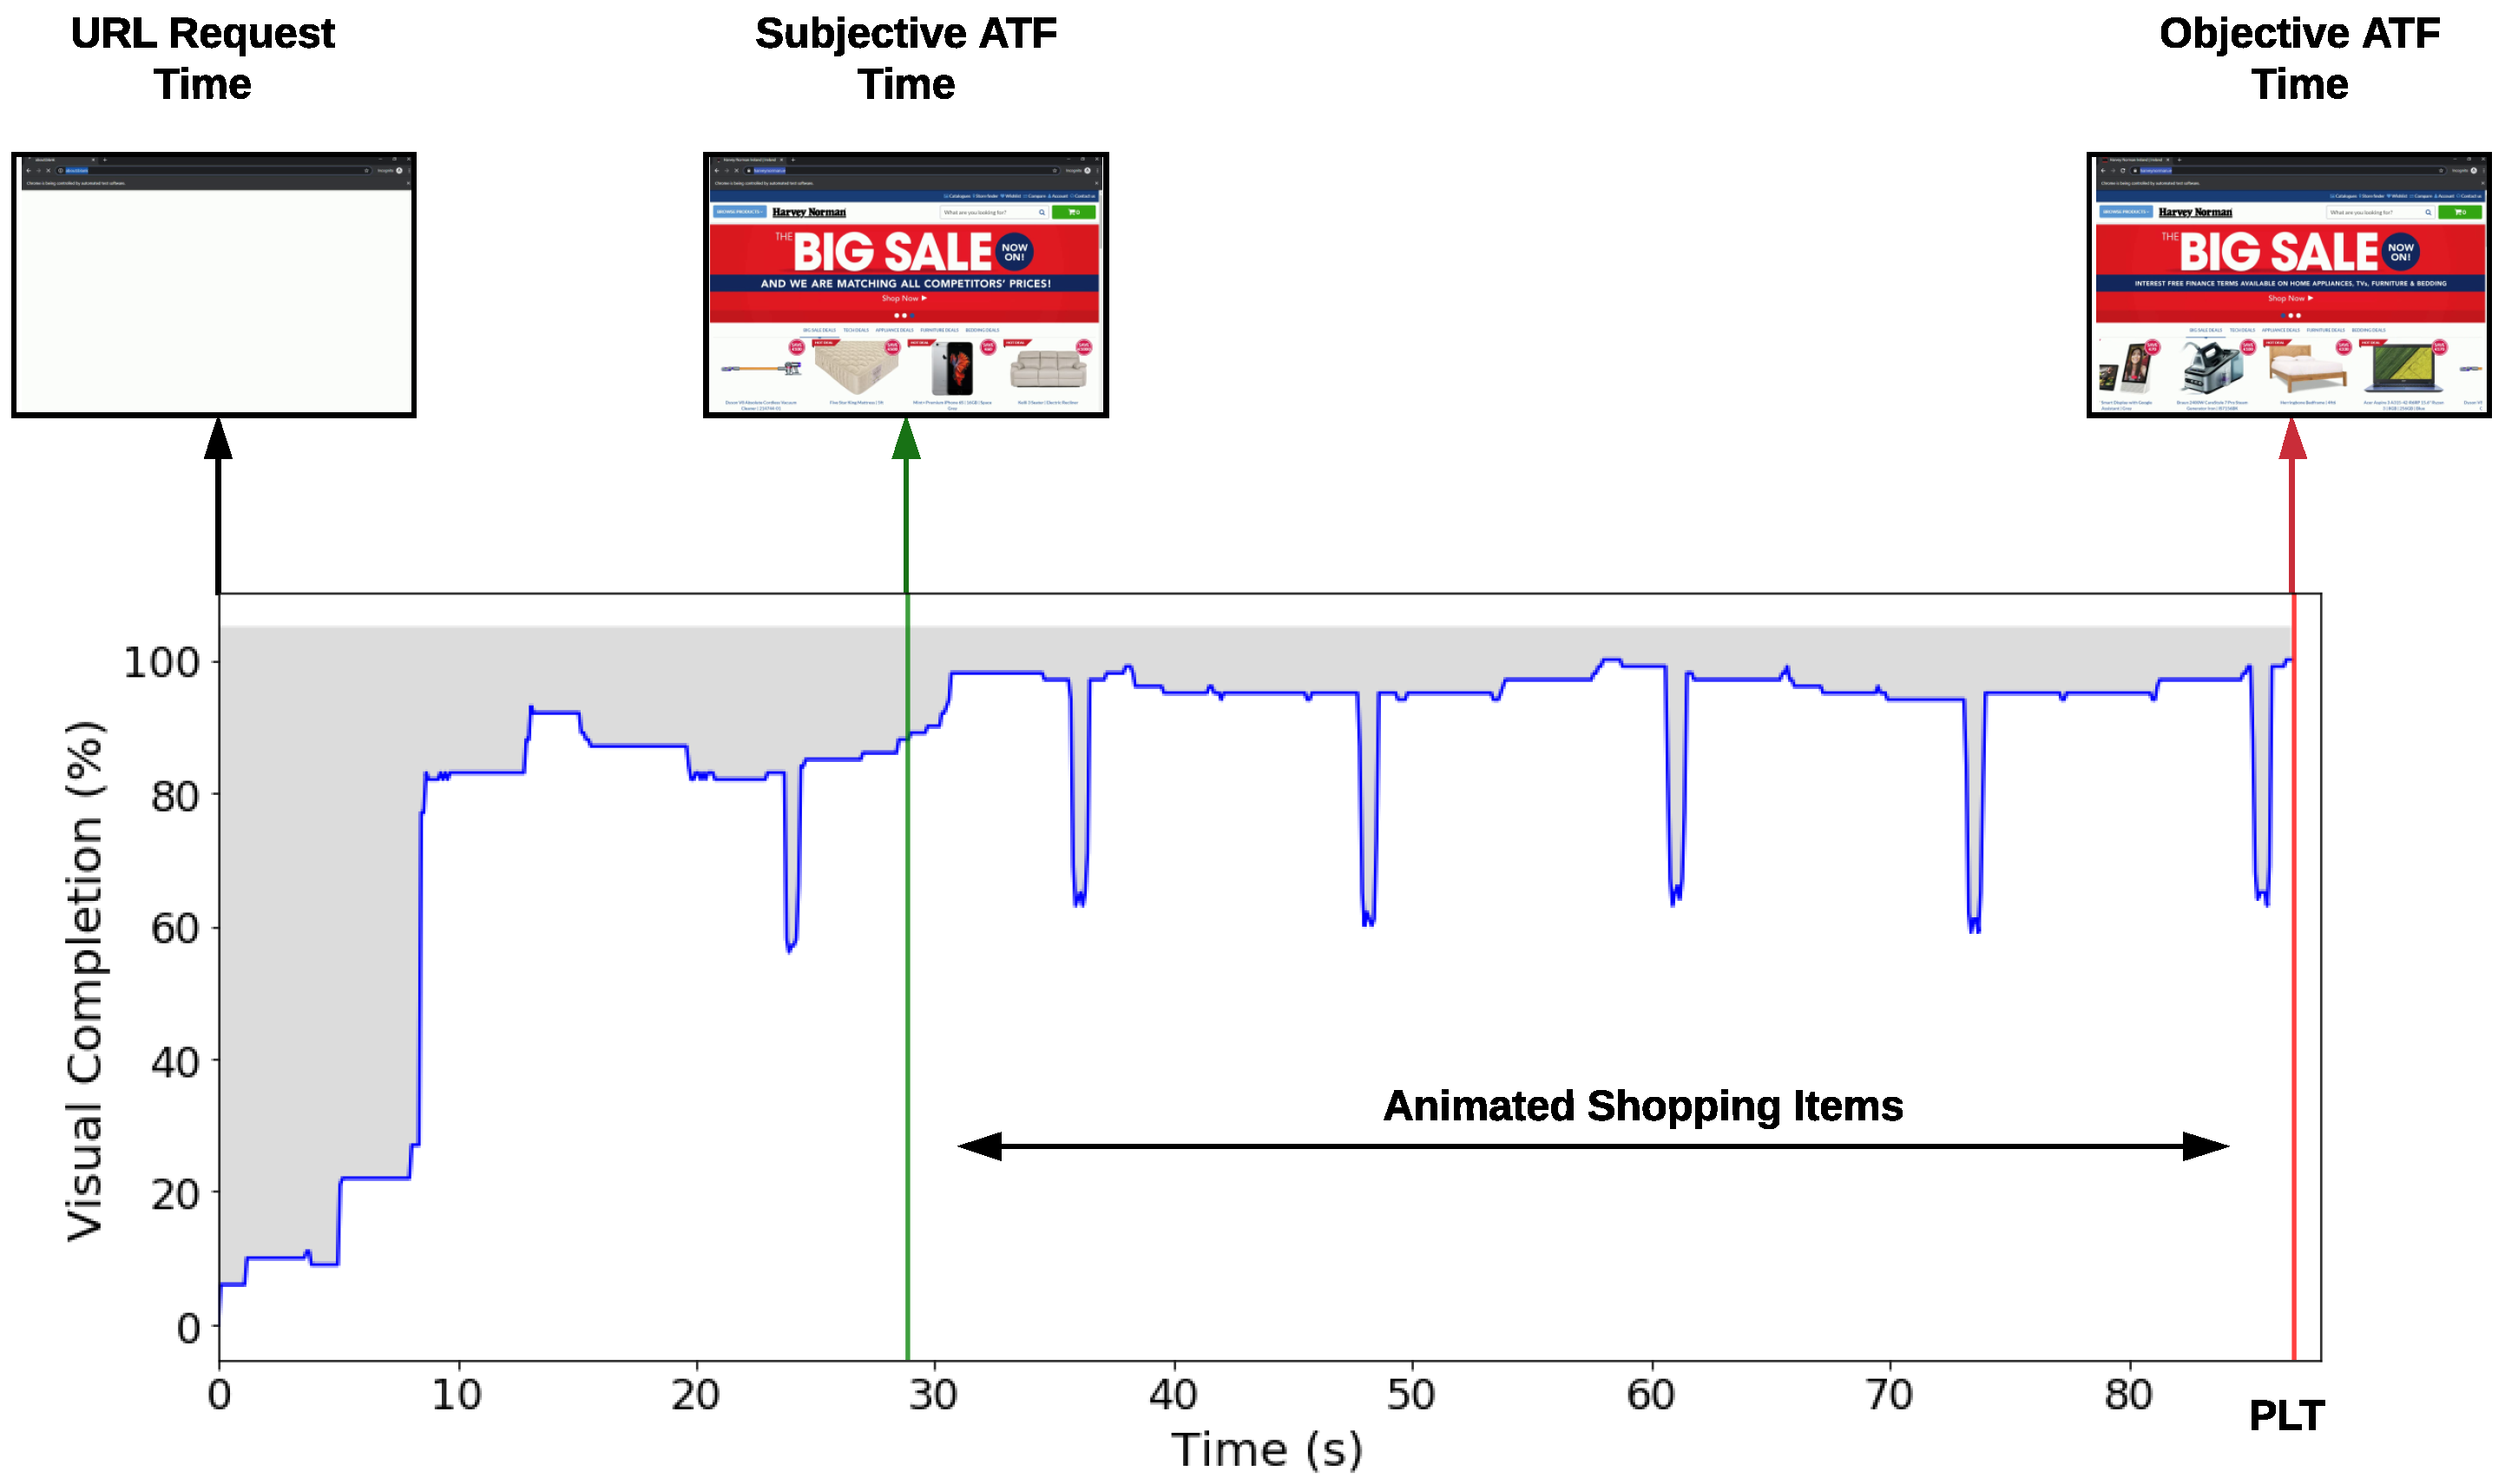
VC time and progress are related factors influencing the ATF time estimation and the result of SI. For instance, if the time increases and the VC progress has not reached 100%, the area above-the-curve also increases (impacting SI estimation). For example, from Figure 3, it can be seen that the existence of animated shopping items increases the above-the-curve area. The ATF time estimation is also prolonged until the animation stops or the page load event occurs (PLT).
Researchers have proposed various heuristic based metrics to estimate ATF time. In Reference [13], the authors have proposed TFVR (Time for Full Visual Rendering) which TFVR estimates ATF time by extracting loading events and rendering timing from the browser HTTP Archive (HAR) file. Similarly, Da Hora et al. [14] proposed Approximated Above-The-Fold (AATF) that estimates ATF time from the browser’s heuristics without requiring image processing. However, to the best of our knowledge, no previous studies have considered the impact of various content types while estimating ATF time.
In Reference [10], we established a range of perceived ATF times and demonstrated that objective ATF is generally overestimating the perceived ATF time. Consequently, for the websites with animated content, the computed SI using the objective ATF prediction, overestimates the speed of loading. A prolonged ATF time can also impact the QoE estimation.
In this study, the Plausibly Complete Time (PCT) metric is proposed, aiming to estimate ATF time with a consistent behavior for the websites with and without animated content. PCT can be used in web QoE estimation models to predict the quality perceived by the end users. PCT uses Structured Similarity Index Measure (SSIM) [15] to infer the difference between the video frames of the web page loading progress. It is technically possible to use SSIM or MSE or PSNR in PCT. However, MSE and PSNR metrics do not reflect the perceptions of the recipient [16]. The next subsection describes how the SSIM algorithm, used in PCT, is applied to infer the difference between video frames of the web browsing loading process.
2.1. Structured Similarity Index Measure
Structured Similarity Index Measure (SSIM) is a standard image quality metric that quantifies the perceptual difference between two images [15]. SSIM has been frequently used in image enhancement algorithms, video quality monitoring and enhancement, and image encoding applications. SSIM is a full reference metric that requires two images from the same scene. The first image is the original image, and the second one is either degraded or different [15].
SSIM between two images, x and y, can be computed as
where and are referring to the sample mean of the x and y, respectively. Similarly, and are the sample standard deviations of x and y, and is the sample correlation coefficient between x and y.
A computed SSIM is bounded between and 1. An SSIM score equal to 1 means the two images, x and y, are identical. An SSIM of less than 1 indicates a perceptual difference between the two images. In this study, SSIM is calculated using a sliding Gaussian window of size pixels which as been shown to be appropriate for images of the resolution used ( pixels) [17,18]. A SSIM quality map matrix is created by moving the sliding window pixel-by-pixel on the image. A total SSIM score is the mean value of the SSIM quality map matrix.
3. Plausibly Complete Time (PCT)
The objective of developing PCT is to have a robust metric that can accurately estimate the perceived ATF time for websites with various content types (i.e., both animated and non-animated content).
PCT is a visual metric that analyzes the video of a web page loading process and determines when the maximum number of paintable pixels are painted at least once on the user’s screen. As a result, if the browser has already painted the maximum number of paintable pixels, an increased loading time and the existence of animated elements will not prolong the PCT estimation. It is hypothesized that PCT forms a high correlation with the perceived ATF time.
3.1. Algorithm
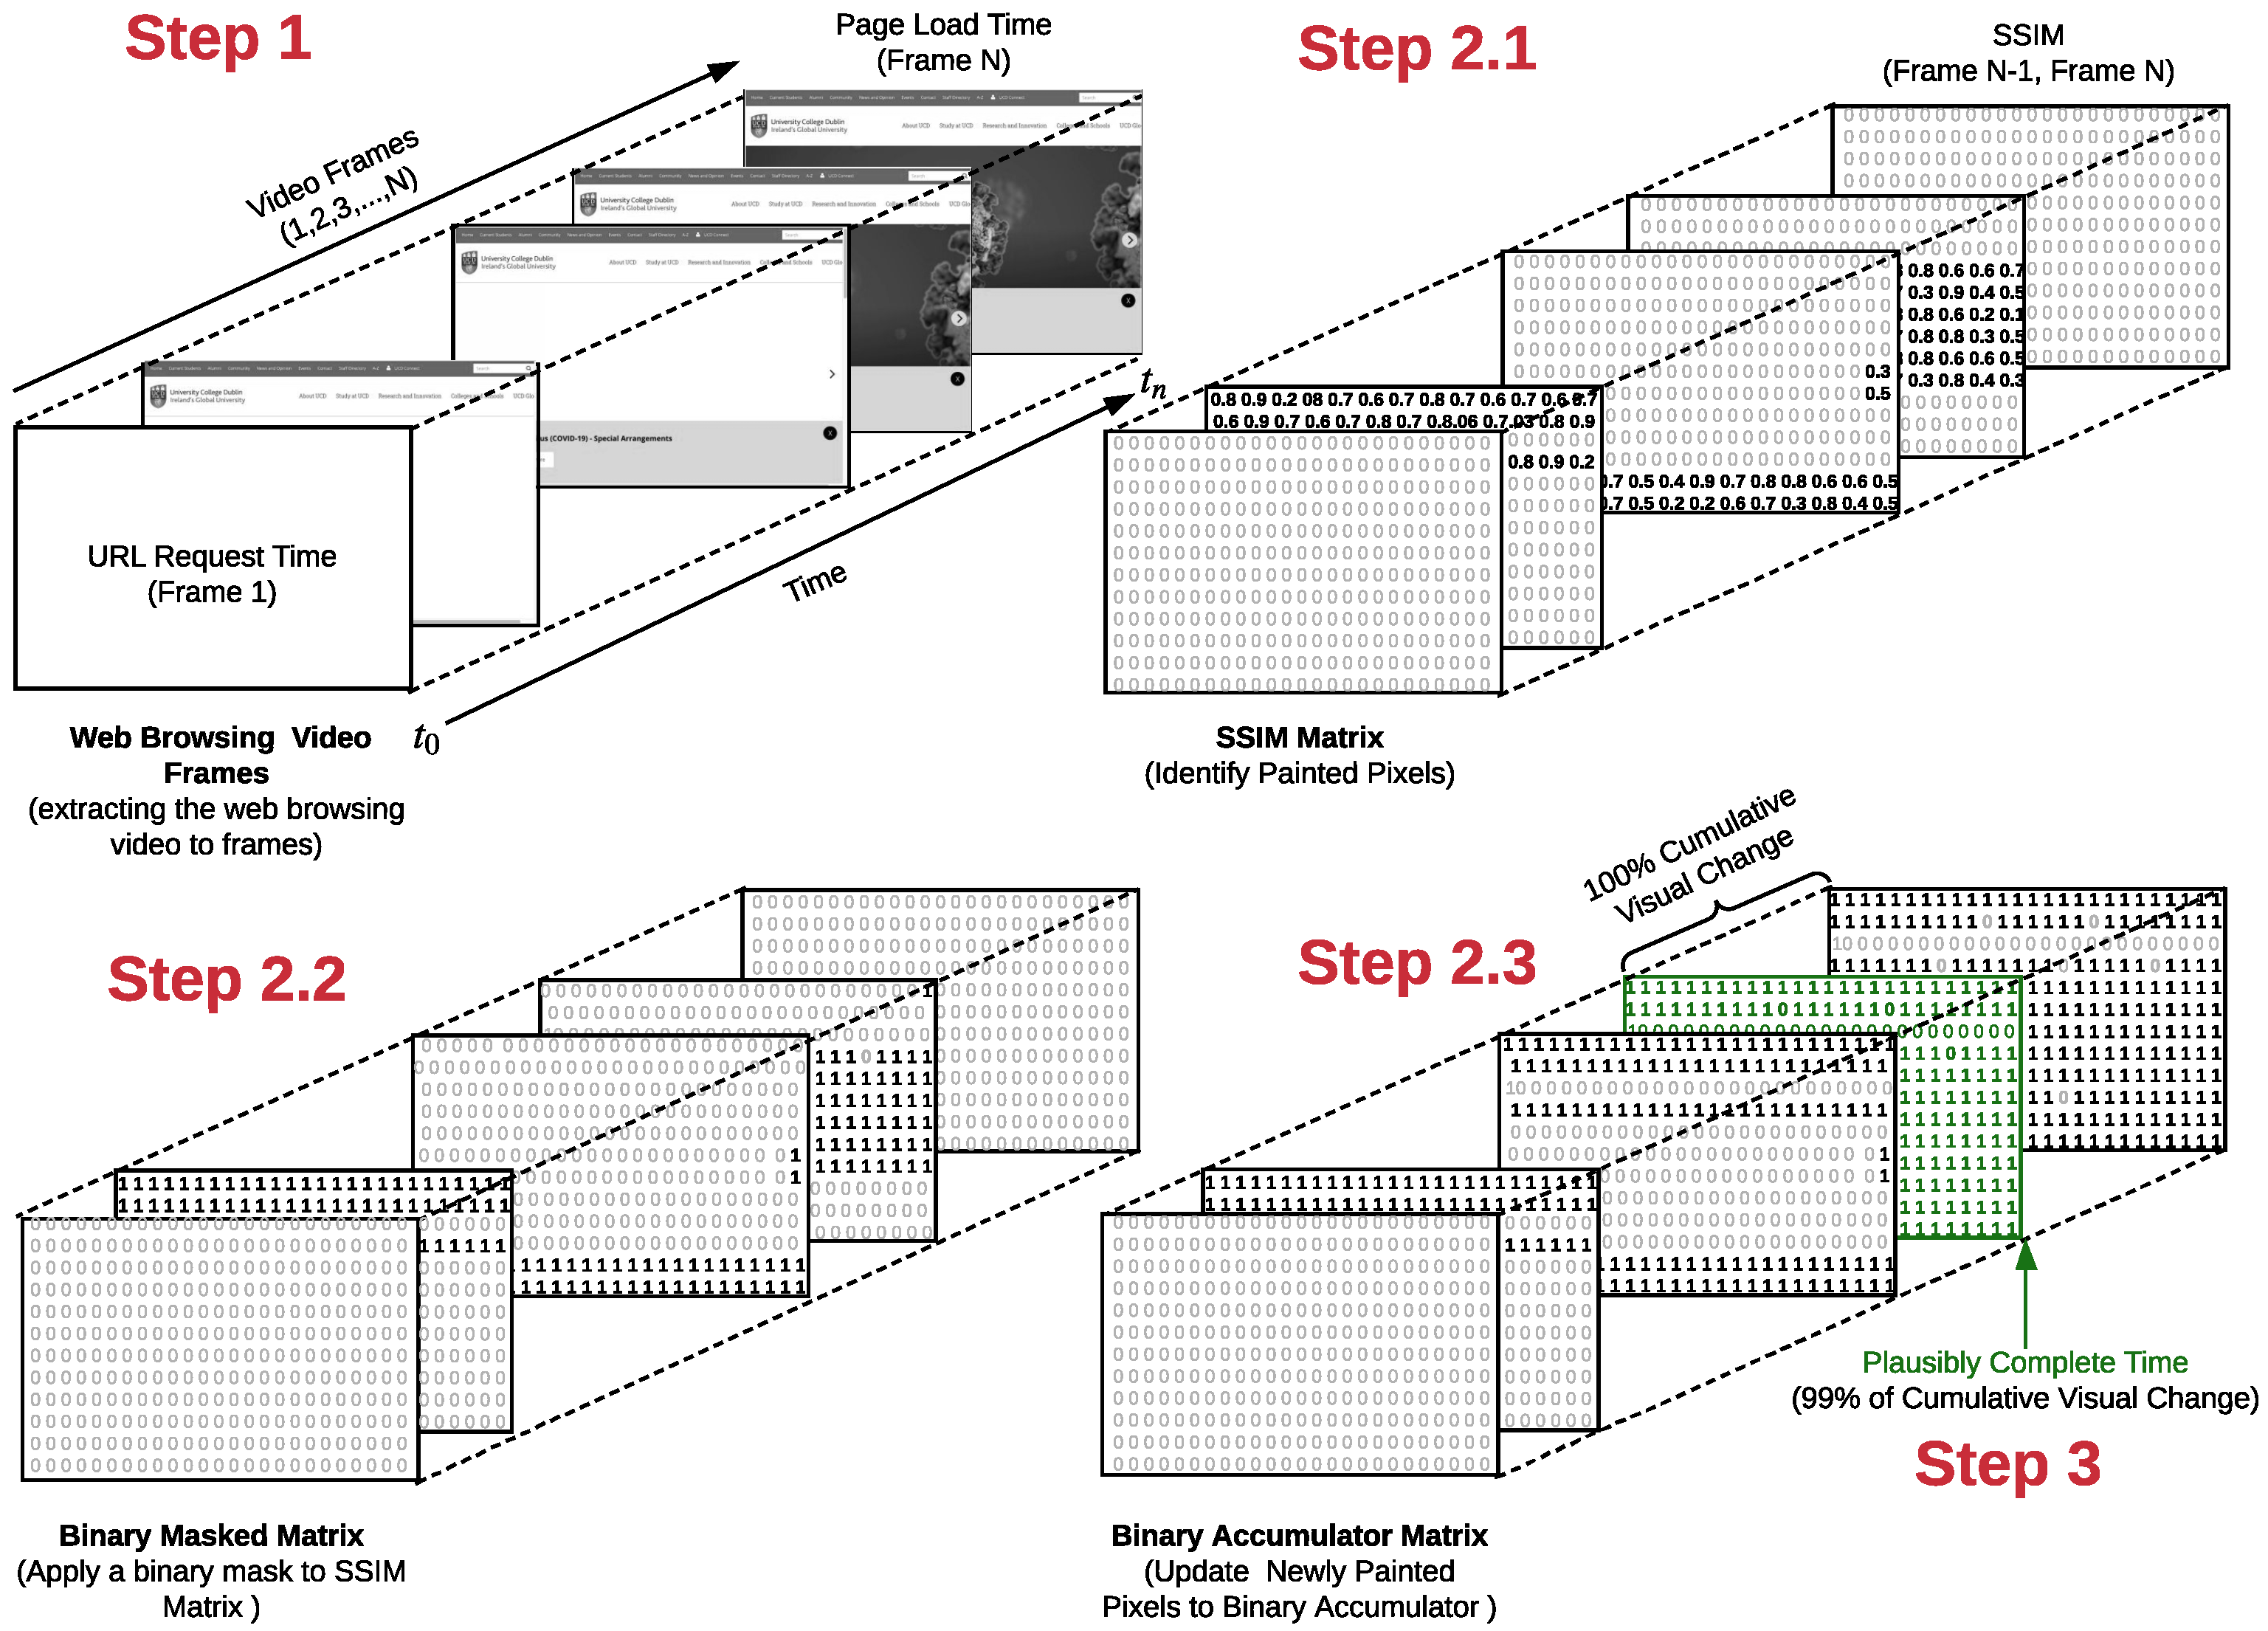
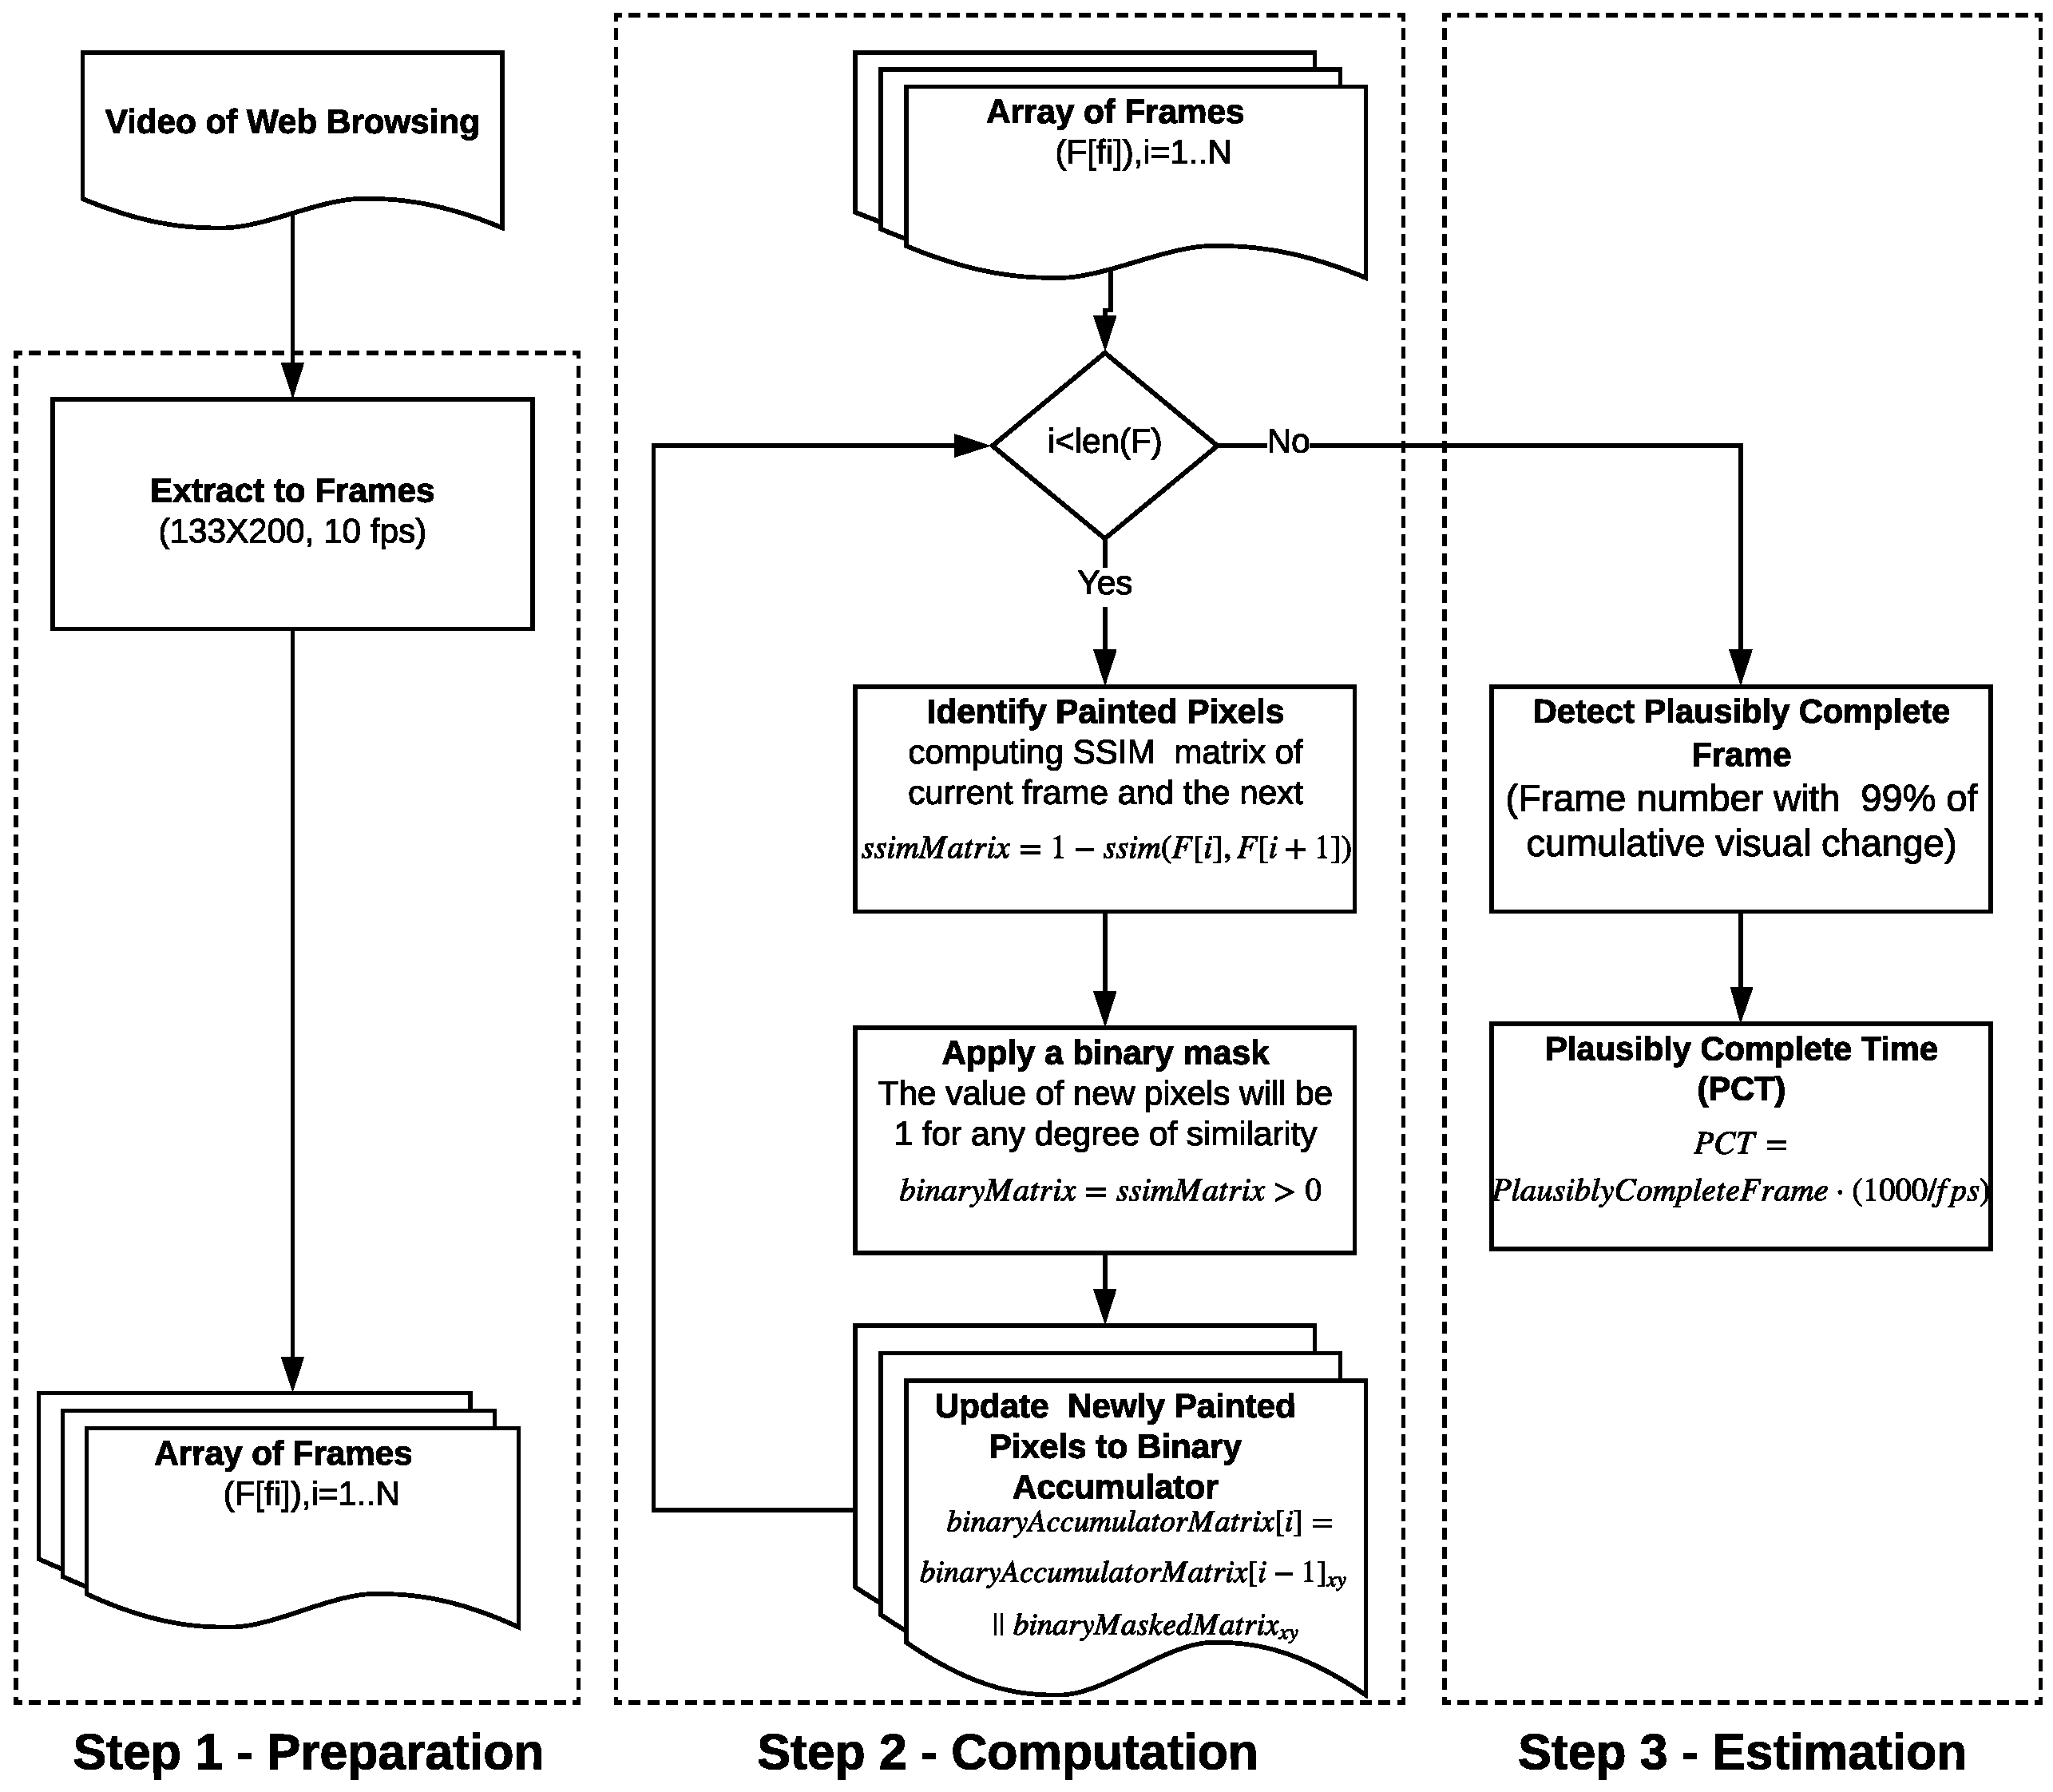
Figure 4 and Figure 5 use an example visualization and a flowchart, respectively, to help explain the PCT algorithm. The computation of PCT is comprised of three concrete steps: preparation, computation, and estimation.
3.1.1. Step 1: Preparation
In the preparation step (step 1 in Figure 4), the video of the web loading process is converted into n number of grayscale video frames (Python OpenCV library is used to record the web loading process in AVI format and convert the videos into multiple frames). The frames are extracted at the rate of 10 frames per second and re-sampled and scaled to pixels. The 100 ms (10 frames per second) is the minimum perceived duration that two stimuli within this range would be perceived as simultaneous [19]. One might also consider a lower or higher frame rate. A lower frame rate facilitates faster visual progress computation. However, it lowers the precision of ATF time estimation, which can squander fast websites’ performance optimization [20]. The higher frame rate improves the accuracy of the metric but it takes longer to estimate the ATF time. For efficient model performance, empirical evaluation was conducted to find the lowest resolution that did not influence the PCT accuracy. From the extracted frames, an array of the frames will be constructed (). For example, for a web page with s, the constructed array of frames includes 50 grayscale images (), where refers to the image of the browser at the URL request time, and represents the final state of the website in the browser at time PLT.
3.1.2. Step 2: Computation
Once the preparation is completed and the array of frames () is formed, the computation step begins by iterating thorough the extracted frames and creating an array of a binary accumulator matrices (see step 2.3 in Figure 4). The binary accumulator matrices are used to keep track of the painted pixels in a cumulative fashion. A binary accumulator matrix () is a two dimensional array, initialized as a matrix of zeros with the same dimension as the extracted images (). Each value of a binary accumulator matrix () corresponds to a pixel. If the corresponding pixel was already painted in the previous frame (), the value of will be 1, and 0 otherwise (step 2.3 in Figure 4).
While iterating through the video frames (), at every iteration(i), the following sub-steps are executed to construct a binary accumulator matrix (see step 2.1–2.3 in Figure 4):
- SSIM quality map matrix () is computed (see step 2.1 in Figure 4) based on the current video frame (i) and the next frame (): . The and video frame share the same dimension (). Each value of the () represents the score of the similarity between the two corresponding pixels of two consecutive images (Section 2.1). As explained in Section 2.1, a score of 1 represents a pixel-wise 100% match, and an SSIM value of less than 1 shows a discrepancy between the two sets of input data.
- By applying a binary mask to the , a binary matrix () is computed to allow the frame of the accumulator matrix to be calculated (see step 2.2 in Figure 4). If the is 1 (100% similarity), the corresponding value of will be 0. For any other value, will be set to 1. As a result, represents the pixels that have been changed between the two video frames, regardless of the degree of similarity.
- Finally, a new binary accumulator matrix () is computed (see step 2.3 in Figure 4). It is achieved by performing a logical OR () between and the (). The computed () represents the number of pixels that have been changed at the current iteration.
3.1.3. Step 3: Estimation
PCT is determined by iterating through the binary accumulator matrices to identify the first index of a binary accumulator matrix (i) that corresponds to 99% of the cumulative visual change (see step 3 in Figure 4). For example, consider 26,600 as the maximum number of paintable pixels (), PCT is a time that corresponds to the first with 26,334 painted pixels (). Therefore, if , PCT will be milliseconds. The 99% threshold is derived based on the evaluation of the algorithm on a subjective data collected in the user study illustrated in Reference [10]. It is technically possible to use a lower value for the cumulative visual change threshold. However, it should be noted that the lower threshold may estimate ATF time too soon and before the users perceive ATF content. For example, for websites with graphical objects and small but essential text blocks, at the 95% cumulative visual change, the graphical objects are visualized. However, the users are still waiting for the text blocks. Weblogs are a common example of the aforementioned cases.
The entire algorithm of PCT can be seen in Algorithm 1. It presents the a high-level implementation of the PCT algorithm using python style pseudo-code syntax (https://github.com/hzjahromi/pct/ (accessed on 12 February 2021)).
| Algorithm 1: Plausibly Complete Time (PCT) |
 |
4. Evaluation
In order to evaluate the robustness of PCT and its relationship with the alternative metrics for estimating ATF time, the data collected in Reference [10] is utilized, and PCT is computed for each test case (21 test cases in total).
The data is used in the following subsections to quantify the effectiveness of PCT across various facets:
- ATF time estimation.
- Its influence on the result of SI for different content types.
- PCT in the wild. The term “in the wild” is used to refer to unseen data collected by other researchers from globally accessible websites, under an undefined network condition and is not a synthetic dataset.
- The effect of using PCT on QoE estimation models.
4.1. PCT and the Estimation of ATF Time
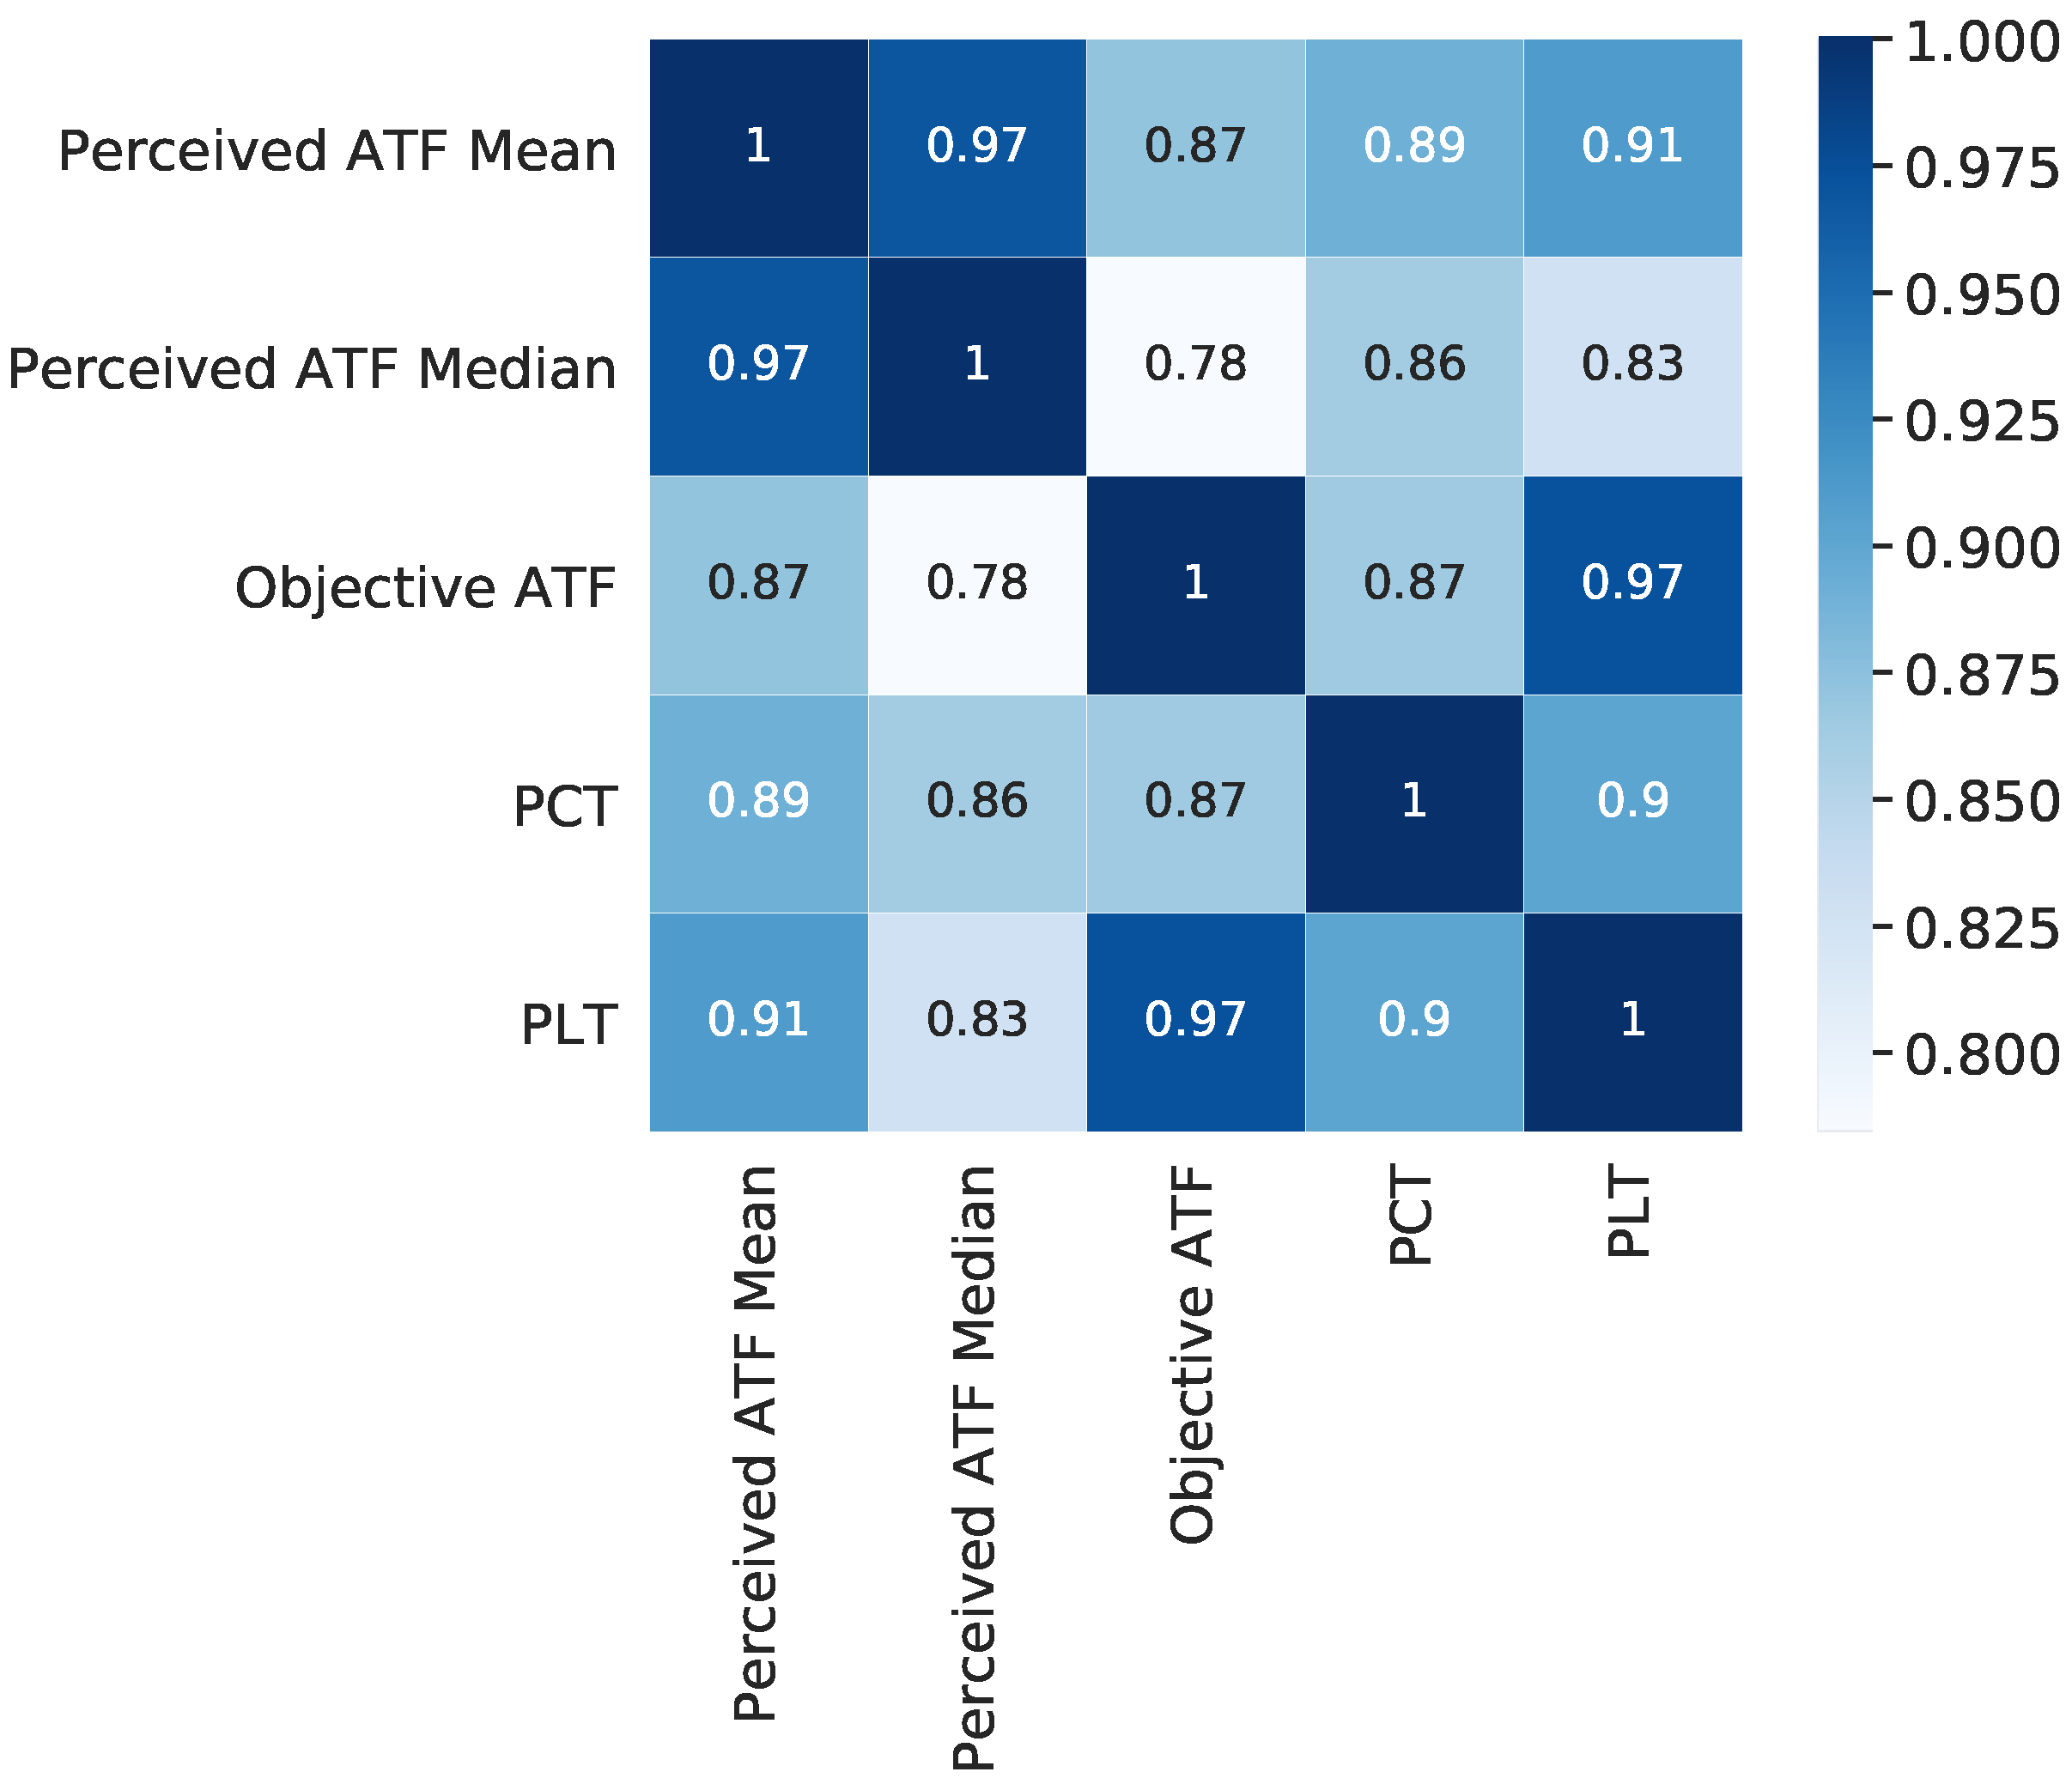
A Spearman Rank-Order Correlation Coefficient (SROCC) analysis (Figure 6) confirms that PCT has a high correlation with the objective ATF, but its correlation with the perceived ATF is stronger than the correlation between the objective ATF and the perceived ATF.
The computed for the objective ATF and mean and median of perceived ATF are and , respectively. The same analysis reveals a stronger correlation between PCT versus mean and median of the perceived ATF ( and , respectively). Whether a web QoE is modeled based on mean or median of perceived ATF, the high correlation of PCT (with both mean and median) with perceived ATF makes PCT a suitable proxy metric for predicting perceived ATF. The correlation between PCT and objective ATF is (). Despite the high correlation between the two metrics, there are still some cases where PCT estimation differs from the objective ATF metric (e.g., websites with animations).
The left subplot of Figure 7 compares PCT with perceived ATF. It can be seen that, for the majority of the cases, ATF estimation of PCT is close to the mean ATF time reported by the users, i.e., the perceived ATF time is similar to the estimated ATF time. However, the middle subplot shows the objective ATF overestimates the perceived ATF time. Root Mean Square Error (RMSE) is used to measure the performance of the metrics. The computed based on all test cases is lower for PCT () and higher for the objective ATF ().
From the middle subplot, one can also see that, while the distance between two variables increases as the load time increases, this trend is not always true for PCT (left subplot). In fact, PCT stays close to the diagonal line and shows a tight positive linear correlation with the perceived ATF, even when the load time increases (see the orange × marker on the left subplot for ).
The right subplot of Figure 7 directly compares PCT with objective ATF. While PCT and the objective ATF have some degree of agreement and positive linear correlation on ATF estimation (see the markers on the diagonal line), disagreement can also be seen for a few websites without animations and the majority of the websites with animated content (see the × markers).
The result illustrates that PCT provides a robust estimation of ATF for the wide range of network conditions and content types tests. PCT provides ATF estimation for animated content without compromising performance for other content.
4.2. The Influence of PCT on SpeedIndex (SI)
It has been illustrated that SI may not estimate an accurate loading speed while using objective ATF time for website with animations (see the Introduction section). In this section, PCT is integrated with SI and demonstrates how PCT can improve the robustness of SI for websites with and without animations.
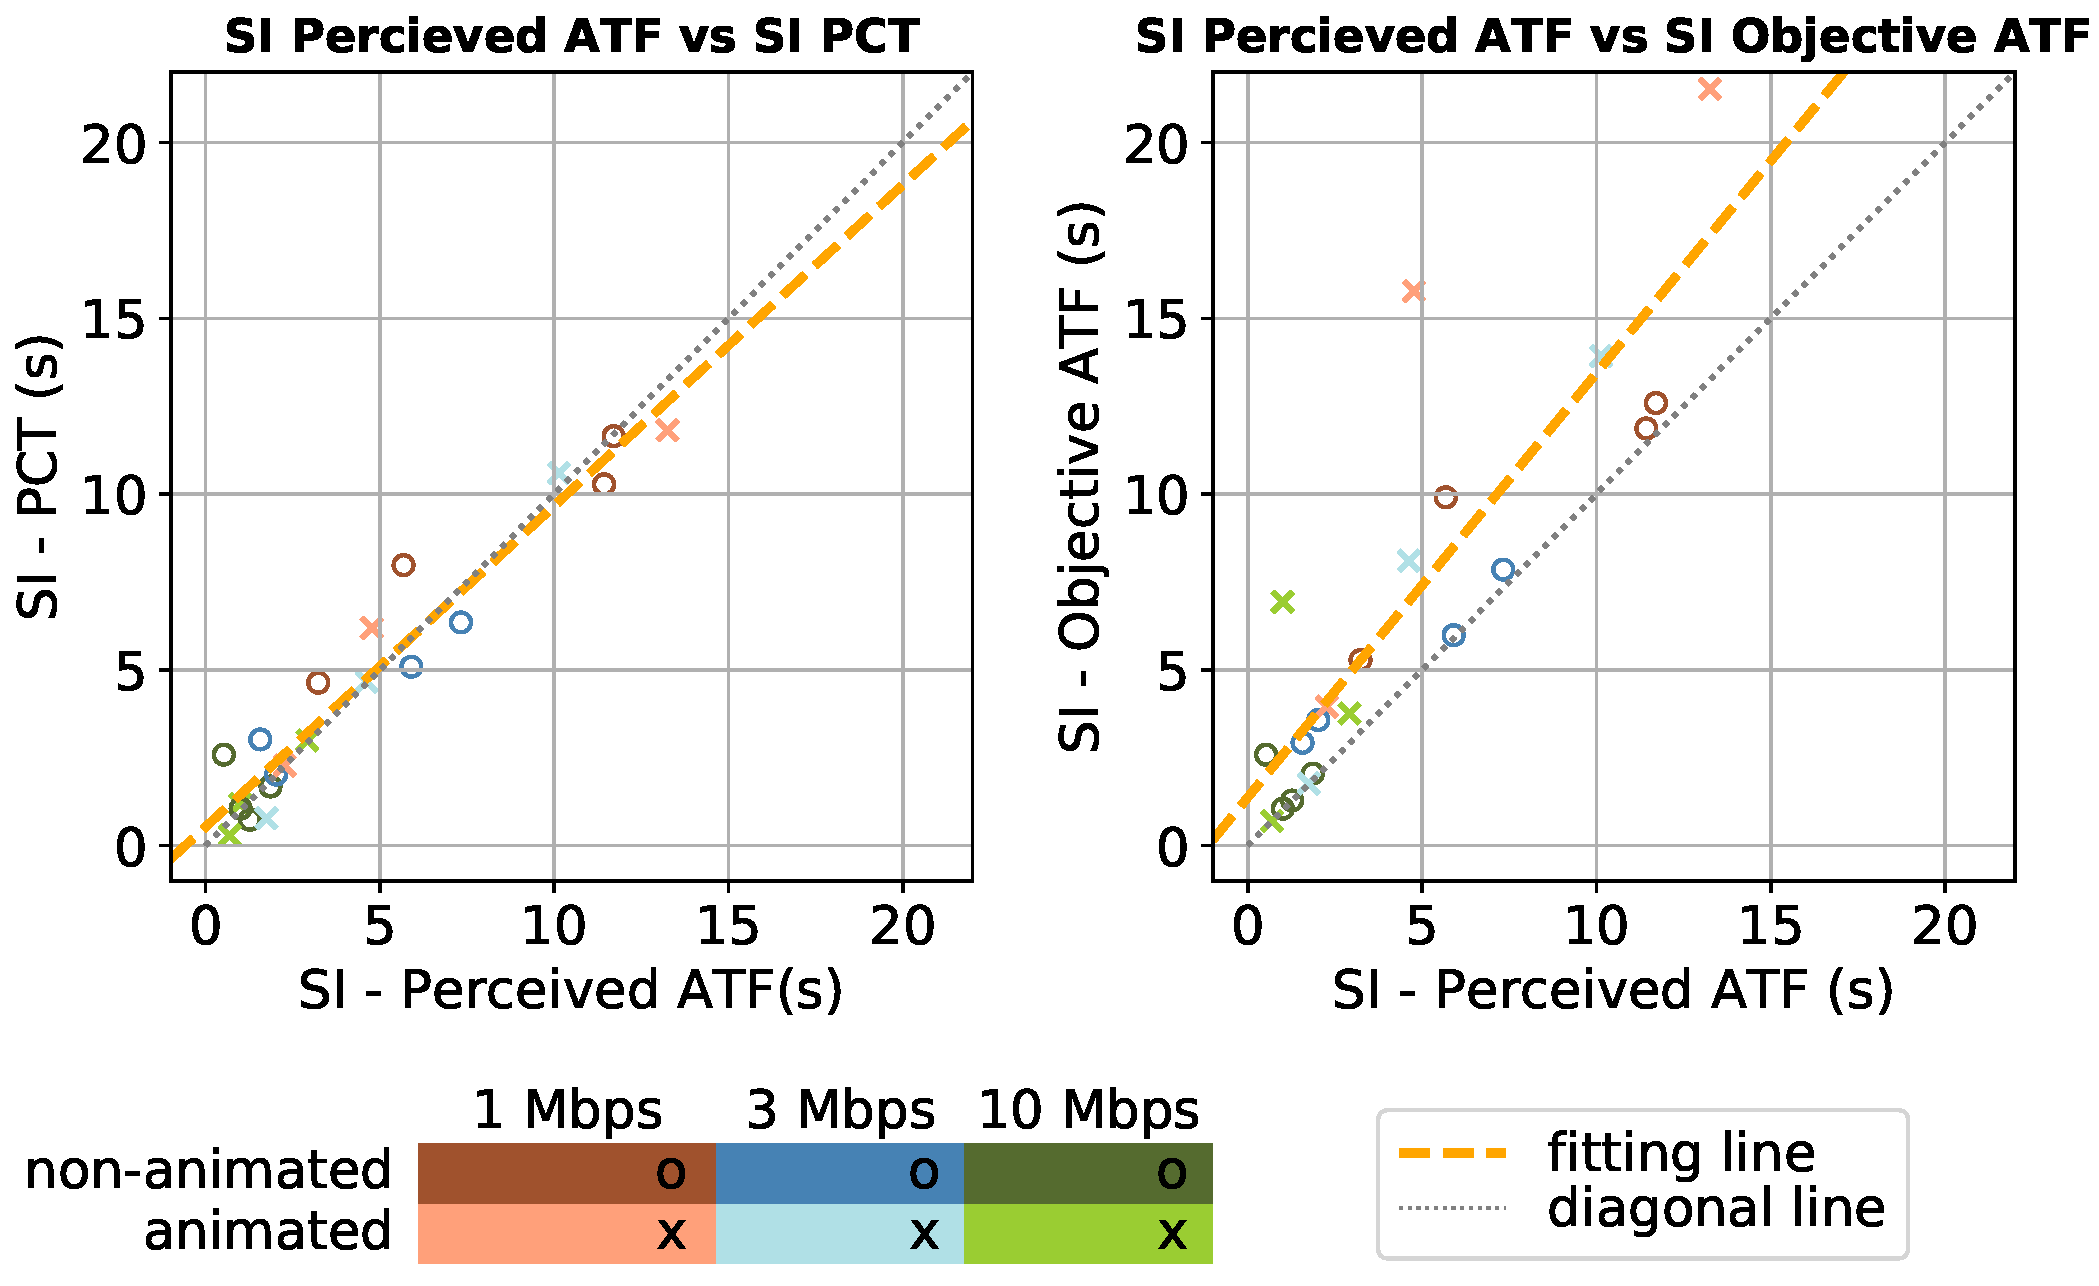
Figure 8 presents a comparison of SI computed using perceived ATF against the objective metrics. The data is plotted with different shapes representing the content (animated/non-animated) and colors to represent the network speed. For most network conditions and page types tested, the computed SI using PCT and perceived ATF yield similar results. This can been seen by the large number of test points on the diagonal line of the left subplot of Figure 8. However, for websites with animated contents, marked with x markers in the right subplot of Figure 8, a wider distribution of SI is computed using the objective ATF. In most cases, SI is overestimating the speed of loading for websites with animated contents. While the overestimation of SI using objective ATF for the websites with and without animated content is more apparent for the lower bandwidth levels (3 Mbps and 1 Mbps), SI computed using PCT has a more consistent behavior for different content types and bandwidth levels (see the regression line nearly aligned with the diagonal line).
The coefficient of determination analysis (known as ”R-squared”) is used to quantify how close the SI PCT and SI perceived ATF time are to the fitted regression line. The computed R-squared is 0.93, meaning that 93% of the variation in SI computed using perceived ATF can be explained by the SI computed based on PCT. A similar analysis on the SI objective ATF and perceived ATF returns an R-squared of 0.74. The higher R-squared value for the SI computed using PCT shows that the known issue of the SI overestimation of SI was seen when animated contents exists is significantly reduced [10].
Correlation analysis reveals a stronger relationship between SI PCT and SI perceived ATF time () versus SI objective ATF and SI perceived ATF ().
4.3. Impact of PCT on QoE Estimation
To investigate how PCT impacts the robustness of QoE estimation models, we used IQX and WQL (Waiting time and its QoE evaluation on a linear ACR scale is Logarithmic) web QoE models. The IQX and WQL are two parametric web QoE models which can be used to quantify the link between perceived user QoE and waiting time for a web page loading. The IQX model is a generic QoE model where QoE and technical QoS metrics are correlated through an exponential relationship [7]. The IQX model uses the following equation:
where t is the waiting time measured by a time instant or time integral metric and , and and are empirically derived constants. The constants are tuned in accordance with the context (i.e., Web, VOIP, Video). The authors illustrate that when the current level of QoE is high, a small variation in the QoS is perceptually noticeable, thus yielding to an exponential relationship between QoE and waiting time.
Egger et al. [8] proposed a logarithmic web QoE estimation model in accordance with the Weber-Fechner law [21]. Their proposed web QoE model is derived from a hypothesis which assumes the relationship between Waiting time and its QoE evaluation on a linear ACR scale is Logarithmic (WQL). The authors used the following fitting function and validated the WQL hypothesis:
where t refers to the waiting time measured by a time instant or time integral metric, and a and b are derived by minimizing the least square errors between the fitting function and the Mean Opinion Score (MOS) values.
The constants from IQX and WQL models fitting curves (where MOS is estimated based on ATF time) were taken from a study by da Hora et al. [6]. The constants of the fitting curves are then used to compute corresponding MOS values for a given PCT time (a measure for ATF). Please note that we have assumed that the result of Reference [6]’s study is generalizable and can be used to estimate QoE in this research.
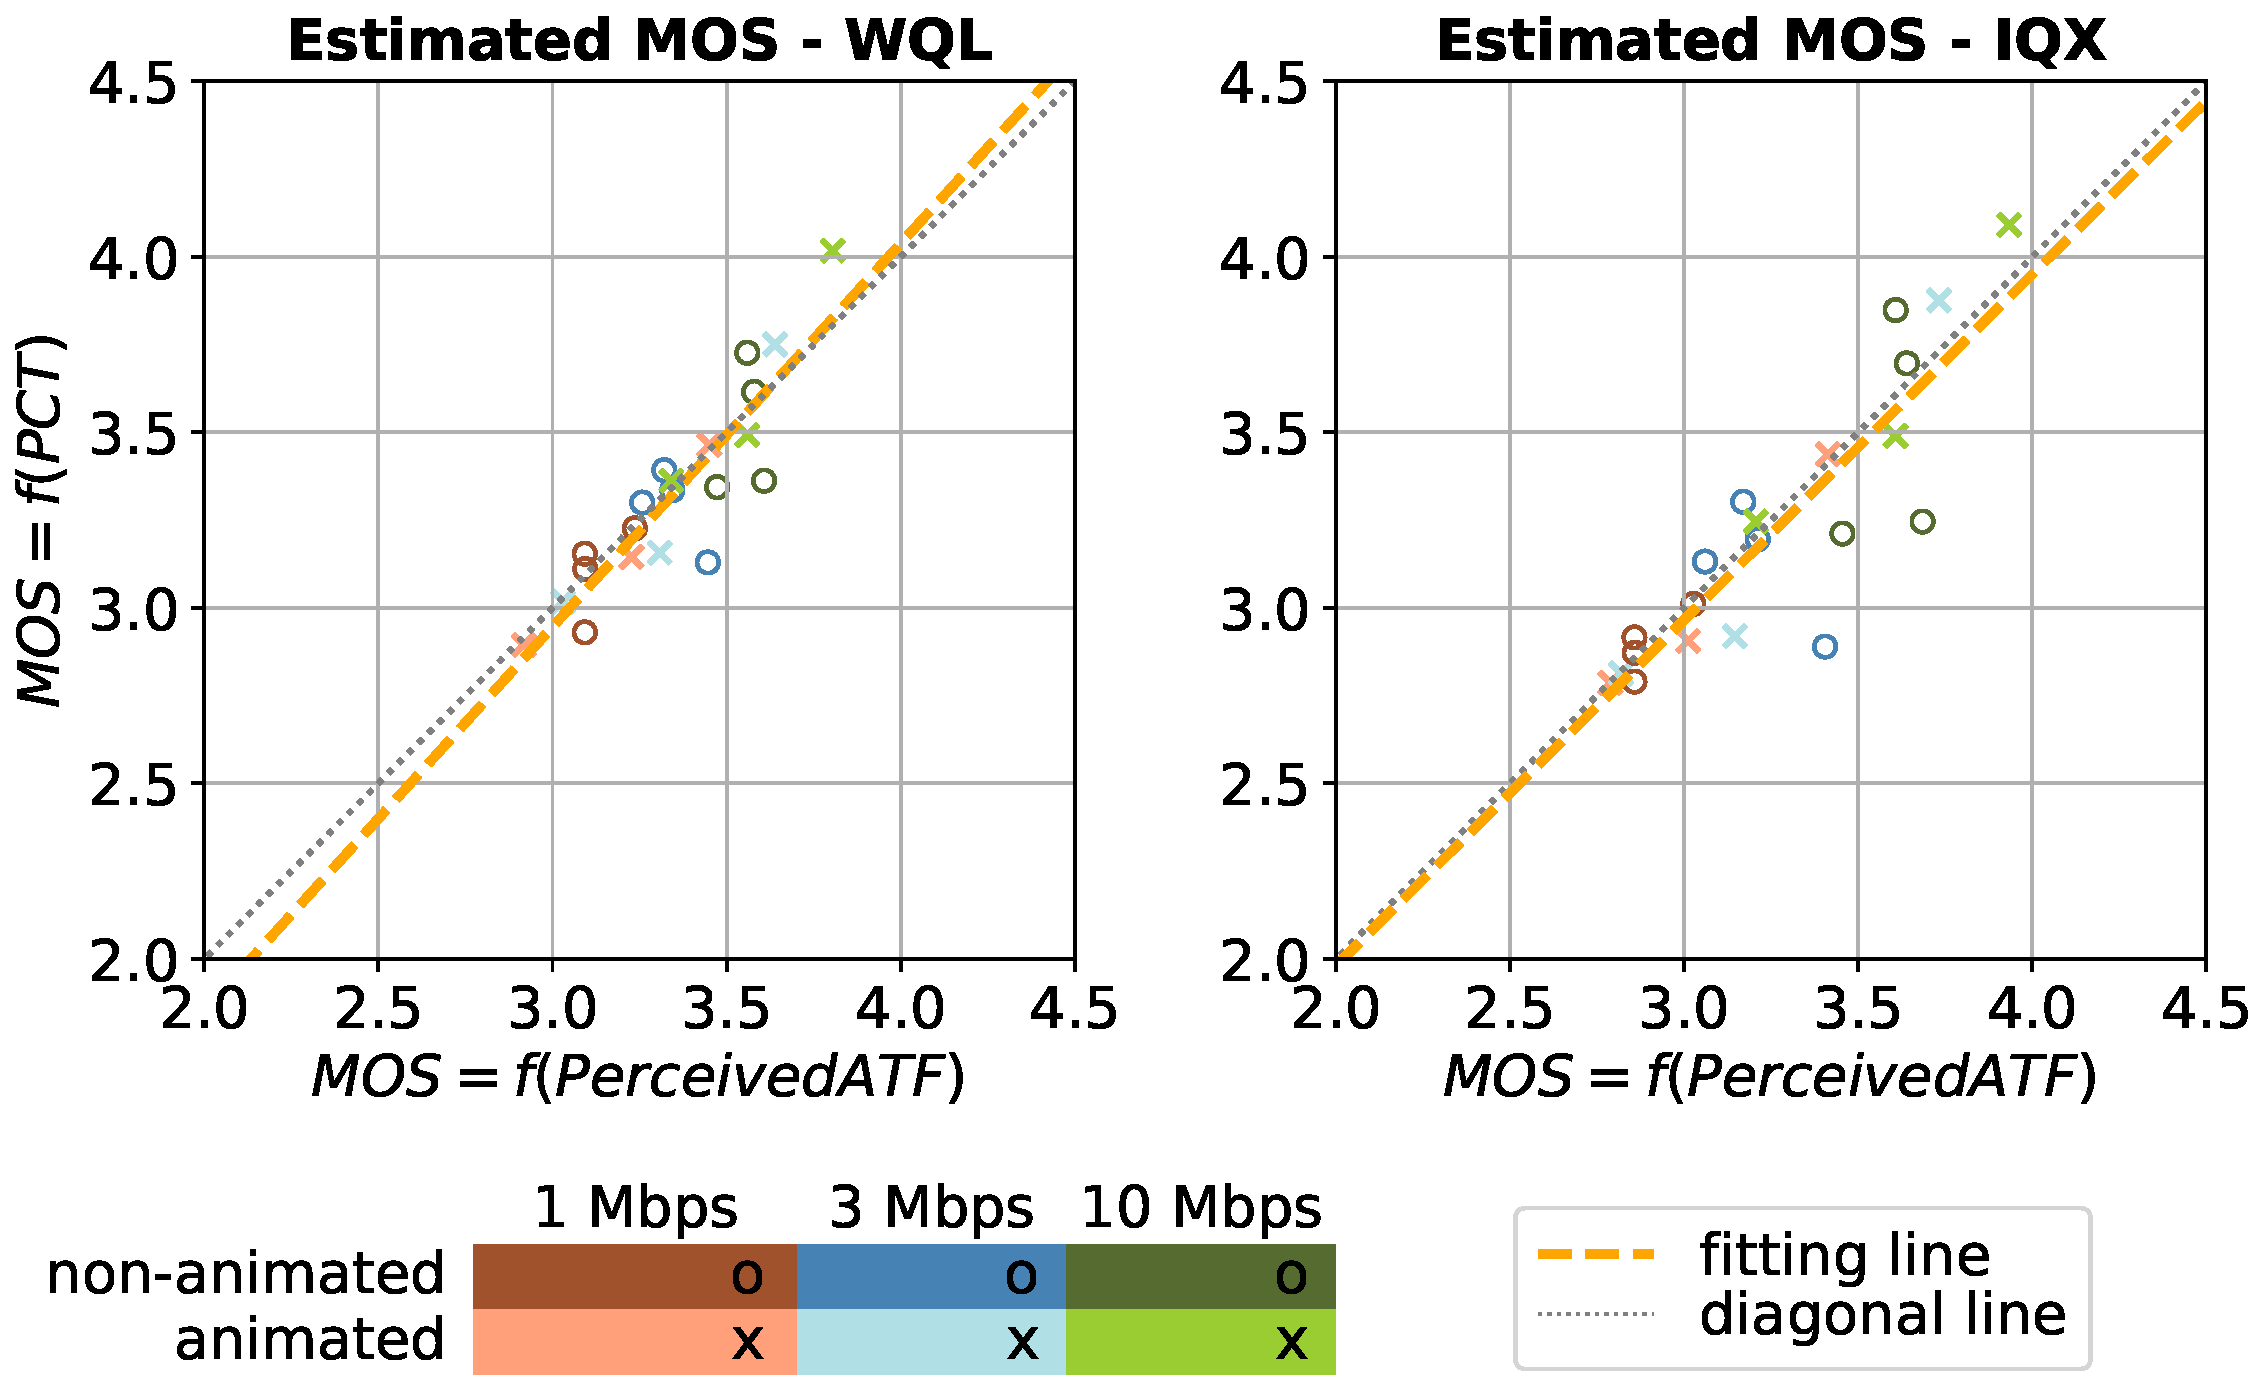
In our previous study [10], a similar analysis for both WQL and IQX using objective ATF metric illustrated that both models are generally underestimating the perceived quality using objective ATF with R-squared of 0.76 and 0.66, respectively. Using PCT as a measure for ATF in the QoE models reduces the underestimation of both IQX and WQL. In both cases, the estimated MOS using PCT is closer to the estimated MOS using perceived ATF. For example, in Figure 9, the majority of MOS estimations using PCT and perceived ATF are close to the diagonal line, which represents a tight positive correlation between them. Moreover, the MOS estimation using IQX shows a lower distance between the two estimations (using PCT and perceived ATF). The computed R-squared is for WQL and IQX are 0.79 and 0.76, respectively. It can be seen that, while the R-squared for WQL using PCT and objective ATF stayed the same (due to the logarithmic nature), the R-squared for IQX, which is an exponential model, is improved by 0.10.
It is acknowledged that, in order to comprehensively demonstrate the influence of PCT on WQL/IQX, an end to end subjective test evaluation would be valuable. However, it is presented here with constants taken from another study [6] to illustrate how PCT can improve speed metrics, like SI, and as a component to improve QoE estimation models.
4.4. PCT in the Wild
To investigate the effectiveness of PCT in the wild, a publicly available dataset of videos of web browsing is used. The dataset includes 83 videos for a range of websites from various content categories. For each website, PCT, Objective ATF, and SI are computed.
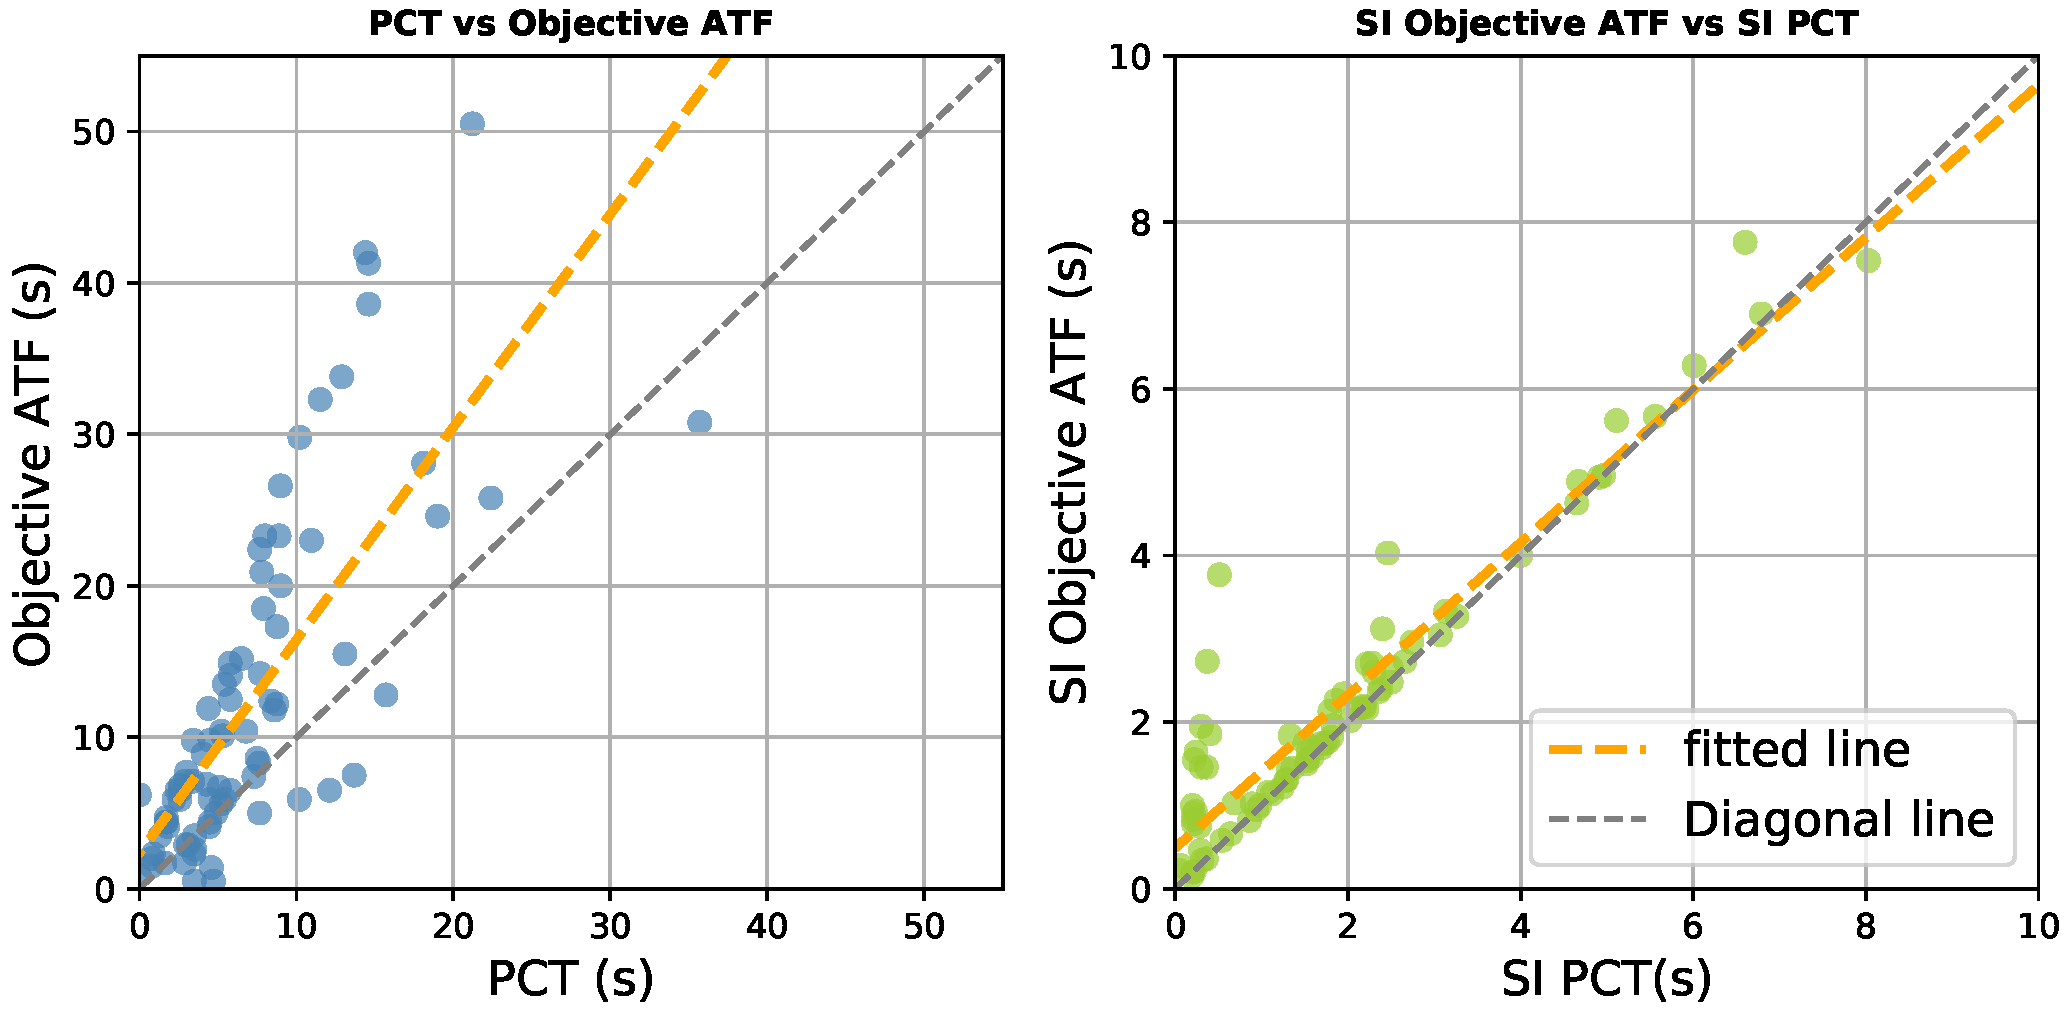
The left subplot of Figure 10 illustrates the relationship between objective ATF (y-axis) and PCT (x-axis). For the majority of the test cases, the estimated ATF time using objective ATF is higher than the corresponding objective ATF computed using PCT. To quantify this, a R-squared of 0.55 is computed. The computed R-squared indicates that PCT is only explaining 55% of the variation in objective ATF. Despite the fact that both metrics are trying to estimate ATF time, PCT and objective ATF are quite different in estimating ATF time.
To explore the impact of ATF estimation using objective ATF and PCT, computed SIs are visualized in the right subplot of Figure 10. The x-axis shows SI computed using PCT and y-axis shows SI computed using objective ATF. Except in some cases, both variations of SI yield to a similar result with a computed R-squared of 0.88.
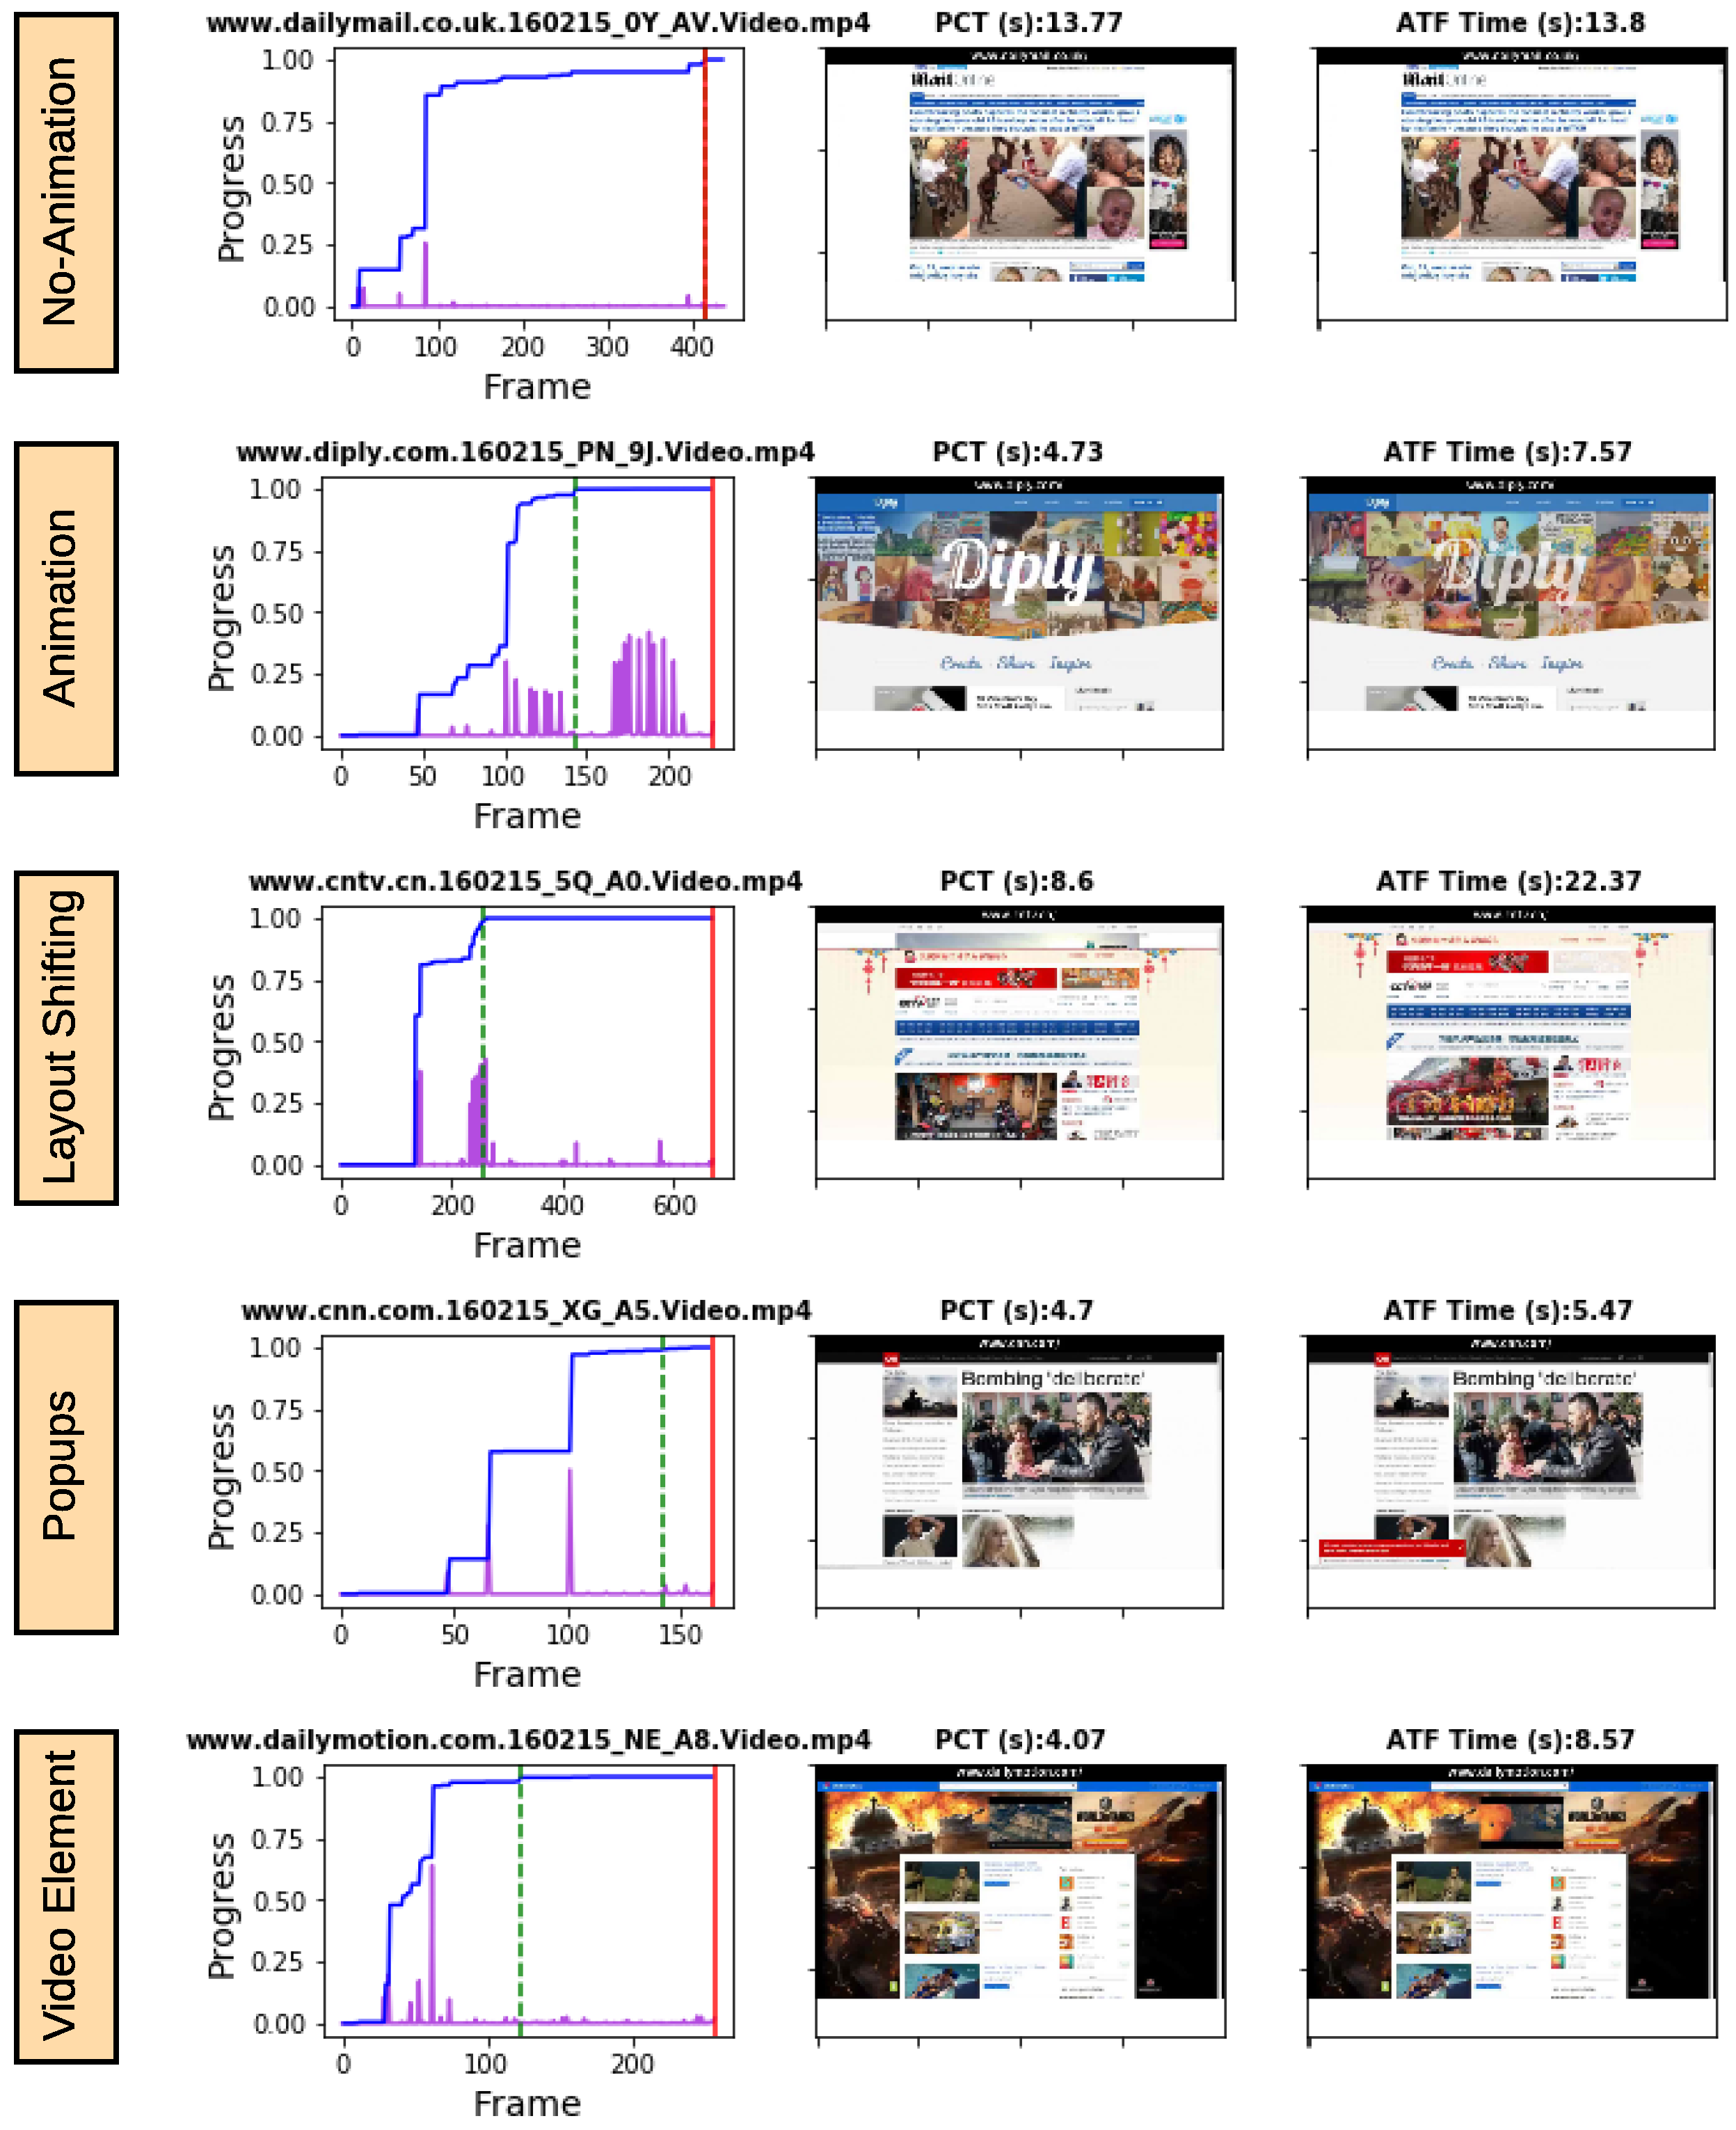
A post-analysis verification performed by the authors (Figure 11) shows that, for the websites with non-animated content, both PCT and ATF are detecting the same video frame as an ATF time. However, for the websites with delayed privacy or GDPR popups, layout shifting, animated content, and placeholders with background colors, PCT is detecting the ATF time sooner than the objective ATF. Several studies confirm that the web users visually and cognitively ignore pop-ups [22,23]. Thus, it can be understood that PCT operates well on the wide variety of issues and scenarios that occur beyond a controlled laboratory setup.
4.5. Limitations and Future Enhancements
The PCT algorithm has been shown to be robust to a wide variety of scenarios encountered on websites in the wild. One edge case has been identified that can cause issues. It occurs when a page contains a large ratio of dark-colored placeholder objects that become visible prior to content being painted. This can result in an underestimation of ATF by PCT. Similarly, for the web pages with a low quality image placeholder that use a blurred version of an image as the placeholder in the ATF area, PCT may underestimate the ATF time in low network quality conditions (e.g., low bandwidth, high packet loss rate, or latency). These are not anticipated to be a significant limitation to address and will not effect the fundamental steps of the presented algorithm.
The design of PCT and its integration with SSIM allows the metric to be customized and makes it content-aware. The literature shows that the users may not pay attention to every visual elements of a webpage [24,25]. In fact, they may ignore some elements (e.g., ads). An image processing or computer vision machine learning technique could be integrated with PCT to classify and exclude content from the PCT computation based on expected importance to a user’s perception. A better estimation of PCT can further improve the perceived quality estimation of web QoE models.
5. Discussion on SI, PCT, and the User’s Interactions
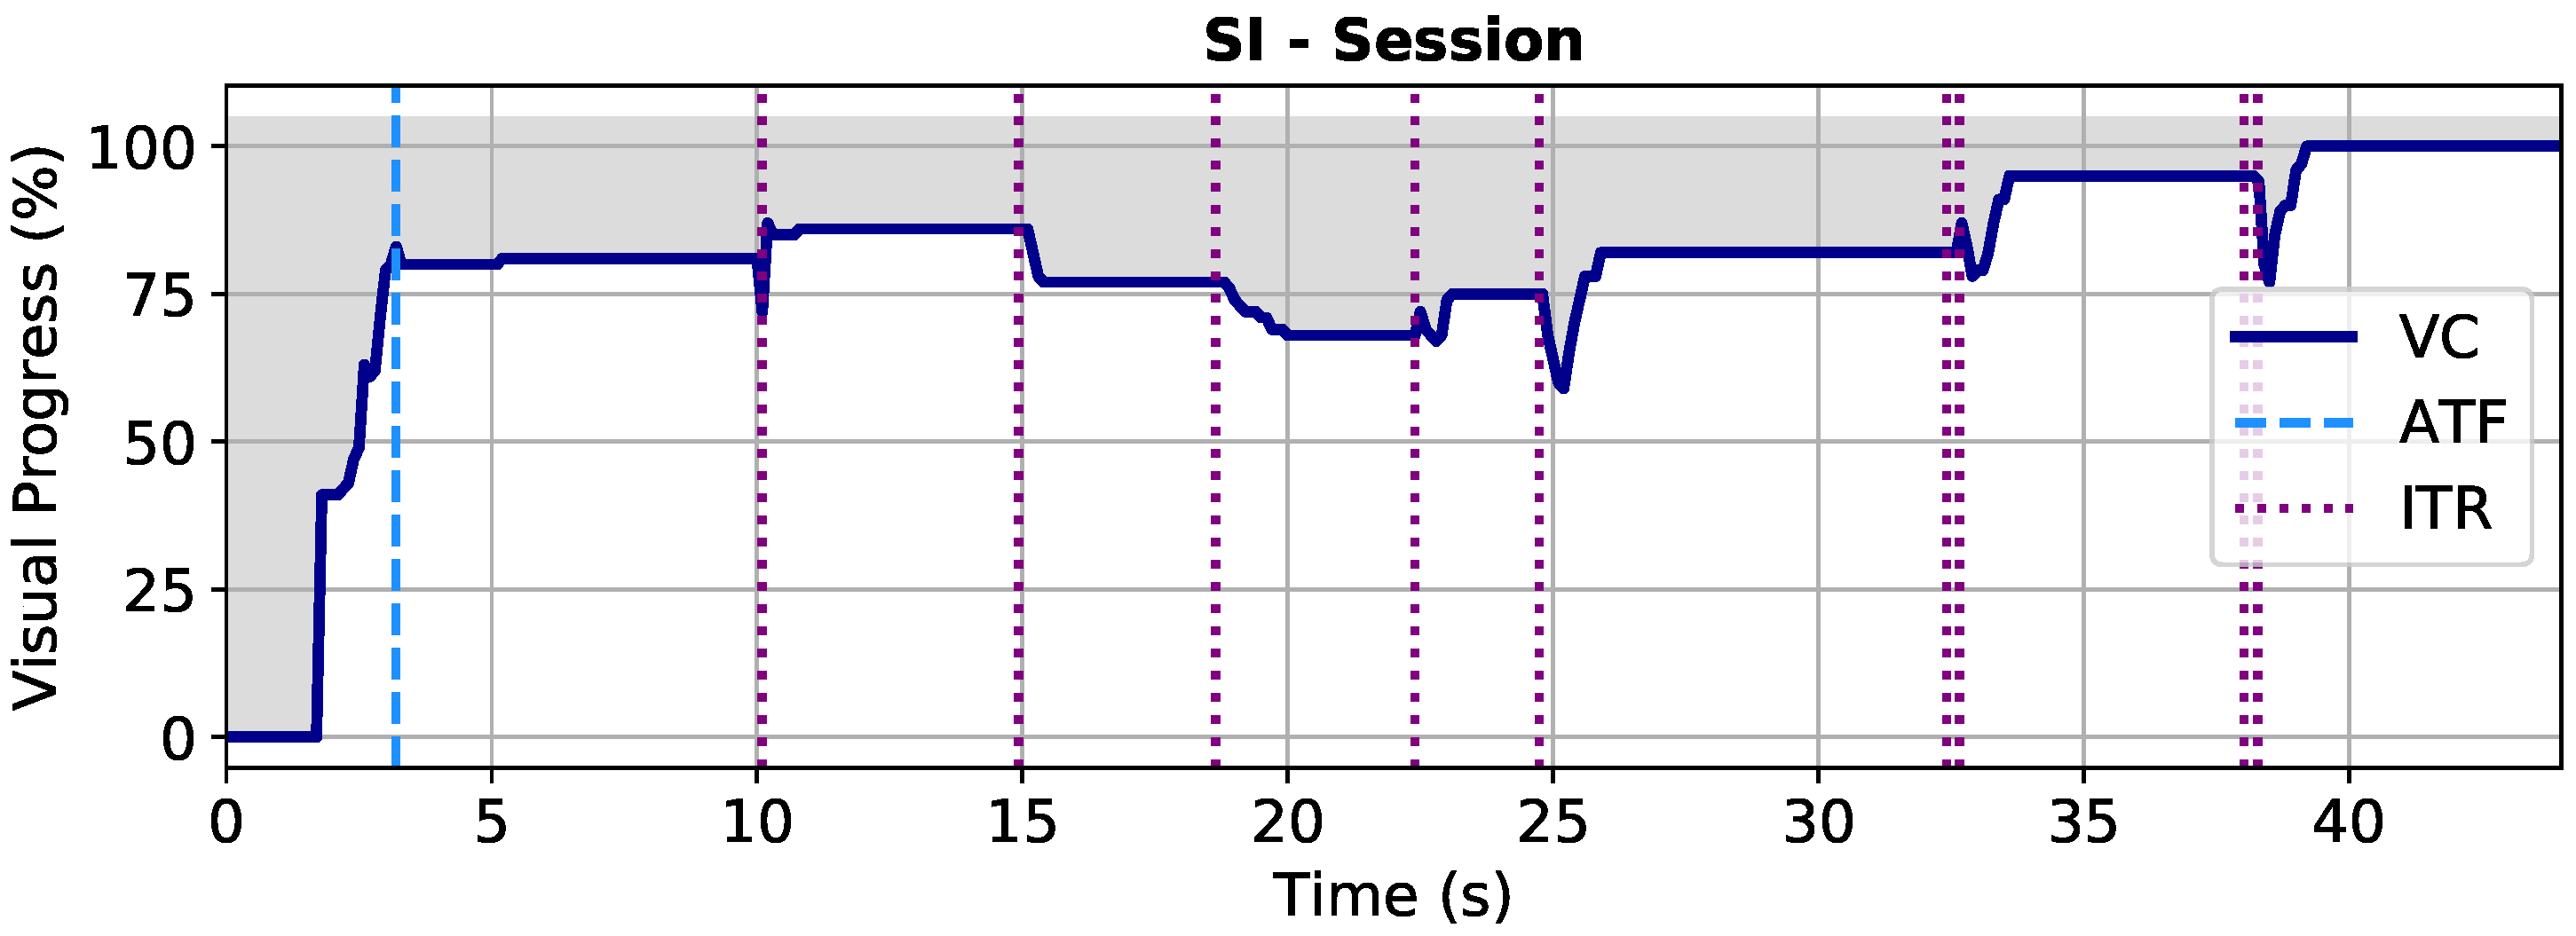
SI has been used as a valuable KPI for QoE estimation [11]. In Reference [26], it is established that the web users keep interacting with a web page beyond the first page-load which influences the QoE of interactive web applications. However, SI estimates the speed of the first page load [9]. Consequently, if the video of web browsing extends beyond initial ATF to include further user interactions, the estimated speed may not be an accurate representation of the loading speed. This is illustrated by the extended above-the-curve area (gray area after the sky blue line) in Figure 12.
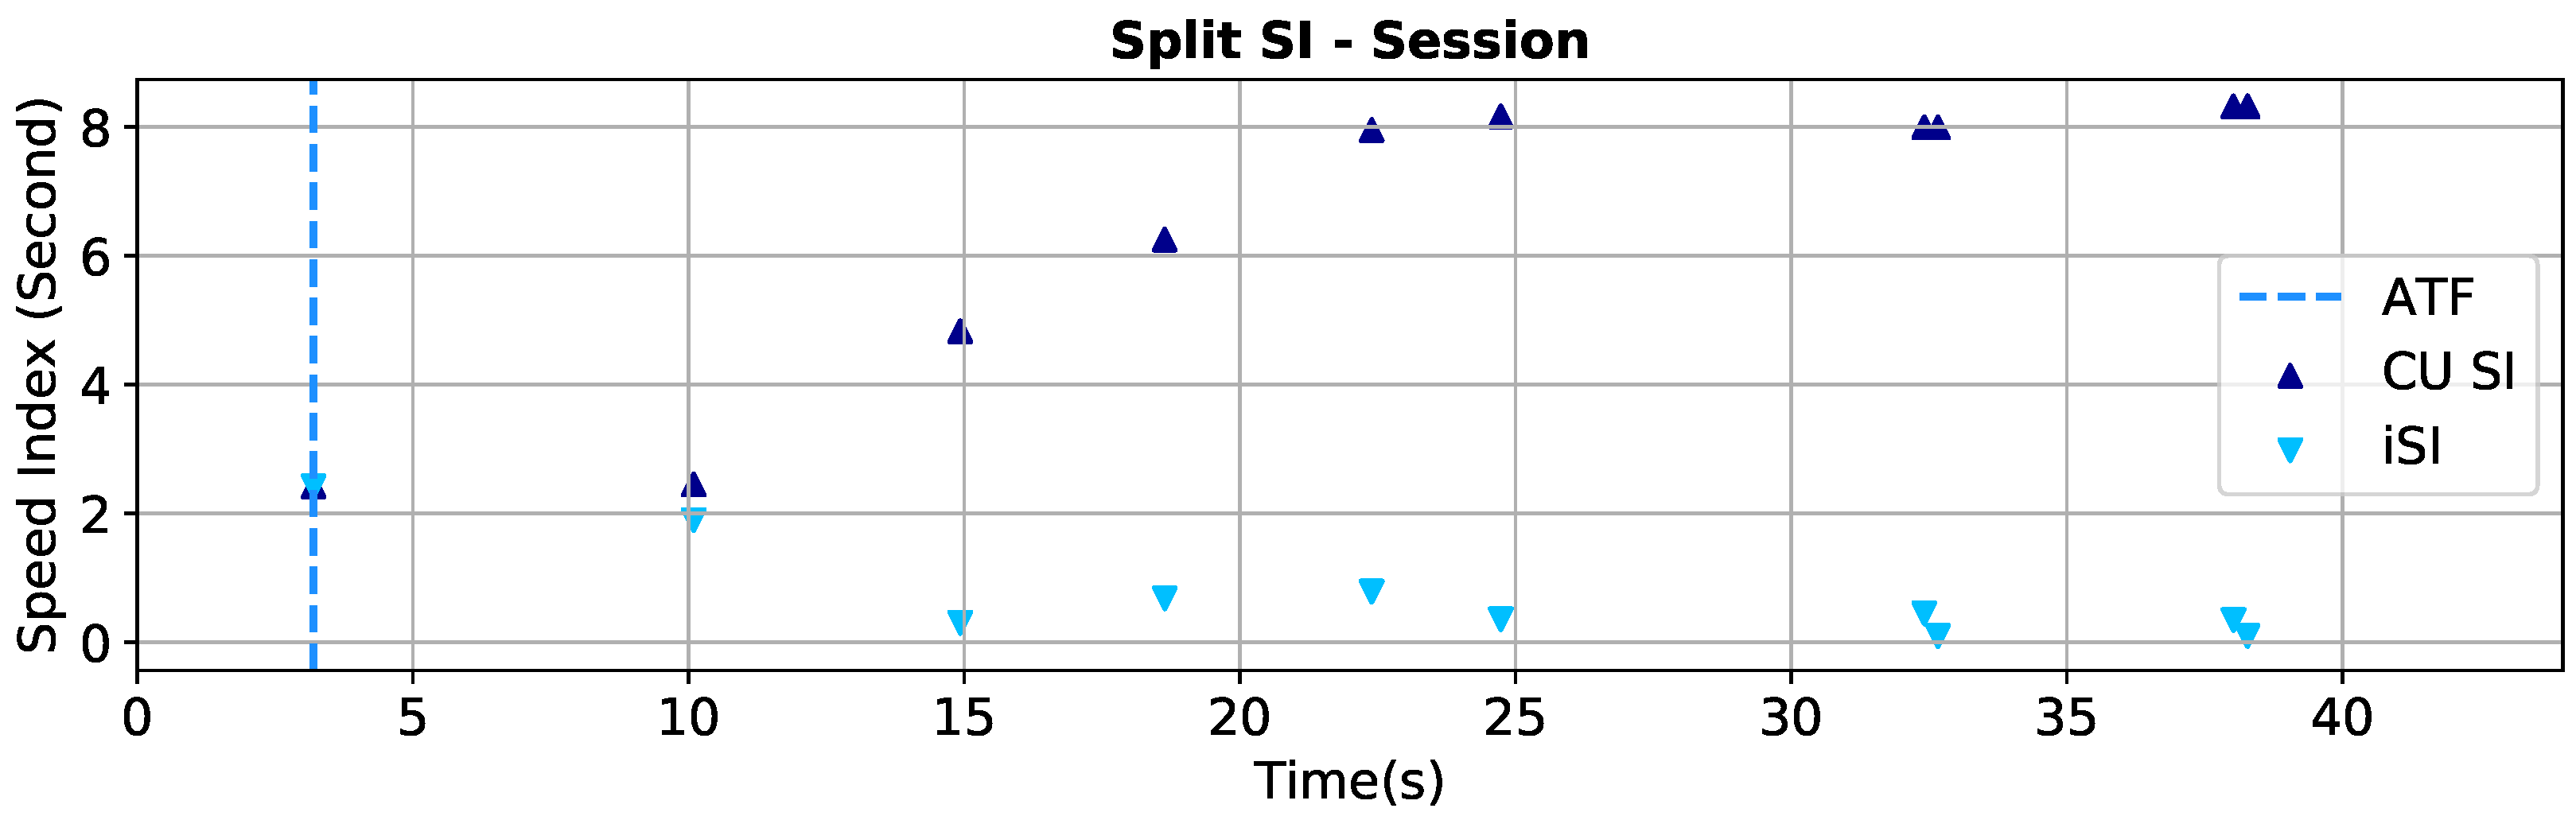
A possible solution to this is splitting the video of web browsing into multiple parts based on the user’s interactions. Then, compute the SI for each interaction. This forms an array of SI estimates where each element represents the speed of loading associated with the user’s interaction. However, similar to the first page load, the existence of animation in the ATF area may negatively impact the speed estimation of SI. In Figure 13, Cumulative SI (CU SI) is computed to illustrate how the speed estimation of SI is artificially inflating and increasing when a user keep interacting with a single page AJAX application.
The previous section (Section 4) established that using PCT as an ATF measure in SI solves the inaccurate measurement of SI caused by animated content. Thus, SI upper bounded to PCT can be used to measure the speed of interactions without being concerned about the content type.
Motivated by the concept of iLT that we proposed in Reference [26], the term interactive SpeedIndex (iSI) can be introduced. As shown in Figure 13, iSI represents computation of SIs associated with a user’s interactions for the entire web browsing session. It can be seen that iSI has a potential to demonstrate an accurate distribution of speed of the user’s interactions in compare to SI computed for the entire session.
6. Conclusions
This paper proposes the PCT metric to improve the estimation of ATF in accordance with the users’ perception and minimize the effect of animated content. The proposed metric uses SSIM to analyze the video of the loading process of websites (frame-by-frame) and determine, at what point in time, the maximum paintable pixels are painted once, on the users screen. This allows the metric to be robust enough in the ATF estimation for websites with animated and non-animated content. The accuracy of PCT is verified by performing various correlational analyses. PCT is shown to have a higher correlation with Perceived ATF () in comparison to the state-of-the art objective ATF metric (). It is demonstrated that, by computing SI using PCT, SI shows a consistent estimation behavior for websites with and without animated content. An evaluation of PCT on a public dataset of web browsing also confirms its effectiveness in ATF estimation in the wild. It not only performs well on websites with animated-content but minimizes the effect of prolonged ATF time due to privacy popups and layout shifting. It is further demonstrated that SI bounded to PCT can also be used to estimate the speed of a user’s interactions and introduce the concept of iSI.
Author Contributions
Conceptualization, H.Z.J.; methodology, H.Z.J. and A.H.; software, H.Z.J.; validation, H.Z.J., D.D. and A.H.; formal analysis, H.Z.J.; investigation, H.Z.J.; resources, H.Z.J.; data curation, H.Z.J. and A.H.; writing–original draft preparation, H.Z.J.; writing–review and editing, H.Z.J., D.D. and A.H.; visualization, H.Z.J. and A.H.; supervision, D.D. and A.H.; project administration, H.Z.J. and A.H.; funding acquisition, A.H. All authors have read and agreed to the published version of the manuscript.
Funding
This research was funded by Science Foundation Ireland (SFI) co-funded under the European Regional Development Fund under grant number 12/RC/2289_P2 and grant number SFI/12/RC/2077_P2.
Data Availability Statement
Not Applicable, the study does not report any data.
Conflicts of Interest
The authors declare no conflict of interest.
References
- Miller, M. Cloud Computing: Web-Based Applications that Change the Way you Work and Collaborate Online; Que Publishing: Indianapolis, IN, USA, 2008. [Google Scholar]
- Miller, M. B2B digital Marketing: Using the Web to Market Directly to Businesses; Que Publishing: Indianapolis, IN, USA, 2012. [Google Scholar]
- Alreshoodi, M.; Woods, J. Survey on QoE/QoS correlation models for multimedia services. Int. J. Distrib. Parallel Syst. 2013, 4, 53. [Google Scholar] [CrossRef]
- Jahromi, H.Z.; Hines, A.; Delaney, D.T. Towards Application-Aware Networking: ML-Based End-to-End Application KPI/QoE Metrics Characterization in SDN. Available online: https://researchrepository.ucd.ie/rest/bitstreams/39947/retrieve (accessed on 12 February 2021).
- Callet, P.L.; Möller, S.; Perkis, A.E. Qualinet White Paper on Definitions of Quality of Experience. Available online: https://hal.archives-ouvertes.fr/hal-00977812/document (accessed on 12 February 2021).
- da Hora, D.N.; Asrese, A.S.; Christophides, V.; Teixeira, R.; Rossi, D. Narrowing the Gap between QoS Metrics and Web QoE Using Above-the-Fold Metrics. Available online: https://hal.inria.fr/hal-01677260/document (accessed on 12 February 2021).
- Fiedler, M.; Hossfeld, T.; Tran-Gia, P. A generic quantitative relationship between quality of experience and quality of service. IEEE Netw. 2010, 24, 36–41. [Google Scholar] [CrossRef] [Green Version]
- Egger, S.; Reichl, P.; Hossfeld, T.; Schatz, R. “Time is bandwidth”? Narrowing the gap between subjective time perception and Quality of Experience. In Proceedings of the 2012 IEEE International Conference on Communications (ICC), Ottawa, ON, Canada, 10–15 June 2012. [Google Scholar]
- SpeedIndex (SI)—Google Developers. 2018. Available online: https://web.dev/speed-index/ (accessed on 10 December 2019).
- Jahromi, H.Z.; Delaney, D.T.; Hines, A. How Crisp is the Crease? A Subjective Study on Web Browsing Perception of Above-The-Fold. In Proceedings of the 2020 6th IEEE Conference on Network Softwarization (NetSoft), Ghent, Belgium, 29 June–3 July 2020. [Google Scholar]
- Hossfeld, T.; Metzger, F.; Rossi, D. Speed index: Relating the industrial standard for user perceived web performance to Web QoE. In Proceedings of the 2018 Tenth International Conference on Quality of Multimedia Experience (QoMEX), Sardinia, Italy, 29–31 May 2018. [Google Scholar]
- Brutlag, J.; Abrams, Z.; Meenan, P. Above the fold time: Measuring web page performance visually. In Proceedings of the Velocity, the Web Performance and Operations conference, Santa Clara, CA, USA, 14–16 June 2011. [Google Scholar]
- Saverimoutou, A.; Mathieu, B.; Vaton, S. Web browsing measurements: An above-the-fold browser-based technique. In Proceedings of the 2018 IEEE 38th International Conference on Distributed Computing Systems (ICDCS), Vienna, Austria, 2–5 July 2018. [Google Scholar]
- Da Hora, D.; Rossi, D.; Christophides, V.; Teixeira, R. A practical method for measuring Web above-the-fold time. In Proceedings of the ACM SIGCOMM 2018 Conference on Posters and Demos, Budapest, Hungary, 20–25 August 2018. [Google Scholar]
- Wang, Z.; Bovik, A.C.; Sheikh, H.R.; Simoncelli, E.P. Image quality assessment: From error visibility to structural similarity. IEEE Trans. Image Process. 2004, 13, 600–612. [Google Scholar] [CrossRef] [PubMed] [Green Version]
- Hore, A.; Ziou, D. Image quality metrics: PSNR vs. SSIM. In Proceedings of the 2010 20th International Conference on Pattern Recognition, Istanbul, Turkey, 23–26 August 2010. [Google Scholar]
- McFadden, S.B.; Ward, P.A. Selecting the proper window for SSIM. In Proceedings of the Image Quality and System Performance IX, Burlingame, CA, USA, 24 January 2012. [Google Scholar]
- Nilsson, J.; Akenine-Möller, T. Understanding Ssim. Available online: https://arxiv.org/pdf/2006.13846.pdf (accessed on 12 February 2021).
- Grondin, S. Processing time between visual events. Arq. Bras. Oftalmol. 2003, 66, 96–104. [Google Scholar] [CrossRef]
- Jahromi, H.Z.; Rooney, B.; Delaney, D.T.; Hines, A. Establishing Waiting Time Thresholds in Interactive Web Mapping Applications for Network QoE Management. In Proceedings of the 30th Irish Signals and Systems Conference (ISSC 2019), Maynooth, Ireland, 17–18 June 2019. [Google Scholar]
- Dehaene, S. The neural basis of the Weber–Fechner law: A logarithmic mental number line. Trends Cognit. Sci. 2003, 7, 145–147. [Google Scholar] [CrossRef]
- Bahr, G.S.; Ford, R.A. How and why pop-ups don’t work: Pop-up prompted eye movements, user affect and decision making. Comput. Hum. Behav. 2011, 27, 776–783. [Google Scholar] [CrossRef]
- Cara, C.; Dumitrașciuc, L.F. GDPR consent pop-ups. How are we thinking about them? An Elaboration Likelihood perspective. J. Int. Bus. Manag. 2021, 4, 01–10. [Google Scholar]
- Hong, W.; Thong, J.Y.; Tam, K.Y. How do Web users respond to non-banner-ads animation? The effects of task type and user experience. J. Am. Soc. Inf. Sci. Technol. 2007, 58, 1467–1482. [Google Scholar] [CrossRef]
- Liu, W.; Liang, X.; Liu, F. The Effect of Webpage Complexity and Banner Animation on Banner Effectiveness in a Free Browsing Task. Int. J. Hum. Comput. Interact. 2019, 35, 1192–1202. [Google Scholar] [CrossRef]
- Jahromi, H.Z.; Delaney, D.T.; Hines, A. Beyond First Impressions: Estimating Quality of Experience for Interactive Web Applications. Available online: https://0-ieeexplore-ieee-org.brum.beds.ac.uk/ielx7/6287639/8948470/09027906.pdf (accessed on 12 February 2021).
Figure 1.
The loading process of a website from time that the URL is requested until the time that the website is completely loaded.
Figure 1.
The loading process of a website from time that the URL is requested until the time that the website is completely loaded.

Figure 2.
Illustration of the Visually Complete (VC) time (x-axis) and progress (y-axis) with example page rendering. SpeedIndex (SI) calculates the area above-the-curve from page request time, , until the time at which the Above-the-fold (ATF) is 100% VC (i.e., ATF time). VC progress usually occurs before the Page Load Time (PLT) event. However, depending on the content, network, and computational conditions, ATF and PLT may occur simultaneously.

Figure 3.
Prolonged ATF time estimation for websites with animated content. This is an example of a website where ATF estimation is overestimated due to animated components in the webpage. The grey area between the green and red lines is included in the ATF and SI estimation as a result of the animation changing. However, the ATF for the page should be considered complete at the green line time, not the end of the video. This sample is visualized based on the data collected in Reference [10] for harveynorman.ie under 3 Mbps bandwidth condition.

Figure 4.
Visual illustration of the major steps of the Plausibly Complete Time (PCT) estimation. In order to improve the visual clarity of the figure, the dimensions of the matrices are reduced.
Figure 4.
Visual illustration of the major steps of the Plausibly Complete Time (PCT) estimation. In order to improve the visual clarity of the figure, the dimensions of the matrices are reduced.

Figure 5.
The flowchart illustrates a detailed flow of PCT estimation.

Figure 6.
The Spearman Rank-Order Correlation Coefficient (SROCC) between PCT, Perceived ATF, Objective ATF, and PLT.
Figure 6.
The Spearman Rank-Order Correlation Coefficient (SROCC) between PCT, Perceived ATF, Objective ATF, and PLT.

Figure 7.
The relationship on estimation of ATF time. The left subplot shows the relationship between PCT (y-axis) and perceived ATF (x-axis). The middle subplot illustrates the relationship between objective ATF (y-axis) and perceived ATF (x-axis). The right subplot demonstrates the relationship between PCT (y-axis) and the Objective ATF (x-axis).

Figure 8.
The influence of PCT on SpeedIndex (SI). The (left) subplot represents the estimation of SI using PCT (y-axis) and its tight positive correlation with the corresponding SI computed based on ground truth perceived ATF (x-axis). The (right) subplot shows the relationship between SI estimated based on the objective ATF (y-axis) and perceived ATF (x-axis).

Figure 9.
Using PCT to estimate ATF for use in the Waiting time and its QoE evaluation on a linear ACR scale is Logarithmic (WQL) and IQX Quality of Experience (QoE) models. The (left) subplot shows a high positive linear correlation between QoE estimation of WQL using PCT (y-axis) and the ground truth perceived ATF (x-axis). The (right) subplot represents a positive correlation between QoE estimation of IQX using PCT (y-axis) and perceived ATF time (x-axis). Comparing these results with those presented in Reference [10] shows that PCT has positively improved QoE estimation for IQX and comparable results for WQL.

Figure 10.
The performance evaluation of PCT in the wild. The (left) subplot represents positive linear relationship and some degree of agreement on ATF estimation between PCT (x-axis) and the Objective ATF (y-axis). The (right) subplot shows a tight positive linear relationship between SI estimated based on PCT (x-axis) and SI estimated using objective ATF. Since the majority of the test cases are the website without animations, the result confirms that computing SI using PCT yield a similar result as the SI computed based on state-of-the-art ATF metric. A post-analysis verification shows that the majority of the outliers are related to the websites with animations, pop-ups, or late loading contents (see Figure 11).

Figure 11.
PCT estimation on a public data-set. In the (left) column of subplots, the blue lines represents the cumulative visual progress of PCT, purple bars are the Similarity Index Measure (SSIM) scores between two consecutive frames, the dotted green line is the PCT frame time, and the solid red line shows the objective ATF frame. The (middle) column shows the frames associated with PCT and the (right) column shows the objective ATF frames.

Figure 12.
VC progress calculation for an entire web mapping session. The blue line shows the visual progress over time. While the sky blue vertical line is the time that objective ATF occurred, the purple vertical lines show the user’s subsequent interactions.
Figure 12.
VC progress calculation for an entire web mapping session. The blue line shows the visual progress over time. While the sky blue vertical line is the time that objective ATF occurred, the purple vertical lines show the user’s subsequent interactions.

Figure 13.
An example illustration of SI measured in accordance with iLT time (user’s interactions) for an entire web mapping session. Cumulative SI (CU SI) is referring to a cumulative SI that measures SI from time 0 until each user’s interaction. CU SI demonstrates how the result of SI can artificially increase, if the subsequent interactions gets included in the computation. However, if the estimation gets split, guided by iLT (based on the user interaction), iSI can be computed, which can accurately represent a speed estimation of SI associated with each user’s interaction.

Publisher’s Note: MDPI stays neutral with regard to jurisdictional claims in published maps and institutional affiliations. |
© 2021 by the authors. Licensee MDPI, Basel, Switzerland. This article is an open access article distributed under the terms and conditions of the Creative Commons Attribution (CC BY) license (http://creativecommons.org/licenses/by/4.0/).
Share and Cite
MDPI and ACS Style
Jahromi, H.Z.; Delaney, D.; Hines, A. A Sign of Things to Come: Predicting the Perception of Above-the-Fold Time in Web Browsing. Future Internet 2021, 13, 50. https://0-doi-org.brum.beds.ac.uk/10.3390/fi13020050
AMA Style
Jahromi HZ, Delaney D, Hines A. A Sign of Things to Come: Predicting the Perception of Above-the-Fold Time in Web Browsing. Future Internet. 2021; 13(2):50. https://0-doi-org.brum.beds.ac.uk/10.3390/fi13020050
Chicago/Turabian StyleJahromi, Hamed Z., Declan Delaney, and Andrew Hines. 2021. "A Sign of Things to Come: Predicting the Perception of Above-the-Fold Time in Web Browsing" Future Internet 13, no. 2: 50. https://0-doi-org.brum.beds.ac.uk/10.3390/fi13020050
Note that from the first issue of 2016, this journal uses article numbers instead of page numbers. See further details here.