
Spectrum Demand Forecasting for IoT Services


Electronics Department, School of Engineering, Pontificia Universidad Javeriana, Bogota 110231, Colombia
*
Author to whom correspondence should be addressed.
†
These authors contributed equally to this work.
Future Internet 2021, 13(9), 232; https://0-doi-org.brum.beds.ac.uk/10.3390/fi13090232
Submission received: 19 July 2021
/
Revised: 24 August 2021
/
Accepted: 30 August 2021
/
Published: 8 September 2021
(This article belongs to the Section Internet of Things)
Abstract
:The evolution of IoT has come with the challenge of connecting not only a massive number of devices, but also providing an always wider variety of services. In the next few years, a big increase in the number of connected devices is expected, together with an important increase in the amount of traffic generated. Never before have wireless communications permeated so deeply in all industries and economic sectors. Therefore, it is crucial to correctly forecast the spectrum needs, which bands should be used for which services, and the economic potential of its utilization. This paper proposes a methodology for spectrum forecasting consisting of two phases: a market study and a spectrum forecasting model. The market study determines the main drivers of the IoT industry for any country: services, technologies, frequency bands, and the number of devices that will require IoT connectivity. The forecasting model takes the market study as the input and calculates the spectrum demand in 5 steps: Defining scenarios for spectrum contention, calculating the offered traffic load, calculating a capacity for some QoS requirements, finding the spectrum required, and adjusting according to key spectral efficiency determinants. This methodology is applied for Colombia’s IoT spectrum forecast. We provide a complete step-by-step implementation in fourteen independent spectrum contention scenarios, calculating offered traffic, required capacity, and spectrum for cellular licensed bands and non-cellular unlicensed bands in a 10-year period. Detailed results are presented specifying coverage area requirements per economic sector, frequency band, and service. The need for higher teledensity and higher spectral efficiency turns out to be a determining factor for spectrum savings.
1. Introduction
The evolution of IoT has come with the challenge of connecting not only a massive number of devices, but also providing an always wider variety of services [1], ranging from the typical multimedia services that clog the actual cellular networks (enhanced Mobile Broadband—eMBB), or critical services that need extremely reduced latency and always-on network availability (Ultra-Reliable Low-Latency Communications, URLLC) to massive access for very low rate devices (Massive Machine-Type Communications, mMTC) [2]. This implies a deep transformation on the networks, their technologies, and the industries that use IoT services and urges for meticulous spectrum management.
In the next few years, a big increase in the number of connected devices is expected, together with an important increase in the amount of traffic generated [3,4,5].
According to [6,7], the amount of information flooding the Internet could be in total somewhere between 20 and 65 petabytes () annually. However, the largest amount of this traffic is still generated by traditional mobile devices (smartphones) [4]. Massive access of low data rate devices may not compromise the spectrum required in terms of spectral efficiency, but in terms of area spectral efficiency or efficient access techniques that guarantee low interference and high utilization. Therefore, some services will run over networks designed to deal with interference in shared (unlicensed) bands, while others will be carried by networks designed for high spectral efficiency in licensed bands.
However, not all services require spectrum with the same coverage; they vary from body, personal, local, metropolitan to wide area networks (BAN, PAN, LAN, MAN, WAN). This implies that many services provided in very different locations (e.g., a hospital and an airport) may use the same band without interference. In the machine-to-machine (M2M) market, 72% of the devices use short-range unlicensed connections [8].
A huge market of digital services has already given birth to new technologies and networks. Their most prominent example is the Low-Power Wide Area Networks (LPWANs), working normally over unlicensed bands, providing connectivity to many things (generally sensors) at very low transmission rates. In the LPWAN sector, many spin-off companies have already presented networks with different PHY-MAC layer design (SIGFox, LoRa, Weighless, etc.) working mainly in the 800 and 900 MHz Industrial, Scientific and Medical (ISM) bands. Additionally, and for the first time, the 3GPP has made cellular technology available to work on unlicensed spectrum (the so-called LTE-U version) creating yet another possibility for new services on many unlicensed bands. These networks will be supported by the reliability of 3GPP’s industrial muscle and the versatility of having a private network without depending on a telecommunications operator. On the other hand, 3GPP standardization is working towards grabbing a share on this market, with standards such as EC-GSM-IoT, NB-IoT, or LTE-M, [9,10,11]. After completion of the first releases of the 5G standards (Rel. 15 and 16) where the main focus was the NR interface for eMBB and providing alternatives for easier 5G deployment using pre-existing 4G infrastructure (non-stand alone architecture); a final version of Release 17 has now been delayed for 2022, and Release 18 working items have started to emerge. In Rel. 17, mMTC and cMTC (critical MTC) have evolved from its predecessors LTE-M and NB-IoT, introducing a new NR type of device called “NR Light” to support industrial IoT use cases. Additionally, the operation on frequency bands beyond 52 GHz is also targeted. Both Rel. 17 and 18 seek advances on sidelink standardization for V2X use cases (V2X stands for vehicle-to-vehicle, vehicle-to-infrastructure, or vehicle-to-network, for short: vehicle-to-everything communications). Finally, Rel. 18 will also include the so-called RedCap evolution and positioning. RedCap (a shortcut for Reduced Capability) is one of the most interesting initiatives in 3GPP towards expanding the cellular network reach on IoT use cases. The new type of devices targeted with RedCap varies from wearables, industrial wireless sensors or video surveillance equipment. These devices should work in both frequency ranges (FR1 and FR2) using reduced bandwidth parts and less hardware complexity.
Due to the considerable influence of the 3GPP, and the nature of the IoT services (using cellular networks for their access link, transport link, or both), the IoT spectrum is highly related to the 5G spectrum and comprises all bands related to new services that can be served by future cellular networks. Although many IoT services (especially short-range services) may not be part of cellular networks, most of these will be designed to work on unlicensed bands without seriously affecting the band’s spectral efficiency and the performance of other devices.
The so-called 5G spectrum includes all bands in contention for future allocation for IoT and 5G services around the world that were discussed in the WRC-19 (World Radiocommunications Conference). This spectrum has been divided into three main groups:
Low bands (sub 1 GHz): Will be mainly used for services that require extreme coverage such as deep indoor, or suburban, or rural services. Much more active use of ISM sub 1 GHz bands (from 100 to 900 MHz) is foreseen. Another key factor is the use of digital-dividend bands between 700 and 800 MHz that have not been allocated in many countries. Most LPWAN technologies are designed to operate in 900 MHz, other short-range technologies also use bands as low as 400 MHz actively.
Mid bands (from 1 to 6 GHz): Some of the most interesting bands are the 3.4–3.6 GHz band open for Broadband Wireless Access (BWA) or the 2.5 and 2.69 GHz band open for IMT-2000 and BWA. Mid bands provide wider bandwidths and good coverage for eMBB and mission-critical services. Increased pressure has been put for sub 6 GHz spectrum to be available for V2X communications [12]. Currently, many European regulators (such as OFCOM in the UK, AGCOM in Italy, ARCEP in France, BNETZA in Germany) are in the process or have plans of auctioning mid bands between 3.4 and 3.8 GHz.
High bands (over 6 GHz): Primarily millimeter wave (mmW) developments from 24 to 100 GHz. Due to the very wide bandwidths available, it is especially useful for very high data rates and short-range communications. Several European countries have already started studies on the 26 GHz band and a global agreement on this band was accorded in the WRC-19.
According to [13], the International Telecommunications Union (ITU) preparations for WRC-19 have included among other topics: frequency bands for Intelligent Transport Systems (ITS), additional bands for International Mobile Telecommunications (IMT), Wireless Access Systems and Radio Local Area Networks in mid bands.
Regional bodies such as Asia-Pacific APT, Arab ASMG, African ATU, European CEPT, CITEL from The Americas and Central Asia RCC, support 5G use of 24.25–27.5 GHz, 31.8–33.4 GHz, and 40.5–43.5 GHz [14].
In addition, the CEPT considers that the 24.25–27.5 GHz band is a clear priority for immediate study.
Inside CITEL, Colombia also has a favorable position declaring that “the lower portions of the frequency range (from 24.25 GHz to 43.5 GHz) provide good opportunities in terms of availability, technical performance and potential for global harmonization” [13].
In addition to new bands, an important amount of research has been put recently on spectrum sharing and technologies coexistence [15]. This is a result of the need to use shared spectrum and smarter radio technologies more aggressively. One tangible result of the shared spectrum trend is the CBRS alliance (Citizens Broadband Radio Service), where a powerful group of telecommunications stakeholders has demonstrated the possibility of shared use in the CBRS band (3550 MHz to 3700 MHz) that used to be of exclusive use for military radars in the USA. According to the FCC, mobile operators will be able to deploy 5G networks without acquiring licenses for this band. This 150 MHz will be shared between three types of users: incumbents, priority access licensed (PAL), and general authorized access (GAA). Some telecommunications vendors like Qualcomm have rushed into developing technologies for the CBRS band or other bands of similar characteristics that may be approved in the future. MulteFire and LAA (Licensed Assisted Access) are examples of LTE-U and Wi-Fi/5G spectrum sharing [16,17,18,19].
Never before have wireless communications permeated so deeply in all industries and economic sectors. The main technologies, networks, and services of the IoT might not exist yet, such as a network for the huge business of vehicle communications (V2X). Therefore, it is crucial to correctly forecast the spectrum needs, which bands should be used for which services, and the economic potential of their utilization. All telecommunications operators and manufacturers in the world are concerned about what should probably be the most important spectrum planning framework of the century. Without correct spectrum allocations and pricing policies, manufacturers and stakeholders will not risk their investments and will not develop technologies for future services.
Consequently, this research provides an example of a complete study on IoT spectrum forecasting from a government regulator perspective divided into two phases:
- Section 3: A market study specifically tailored for IoT. Based on available bands, incoming technologies and their possible market penetration, regional telecommunications industry influence, and local adoption capabilities.
- Section 4: A forecasting model accounting for new spectral efficiency gains, and new techniques improving the overall system capacity in terms of rate (such Multiple Antenna, MIMO, systems) and in terms of access efficiency (such Non-Orthogonal Multiple Access, NOMA). The model has been developed independently for each group of services and technologies that use a specific frequency band in a shared area of coverage.
2. Related Work
In the literature, spectrum and traffic demand prediction is determined with different approaches. On one hand, artificial intelligence methods (AI) in network traffic prediction for proactive network analysis have encountered a wide set of application areas including network monitoring, resource management, planning tasks, and threat detection. In this regard, various techniques have been proposed and studied including neural network-based techniques, data mining, deep learning, and machine learning techniques. In addition, several linear, non-linear and combined models have also been presented. A very comprehensive and descriptive survey on various traffic prediction techniques is presented in [20]. Linear models such as ARMA/ARIMA have been commonly used for network traffic forecasting [21,22]. Among the non-linear mechanisms, neural networks are the most commonly used and they are claimed as the most precise [23]. Recurrent Neural Networks (RNN) have gained attention for network traffic prediction, and the work in [24] explores different RNN architectures to solve the traffic prediction problem. More recently, combined non-linear and linear methods promise to reach outperforming standard statistical metrics, and in [25], a network traffic predictor based on SA (Simulated Annealing) optimized ARIMA (Autoregressive Integrated Moving Average model)-BPNN (Back Propagation Neural Network) is proposed. The network traffic prediction methods have also become an indispensable part of the cellular resource management system, in particular for the massive deployment of 5G IoT cellular network systems. For instance, authors in [26] have proposed a data-augmentation-based cellular traffic prediction model (ctGAN-S2S), which achieves up to 48.49% improvement of the prediction accuracy compared with reference models on a real-world city-scale cellular traffic dataset. Other interesting work in [27] has proposed a reinforcement learning-based mechanism on a Markov decision process and Monte Carlo Q-learning technique for modeling the network traffic in the implementation of network security and management functions in industrial IoT applications. Additional applications can be also found in the literature regarding novel radio access mechanisms combined with deep reinforcement learning techniques and the RNN traffic prediction model, which tackle the problem of collisions with massive IoT networks [28]. When using AI-based traffic prediction models, the main purpose is to obtain information about the network traffic in short periods of time for network management functions. Most of the cited methods evaluate their predictions over very short time frames because most of the techniques have been applied in traditional networks such as IP backbone and cellular backhaul where the aggregated traffic obeys regular and periodic patterns. On the contrary, IoT traffic flows have a very different nature, as they are produced mainly by machine-type communications. Additionally, the short-term traffic behavior is not relevant for spectrum forecasting, where the main concern is to carefully estimate the amount of constant traffic produced by a peak case, in terms of the number of devices and its data rate. Short-term traffic predictions are out of the scope of this work.
On the other hand, long-term spectrum requirement prediction techniques rely on the application of the methodology for calculation of spectrum requirements for the terrestrial component of IMT wireless networks of the ITU [29]. This recommendation provides a systematic approach that incorporates service categories, service environments, radio environments, market data analysis for traffic estimation by using the defined categories and environments, traffic distribution among radio access technology groups (RATGs), required system capacity calculation, and resultant spectrum requirement determination. The methodology is applicable to packet switch-based traffic, it can accommodate multiple services and it is mainly oriented to digital cellular mobile systems, IMT-2000 systems, IMT-Advanced systems, radio LANs, and Digital mobile broadcasting systems. This methodology has often been applied for spectrum requirement estimation of mobile cellular systems for radio spectrum planning purposes and policy-making processes. For instance, the work in [30] adopted the ITU spectrum forecasting method for spectrum allocation in the Chinese railway mobile communication system, but this work is not related to IoT spectrum. Only a few works have been reported in the literature regarding the application of the methodology for IoT services. In [31], authors aim to estimate spectrum requirements for the deployment of IoT services in Jakarta Smart City by proposing two general scenarios according to the service data rate (50/100 kbps) and frequency channel separation (200/400 kHz). Spectrum estimation of their method predicted for 2021 a required spectrum of 18.67 MHz and 19.91 MHz, respectively, for each scenario. Similarly, the work in [32] has applied the methodology for spectrum demand calculation for smart transportation services powered by Long Term Evolution (LTE) mobile technology, in this work, the authors defined two scenarios according to the services provided in the transportation system, one for the closed-circuit television (CCTV) system and another for the global positioning system (GPS). Results show that by 2025, the required spectrum for each scenario will be 0.014 kHz and 84.290 kHz, respectively. In [33], spectrum needs are assessed for mobile telemedicine services in Indonesia supported by LTE technology, the prediction obtained is 165.47 kHz by the end of 2025 on the frequency band of 1800 MHz. The work in [34] adapted the ITU-R M.2290 spectrum requirement estimation model [35] for proposing a 5G spectrum estimation framework based on a heuristic game theory called a coalition formation algorithm, applied in Taiwan. In particular, the study is centered to address the minimum spectrum requirements for individual telecommunications operators considering the sub-6GHz frequency bands and the 4G/5G network technologies. In this work, the spectrum requirement estimation for standalone 5G services is 800 MHz considering all the national operators. The work in [36] presents a study for analyzing the conditions of bandwidth demand for certain IoT applications in Mexico. In this work, the calculation of the bandwidth needs is computed using population densities in different regions of Mexico in order to obtain the density of IoT end-devices, which combined with the communication range of IoT networks, for urban, semi-urban and rural areas, allows to estimate a traffic demand and finally the required spectrum bandwidth. Spectrum requirements results are presented for the different regions by the end of 2023, where highly dense urban areas as is the case of Mexico City presents an estimated spectrum demand of 13.64 MHz considering a radio communication coverage cell of 2 km, this result can eventually change by increasing the cell coverage area.
According to the previously cited works, two main hints should be highlighted: First, to the best knowledge of the authors, the proposed methods do not include a clear definition of spectrum contention scenarios and IoT services, the calculation of an IoT market penetration, a wider identification of communication IoT technologies, a clear distinction of the different frequency bands where IoT services could be deployed and calculation adjustments for future technologies that may increase the spectrum efficiency. The lack of these aspects makes these methodologies non-general and difficult to replicate in other countries. Finally, due to the different assumptions and procedures used for spectrum calculation, none of these works can really be used as a reference framework for spectrum demand comparison with this research.
3. A Market Study
The purpose of this market study is not determining the financial viability of investing in IoT products or services, but calculating the strength of penetration of IoT technologies in a country’s economic activity in order to find the number of devices, services, technologies, frequency bands and spectral efficiencies that will exist in the future IoT scenarios. Since many of these technologies and services do not even exist today, some assumptions must be made. We propose a study in terms of completeness: analyzing all the important aspects of IoT and soundness: translating those factors into a concrete number of devices per area unit. The study is described in the following sub-sections.
3.1. Technologies
The main driver of the IoT market is the availability of a given wireless technology. Companies and their products will convert to IoT (i.e., their products/services or their information will become 24/7 available on the Internet) if an affordable and fully integrated technology is known for that business. Accordingly, a review of all wireless communication technologies and their recent innovations is the first essential step. For each technology found, the following is a list of important questions to be answered:
- Identify how close the technology is: in terms of geographic or commercial linkage. Where is the closest manufacturer or designer of this technology and how massive is this technology’s scope? Does the manufacturer target your country’s market as a goal for production plans?
- Identify the ease of use of this technology: Is it plug-and-play? Does it require hiring a team of engineers to buy, operate and maintain the system? Are these specialized engineers easily available in the labor market? Will this technology reach any business or only big corporations with investment capacities?
- Identify possible new business models based on operators: As in the case of LPWANs, many companies prefer to pay for the services instead of buying equipment and developing their own IoT use cases. Hence, some telecommunications manufacturers have decided to be IoT operators themselves or sometimes in alliance with mobile operators. A notable case is SigFox. Therefore, one should identify which technologies and services may generate new operators.
- Identify the technology bands: Is this a multi-band technology? Are there any official plans from the vendor to extend production in your country’s bands? Is this band available in your country? If not, how much is it used and how important are these services in your country? Has your country’s regulator discussed the use of this band?
- Identify the strength of the technology versus incoming cellular competition: Can this technology survive after 3GPP IoT networks (NB-IoT and LTE-M) are fully standardized and commercial? Consider the time frame this will take to be a reality in your country.
3.2. Services
A service labeled as to be part of IoT is based on ambiguous commercial definitions. Several lists of very different IoT services can be found in the literature [1,37], thus, for spectrum forecasting, it is necessary to find your own country’s list. An initial step could be finding the main economic sectors and their IoT products and services. This step should not exclude a complete review of other economic sectors and services that already exist, for example, in neighboring countries. Special attention should be put on future IoT services that are clearly more difficult to identify. The following aspects should provide important hints:
- Innovative technologies found in Section 3.1.
- IoT services already offered in developed or neighbor countries.
- Big industries that have not adopted IoT yet.
3.3. Market Size and Penetration
After identifying a list of IoT services, it is necessary to establish the real size of each market and estimate the rate of penetration that these services will have.
- Market size: An indicator of the real market size should be the amount of the country’s population with enough income to access the product or service. If the product or service is not a mass consumption one, then the population should be reduced according to the size of the economic sector or the number of clients of related products that already exist.
- Technology penetration rate: A very well studied and related subject is found in the literature with the name of ICT adoption. A complete paper giving reviews of proposed methods, data from empirical results, and models can be found in [38]. Since applying one of those models should be carefully adapted to your country’s situation, an alternative would be using two different indicators combined as proxies of IoT penetration: (i) IoT penetration forecasting; some examples can be found in [3,4,5,39,40,41,42]. (ii) The IDI (ICT Development Index), published every year by ITU in [43]. The IDI will most likely serve as a weight factor for the first indicator.
3.4. Number of Devices
Once the general trend for IoT penetration and market size for each product/service is determined in your country, it is necessary to quantify the number of devices that will be IoT-connected. We propose to gather the largest amount of historical data regarding the sales of any of those products in your country in at least 10 years, and project this information using econometric models such as ARIMA(p,d,q) [44].
These projections allow us to identify the number of connected and non-connected objects of any kind, year after year, to evaluate the use of spectrum. For instance: imagine a central business district, where the number of vehicles in the peak hour is known. According to the projections, it will be possible to estimate for each year how many of those vehicles are going to be connected to entertainment on board services, or connected to infrastructure for traffic-control services, or will have vehicle-to-vehicle connectivity for semi-autonomous driving.
The main purpose at this stage is to create a future scenario for spectrum contention. We call this a peak case. It represents a case where the spectrum will be highly used. To know the exact number of millions of IoT-connected cars in a country is relatively useless for spectrum forecasting, what is really needed is the density of IoT-connected cars per unit area. A central business district may be a good example for a peak case, providing several connections in the range of coverage of an LTE cell or a traffic control system. This number of devices per hectare (ha = 100 m × 100 m) or square km (1 ha = 1/100 km), is the number that will dispute a certain band of frequency and will determine its efficiency of use. Due to the typical order of magnitude, it is easier to express device densities in devices per hectares ().
4. Spectrum Forecasting Model
The spectrum forecasting model is made of six steps described as follows:
4.1. Definition of Scenarios
The total spectrum calculation will be the sum of independent and parallel calculations for each scenario. A scenario is defined as a group of services and technologies, that use the same band in the same location (coverage area), and therefore contend for or share the spectrum, either in a licensed or an unlicensed case.
4.2. Share of Devices per Service and Technology
Let S be the set of all IoT services identified in your country’s market and be the subset of services in scenario .
Let T be the set all IoT technologies and be the subset of technologies in scenario . The total number of devices per gateway (sink node, base station or access point) can be calculated adding for each service, the number of devices per gateway in the above mentioned peak case . This devices should be distributed among the different technologies in according to distribution ratios derived for the market study. In summary:
where is the number of devices per gateway, for the service s, the technology t and the scenario i in the peak case. Additionally is the fraction of devices that will use the technology t for the service s in the i-th scenario.
When a wireless technology used in a given scenario, is one of cellular nature (either a traditional cellular network or LPWAN), the number of devices is replaced by the number of devices per hectare .
4.3. Offered Traffic
To calculate the offered traffic per cell or per gateway, three additional parameters are needed:
- The average transmission rate (in bits/s): Most of the modern wireless technologies perform some type of link adaptation mechanism, hence the transmission rate of any connected device depends primarily on its distance to the gateway, and additionally on the load factor of the gateway. We use the average between the maximum and minimum transmission rates according to each technology specification.
- The link spectral efficiency (in bits/s/Hz): Based on the average transmission rate and the total bandwidth used for that link.
- The activity factor: Considering that any device is modeled as an on-off source, defines the percentage of activity created by the average device during a connection using the service s in scenario i.
The average transmission rate can be calculated as . Therefore, the offered traffic per service s per scenario i is:
and the total offered traffic per scenario is:
4.4. Required Capacity
To find the required capacity for a given offered traffic, two situations are differentiated:
- High number of devices per gateway: Networks designed for either mMTC or eMBB, i.e., cellular networks or LPWANs, will naturally have an important number of connected devices creating congestion and reducing the network’s performance with delayed or lost packets. Following an ITU recommendation [29], a gateway with these traffic characteristics, should be modeled with an queue with non-peremptory priorities. This model has been known in the literature as the Cobham model [45]. For a short description of the model, the reader is referred to [29], for an applied version the reader is referred to [46].For the Cobham model, the capacity for each scenario is obtained as follows:Each scenario should have several services organized by priority from 1 to n. is the required capacity for the n-th priority service, described as a function of the mean required delay , the packet size variance and the second moment of the packet size . Hence, the maximum capacity among all service priorities is the required capacity (in bits/s) for the i-th scenario. The details of the function in (6) can be found in [29] Section 4.2.
- Low number of devices per gateway: A small number of devices should be one that has a very low probability of creating traffic congestion or a significant delay on the gateway. Short-range communications and private networks may be typical examples. To simplify the model, in this case, the required capacity is assumed to be equal to the offered traffic: .
4.5. Required Spectrum
Calculating the required spectrum is now straightforward: dividing the required capacity by the area spectral efficiency. Particular care should be taken in two aspects:
- The majority of IoT services need mostly (or sometimes even exclusively) spectrum for the uplink. A few services may need exclusively spectrum for the downlink. If a service is bidirectional (i.e., both directions actively send data and not just some control information), the calculation of the required capacity should be done twice and independently: one for the uplink and one for the downlink.
- The spectrum is not only needed for connecting the device to a gateway. Many of the IoT services also include a wireless transport (backhaul) link. It is very likely that this transport link will be provided by a cellular network, but it also needs to be calculated because it will be an additional spectrum need.
The spectrum requirement is calculated adding non-cellular () and cellular () required capacity:
where is the average link spectral efficiency (in bits/s/Hz) and is the average area spectral efficiency (in bits/s/Hz/ha) for the i-th scenario. If the scenario has no share for cellular service, then .
Additionally, the transport backhaul link spectrum (in case of a wireless link) should be calculated for the traffic that uses a wireless transport link () as:
4.6. Adjustments
Some technologies for IoT have not achieved a full grade of maturity, but are crucial for wireless communications and will have an important impact on improving spectral efficiency in the coming years. For this reason, it is unlikely that these technologies could provide spectrum savings (before allocation) but instead, they will simply generate a more efficient use of any of the bands used in the future IoT.
In this paper, we consider two technologies that require adjustments to the calculated spectrum (MIMO and NOMA). Additionally, collisions in excessively congested scenarios will also harm spectral efficiency. We propose to quantify these impacts as follows:
- MIMO: Multiple-input multiple-output systems have been widely used in the last decade. They provide gains in multiple important variables in wireless communications such as: reducing error probability, increasing coverage, increasing the number of served users, or increasing the total capacity (by means of an increase in the spectral efficiency). With recent advances in Massive MIMO technologies and reduced antenna hardware, more IoT devices will benefit in the future. Massive MIMO systems are especially useful for eMBB and multimedia services such as real-time high-resolution video.When MIMO systems are included in any technology (notice that many wireless technologies already include MIMO in their high transmission rates), the new (area) spectral efficiency for the i-th scenario should be modified as:where is the fraction of traffic using a MIMO link, is the spatial correlation factor that depends on antenna separation and reduces the multiplexing gain, and and are the numbers of transmitting and receiving antennae.
- NOMA: Non-Orthogonal Multiple Access has been long known to be optimal in some situations (Multiple Access and Broadcast Channels in Information Theory) and in general more efficient than regular orthogonal mechanisms such FDMA or TDMA, or even better than interference-limited mechanisms such CDMA. Recently, several companies have put research efforts to propose NOMA schemes and implement them on the new 5G cellular networks [47,48]. It is likely that in some years some of these NOMA schemes will be fully deployed, especially for mMTC scenarios, where 3GPP expects densities of one million devices connected in a square km.NOMA schemes could materialize in important gains of spectrum efficiency. An upper-bound expression to quantify these gains is proposed in [49] as follows:therefore:where N is the number of devices using the channel simultaneously and p is the received power for each device. The constant expresses how effective the NOMA gain is and is again the fraction of users using the NOMA scheme.
- Collisions: Many low-power devices and sensors will not be able to handle complex access protocols or advanced receivers that help reduce the interference, hence, neither MIMO nor NOMA schemes are suitable for them. These devices will normally transmit non-urgent information at very low rates, and re-transmissions will be their best option to guarantee reliability. High-density scenarios will undoubtedly generate collisions and channel congestion. Considering each device as an on/off traffic source and using a binomial probability formula, the spectral efficiency can be adjusted as:A flow diagram of the spectrum calculation methodology can be observed in Figure 1.
5. Study Case Implementation: Colombia
In this section, the above-proposed methodology is followed step by step. All studies and evaluations were carried during 2019 and most of the data was collected from 2017. However, IoT and digital dividend bands in Colombia were recently allocated after a long-awaited bidding process. This spectrum allocation has severely delayed the introduction of many IoT services in the country. The main purpose is to forecast IoT spectrum needs in the following ten years.
5.1. Market Study: Technologies and Services
A list of technologies was studied according to all criteria described in Section 3.1 (proximity, ease of use, business model, bands, etc.). The list of technologies can be found in Table 1. After finding a complete list of technologies, a thorough list of services was created, researching through all types of IoT services around the world. These services were focused on Colombia’s economic activity. A key important step is to relate technologies with services. Some of these services (depending on their nature or the carrier technology) will not only need an access link, but also a transport link that could be wireless. If this is the case, some spectrum should also be reserved for this traffic.
The list of all services related to their possible carrier technologies, their transport link, and the main direction of communications per scenario is presented in Table 1.
5.2. Market Study: Market Size and Penetration
To find the market size and IoT penetration, we performed a meticulous search among government entities, to obtain the volumes of devices or objects throughout a 10-year period and the number of actual sales. IoT penetration statistics were considered from two scenarios: an optimistic one from [42] and a pessimistic one from [41]. Both forecasts are summarized in Figure 2, right hand side. To cope with this increase in spectrum use, new networks should increase their capacities in two manners. (i) Increasing their link spectral efficiency, that according to [50], the IMT-2020 minimum requirement for average spectral efficiency is expected to grow up to 9 bits/s/Hz with the deployment of 5G cellular networks. In Colombia, we assume this increase might take place in the following 10 years as can be observed in Figure 2, left-hand side. (ii) For these spectral efficiencies to materialize, the second aspect needed is the increase in teledensity as specified in [51]. Therefore, we also assume a linear teledensity increase up to a factor in the next 10 years, going from 35 ha/cell to 0.3 ha/cell in the urban indoor case. The same factor is applied to suburban and rural scenarios.
5.3. Market Study: Number of Devices
According to all statistics and time-series predictions, we constructed a peak case for each service. These are summarized in Table 2. The attentive reader should consider that Colombian cities are densely populated. For all peak cases, we have considered the capital Bogota (one of the most densely populated cities in the world), where the density averages 250 inhabitants per hectare.
5.4. Spectrum Forecasting: Scenarios’ Definition
The next step is the definition of the scenarios: a given location or coverage area and a specific frequency band where IoT services will contest for spectrum access. We have initially identified a set of places, locations, or areas where IoT services are offered or will be offered and are presented in the following list:
- Home/Office: Residential and offices environments requiring mainly WLAN connectivity for Internet access.
- Hospital: Medical centers at all tiers.
- Industrial: Factories, warehouses, and freight ports (either terrestrial, maritime or aerial).
- Street: Urban public space where transport and mobility services will take place.
- Road: Rural roads and highways with services related to passenger and freight transportation.
- Urban: All urban space for smart city services non-related to mobility or transportation.
- Rural: All rural spaces where agriculture, livestock, and environmental services take place.
Then, a list of IoT frequency bands was obtained from the list of technologies and standards, combined with bands available or proposed to be used in Colombia. These bands are the actual and future bands for IoT services: 400–700 MHz, 800–900 MHz, 2300 MHz, 2400–3700 MHz, 5800 MHz and any bands in the mmW range specially from 26 to 60 GHz.
5.5. Spectrum Forecasting: Share of Devices per Services and Technology
Having defined the scenarios, the following step is finding the share of each technology in each scenario’s peak case. This is again based on all the statistics collected for the market study. Notice that for some scenarios (2, 3, and 10), a cellular access link is not considered in the following 10 years. This is mainly due to the difficulty for cellular networks to reach the short-range communications market.
5.6. Spectrum Forecasting: Offered Traffic
We then proceed to calculate the offered traffic per scenario according to Equation (4) using an average transmission rate, an average link spectral efficiency (obtained from each technology standard document), and an activity factor calculated as weighted average following information from [52]. Cellular technologies (including LPWANs) are also expressed in terms of area spectral efficiency to obtain offered traffic in bits per second per hectare (b/s/ha). While non-cellular technologies use only link spectral efficiency, to obtain offered traffic in bits per second (b/s, per gateway or sink node).
5.7. Spectrum Forecasting: Required Capacity
The required capacity in non-cellular or non-congested scenarios is exactly the offered traffic calculated in the previous step. For services carried over cellular networks, the Cobham model is carefully applied. Several services in the same scenario must be organized by non-peremptory priority (which means, the server or gateway gives priority, after serving the actual packet). As this model is based on the mean packet size (and its second moment, i.e., ) and the mean required delay, if a group of services sets very stringent values in both parameters, the required capacity would be extremely high, since it needs a system able to process both noticeably big packets and with truly short delays. This could be the case, for example in smart car services: on-board entertainment systems need large multimedia packets and on-board safety systems need short delays. We recommend separating these services in different scenarios since they would certainly be offered in different spectrum bands.
Results are shown in Table 3.
6. Study Case Results: Colombia
Spectrum Forecasting: Required Spectrum
The amount of required spectrum is a straightforward calculation after obtaining the required capacity by means of link or area spectral efficiency. However, this quantity is of relatively low importance. The different bands and coverage where the full IoT spectrum would be spread make spectrum requirements tricky to analyze.
For example, medical devices in need of a Body Area Network might need some spectrum, but the very short coverage of these networks makes that spectrum chunk reusable. These considerations should guide further discussions about the type of spectrum (licensed, unlicensed, or new sharing schemes) that should be allocated to different services. Figure 3 shows the coverage requirement per scenario. Notice that 6 out of 14 scenarios require very short-range coverage (local, personal, or around a human body).
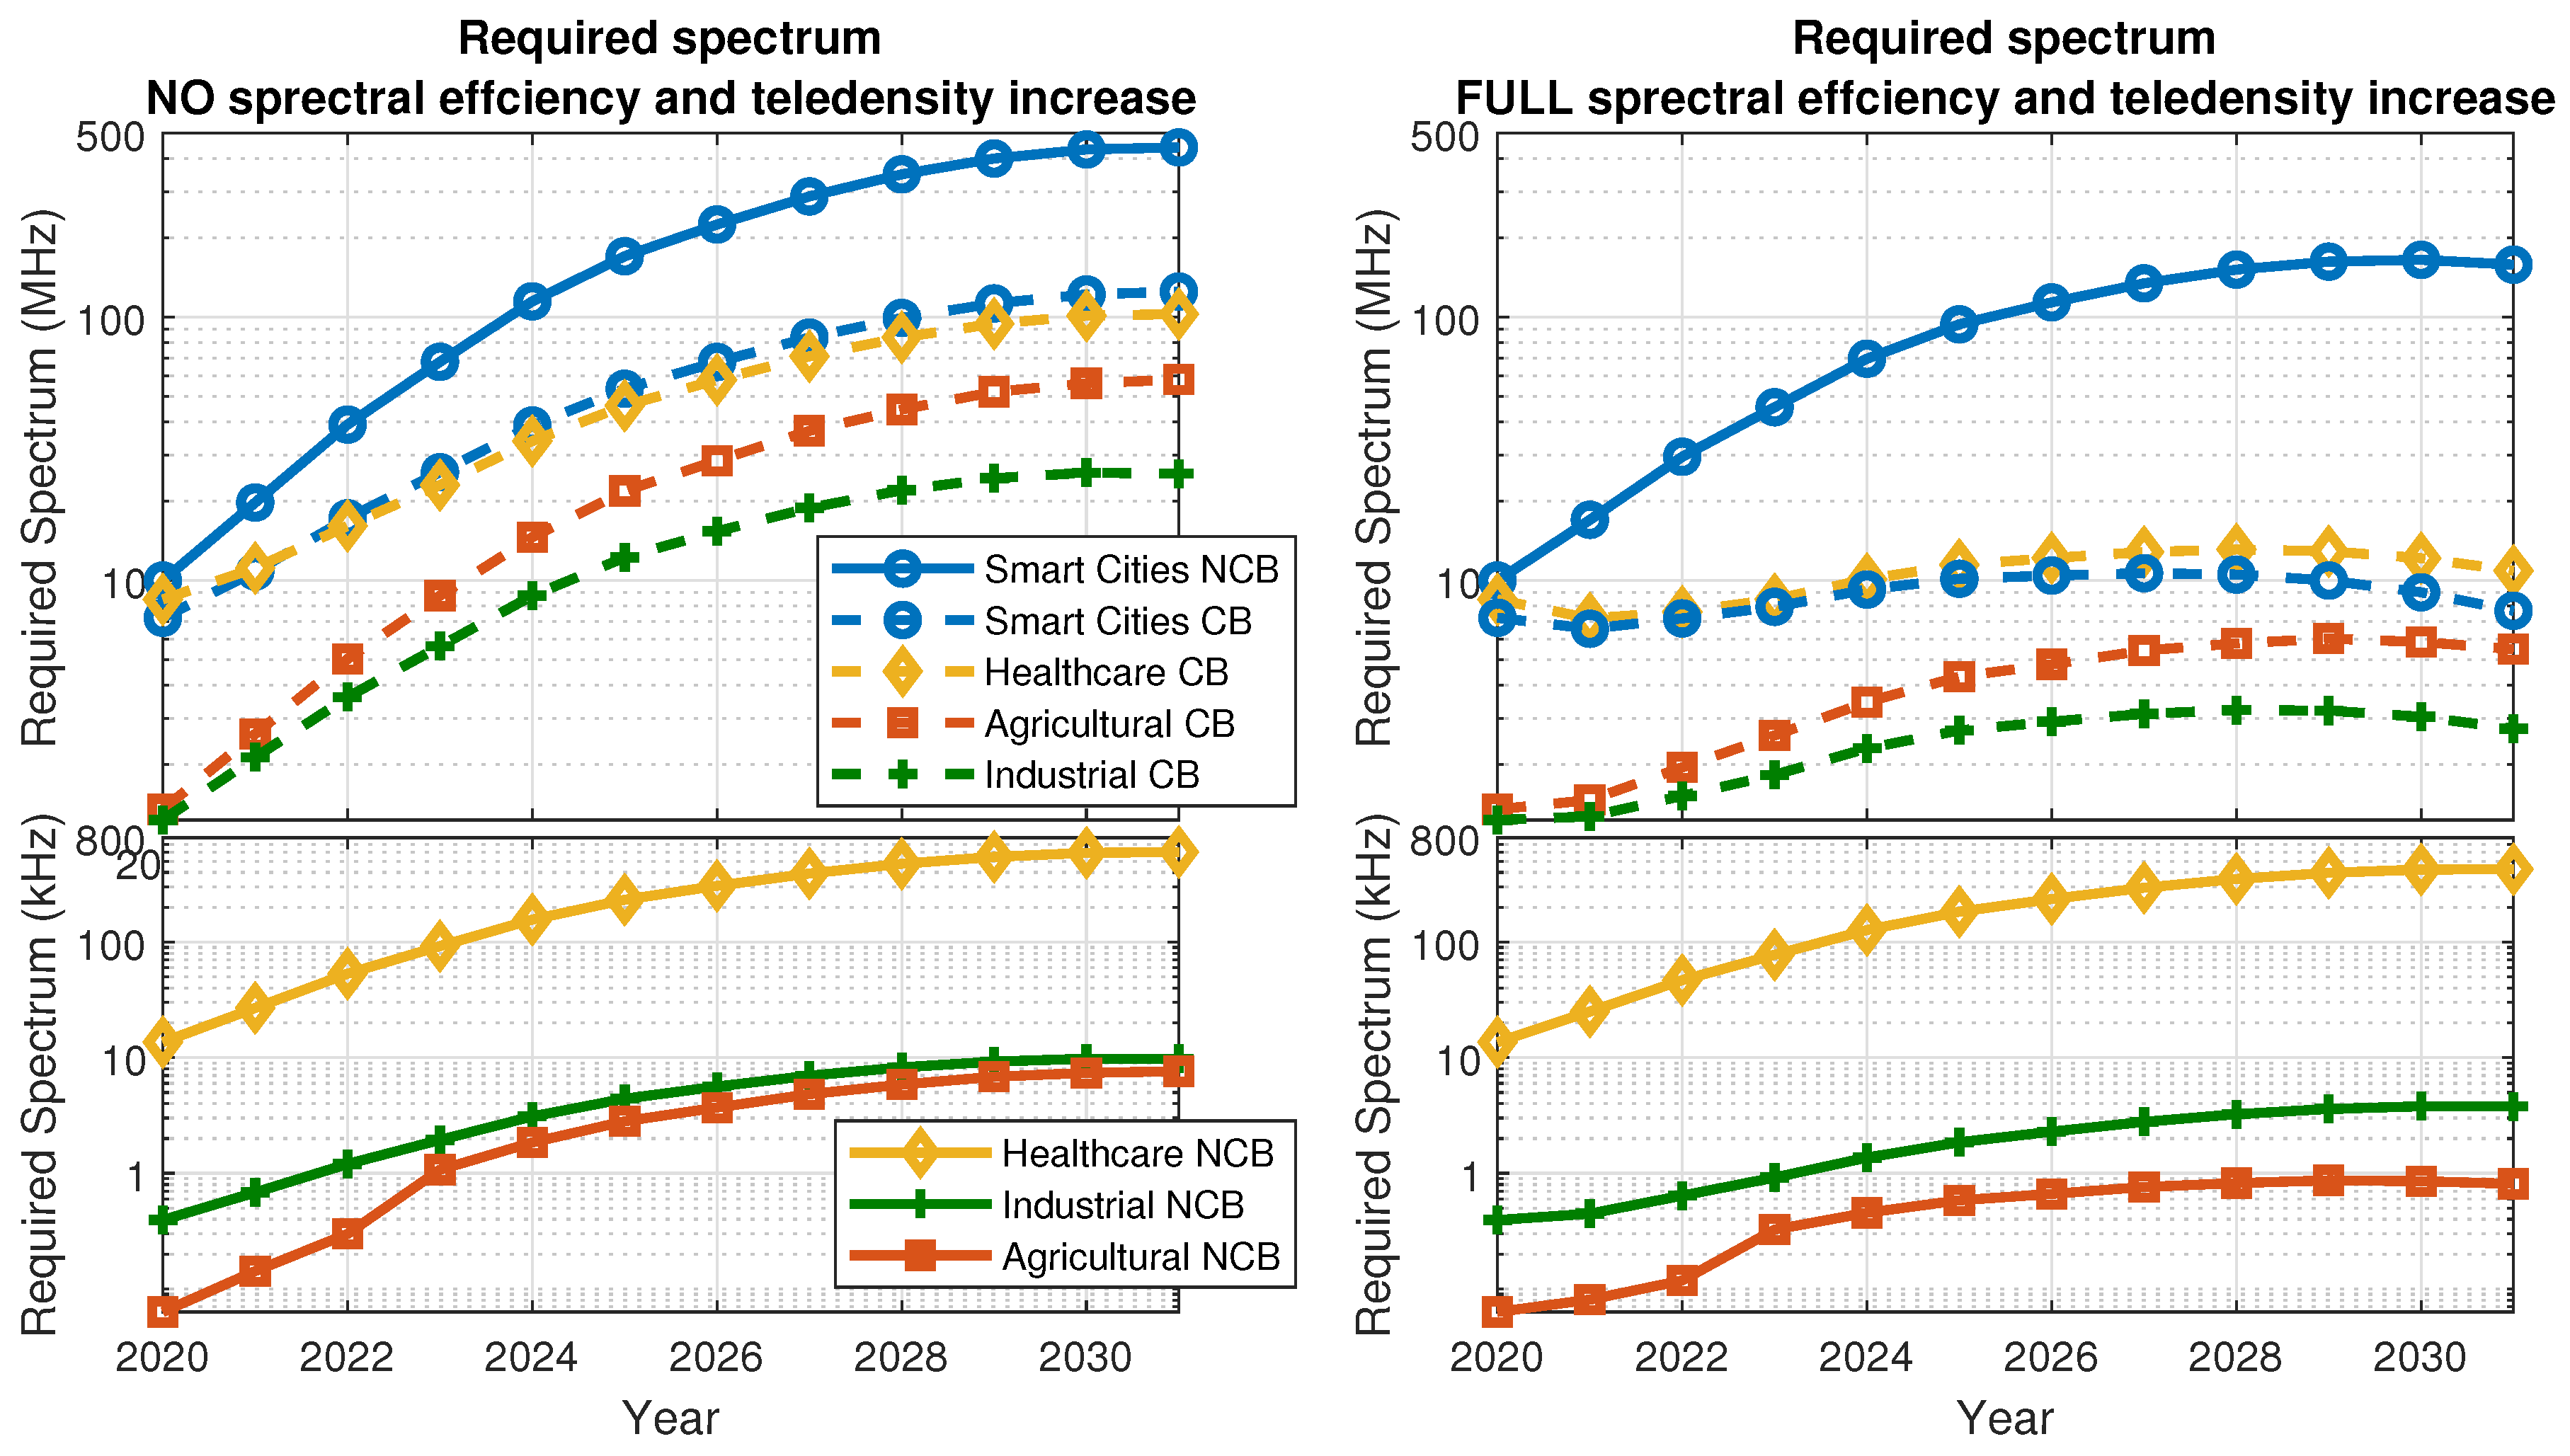
It is also important to analyze the spectrum requirement in terms of the economic sector. For this purpose, we have identified four main economic sectors, driving the needs for IoT spectrum, as follows. (i) Industrial: including machinery tracking, inventories, freight, and fleet tracking. (ii) Agricultural: including harvesting logistics, greenhouse lighting, environmental sensors, cattle tracking, and air and water monitoring. (iii) Smart cities: including home automation, Gbit rate multimedia, urban tolls, smart traffic lights, street cameras and sensors, security cameras, smart lighting, smart parking, ambulance network, and smart metering. (iv) Healthcare: including home healthcare, home hospitalization, smart beds, and vital signs monitoring. Some of these services are more adequate to be carried directly by the cellular networks hence, we split the spectrum requirements into cellular bands (CB) and non-cellular bands (NCB).
Figure 4 shows the required spectrum per economic sector from 2020 to 2030. On the left-hand side, calculations are made without spectral efficiency increase and without teledensity increase. On the right-hand side, the calculations were made considering the increase in both spectral efficiency and teledensity for IMT-2020 minimum requirements according to ITU as explained in Section 5.2. Comparing both sides in 2030, the teledensity and spectral efficiencies could provide important spectrum savings. In most sectors, some tens of MHz become just a few MHz. One order of magnitude (around 80%) of the spectrum would be saved if the infrastructure is effectively installed. This result urges solid coordination between operators, vendors, regulators, and all involved authorities to deploy and operate the network’s infrastructure successfully.
The requirements for NCB in Industrial, Agricultural, and Healthcare are particularly low and are shown at the bottom graphs. Carried by cellular networks, Industrial and Agricultural services may add up to some tens of MHz by 2030; however, the role of non-cellular standards is foreseen as marginal for these sectors.
The smart cities sector also requires substantial portions of spectrum in both CB and NCB. In NCB the main component is a LAN-coverage spectrum for Gbit multimedia services in homes and offices, and security cameras whose access link should be wireless in some years. Despite the availability of fiber optics in this scenario, placing the cameras in optimal locations should be cheaper with wireless links that may be operational in mm-Wave bands. In the CB spectrum, services for smart cars dominate the trend, especially for onboard entertainment systems. Part of these requirements should be covered with traditional bands using spectrum re-farming for LTE-A and 5G NR. Other services should be carried on higher bands (like 5.8 GHz) that are likely to be allocated for V2X cellular communications.
Since it is difficult to predict if 5G and other IoT networks will be progressively installed and to which extent in Colombia during the next decade; therefore, from now on, all results are calculated for an intermediate case where both the spectral efficiency and teledensities are increased linearly in 10 years, but just to half of the values suggested by ITU for IMT-2020 requirements detailed in [50].
Regarding all different coverage areas in Figure 5a, NCB present very low spectrum requirements except for Home/office where residential Gbit internet connections will take place and Street where security and traffic cameras will require most of the spectrum. Both results will occur in a mmWave band as can be seen in Figure 5b and require only local spectrum as is the case of both scenarios 3 and 10 as shown in Figure 3. The NCB add a total of 232 MHz, but 231 MHz of them are in the mmWave band. On the other side, CB will require around 10 MHz in every coverage area with a peak in health-related areas, where advanced healthcare services will increase in popularity as the population ages.
Regarding the frequency bands, the mmWave band has the largest requirement, which should not be difficult to meet due to the large spectrum availability in mmW frequency bands. The other NCB should also be easy to allocate since all of them are below 1 MHz bandwidth requirement. In the cellular bands, there will be important amounts of bandwidth to allocate. The total amount is 55 MHz with almost 27 MHz in the urban, rural, and industrial coverage areas in the Sub-1GHz bands. This spectrum might not be easily available, but not releasing it might strongly reduce IoT development in the country.
Finally, Figure 6 summarizes the spectrum requirement for 2030. The largest portion in the mmWave band for Street and Home/Office coverage areas, important spectrum amounts are foreseen in CB across all frequencies and coverage areas and a minor role for other technologies in NCB. In our consideration, in the next 10 years, cellular operators will not use mmWave spectrum in Colombia, which will probably be the case in the mid-term future.
7. Conclusions
In this paper, a novel spectrum forecasting methodology was proposed and implemented for IoT. The methodology is fed from a market study for calculating the strength of penetration of IoT technologies in a country’s economic activity to find the density of devices, the technologies, services, frequency bands, and spectral efficiency that will exist in the future IoT scenarios. The methodology consists of five steps that should be carefully adapted to each country’s IoT situation.
We applied the model in Colombia. Data was collected from 2017 and forecasting was projected until 2030. The market study highlights approximately of IoT penetration by 2030, an average of fewer than 5 devices per gateway by 2030, for non-cellular IoT services in places such as home/office, hospitals, roads, and rural areas and a higher number of devices deployed in urban spaces with over 50 devices per hectare in average for smart metering and lighting systems. Fourteen scenarios for spectrum contention are considered over 20 different IoT services where urban services are predominant. In consequence, the study case results in Colombia show a higher demand of spectrum for IoT services in smart cities than in other sectors such as healthcare or agriculture. In particular, non-cellular frequency bands will be highly demanded even more than cellular bands for smart city services. In addition, home/office will be highly demanded in the non-cellular mmW frequency band, mainly because of the Gbit multimedia service; but this only requires a short-range coverage. This band will likely be also occupied with wireless security cameras in the streets.
Comparing spectrum demands with and without teledensity and spectral efficiency increases reveals significant spectrum savings if the increase occurs. This highlights the importance of the efforts that authorities and operators should carry out together to overcome a rising aversion to 5G and IoT technologies from the general public.
The most important spectrum requirements come from multimedia or video services: video cameras in streets, Gbit Internet access in homes and offices, both should take place mainly in NC unlicensed bands. Additionally, entertainment systems for cars, due to their mobile nature, pose the largest burden in spectral efficiency terms, although the total spectrum requirement will probably depend on market factors.
Sensors and M2M devices for environmental and agricultural services will not represent important spectrum demands and its allocation should not be difficult, but correctly planning for these services would guarantee its timely development with a diverse ecosystem that should bring larger benefits to the final user in a stronger, inclusive, digital society.
Author Contributions
Conceptualization, D.J.-R. and M.P.; methodology, D.J.-R.; software, D.J.-R.; validation, M.P.; formal analysis, M.P.; investigation, M.P.; resources, M.P.; data curation, D.J.-R.; writing–original draft preparation, all authors; writing–review and editing, all authors; visualization, D.J.-R.; supervision, M.P.; project administration, M.P.; funding acquisition, M.P. All authors have read and agreed to the published version of the manuscript.
Funding
This research was funded by the National Spectrum Agency of Colombia (ANE) and the Pontificia Universidad Javeriana through the research project titled ”Spectrum Forecasting Model for IoT Services in Colombia” ID number 7778, Covenant number 056-2017.
Data Availability Statement
The data presented in this study are available on request from the corresponding author.
Acknowledgments
The authors would like to thank Diana Rincon and Fabian Herrera for their support during the development of the research project, and their valuable suggestion in the review of this work. Additional thanks to the Electronics Department and the Electronics Laboratory of the Pontificia Universidad Javeriana, for providing the resources required to conduct this study.
Conflicts of Interest
The authors declare no conflict of interest.
Abbreviations
The following abbreviations are used in this manuscript:
| eMBB | enhanced Mobile Broadband |
| URLLC | Ultra Reliable Low-Latency Communications |
| mMTC | Massive Machine-Type Communications |
| M2M | machine-to-machine |
| LPWAN | Low-Power Wide Area Networks |
| ISM | Industrial, Scientific and Medical |
| ITU | International Telecommunication Union |
| IMT | International Mobile Telecommunications |
| NOMA | Non-Orthogonal Multiple Access |
| TDMA | Time-Division Multiple Access |
| FDMA | Fequency-Division Multiple Access |
| CDMA | Code Division Multiple Access |
| MIMO | Multiple-input Multiple-output |
References
- Borgia, E. The internet of things vision: Key features, applications and open issues. Comput. Commun. 2014, 54, 1–31. [Google Scholar] [CrossRef]
- Metis. Deliverable D6.6 Final Report on the METIS 5G System Concept and Technology Roadmap. 2014. Available online: https://metis2020.com/wp-content/uploads/deliverables/METIS_D6.6_v1.pdf (accessed on 29 August 2021).
- Cisco Systems. Cisco Visual Networking Index: Forecast and Methodology, 2015–2020. In Cisco White Paper; CISCO: San Jose, CA, USA, 2014; pp. 1–40. [Google Scholar]
- Ericsson. Ericsson Mobility Report (June 2019). In Ericsson White Paper; Ericsson: Kista, Sweeden, 2019; p. 36. [Google Scholar]
- Harald Bauer, J.V. The Internet of Things: Sizing up the opportunity. McKinsey White Pap. 2014, 4, 10. [Google Scholar]
- Ofcom. M2M Application Characteristics and Their Implications for Spectrum Final Report. Technical Report. May 2014. Available online: https://www.ofcom.org.uk/__data/assets/pdf_file/0040/68989/m2m_finalreportapril2014.pdf (accessed on 29 August 2021).
- Ofcom. More Radio Spectrum for the Internet of Things. Ofcom Report. 2015. Available online: https://www.ofcom.org.uk/__data/assets/pdf_file/0033/83499/more_radio_spectrum_internet_of_things.pdf (accessed on 29 August 2021).
- European Commission. A Spectrum Roadmap for IoT Opinion on the Spectrum Aspects of the Internet-of-Things (IoT) Including M2M. 2016. Available online: https://circabc.europa.eu/sd/a/a0faa1a5-ca41-42c3-83d5-561b197419b0/RSPG17-006-Final_IoT_Opinion.pdf (accessed on 29 August 2021).
- Schröder, F. 5G: New Opportunities? In Future Telco: Successful Positioning of Network Operators in the Digital Age; Krüssel, P., Ed.; Springer International Publishing: Cham, Switzerland, 2019; pp. 63–74. [Google Scholar] [CrossRef]
- Vitturi, S.; Zunino, C.; Sauter, T. Industrial Communication Systems and Their Future Challenges: Next-Generation Ethernet, IIoT, and 5G. Proc. IEEE 2019, 107, 944–961. [Google Scholar] [CrossRef]
- Agiwal, M.; Saxena, N.; Roy, A. Towards Connected Living: 5G Enabled Internet of Things (IoT). IETE Tech. Rev. 2019, 36, 190–202. [Google Scholar] [CrossRef]
- 5GAA. White Paper on ITS Spectrum Utilization in the Asia Pacific Region. Technical Report. 2018. Available online: https://5gaa.org/news/white-paper-on-its-spectrum-utilization-in-the-asia-pacific-region/ (accessed on 29 August 2021).
- CITEL. CCP.II-Radio 30th Meeting: Preliminary Views for WRC-19. Available online: https://www.citel.oas.org/en/SiteAssets/PCCII/WRC/CCPII-2017-30-4356c1_i.pdf (accessed on 13 November 2018).
- ITU-R. WRC-19 Candidate Bands (AI 1.13). Regional Positions. Available online: https://www.itu.int/en/ITU-R/seminars/rrs/RRS-17-Americas/Documents/Forum/9_ITU%20Diana%20Tomimura.pdf (accessed on 13 November 2018).
- Voicu, A.M.; Simi, L. Survey of Spectrum Sharing for Inter-Technology Coexistence. arXiv 2018, arXiv:1712.08589v2. [Google Scholar] [CrossRef] [Green Version]
- Qualcomm Technologies. Spectrum for 4G and 5G. Technical Report. 2017. Available online: https://www.qualcomm.com/media/documents/files/spectrum-for-4g-and-5g.pdf (accessed on 13 November 2018).
- Bairagi, A.K.; Abedin, S.F.; Tran, N.H.; Niyato, D.; Hong, C.S. QoE-enabled unlicensed spectrum sharing in 5g: A game-Theoretic approach. IEEE Access 2018, 6, 50538–50554. [Google Scholar] [CrossRef]
- Zhang, L.; Xiao, M.; Wu, G.; Alam, M.; Liang, Y.C.; Li, S. A Survey of Advanced Techniques for Spectrum Sharing in 5G Networks. IEEE Wirel. Commun. 2017, 24, 44–51. [Google Scholar] [CrossRef]
- Zhou, Z.; Jia, Y.; Chen, F.; Tsang, K.; Liu, G.; Han, Z. Unlicensed Spectrum Sharing: From Coexistence to Convergence. IEEE Wirel. Commun. 2017, 24, 94–101. [Google Scholar] [CrossRef]
- Joshi, M.; Hadi, T.H. A Review of Network Traffic Analysis and Prediction Techniques. arXiv 2015, arXiv:1507.05722. [Google Scholar]
- Cortez, P.; Rio, M.; Rocha, M.; Sousa, P. Internet Traffic Forecasting using Neural Networks. In Proceedings of the 2006 IEEE International Joint Conference on Neural Network Proceedings, Vancouver, BC, Canada, 16–21 July 2006; pp. 2635–2642. [Google Scholar] [CrossRef] [Green Version]
- Feng, H.; Shu, Y. Study on network traffic prediction techniques. In Proceedings of the 2005 International Conference on Wireless Communications, Networking and Mobile Computing, Wuhan, China, 26 September 2005; Volume 2, pp. 1041–1044. [Google Scholar] [CrossRef]
- Vinayakumar, R.; Soman, K.P.; Poornachandran, P. Applying deep learning approaches for network traffic prediction. In Proceedings of the 2017 International Conference on Advances in Computing, Communications and Informatics (ICACCI), Udupi, India, 13–16 September 2017; pp. 2353–2358. [Google Scholar] [CrossRef]
- Ramakrishnan, N.; Soni, T. Network Traffic Prediction Using Recurrent Neural Networks. In Proceedings of the 2018 17th IEEE International Conference on Machine Learning and Applications (ICMLA), Orlando, FL, USA, 17–20 December 2018; pp. 187–193. [Google Scholar] [CrossRef]
- Yang, H.; Li, X.; Qiang, W.; Zhao, Y.; Zhang, W.; Tang, C. A network traffic forecasting method based on SA optimized ARIMA–BP neural network. Comput. Netw. 2021, 193, 108102. [Google Scholar] [CrossRef]
- Wang, Z.; Hu, J.; Min, G.; Zhao, Z.; Wang, J. Data-Augmentation-Based Cellular Traffic Prediction in Edge-Computing-Enabled Smart City. IEEE Trans. Ind. Informat. 2021, 17, 4179–4187. [Google Scholar] [CrossRef]
- Nie, L.; Ning, Z.; Obaidat, M.S.; Sadoun, B.; Wang, H.; Li, S.; Guo, L.; Wang, G. A Reinforcement Learning-Based Network Traffic Prediction Mechanism in Intelligent Internet of Things. IEEE Trans. Ind. Informat. 2021, 17, 2169–2180. [Google Scholar] [CrossRef]
- Jiang, N.; Deng, Y.; Nallanathan, A.; Yuan, J. A Decoupled Learning Strategy for Massive Access Optimization in Cellular IoT Networks. IEEE J. Select. Areas Commun. 2021, 39, 668–685. [Google Scholar] [CrossRef]
- ITU. (ITU-R M.1768-1) Methodology for Calculation of Spectrum Requirements for the Terrestrial Component of International Mobile Telecommunications. Technical Report. 2013. Available online: https://www.itu.int/dms_pubrec/itu-r/rec/m/R-REC-M.1768-1-201304-I!!PDF-E.pdf (accessed on 29 August 2021).
- Zhang, Y.; Xiong, L.; Jiang, W.; Ai, B. Analysis and research on spectrum requirements of LTE for railways. In Proceedings of the 6th International Conference on Wireless, Mobile and Multi-Media (ICWMMN 2015), Beijing, China, 20–23 November 2015; pp. 83–86. [Google Scholar] [CrossRef]
- Kusumawati, D.; Setiawan, D.; Suryanegara, M. Spectrum requirement for IoT services: A case of Jakarta smart city. In Proceedings of the 2017 IEEE International Conference on Communication, Networks and Satellite (Comnetsat), Semarang, Indonesia, 5–7 October 2017; pp. 21–25. [Google Scholar] [CrossRef]
- Kusumawati, D.; Suryanegara, M.; Ariyanti, S. IoT spectrum requirement for smart transportation. In Proceedings of the 2017 15th International Conference on Quality in Research (QiR): International Symposium on Electrical and Computer Engineering, Nusa Dua, Bali, Indonesia, 24–27 July 2017; pp. 267–271. [Google Scholar] [CrossRef]
- Kusumawati, D.; Suryanegara, M. Spectrum requirement for IoT health sector in Indonesia. In Proceedings of the 2016 IEEE 3rd International Symposium on Telecommunication Technologies (ISTT), Kuala Lumpur, Malaysia, 28–30 November 2016; pp. 115–119. [Google Scholar] [CrossRef]
- Tsai, W.Y.; Chou, T.C.; Chen, Y.H.; Jan, P.T. A 5G Spectrum Demanding Estimation Framework Considering Coalition Formation of Taiwan Telecommunication Operator. J. Internet Technol. 2021, 22, 543–555. [Google Scholar]
- ITU. (ITU-R M.2290) Future Spectrum Requirements Estimate for Terrestrial IMT. Ser. ITU-R Recommend. 2013. Available online: https://www.itu.int/dms_pub/itu-r/opb/rep/R-REP-M.2290-2014-PDF-E.pdf (accessed on 29 August 2021).
- Cuevas Ruíz, J.L. Internet de las Cosas: Demanda Espectral en México. Revista Direito Estado Telecomunicações 2019, 11, 47–62. [Google Scholar]
- Čolaković, A.; Hadžialić, M. Internet of Things (IoT): A review of enabling technologies, challenges, and open research issues. Comput. Netw. 2018, 144, 17–39. [Google Scholar] [CrossRef]
- Gallego, J.M.; Gutiérrez, L.H.; Lee, S.H. A firm-level analysis of ICT adoption in an emerging economy: Evidence from the Colombian manufacturing industries. Ind. Corp. Chang. 2015, 24, 191–221. [Google Scholar] [CrossRef] [Green Version]
- Juniper Research. IoT: The Internet of Transformation 2018—Whitepaper. 2018. Available online: https://www.reasonwhy.es/sites/default/files/iot-the-internet-of-transformation-2020-jupiter_research.pdf (accessed on 29 August 2021).
- Research, M. Global M2M Market to Grow to 27 Billion Devices, Generating USD1.6 Tril-Lion Revenue in 2024. Available online: https://machinaresearch.com/news/ (accessed on 19 September 2019).
- Rebbeck, T.; Mackenzie, M.; Afonso, N. Low-Powered Wireless Solutions Have the Potential to Increase the M2M Market by over 3 Billion Connections Key Messages Overall LPWA Opportunity. Anal. Mason. 2014. Available online: https://docplayer.net/746686-Low-powered-wireless-solutions-have-the-potential-to-increase-the-m2m-market-by-over-3-billion-connections.html (accessed on 29 August 2021).
- Analytics, S. Internet of Things Now Numbers 22 Billion Devices However, Where Is The Revenue? Available online: https://news.strategyanalytics.com/press-release/iot-ecosystem/strategy-analytics-internet-things-now-numbers-22-billion-devices-where (accessed on 19 September 2019).
- ITU. ICT Development Index 2017. Available online: http://www.itu.int/net4/ITU-D/idi/2017/index.html (accessed on 27 September 2019).
- Enders, W. Applied Econometric Time Series, 4th ed.; Wiley: Hoboken, NJ, USA, 2014; p. 498. [Google Scholar]
- Cobham, A. Priority Assignments in Waiting Line Problems. J. Oper. Res. Soc. Am. 1954. Available online: https://0-pubsonline-informs-org.brum.beds.ac.uk/doi/abs/10.1287/opre.2.1.70 (accessed on 29 August 2021). [CrossRef]
- Irnich, T.; Walke, B. Spectrum estimation methodology for next generation wireless systems. In Proceedings of the IEEE 15th International Symposium on Personal, Indoor and Mobile Radio Communications, Barcelona, Spain, 5–8 September 2004; pp. 1957–1962. [Google Scholar]
- Islam, S.M.; Avazov, N.; Dobre, O.A.; Kwak, K.S. Power-Domain Non-Orthogonal Multiple Access (NOMA) in 5G Systems: Potentials and Challenges. IEEE Commun. Surv. Tutor. 2017, 19, 721–742. [Google Scholar] [CrossRef] [Green Version]
- Wu, Z.; Lu, K.; Jiang, C.; Shao, X. Comprehensive Study and Comparison on 5G NOMA Schemes. IEEE Access 2018, 6, 18511–18519. [Google Scholar] [CrossRef]
- Jaramillo-Ramirez, D. Interference Mitigation Techniques for 4G Networks. Ph.D. Thesis, Supélec, Hotel le Village, France, 2015. [Google Scholar]
- ITU. Minimum Requirements Related to Technical Performance for IMT-2020 Radio Interface(s). Work. Party 5D. 2017. Available online: https://www.itu.int/dms_pub/itu-r/opb/rep/R-REP-M.2410-2017-PDF-E.pdf (accessed on 29 August 2021).
- ITU. Guidelines for Evaluation of Radio Interface Technologies for IMT-Advanced. 2017. Available online: https://docplayer.net/2297468-Guidelines-for-evaluation-of-radio-interface-technologies-for-imt-advanced.html (accessed on 29 August 2021).
- ITU-R. (ITU-R M. 2072) World Mobile Telecommunication Market Forecast 2005. Available online: https://www.itu.int/dms_pub/itu-r/opb/rep/R-REP-M.2072-2006-PDF-E.pdf (accessed on 29 August 2021).
Figure 1.
Flow diagram for IoT spectrum calculation methodology.

Figure 2.
Left: Ideal spectral efficiency increase in a 10-year period. Right: Optimistic and pessimistic 10-year forecast for IoT penetration [41,42].

Figure 3.
Coverage requirement per scenario (Body, Personal, Local, Metropolitan and Wide Area Networks). Short range coverage allows more efficient and intensive sharing spectrum schemes. Scenarios 2, 3 and 10 will not have competition from cellular networks.
Figure 3.
Coverage requirement per scenario (Body, Personal, Local, Metropolitan and Wide Area Networks). Short range coverage allows more efficient and intensive sharing spectrum schemes. Scenarios 2, 3 and 10 will not have competition from cellular networks.

Figure 4.
Cellular band (CB) and non-cellular band (NCB) requirements per economic sector.

Figure 5.
Cellular and non-cellular spectrum requirement increase from 2021 to 2030: (a) per coverage area and (b) per frequency bands.
Figure 5.
Cellular and non-cellular spectrum requirement increase from 2021 to 2030: (a) per coverage area and (b) per frequency bands.

Figure 6.
Required spectrum in 2030 dis-aggregation: frequency bands and bandwidths.


Table 1.
A list of services, possible carrier technologies, transport link and the main direction of their access link.
Table 1.
A list of services, possible carrier technologies, transport link and the main direction of their access link.
| Scenario | Transport Link | Technologies | Services | Main Link |
|---|---|---|---|---|
| Scn # 1 | Cellular minority | 802.15.6, Cellulars | Home healthcare | UL/DL |
| Home hospitalization | UL/DL | |||
| Scn # 2 | Cable | Wi-Fi, ZB, BLE | Home Automation | UL/DL |
| Scn # 3 | Cable | 802.11ad, 802.15.3c | Gbit multimedia | DL |
| Scn # 4 | Cellular minority | 802.15.6, Cellulars | Smart beds | UL/DL |
| Vital signs monitoring | UL | |||
| Scn # 5 | Cellular minority | Wi-Fi, Cellulars | Smart beds | UL/DL |
| Vital signs monitoring | UL | |||
| Scn # 6 | Partially cellular | RFID, Cellulars | Machinery tracking | UL |
| Inventory | UL | |||
| Scn # 7 | Partially cellular | LPWAN, Cellulars | Machinery tracking | UL |
| Inventory | UL | |||
| Scn # 8 | Mainly cellular | RFID, Cellulars | Urban tolls | UL |
| Traffic lights | UL | |||
| Scn # 9 | Partially cellular | C-V2X, 802.11p, Cellulars | Traffic cameras and sensors | UL |
| Smart cars | UL/DL | |||
| Traffic lights | UL | |||
| Scn # 10 | Cable | 802.11ad, 802.15.3c | Security cameras | UL |
| Traffic cameras and sensors | UL | |||
| Scn # 11 | Mainly cellular | RFID, Cellulars | Freight tracking | UL |
| Fleet tracking | UL | |||
| Scn # 12 | Mainly cellular | C-V2X, 802.11p, Cellulars | Fleet tracking | UL |
| Smart cars | UL/DL | |||
| Scn # 13 | Partially cellular | LPWAN, Cellulars | Smart metering | UL |
| Lightning | UL | |||
| Air/water monitoring | UL | |||
| Ambulance network | UL | |||
| Street parking | UL | |||
| Scn # 14 | Partially cellular | LPWAN, Cellulars | Harvesting logistics | UL |
| Employee tracking | UL | |||
| Smart Greenhouse | UL | |||
| Environmental sensors | UL | |||
| Cattle tracking | UL | |||
| Air/water monitoring | UL |
Table 2.
IoT expected penetration per service (peak case).
| 100% Penetration | 1st Year Penetration | ||||
|---|---|---|---|---|---|
| Home/Office | Scenario | # Dev/Gateway | # Dev/ha | # Dev/Gateway | # Dev/ha |
| Home heathcare | 1 | 1 | 55 | 0.012 | 0.638 |
| Home hospitalization | 1 | 1 | 55 | 0.012 | 0.638 |
| Home automation | 2 | 3 | 165 | 0.035 | 1.914 |
| Gbit Multimedia | 3 | 2 | 220 | 0.023 | 2.552 |
| Hospital | |||||
| Smart beds | 4, 5 | 10 | 51.064 | 0.116 | 0.592 |
| Vital signs monitoring | 4, 5 | 1 | 110 | 0.012 | 1.276 |
| Industrial | |||||
| Machinery tracking | 6, 7 | 0.422 | 0.422 | 0.005 | 0.005 |
| Inventories | 6, 7 | 4.218 | 4.218 | 0.046 | 0.046 |
| Street | |||||
| Traffic cameras and sensors | 9, 10 | 5 | 20 | 0.058 | 0.232 |
| Urban tolls | 8 | 1 | 1 | 0.012 | 0.012 |
| Smart cars | 9, 12 | 1.399 | 1.399 | 0.016 | 0.016 |
| Traffic lights | 8, 9 | 1 | 8 | 0.012 | 0.093 |
| Security cameras | 10 | 3 | 20 | 0.035 | 0.232 |
| Road | |||||
| Freight tracking | 11 | 0.353 | 0.4 | 0.353 | 0.4 |
| Fleet tracking | 11, 12 | 0.833 | 0.8 | 0.010 | 0 |
| Urban | Scenario | # Dev/Gateway | # Dev/ha | # Dev/Gateway | # Dev/ha |
| Smart metering | 13 | 47.980 | 47.980 | 0.557 | 0.557 |
| Smart lightning | 13 | 87.191 | 87.191 | 1.011 | 1.011 |
| Air and water monitoring | 13, 14 | 1 | 1 | 0.012 | 0.012 |
| Ambulance network | 13 | 0.013 | 0.013 | 1.5 × 10 | 1.5 × 10 |
| Street parking | 13 | 20 | 80 | 0.232 | 0.928 |
| Rural | |||||
| Harvesting logistics | 14 | 0.011 | 0.011 | 0.011 | 0.011 |
| Employee tracking | 14 | 0.022 | 0.022 | 0.022 | 0.022 |
| Smart greenhouse | 14 | 0.011 | 0.011 | 0.011 | 0.011 |
| Environmental sensors | 14 | 1.526 | 1.526 | 1.526 | 1.526 |
| Cattle tracking | 14 | 1.650 | 1.650 | 0.019 | 0.019 |
Table 3.
Offered traffic, required capacity and required spectrum with and without spectral efficiency and teledensity increase, for Cellular (C), Non-Cellular (NC) and LPWAN (LPW) services, per scenario.
Table 3.
Offered traffic, required capacity and required spectrum with and without spectral efficiency and teledensity increase, for Cellular (C), Non-Cellular (NC) and LPWAN (LPW) services, per scenario.
| Offered Traffic (2030) | Required Capacity (2030) | Required Spectrum (2030) (without | with Spect. Eff. Increase) | ||||||||
|---|---|---|---|---|---|---|---|---|---|---|
| Scn | Services | C (b/s/ha) | NC (b/s) | LPW (b/s/ha) | C (b/s/ha) | NC (b/s) | LPW (b/s/ha) | C (Hz) | NC (Hz) | LPW (Hz) |
| Scn 1 | Home healthcare | 42 k | 17 k | 296 k | 85 k | 43 M | 3 M | 68 k | |||
| Home hospitalization | 168 k | 68 k | ||||||||
| Scn 2 | Home automation | 28 k | 28 k | 24 k | 7 k | ||||||
| Scn 3 | Gigabit multimedia | 181 M | 181 M | 172 M | 62 M | ||||||
| Scn 4 | Smart beds | 78 k | 338 k | 132 k | 346 k | 23 M | 3 M | 278 k | |||
| Vital signs monitoring | 42 k | 8 k | ||||||||
| Scn 5 | Smart beds | 156 k | 574 k | 215 k | 718 k | 37 M | 4 M | 255 k | 80 k | |||
| Vital signs monitoring | 39 k | 144 k | ||||||||
| Scn 6 | Machinery tracking | 233 | 34 | 5 k | 578 | 1 M | 55 k | 1 k | |||
| Inventories | 4 k | 544 | ||||||||
| Scn 7 | Machinery tracking | 1 k | 11 | 23 k | 204 | 23 M | 3 M | 7 k | 0.7 k | |||
| Inventories | 19 k | 174 | ||||||||
| Scn 8 | Urban tolls | 30 k | 204 | 33 k | 205 | 3 M | 148 k | 257 | |||
| Traffic lights | 2 k | 2 | ||||||||
| Scn 9 | Traffic cameras and sensors | 240 k | 222 k | 278 k | 311 k | 13 M | 527 k | 208 k | |||
| Smart cars | 23 k | 86 k | ||||||||
| Traffic lights | 7 k | 3 k | ||||||||
| Scn 10 | Security cameras | 214 M | 283 M | 267 M | 96 M | ||||||
| Traffic cameras and sensors | 69 M | |||||||||
| Scn 11 | Freight tracking | 80 | 55 | 272 | 55 | 487 k | 15 k | 69 | |||
| Fleet tracking | 0.2 | 0.2 | ||||||||
| Scn 12 | Fleet tracking | 8 | 3 k | 66 k | 89 k | 57 M | 2 M | 60 k | |||
| Smart cars | 23 k | 86 k | ||||||||
| Scn 13 | Smart metering | 4 k | 38 | 70 k | 4 k | 53 M | 5 M | 134 k | 14 k | |||
| Smart lightning | 9 k | 77 | ||||||||
| Air/water quality monitoring | 88 | 0.8 | ||||||||
| Ambulance network | 22 | 0.2 | ||||||||
| Street parking | 57 k | 512 | ||||||||
| Scn 14 | Harvesting logistics | 97 | 0.9 | 13 k | 242 | 59 M | 6 M | 8 k | 0.8 k | |||
| Employee tracking | 197 | 1.7 | ||||||||
| Smart greenhouse | 97 | 0.9 | ||||||||
| Environmental sensors | 13 k | 114 | ||||||||
| Cattle tracking | 147 | 1.3 | ||||||||
| Air/water quality monitoring | 89 | 0.8 | ||||||||
Publisher’s Note: MDPI stays neutral with regard to jurisdictional claims in published maps and institutional affiliations. |
© 2021 by the authors. Licensee MDPI, Basel, Switzerland. This article is an open access article distributed under the terms and conditions of the Creative Commons Attribution (CC BY) license (https://creativecommons.org/licenses/by/4.0/).
Share and Cite
MDPI and ACS Style
Jaramillo-Ramirez, D.; Perez, M. Spectrum Demand Forecasting for IoT Services. Future Internet 2021, 13, 232. https://0-doi-org.brum.beds.ac.uk/10.3390/fi13090232
AMA Style
Jaramillo-Ramirez D, Perez M. Spectrum Demand Forecasting for IoT Services. Future Internet. 2021; 13(9):232. https://0-doi-org.brum.beds.ac.uk/10.3390/fi13090232
Chicago/Turabian StyleJaramillo-Ramirez, Daniel, and Manuel Perez. 2021. "Spectrum Demand Forecasting for IoT Services" Future Internet 13, no. 9: 232. https://0-doi-org.brum.beds.ac.uk/10.3390/fi13090232
Note that from the first issue of 2016, this journal uses article numbers instead of page numbers. See further details here.