Article

Parameter Identification and State Estimation of Lithium-Ion Batteries for Electric Vehicles with Vibration and Temperature Dynamics

1
National Center for Materials Service Safety, University of Science and Technology Beijing, Beijing 100083, China
2
Computer Science Department, Egerton University, Njoro 20115, Kenya
3
School of Materials Science and Engineering, Sun Yat-Sen University, Guangzhou 510275, China
*
Author to whom correspondence should be addressed.
World Electr. Veh. J. 2020, 11(3), 50; https://0-doi-org.brum.beds.ac.uk/10.3390/wevj11030050
Submission received: 11 June 2020 / Revised: 19 July 2020 / Accepted: 20 July 2020 / Published: 23 July 2020
(This article belongs to the Special Issue Power System and Energy Management of Hybrid Electric Vehicles)

Abstract

:
There are different types of rechargeable batteries, but lithium-ion battery has proven to be superior due to its features including small size, more volumetric energy density, longer life, and low maintenance. However, lithium-ion batteries face safety issues as one of the common challenges in their development, necessitating research in this area. For the safe operation of lithium-ion batteries, state estimation is very significant and battery parameter identification is the core in battery state estimation. The battery management system for electric vehicle application must perform a few estimation tasks in real-time. Battery state estimation is defined by the battery model adopted and its accuracy impacts the accuracy of state estimation. The knowledge of the actual operating conditions of electric vehicles requires the application of an accurate battery model; for our research, we adopted the use of the dual extended Kalman filter and it demonstrated that it yields more accurate and robust state estimation results. Since no single battery model can satisfy all the requirements of battery estimation and parameter identification, the hybridization of battery models together with the introduction of internal sensors to batteries to measure battery internal reactions is very essential. Similarly, since the current battery models rarely consider the coupling effect of vibration and temperature dynamics on model parameters during state estimation, this research goal is to identify the battery parameters and then present the effect of the vibration and temperature dynamics in battery state estimation.

Graphical Abstract

1. Introduction

Lithium-ion batteries (LIBs) have been deployed in a wide range of energy storage applications [1], ranging from consumer electronics, aerospace vehicles, military communications, and transport. In transportation, LIBs are used in electric vehicles both in the road, aerial, over-sea, and under-sea, which comprise either fully electric or hybrid vehicles. The wide application of LIBs is attributed to the LIB’s high-density and green new generation rechargeable battery, with outstanding benefits including low self-discharge rate, low maintenance, small volume, and superior capacity, as compared to lead acid and nickel cadmium batteries. These benefits of LIBs have led to the rapid adoption of electric vehicles (EVs), which have a myriad of benefits, that includes lack of environmental pollution, higher efficiency, affordable cost, reduction of greenhouse emissions, and reasonably safe operation [2,3]. These advantages, and many more. have sparked great interest in EVs, which has been accelerated by the increased diffusion and the critical role EVs play in many application domains which range from personal, commercial, and surveillance [4]. However, aging, high cost, temperature, vibration, and safety aspects still pose serious challenges to LIBs storage in EVs, and according to [4], range anxiety still remains a challenge that can only be predicted through the application of advanced estimation techniques and models. Although there have been slight improvements in LIBs energy density [5], there are calls for further improvement of LIB efficiency. The application of LIBs comes with major concerns including temperature, vibration, and aging as their use varies from location to location either on stationary or mobile objects thus affecting its performance. However, according to the study conducted by Zhang et al. [6], among temperature, vibration frequency, and vibration direction, temperature is the main influencing factor affecting the performance of LIBs. In order for EVs to offer the best results, online parameter estimation and battery state estimation are critical to reduce the catastrophic cost upon battery failure.
Battery state estimation has been costly and difficult for online implementation due to the large computation burden which causes the battery pack controller to be heavily loaded, hence affecting performance. However, the LIBs perform better compared to lithium sulfur (Li-S) technology, which suffers from quick degradation during long resting period, and limited sulfur utilization. When the Li-S is close to fully charged, it requires careful monitoring to avoid the problem of shuttling. On the other hand, the lead-acid experiences short cycle life, limited reliability, weak recovery, and is performance sensitive to temperature. These factors make LIBs more dominant. Major research has been conducted on the battery parameters to oversee their relationship and effect on the battery state of charge (SOC) and state of health (SOH), but little has been done to have all the parameters coupled together. It was observed that the previous studies that have presented the effect of temperature or vibration on LIB performance, but little has been done on the estimation of battery states based on the coupled parameters. This posed a gap in the literature that our research will present on the coupling of temperature and vibrations on the parameter identification and state estimation. This study is based on the dual extended Kalman filter (DEKF) to present a refinement or an extension of studies discussed on vibration durability on the LIB cell [7,8], effects of vibration on electrical performance of LIBs [6,9] and vibration modelling, as well as the impact of temperature on LIBs performance, in references [10,11,12], among other references.
The novelty of this paper is the coupling of parameter estimation and state estimation of LIBs for EVs, considering vibration and temperature dynamics. Further, we implemented the SOC and SOH estimation in LIBs based on the DEKF. Previous works instead typically focus mainly on single aspects, such as vibration, temperature, and aging, and if they focus on any of the two aspects it is not in relation to the DEKF. This work does enhance such aspects by specifically showing their effects on battery state estimation based on the DEKF.
This paper studies the online parameter and state estimation of LIBs in EVs under vibration and temperature parameters which forms the main focus of the paper. The remainder of this paper is as follows: LIB modelling and the problem statement is studied in Section 2; Section 3 will look at the parameter identification; Section 4 focuses on the effects of vibration and temperature on battery state estimation, and state estimation based on the DEKF. Section 5 presents the experimental test system and results, while the conclusion is drawn in Section 6.

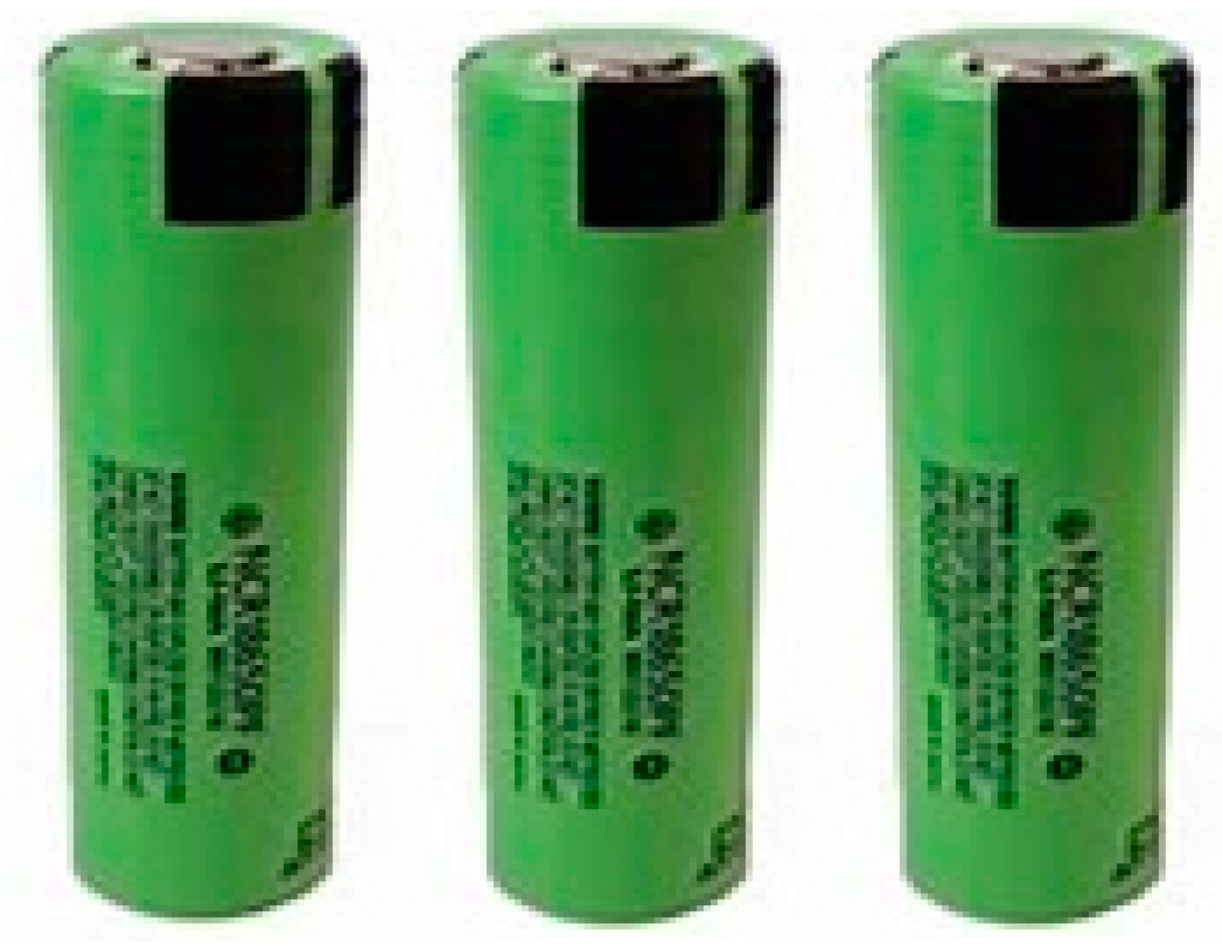
2. Lithium-Ion Battery
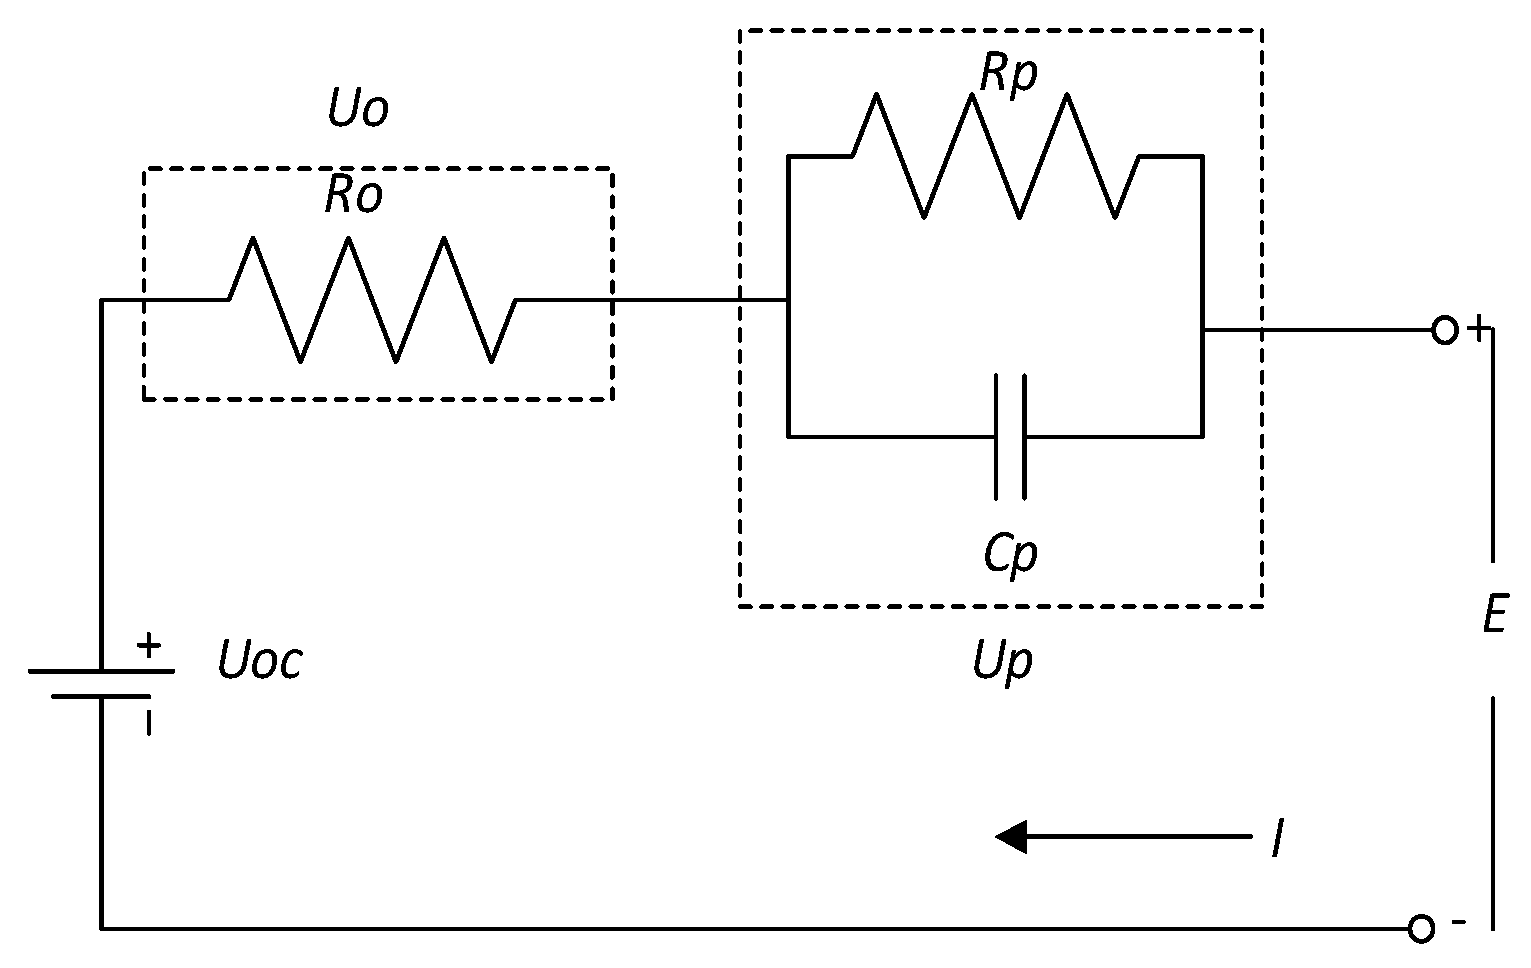
2.1. Modelling

There are many different categories of battery models, namely: thermal models, electrochemical models, multi-physics coupled model, equivalent circuit models (ECMs), and machine learning models [13]. These battery models are designed to accommodate multi-cells in series or parallel connection. The performance and safety of LIBs depend on both internal and external parameters like temperature, vibration, self-discharge, and aging. The battery model is chosen to enable the identification of the features describing the battery [14], and it is the basis for battery status estimation. In battery modelling, three scales are considered, namely: material scale, cell level scale, and pack level scale all according to the phenomena of interest [15]. At the material scale issues like charge transfer, lithium-ion diffusion is described; in cell level scale the transport, thermal, thermodynamics, mechanical, and kinetic phenomena are evaluated; and finally, at pack level scale the cells are differentiated and their behaviors averaged to address EVs related issues. In this research, the battery understudy is the LiFePO4 18650 battery cell as shown in Figure 1, together with its characteristics shown in Table 1.
Since the EV battery pack typically include very large number of LIB cells, to model the battery pack, the individual battery cell is modelled taking into account the load current and state variations (SOC and SOH), of the usable battery capacity. To do this, the ECM is used that takes into account the capacity dependency on the current magnitude and other battery dynamics. The ECMs have been employed extensively due to their efficient online implementation and low computational burden, despite their limited prediction capability. To reduce the computational burden of the battery state estimation, the 1st-order ECM is used in this paper. Reference [5], scaled up the battery parameters based on series/parallel connection and built a battery pack model, but they did not consider the cell mismatches, although their model was more realistic since they captured the state-dependent information. In this model they considered battery voltage dependency to estimate the SOC, unlike the conventional SOC estimation algorithm that uses the linear battery model.
An ECM is a model-based theoretical circuit that performs estimation of both open-circuit voltage (OCV) estimation, SOC estimation, and joint dual estimations. The ECM is a widely used model in the estimation of SOC, SOH, and state-of-function (SOF) [16] because of its simplicity and large advantage of computation time when compared with mathematical and electrochemical models [4]. The ECM uses electrical circuit modules, such as capacitors, resistors, and OCV [17,18], to build circuit networks used to describe battery terminal voltage and it retains all of the electrical characteristics of a given circuit to aid in analysis. To achieve accurate dynamic battery characteristics, the ECM is used as it has good applicability and expansibility that makes it suitable in model-based development for estimating SOC. This attribute makes ECM widely used, owing to its ability to model battery dynamics automatically with basic current elements, including the resistors and capacitors [19], as well as its high computational efficiency [20].
However, the ECM is costly and time-consuming, and it is impractical to obtain all parameters as the ECM model parameters can only be parameterized accurately for a few batteries. However, if the model order increases, i.e., the first-order ECM is employed, it can improve the time precision [18] to some level due to its fewer matrix dimensions but with higher time efficiency, at the same time, if second-order ECM is employed, lower time efficiency [21] with higher accuracy of SOC estimation is yielded. A simple ECM, which guarantees high accuracy but less time efficiency, that is considered in this paper consists of the equivalent ohmic resistor Ro, the resistance-capacitance (RC) network with Rp as the equivalent polarization resistance, and Cp is the equivalent polarization capacitance, which is used to simulate transient responses of the LIB during the charge-discharge operation, and the open-circuit voltage Uocv. The current I is considered as the model control input and the terminal voltage E as the measured output. The ECM provides accurate prediction of the temperature distribution, shows better performance and if preferred because of its simplicity. However, this method suffers many drawbacks as it is hard to identify parameters in the model, parameters may change along with the working conditions, and some measurements must be conducted via invasive operation. Figure 1, shows the cylindrical battery cell used in this research, and the simple ECM for LIBs is shown in Figure 2.
U o c = U o + U p + E
where U o c is the open-circuit voltage, R O is the Ohmic resistance, U O is the Ohmic voltage, R P is the polarization resistance, C P is the polarization capacitance, U P is the voltage across ( R o and R P ), I is current, E is the terminal voltage., with the total resistance in the system is the sum of R O , C P and R P .
The fuel gauge for the battery pack in EVs is the equivalent of the SOC whose units are in percentage form (0% = empty; 100% = full). The SOC is the inverse of depth-of-discharge (DOD) where 100% represents empty, while 0% represents full. Since the model-based methods and coulombic counting are the main approaches used in the SOC estimation, we can quantify the SOC level based on:
S O C = η . I b a t 3600 . C c a p
where I b a t   is the current across the battery, and C c a p is the battery capacity, η is the coulombic efficiency constant. The coulombic efficiency η is simplified as the constant value of 1.0 during discharge, and 0.98 during charge.

2.2. Problem Statement

Many scholars have conducted extensive research on LIB state estimation to ascertain its performance by using different algorithms and have proposed several other new methods. LIB performance is affected by many parameters which in return affects the overall performance of EVs. These parameters include temperature, self-discharge, vibration, and shelf-life. The aim of this research is to estimate the OCV and the batteries equivalent series resistance, since they are directly correlated to the battery SOC and SOH. Consequently, parameter identification, SOC and SOH estimation for LIBs in EVs, coupled with vibration and temperature dynamics, is determined. The general battery state estimation based on the DEKF is also illustrated in this research. However, since the LIB working conditions and load conditions are complicated, accurate LIB SOC and SOH estimation remains a challenge.

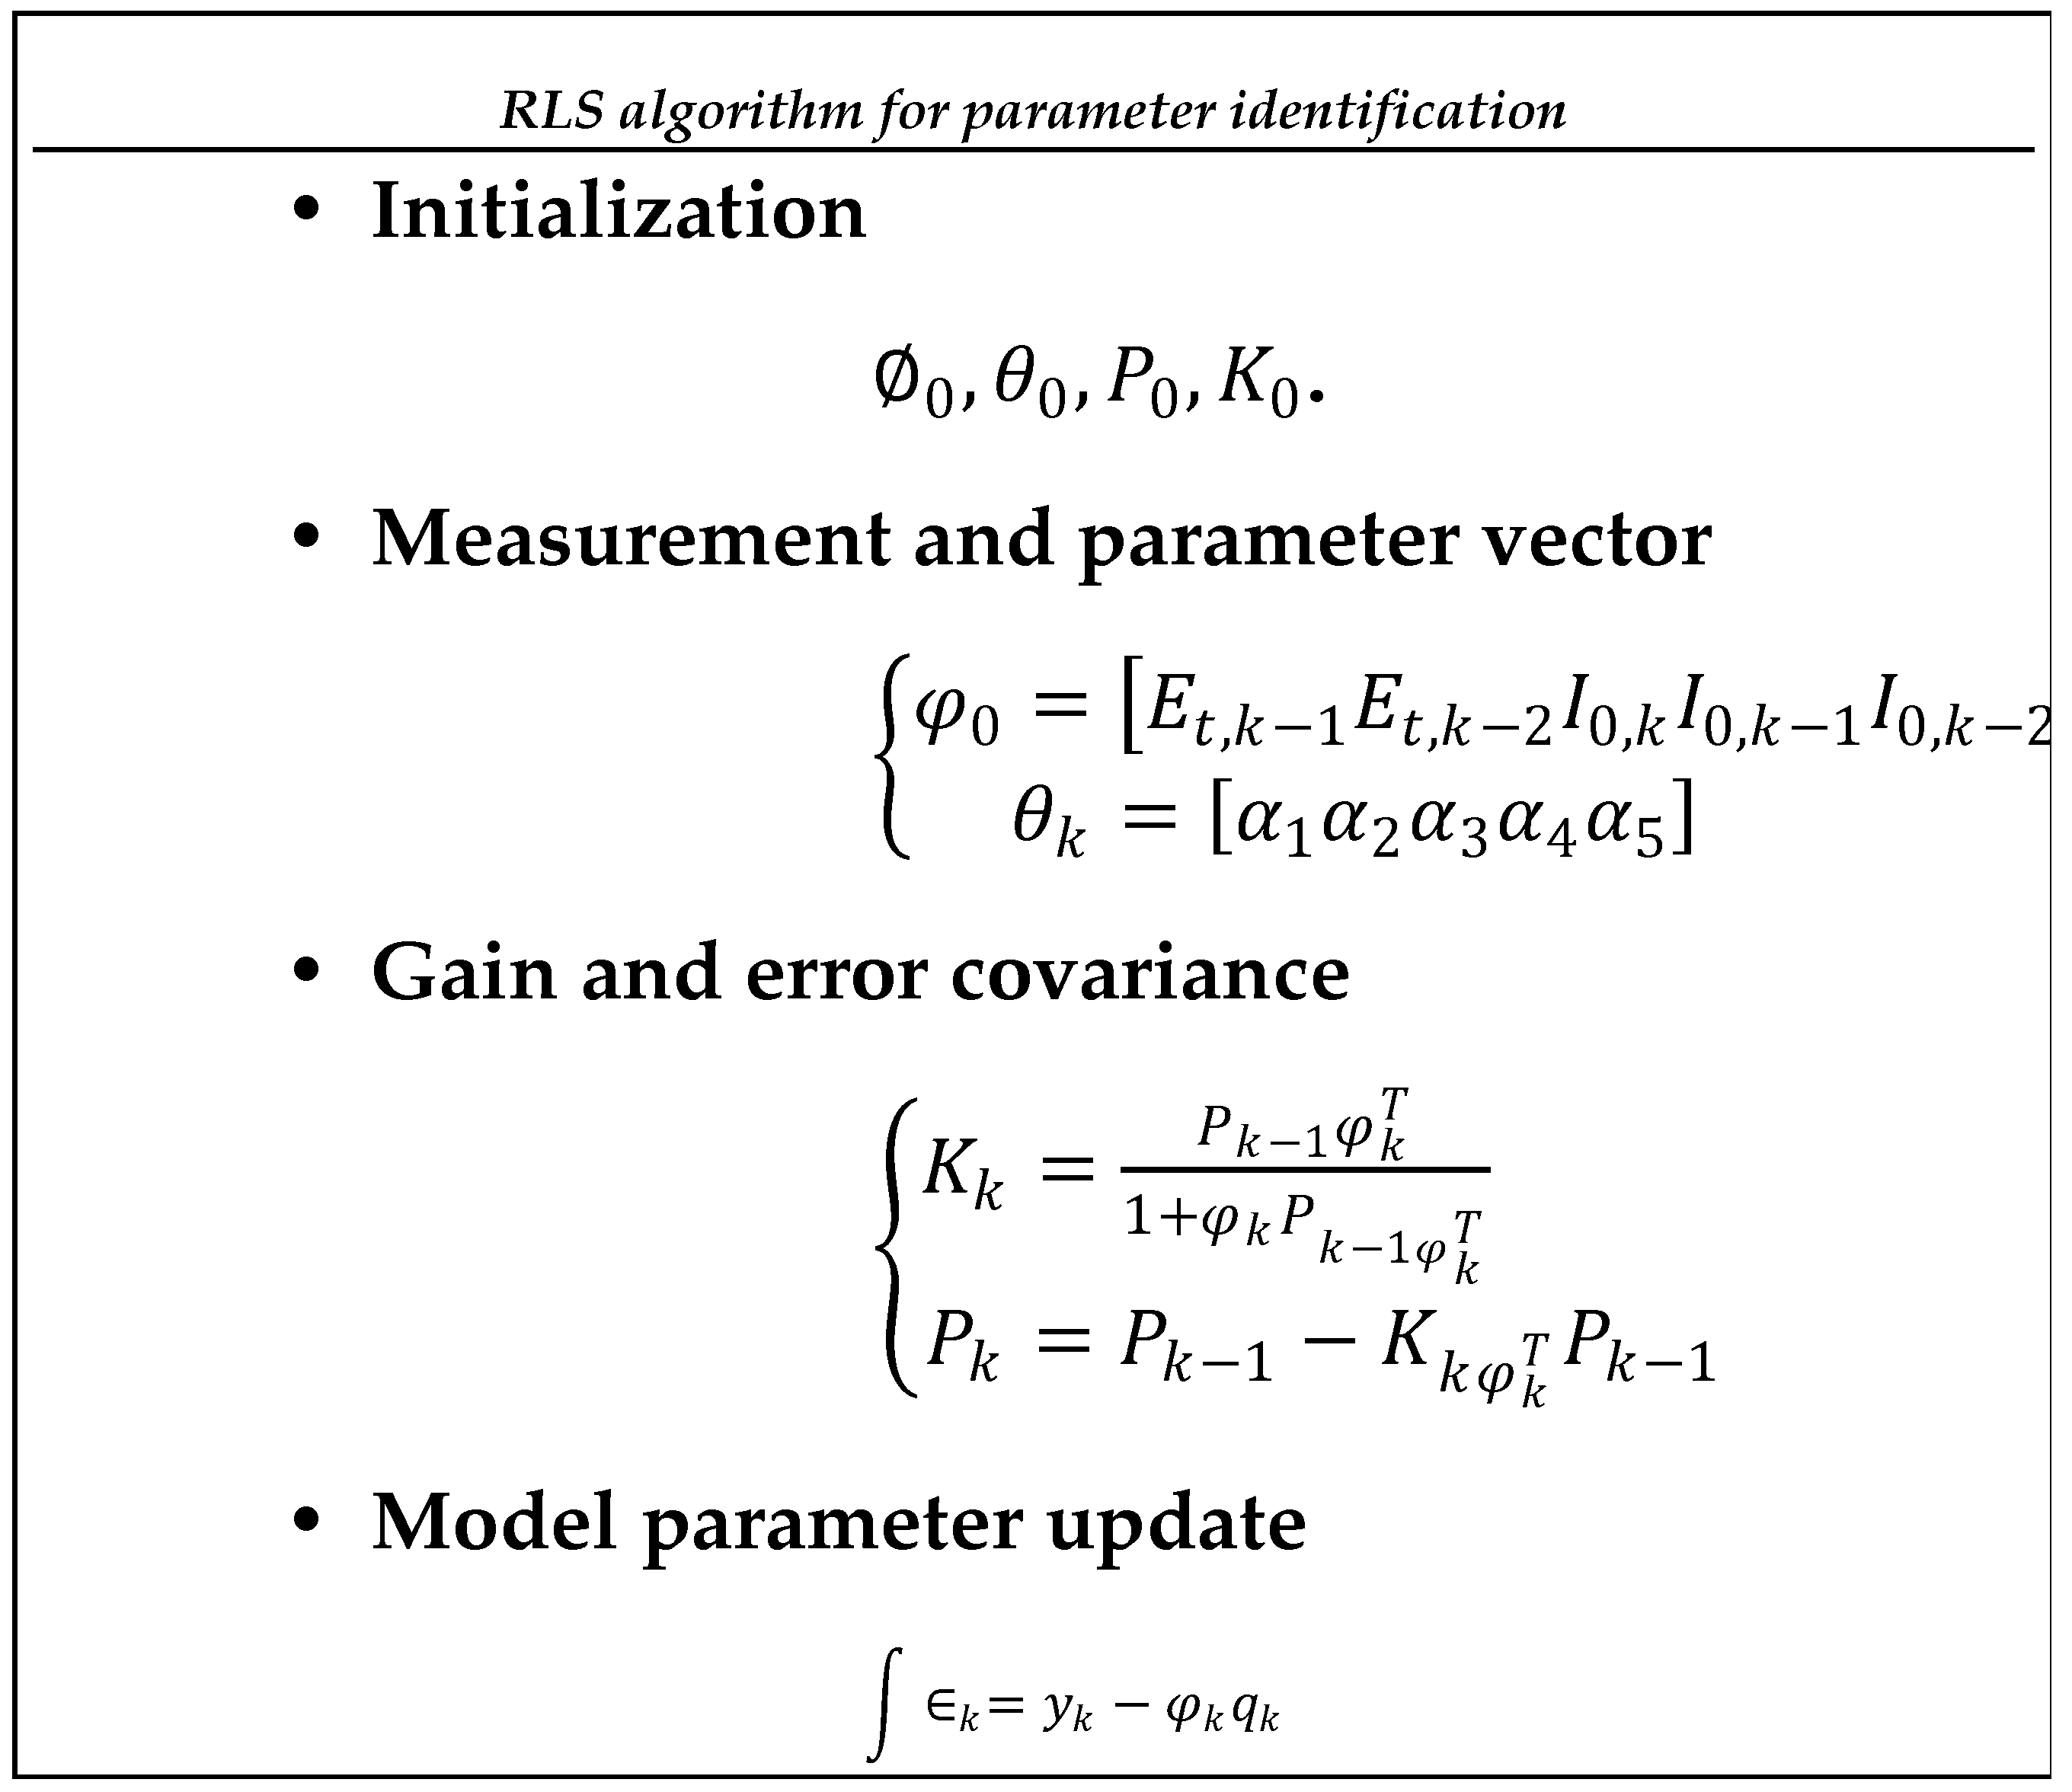
3. Parameter Identification

The process of parameter identification provides the best ever estimate of the ECM as applicable in battery modelling. This makes it essential to perform parameter identification in order to effectively track the SOH of the battery. The battery parameter identification can be performed both in offline and or online. The online method is better as it tracks parameter deviations while recording equivalent series resistance that is used for SOC estimation. This method also enables the determination of the relation between the measurement data and identification accuracy. To reduce the identification error, the battery current profile is designed to include optimal frequency component. In LIB management, an important aspect to address is the measurement procedure and algorithm used to capture the battery cell’s performance characteristics, including capacity, time constraints and internal resistance [22]. Parameter estimation results can achieve better SOC estimation, which makes ECM parameter estimation the key means of achieving battery modelling accuracy [23].
In ECM implementation, pulse charging and discharging experiments can be applied to perform offline parameter identification [24]. When conducting SOC estimation, battery cell parameter identification conditions are originally designed based on excitation response analysis [25], making it possible to conduct essential verifications in terms of model accuracy. However, as parameters constantly change, real-time identification can be applied to obtain the most accurate battery model.
To compute values of parameters under different SOCs based on the mathematical equations of the Thevenin ECM, non-linear fitting methods are used. This makes it easy to implement parameter identification with high precision [16]. The parameters of the ECMs are highly sensitive to operating conditions including temperature, SOC levels, and vibrations. These parameters need to be efficiently identified during the operation of the vehicle to improve the accuracy of the battery SOC. To extract the model parameters in real time, the recursive least square (RLS) method is employed. The model parameters to be identified include Ohmic resistance   R o , polarization resistance R p , and polarization capacitance   C p . The difference between the terminal voltage and the OCV is provided by:
E t , k + 1 = U t , k + 1 U O C V , K + 1
where U t , k + 1 and U O C V , K + 1 are the terminal voltage and SOC dependent OCV at the time step k + 1 . This voltage difference can be expressed based on the Kirchhoff’s voltage law by:
E t , k + 1 = U p , k exp ( t R p C p ) [ 1 exp ( t R p C p ) ] R p I 0 , k I 0 , k + 1 R 0
The time constant of a one RC model is derived by
τ = R p C p
Then, Equation (4) can be expressed as
E t , k + 1 = U p , k exp ( t τ ) [ 1 exp ( t τ ) ] R p I 0 , k I 0 , k + 1 R 0
E t , k + 1 = exp ( t τ ) E t , k R 0 I 0 , k + 1 + ( exp ( t τ ) R 0 ( 1 exp ( t τ ) ) R p )
Equation (7) can be simplified further as
E t , k + 1 = α 1 E t , k + α 2 I 0 , k + 1 + α 3 I 0 , k
where α 1 = exp ( t τ ) , α 2 = R 0 and α 3 = exp ( t τ ) R 0 ( 1 exp ( t τ ) ) R p . Thus, the battery model parameters   R o , R p , and C p can be expressed as
{ R 0 = α 2 R p = α 1 α 2 + α 3 α 1 1 C p = t R p log ( α 1 )
The RLS equation can be derived as
y k = φ k θ k + ϵ
where φ k is the measurement, θ k is the parameter vector to be identified, and ϵ is the model error.
The detailed steps on the implementation of the RLS algorithm are shown in Figure 3.

4. Effects of Vibration and Temperature on Battery State
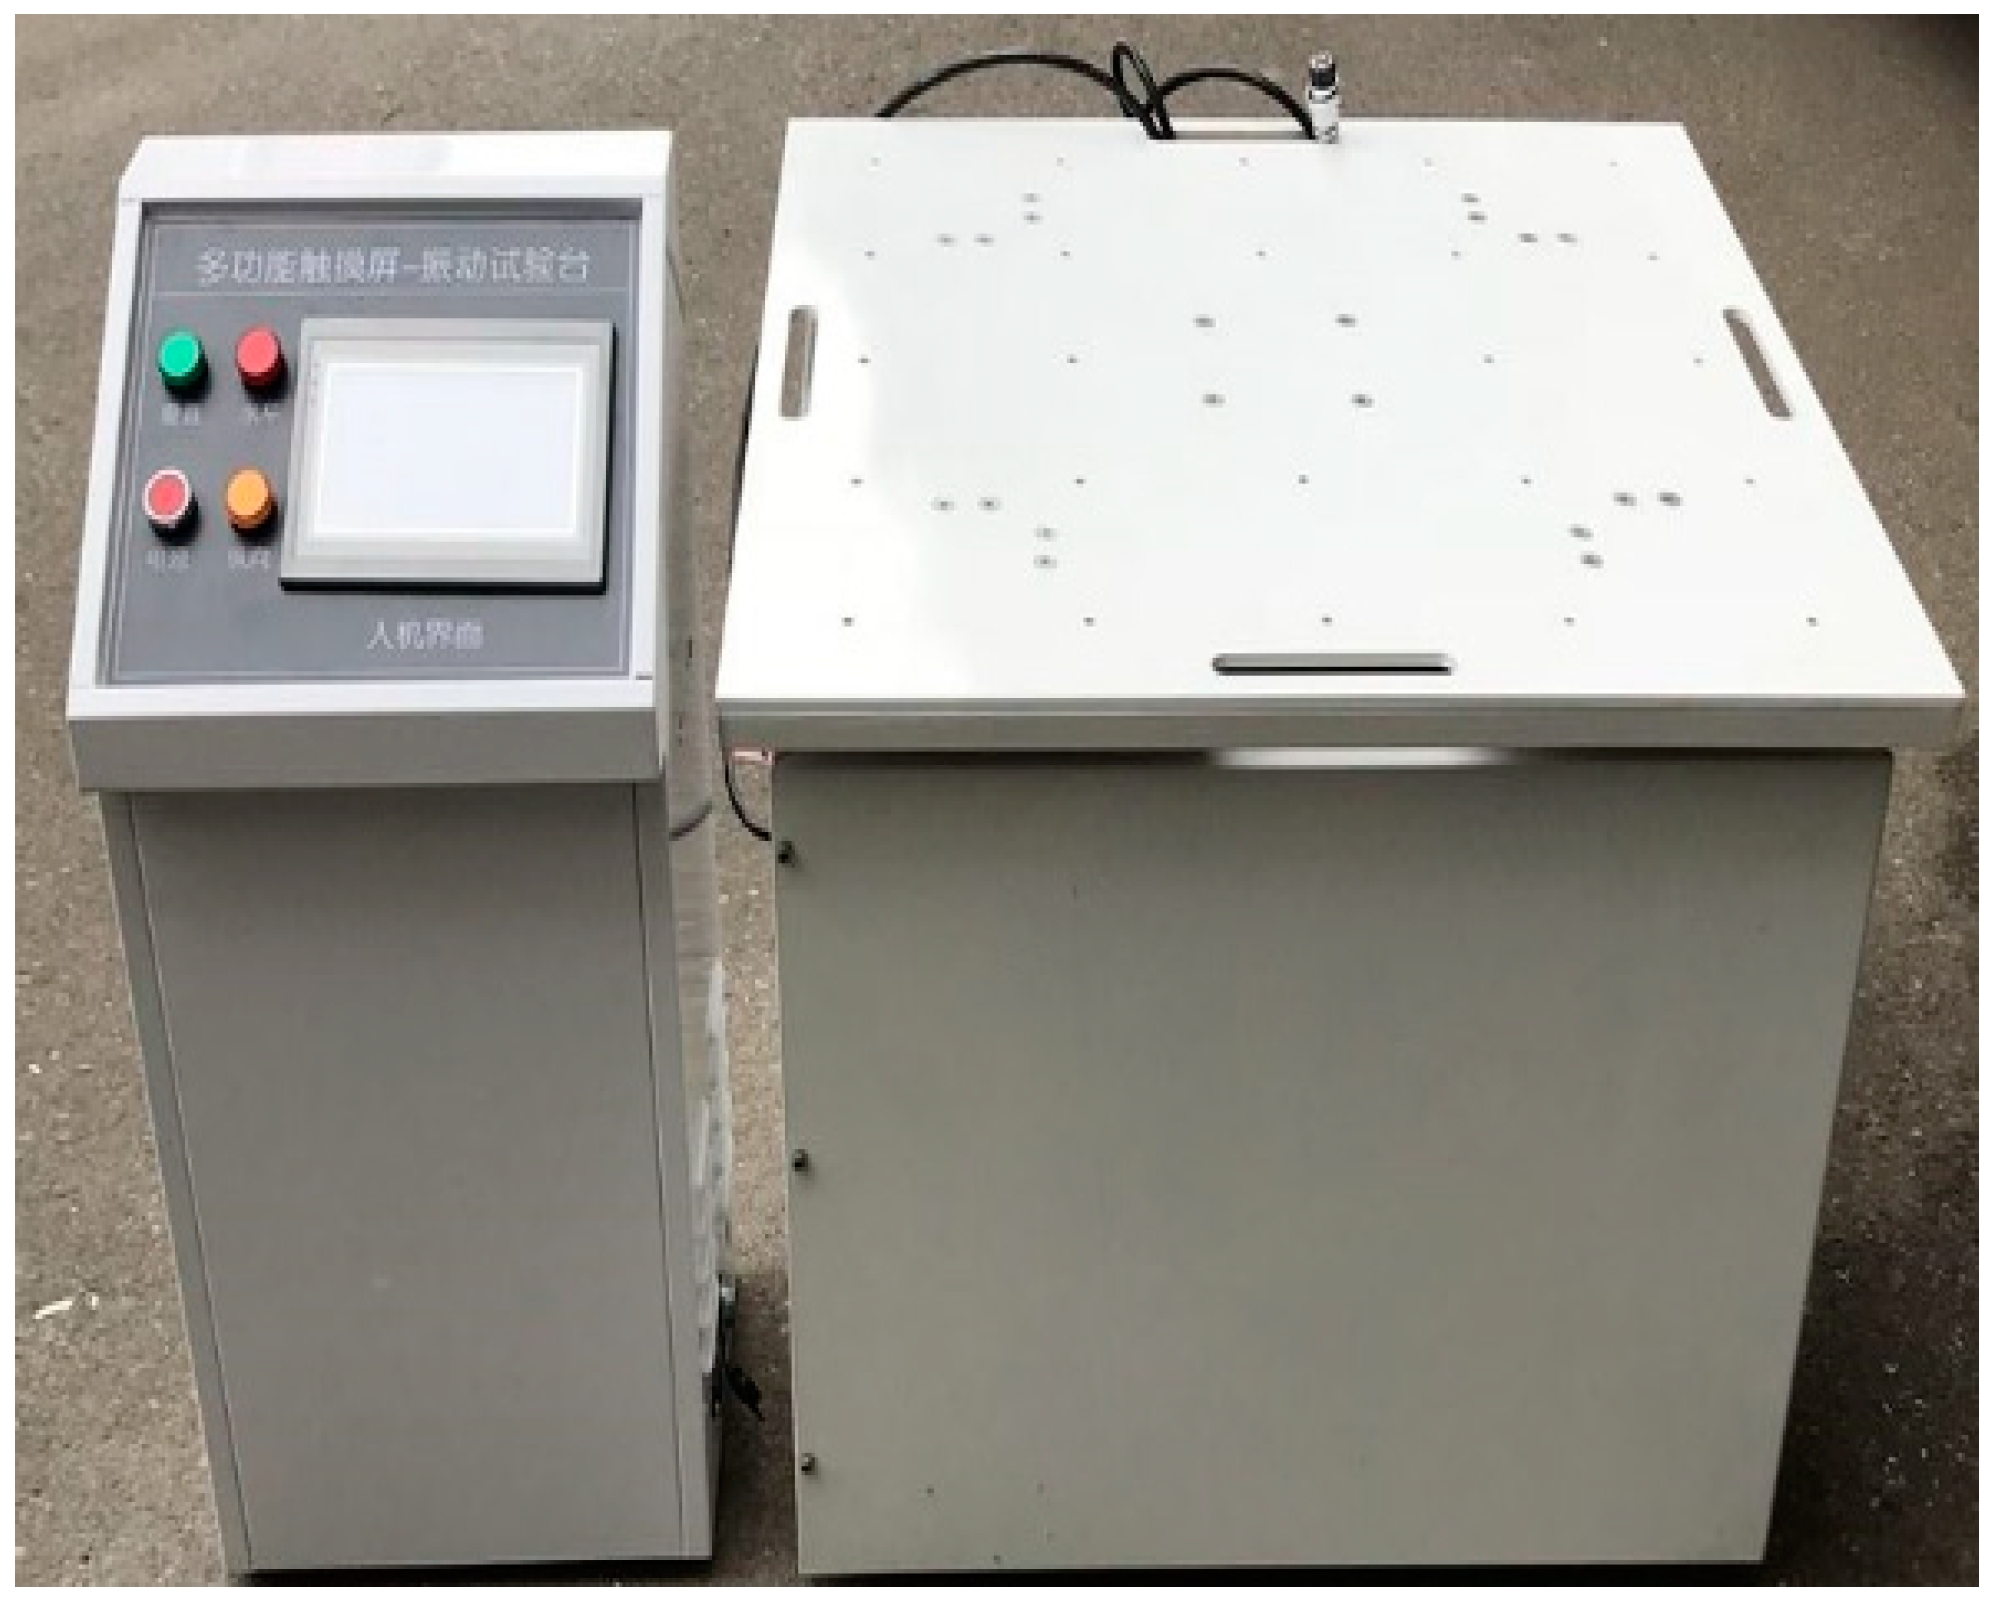
4.1. Vibration

The performance of EVs is based on the effective performance of LIBs, and can be affected by many factors like the function of the surrounding environment (temperature and vibration rates), aging, self-discharge rates, and capacity variations [26]. Of these factors, vibration has not received enough attention, as the sources of vibrations are characterized by their time and frequency domain characteristics which are categorized principally as periodic or random disturbances. Vibration comes about from both external and internal mechanical forces which include terrains inputs to wheels, wind resistance, sudden collision, braking, a force of inertia, and road bumpiness and roughness [27], some of which are sometimes hard to measure. In the design and component selection of EVs, vibration durability plays an important role, and this inevitably makes it hard to be avoided, since batteries in EVs lose power through vibrations function. From the reference [28], vibration energy can be harvested to substitute the battery or to charge the battery, as vibration harvesting can generate and accumulate power.
The performance of 18650 LIB cells is easily affected by the vibration profiles which are representative of the typical life of the system. In reference [15], mechanical stress induced by vibration like in the case of EV crash, is a major concern of LIB safety in EVs response to such stress. According to the reference [9], the EVs are faced with road-induced vibrations which affect both the system’s electrical performance and mechanical properties, as cell consistency deteriorates with vibration stress [6]. For these reasons, various control mechanisms should be employed to eliminate noise and harshness, as well as creating an equitable driving environment for EVs. Consequently, both the free and forced vibrations should be analyzed in response to prescribed disturbances, thus employing the best control mechanisms to control any undesirable vibration levels that may arrive in the EVs driving. At the same time, research should be conducted to apply the vibrational energy harvesters (VEHs) as a power source to EVs to improve efficiency and performance of EV batteries [27].
When vibration is measured directly on each battery cell system, significant energy is measured within a frequency range of 0–7 Hz, and this concludes that battery packs may be exposed to vibrations loads which may be outside the range of existing standards [28]. Consequently, reference [8] noted that the batteries in EVs are affected by exposure to vibration which is commensurate to that experienced by EVs due to induced road excitation, and the consistency of cells deteriorates after vibrations [9], whereby it can lead to component failure or reduced system performance caused by the deterioration of cell consistency [7].

4.2. Temperature

Temperature is known to have a significant impact on performance, safety, and cycle life of LIBs. The operating temperature of LIBs must be well controlled as its performance, health, and safety depend on it [29]. The battery stores and supplies electrical energy through a process known as a reversible electrochemical reaction during the charging and discharging process.
As the battery charges, the positive active material of the battery is oxidized, producing electrons, while the negative material is reduced as it consumes the electrons. This process reverses during the discharging of the battery, and it is observed that there occurs some chemical reaction inside the battery that is irreversible and undesirable which can cause permanent cell damage. If overcharging or undercharging takes place in a battery, the battery can explode and the reaction can be disastrous and during this time the battery temperature can rise to an undesirable level. The rise in battery temperature lowers performance and voltage but causes an increase in charging time and internal resistance [30]. In reference [31], temperature effects on the self-discharge rate are studied and ultra-capacitor modules with cooling elements and cooling are designed.
The individual cells degrade depending on temperature as the voltage is affected by current due to electrochemical kinetics and temperature. Therefore, the battery temperature must be measured and monitored in real-time to allow the control subsystem in the battery management system (BMS), such to take timely protection measures before heat runaway occurs [32], and EV failure due to low or over-temperature failures [33]. The BMS is an important part of EVs as it protects the battery system from damage, predicts and increases battery life, and maintains accurate and reliable operational condition of the battery [34]. In a battery-powered EV, there are many components, such as switches and diodes, which need to resist the influence of high levels of temperature and vibrations [35], as they prove to be a serious parameter in the battery cell degradation, which in return affects the battery state. The EV system must have different efficient and reliable cooling systems to manage temperature variations. However, considering the large number of battery cells in a battery pack, the computation burden on the BMS is too large to monitor every individual cells’ SOC.
According to reference [36], accurate monitoring of the temperature of LIB cells is indispensable to the design of the battery thermal management system, as considerable heat is generated during the charging and discharging of the batteries. Due to the thermal heat generation, it makes it difficult to estimate the battery states at different temperatures which further makes lifetime estimation for typical operating scenarios to be complex [36]. The battery’s environmental conditions influence the batteries’ thermal condition, whereby if its internal temperature is above the ambient, the battery loses heat through convection, radiation, and conduction, but on the other hand, the battery can gain heat if the ambient temperature is higher [37].
Whenever several cells are working together, the ambient temperature within a battery pack rises steadily causing a dramatic increase in temperature, unlike when a single cell is working alone. However, this heat can be controlled by the thermal management system through forced cooling, protection from overheating, uniform battery heat distribution, and dissipation of excess heat generated to the air. If this is not monitored and performance checks conducted in real-time it can lead to system failure or even safety issues.

4.3. SOC Estimation

The SOC parameter is of utmost importance in EVs as it is permanently subjected to loading and/or unloading situations. Battery SOC is an indicator of current battery capacity used to regulate the charge-discharge process while ensuring safe operation [1]. SOC is defined as the energy expressed as a percentage of the nominal capacity, which is still available to be used. According to reference [29], SOC of batteries in BMS is like a fuel meter in a conventional fuel car. In general, SOC is expressed as the percentage of the stored capacity that is remaining in the battery. When the battery SOC is 100% it means that the battery is in a fully charged state, while at 0% it means that the battery has no more electric power available for further discharge [38]. The battery model that can be able to predict the dynamics of the cell is required in order to realize desirable estimates of the battery SOC.
The battery SOC is expressed as:
S O C ( t ) = C a v a i l C t o t = S O C i n i t ( I b a t t C i n i t ) d t
where C a v a i l is the available battery capacity in Ah, C t o t is the total battery capacity Ah when fully charged, S O C i n i t is the initial SOC of the battery, C i n i t is the initial battery capacity Ah and I b a t t   is the battery current.
This indicator depends on many other magnitudes, such as charge/discharge current rates, temperature, vibrations, usage time, hysteresis, and self-discharge. Since the battery SOC is not measurable, it is necessary to estimate it on the basis of measurements of other signals available in the BMS, such as voltage, current, vibration, and temperature. There are various methods for SOC estimation, namely coulombic (Ampere hour) counting, voltage estimation, impedance spectroscopy, and the hydrometer method counting method. Each of these methods has some challenges, since SOC estimation is not easy to measure but rather estimations are made based on other factors. In the reference [39] using discharge-test method with controlled conditions like rate and ambient temperatures is assumed to be the most reliable method to determine the battery SOC, but does not fit the online SOC estimation, coulombic counting does not offer the best precision, and many more other challenges making SOC estimation of to be cumbersome.
When performing the SOC estimation two aspects must be taken into account; firstly, to have a good model that represents the behavior of the battery properly, while the second is the relationship with the algorithm used to make the estimate. Both aspects are supposed to have information about the battery to be able to identify the model and to develop the estimation algorithm. The SOC estimation exercise faces many limitations, including model bias and parameter uncertainties. This makes SOC estimation accuracy harder, which implies that no single model can truly represent the physical system without a single error when operating in diverse environmental conditions, as well as SOC variation due to uncertainties [40]. Thus, as [13] observes, SOC estimation improvement in particular applications may require the inclusion of uncertainty of the bias in the SOC estimation. To further enhance the expected SOC estimation accuracy, it becomes worthy to include more factors in bias modelling.
Clear SOC estimation is very critical in the analysis of battery performance as it provides information about the remaining useful energy of the battery, evaluates the reliability of the battery, and provide a glimpse of the charging/discharging strategies of the LIBs [41]. In the EV system, high power density must be maintained so that it can smooth out the current fluctuations in the battery, reducing its temperature and also increasing the battery life. The study on SOC and SOH is very critical and it forms the main function of the BMS in EVs, which measures and monitors the remaining energy, and the remaining battery performance while characterizing the current state health status of the battery cell [42]. The application of the hybrid approach of SOC estimation is very critical as it improves performance and accuracy under varying conditions [1].

4.4. SOH Estimation

Accurate determination of the battery SOH can guarantee safe and reliable battery operation in the EV design and operation. The SOH is defined as the remaining performance of the battery cell, and a number of different rates that depend on storage and usage conditions make it degrade with aging. The efficiency of the SOH estimation affects the accuracy of SOC estimation [43]. According to Omariba et.al [3], the EV’s BMS ensures that batteries charge within safe ranges, and SOH is tracked by measuring internal resistance which is computed as:
SOH = Qact/QR × 100%
where Q R is rated capacity and Q a c t is the actual capacity.
The normal range of the battery’s SOH is within 0–100%, but this value is slightly higher than 100% when the battery is new and due to battery product variations [44]. The end-of-life (EOL) of a LIB is commonly defined by the maximum cycles when the SOH drops to 80%, as SOH is the key indicator of safe battery operation as it sends a warning on when maintenance can be performed. The capability of a battery to store power decreases over its lifetime, based on a myriad of factors including shelf-life, self-discharge, temperature, and vibration, and this is indicated by the values of battery SOH [17]. The study of battery SOH is part of the main purposes of the BMS, so as the status of the battery in terms of remaining performance is known beforehand, in order to ensure that there is optimal EV efficiency. The current health status of the battery should always be known, and this will aid in knowing the timing for effective maintenance. There are various algorithms existing today that have been used in the evaluation and prediction of the LIB’s SOH, in the EV industry. However, as the battery cells differ in their chemistry and other parameters, unbalance of SOH can occur due to other factors like relative temperature of different cells [42], coupled with vibration. To allow precise design of control algorithm for energy storage systems, accurate estimation of SOC and SOH of the battery pack is required, and it is the key pointer in LIBs management as it expands their lifetime and energy storage capability [22] and SOH is estimated according to the extent of abuse of performance degradation of batteries.
In this research, experiments were conducted on accelerated aging of LIBs in series that were run on different conditions including charge-discharge under temperature and vibration dynamics. In different experiments and simulations, the running environment of the LIBs pack the discharge temperature and vibration, as well as speed of each, is not identical and in some experiments the voltage of the lithium batteries is lower than at the end of the discharge set by manufacturer’s recommended value of 2.7 V, to introduce the DOD aging effect. The repeated charge-discharge cycle to speed up the aging of lithium battery when the end-of-life of LIBs (i.e., capacity of the cell is less than 70% of the rated capacity, for example from 2.9 to 2.03 Ah) when the experiment is over.
Accurate estimation of SOH can prevent the battery cells from overcharging or over-discharging thus improving the battery pack life. This process, however, cannot be performed through direct measurement of SOH, but instead it can be estimated through the known and measured parameters like voltage, current, temperature, and vibrations. Thus, the estimation of the battery’s SOH takes into consideration two major factors that are impedance increase and the battery capacity fade [44]. The LIBs are run on three conditions which include charge, discharge, and electrochemical impedance spectrum (EIS). The charge-discharge process includes battery voltage, output current, temperature (internal and external), load voltage and load current, time, and end-of-discharge (EOD) of the battery capacity. Consequently, the EIS includes sensing current, battery current, current ratio, battery impedance, electrolyte resistance estimates, and the charge transfer estimate. All these conditions have to be fulfilled in the accurate estimate of the battery’s SOH.

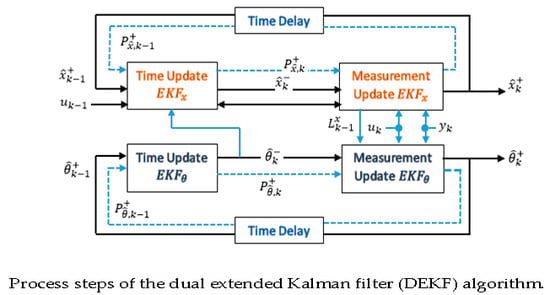
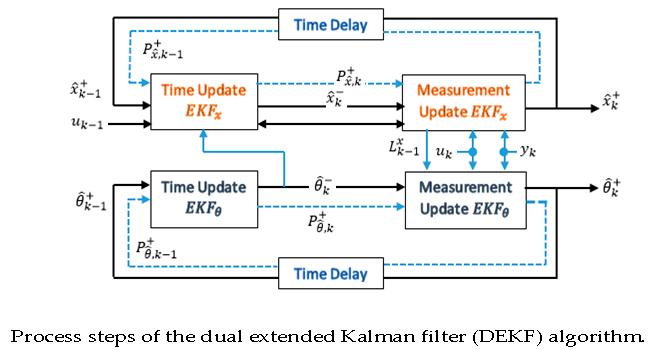
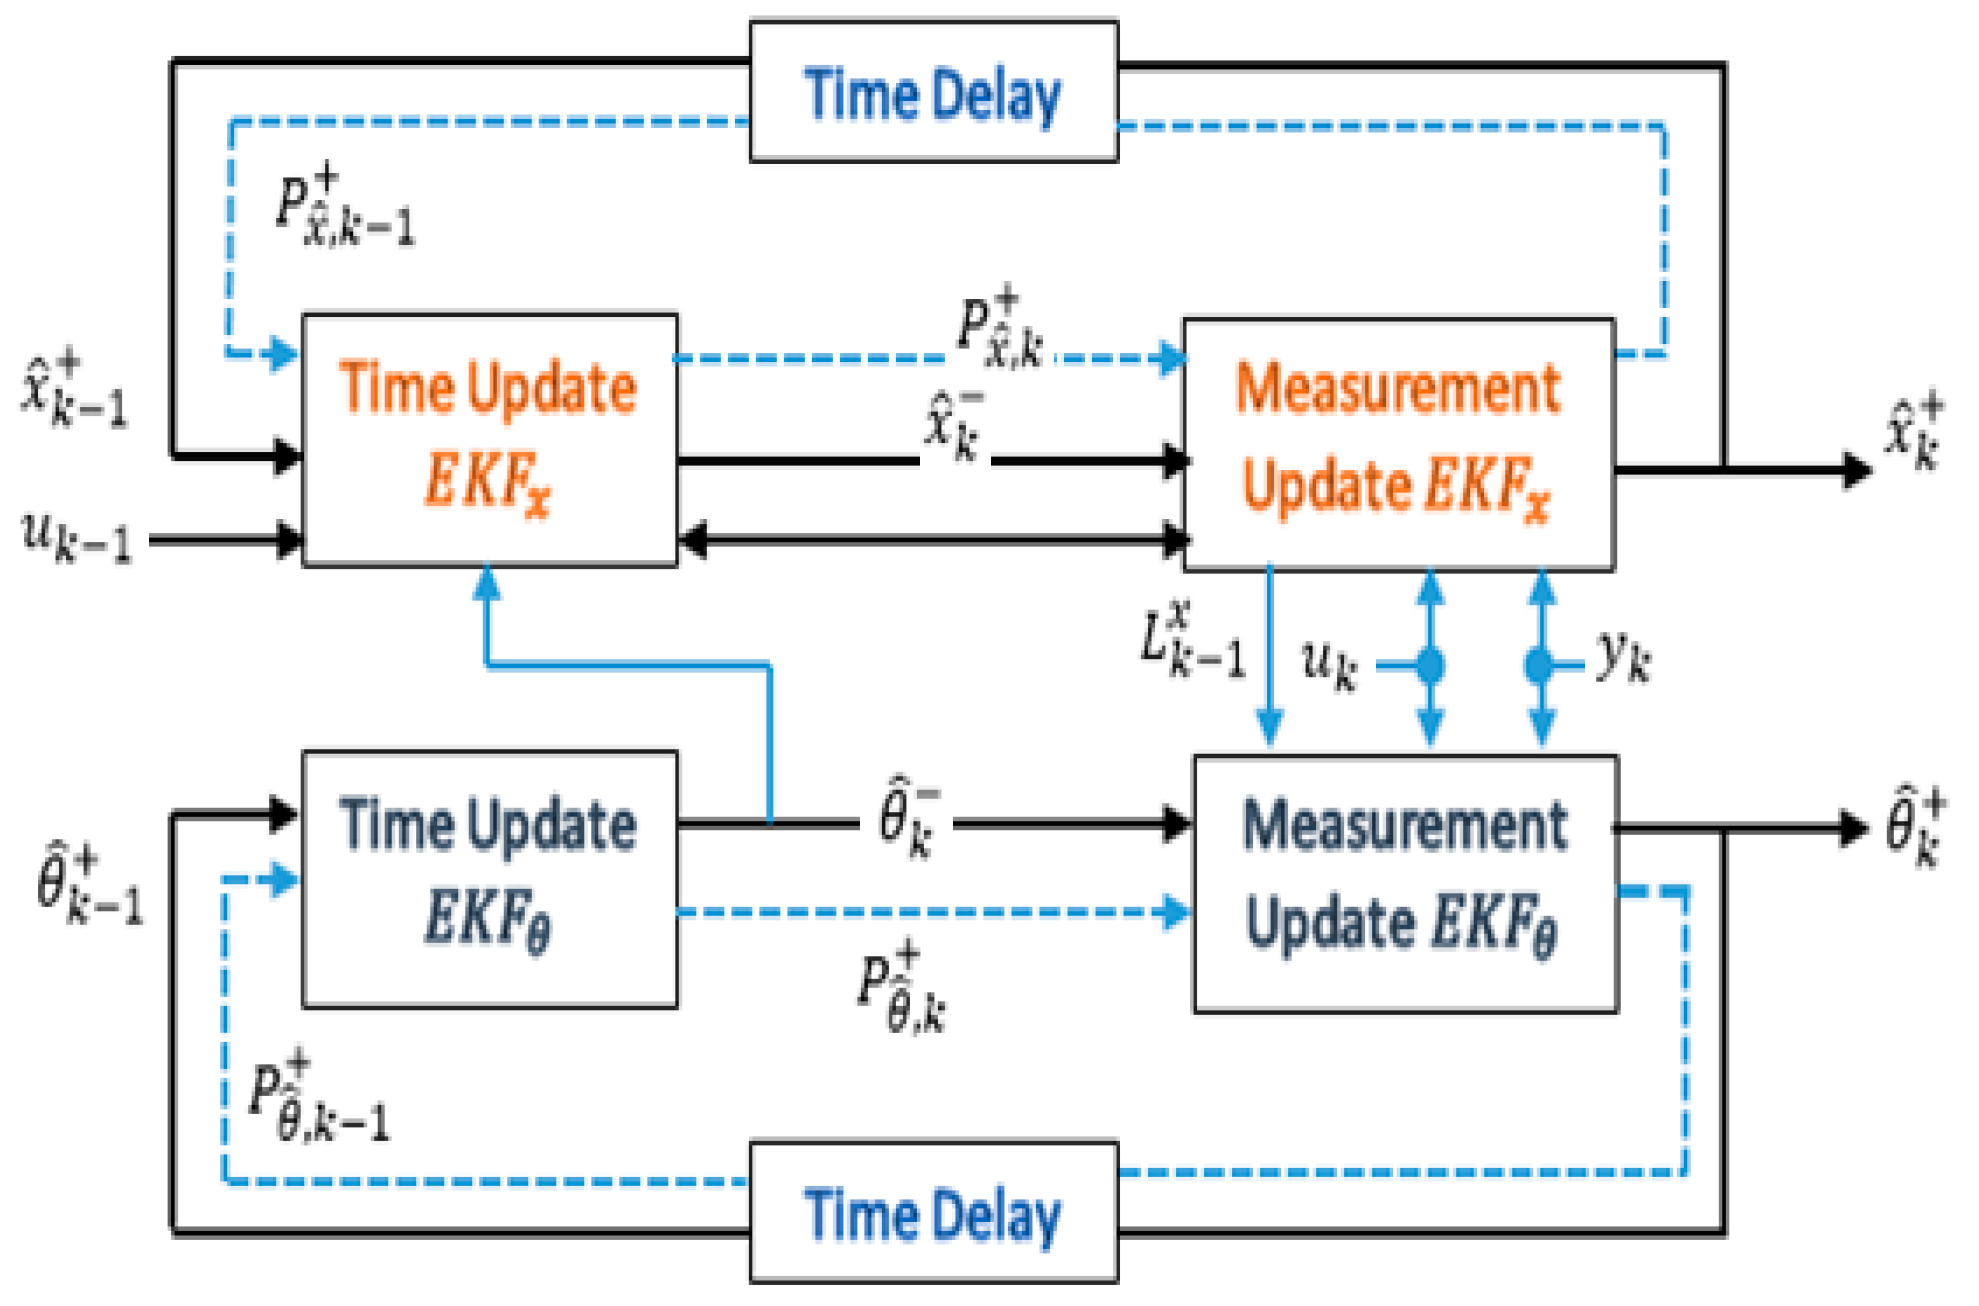
4.5. State Estimation Based on Double Extended Kalman Filter

In the research of batteries, the most researched topic is the battery state, mainly the battery SOC and SOH. The sensor signal obtained from the SOC and SOH determination in the battery traction can be noisy and erroneous and it can lead to inaccurate estimates. There are various versions of Kalman filtering methods which are used in the estimation of the battery state like the Kalman filter (KF), Adaptive Kalman filter (AKF), extended Kaman filter (EKF), Adaptive extended Kalman filter (AEKF), Unscented Kalman filter (UKF) and so on [45,46]. All these methods ignore the measured noise in practical applications since they mainly focus on the battery model, model parameters error, and the reliability of the algorithm. The DEKF algorithm is preferred because of various reasons as pointed out in many references. One, the DEKF consists of dual EKFs that estimates the battery state and parameters at the same time. According to reference [47], there is a reduction in the workload of the DEKF if the charging voltage is transformed as the Ohmic internal resistance and capacity are obtained, thus the ohmic resistance estimation based on EKF is stable [48].
The DEKF is employed in the non-linear systems as it enhances the correlation between the SOC and OCV and improves the speed of convergence of the Kalman filter method. Before the battery signal enters the DEKF, the noise and analog and or digital quantization error can be artificially added to the sensor sub-model. The simulated noise measurement can be processed by the DEKF with a given initialization battery dataset. If the noise covariance is kept constant, there will be a rigorous real-time requirement of a BMS. The model fitting errors, in this case, do not affect the filter behaviors, and the DEKF performance under degradation, as it improves SOC estimation accuracy performance, even beyond the battery EOL.
In state-estimation, the Kalman filter and its variants have been widely used with great successful applications. In this study, the DEKF is proposed for battery SOC estimation, which is a recursive and closed loop. The discrete-time state-space and observation equations are derived as:
{ x k + 1 = f ( x k , u k , θ k ) + w k y k = g ( x k , u k , θ k ) + v k   d k = g ( x k , u k , θ k ) + e k     θ k + 1 = θ k + r k  
where w k , v k ,   e k , and r k are the independent, zero-mean, Gaussian noise processes of covariance matrices Σ k , Σ v , Σ e , and Σ r , respectively.
The DEKF steps:
Definitions:
A k 1 = δ f ( x k 1 , u k 1 , θ ^ k ) δ x k 1 | x k 1 = x ^ k 1 +
C k x = δ g ( x k , u k , θ ^ k ) δ x k | x k = x ^ k +
C k θ = δ g ( x ^ k , u k , θ ) δ θ | θ = θ ^ k
Initialization:
For   k = 0 , set the following values:
θ ^ 0 + = E [ θ 0 ] , Σ θ ¯ , 0 + = E [ ( θ 0 θ ^ 0 + ) ( θ 0 θ ^ 0 + ) T ]  
x ^ 0 + = E [ x 0 ] , Σ x ¯ , 0 + = E [ ( x 0 x ^ 0 + ) ( x 0 x ^ 0 + ) T ]
For k = 1, 2 … n compute
Time update:
Time update for the weight filter is
θ ^ k = θ ^ k 1 +
Σ θ ¯ , k = Σ θ ¯ , k 1 + + Σ r
Time update for the state filter:
x ^ k = f ( x ^ k 1 + , u k 1 , θ k )
Σ x ¯ , k = A k 1 Σ x ¯ , k 1 + A k 1 T Σ w
Measurement:
Measurement update for the weight filter:
L k θ = Σ θ ¯ , k ( C k θ ) T [ C k θ Σ θ ¯ , k ( C k θ ) T + Σ e ] 1
θ ^ k + = θ ^ k + L k θ [ y k g ( x ^ k , u k , θ ^ k ) ]  
Σ θ ¯ , k = ( I L k θ C k θ ) Σ θ ¯ , k
Measurement update for the state filter:
L k x = Σ x ¯ , k ( C k x ) T [ C k x Σ x ¯ , k ( C k x ) T + Σ v ] 1
x ^ k + = x ^ k + L k x [ y k g ( x ^ k , u k , θ ^ k ) ]
Σ x ¯ , k = ( I L k x C k x ) Σ x ¯ , k
In Figure 4 the process steps of the DEKF are shown. From Figure 4, the double-time update and the double measurement update for time and weight based on EDKF are shown.
When simulating, we introduce the current noise at 0.0125 A in order to improve the estimation accuracy, and the results are shown in Figure 5 and Figure 6, respectively. From Figure 5a, the SOC of the battery is simulated and the actual SOC, estimated SOC, and open-loop SOC results are obtained. It can be observed that the actual SOC is in close range to the estimated SOC although the estimated SOC is slightly higher than the actual SOC, which depicts that the results obtained by the DEKF can be validated. This also illustrates that the application of the DEKF for SOC estimation can yield good results. At the same time, the noise variances for estimated and actual noise are depicted in Figure 5b. The actual noise Actnoise is set at 0.0125 A and the results obtained after the simulation to estimate the senor noise is below the actual sensor noise. This shows that the application of the DEKF in SOC estimation can help keep in check the sensor noise where applicable.
From Figure 6d, the estimated voltage sensor noise is within a close range to the actual voltage sensor range which was set at 0.0125 A. The estimated voltage sensor is within the range of ±0.0125 A, which can easily be eliminated or reduced by moderating the other parameters including temperature, vibration, and cell capacity.

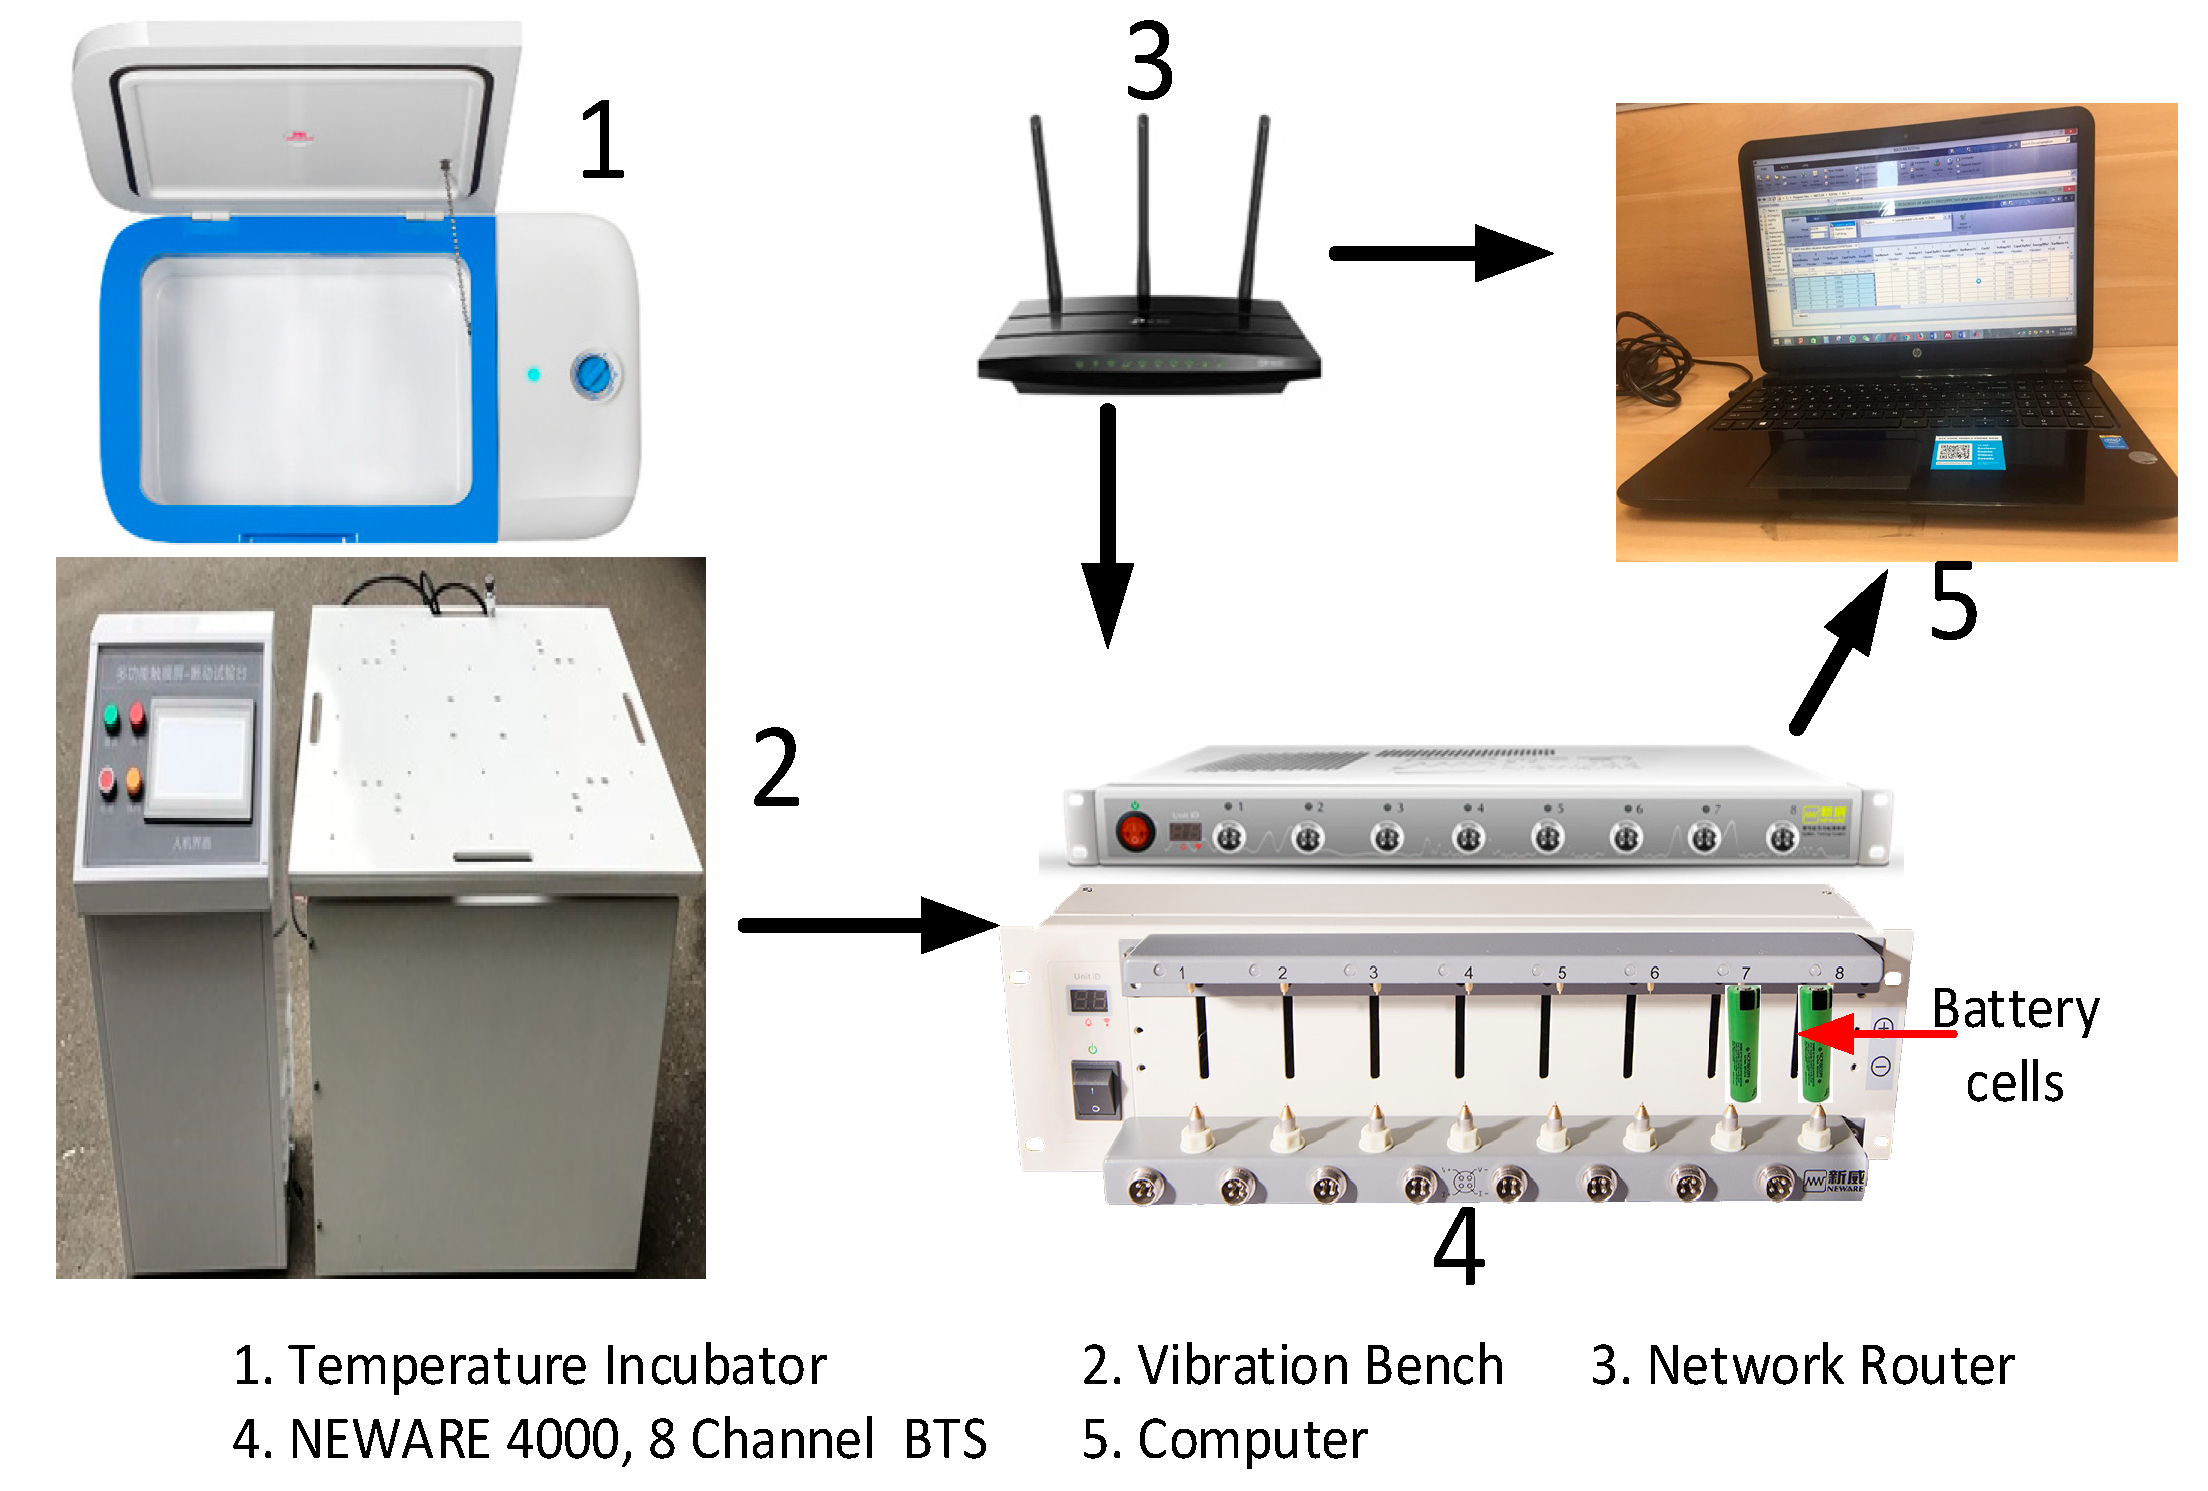
5. Experimental Test System

5.1. Experimental Set-Up

In this study, the LiFePO4 battery is selected as the object during the charge-discharge process under vibration-temperature effects. The experimental data used in this research is acquired through the test bench as shown in Figure 7. The experimental setup of the charge-discharge system in the vibration-temperature effect is comprised of the vibration-temperature simulation system and the BMS, as depicted in Figure 7, which can serve as the simulation for the vibration-temperature effects together with the charge-discharge stress during the actual driving condition of EVs.
The LIB parameters are the rated capacity 2.9 Ah, the nominal voltage 3.6 V, and the charge cut-off voltage 2.5 V. The anode material in LIB is graphite, the cathode material is phosphate, and the septum (intermediate separator) is a polyolefin. The choice of graphite for a conductive additive that can display high electrochemical performance should contain a relatively low surface area, proper size displays, and great functional groups of oxygen [49]. The reaction of the LiFePO4 battery during the charge-discharge process is [50]:
LiFePO 4 x Li + xe Charge x FePO 4 + ( 1 x ) LiFePO 4
x FePO 4 + x Li + + x e discharge x LiFePO 4 + ( 1 x ) FePO 4
The charge behavior, particularly the end of the charge (EOC) characteristic, is different and depends on the battery type [51]. To simulate the vibration-temperature of EVs, and the charge-discharge rate in the process of driving, the battery performance test system is made up of the temperature incubator, the battery test system (NEWARE BTS 4000), the vibration bench, the host computer for human-computer interaction, and the power supply.
The experimental test bench is used to conduct the coupling of temperature and vibration dynamics in the charge and discharge process of LIBs. The bench constitutes five components: the temperature chamber, the vibration bench, the network router, the battery testing system, and the computer. The connection is as shown in Figure 7, with the temperature chamber with batteries inside is placed on top of the vibration bench, and the BTS reads the battery dynamics which are transmitted to the computer system that is having the BTS software installed.
The BTS contains eight channels for receiving the input of the eight batteries which are inserted in the specific section of the BTS as shown; thus, the BTS can accommodates a maximum only 8 battery cells at a time.
The data are collected from many battery cycles and then can be analyzed with the BTS software. To verify the effectiveness of the proposed model MATLAB R2016b is used, using Intel i5 processor, with clock frequency of 2.40 GHz and a RAM of 4 GB, 1 TB HDD, and Windows 10 operating system for the analysis of the battery data. The results which are drawn are represented in the results and discussions section. The vibration bench together with its corresponding parameter values is shown in Figure 8 and Table 2, respectively.

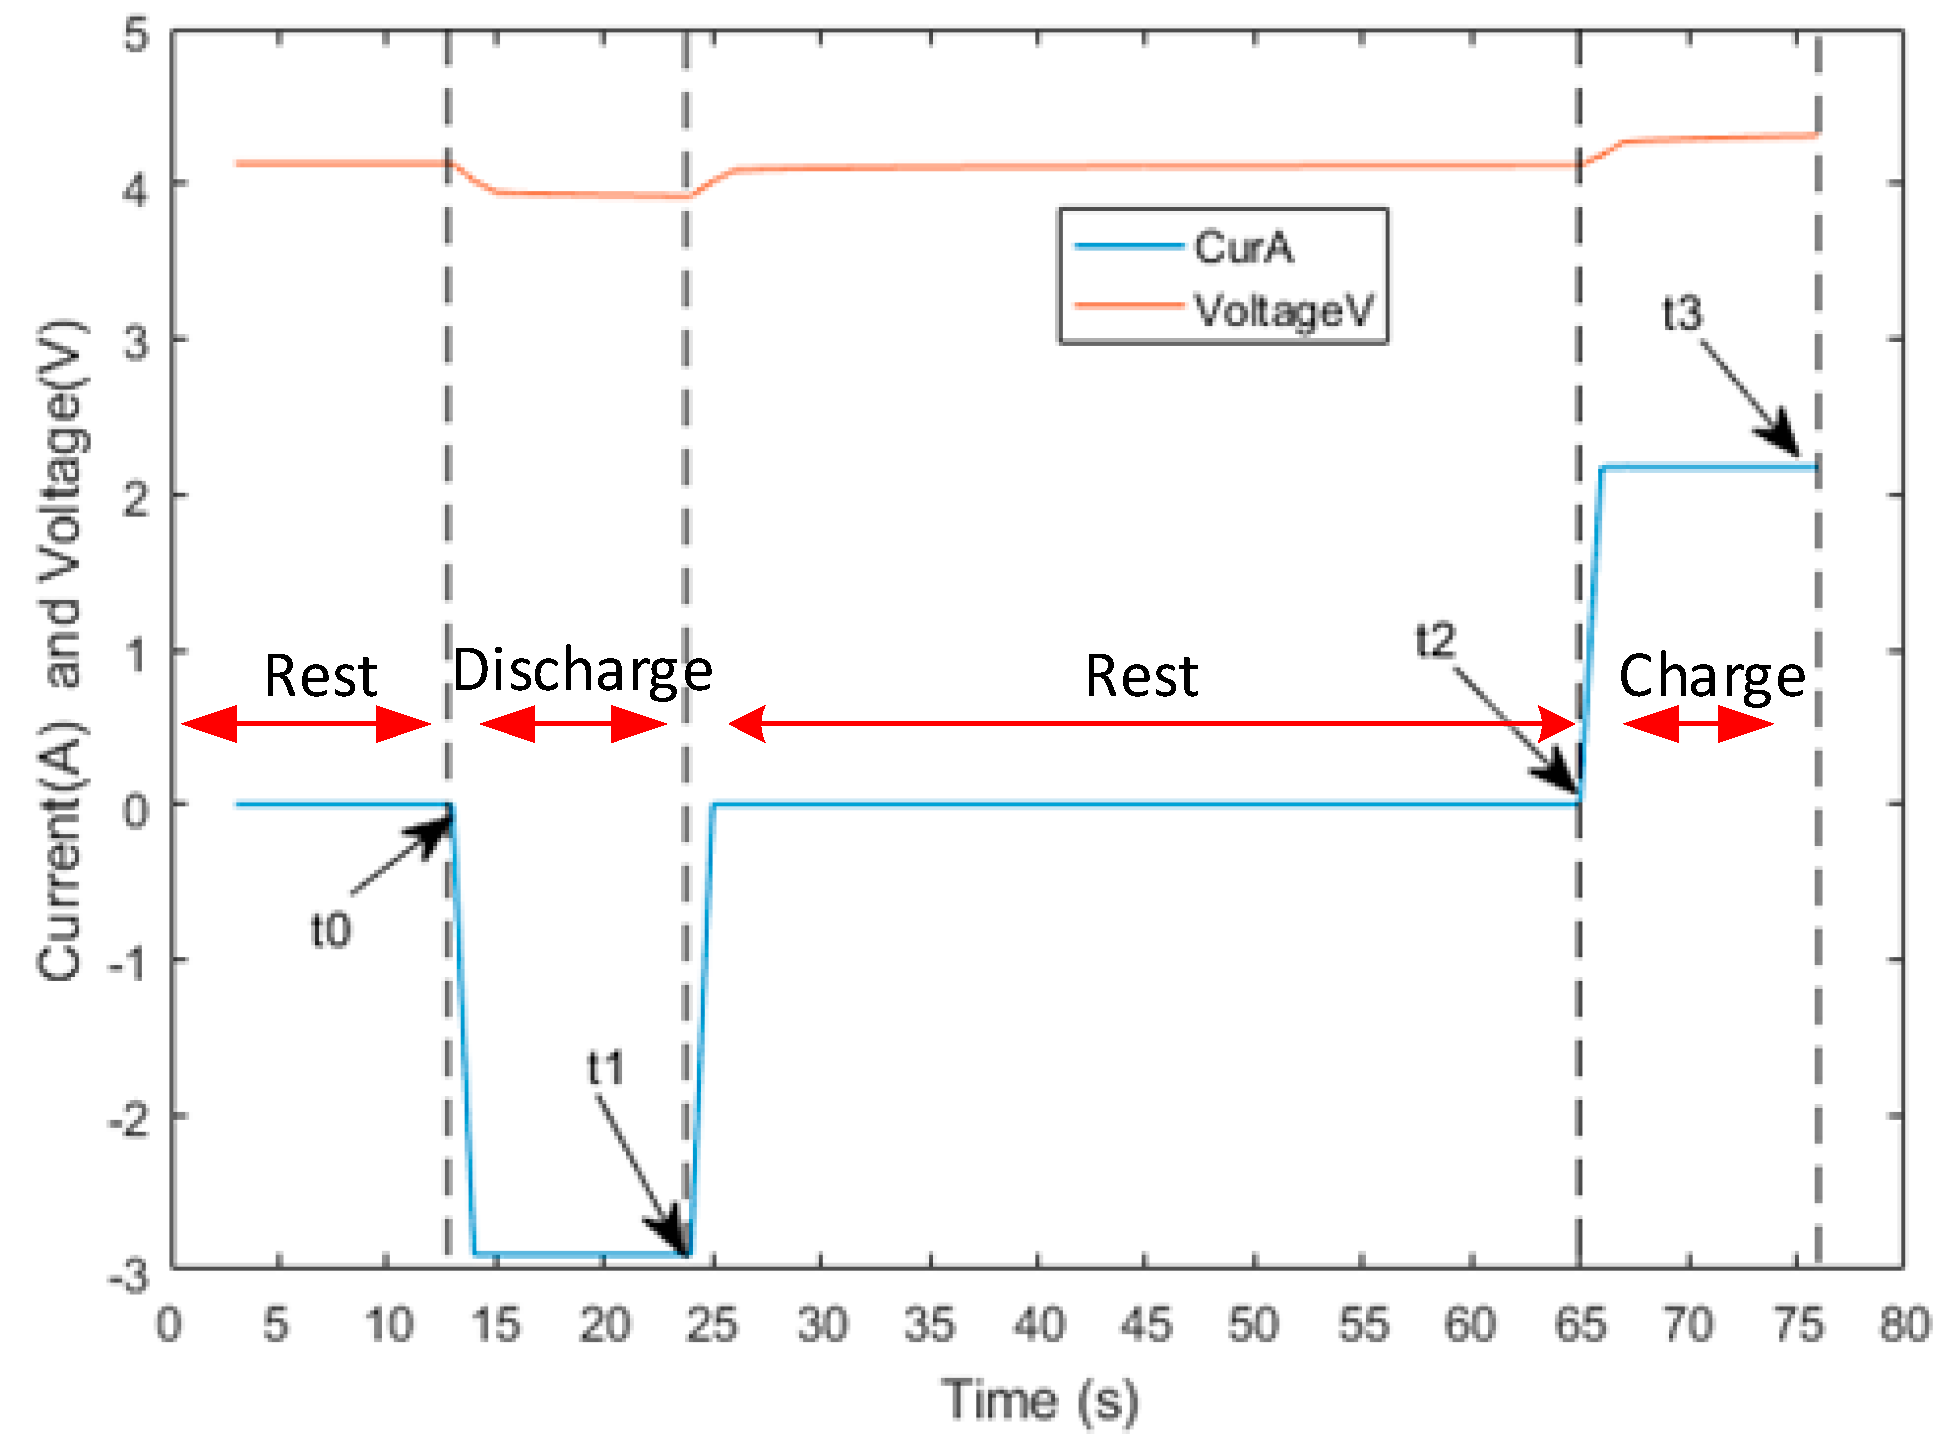
5.2. Experimental Procedures

The LIB studied in this research is a LiFePO4 battery, with the specifications shown in Table 1, and Figure 1, respectively. The charge and discharge cycles of LIB were performed using the battery testing system (NEWARE BTS 4000) in National Centre for Material Service Safety at the University of Science and Technology, Beijing. The NEWARE BTS has a limitation in the number of batteries of eight, so we selected eight health batteries to test their capacities. The capacities of these batteries were measured through the capacity test that was conducted under normal constant-current-constant-voltage (CCCV). The eight fresh cells are firstly discharged to the cut-off voltage of 2.5 V as specified in the battery specifications which corresponds to 100% DOD.
For all LIB cells in this research, a standard CCCV charging profile was applied with a fixed current rate of 1.35 C until the voltage reached 4.20 ± 0.03 V, followed by maintaining the voltage at 4.2 V until the charging current dropped to below 0.05 A. After complete charging, the cell was rested in order for its terminal voltage to stabilize, caused by heating and other parametric dynamics. Consequently, the cells were discharged at a constant current of 1.35 C to a cut-off voltage of 2.5 V, and the cells were each cycled at different temperatures. The terminal voltage and current of the LIB cells are observed online to ensure safe operation and are recorded after every 1 s as an input parameter for the fitting process. The charging/discharging profile process was repeated for a number of cycles so that the data obtained can be used for training and testing. For data analysis, MATLAB R2016b was used.

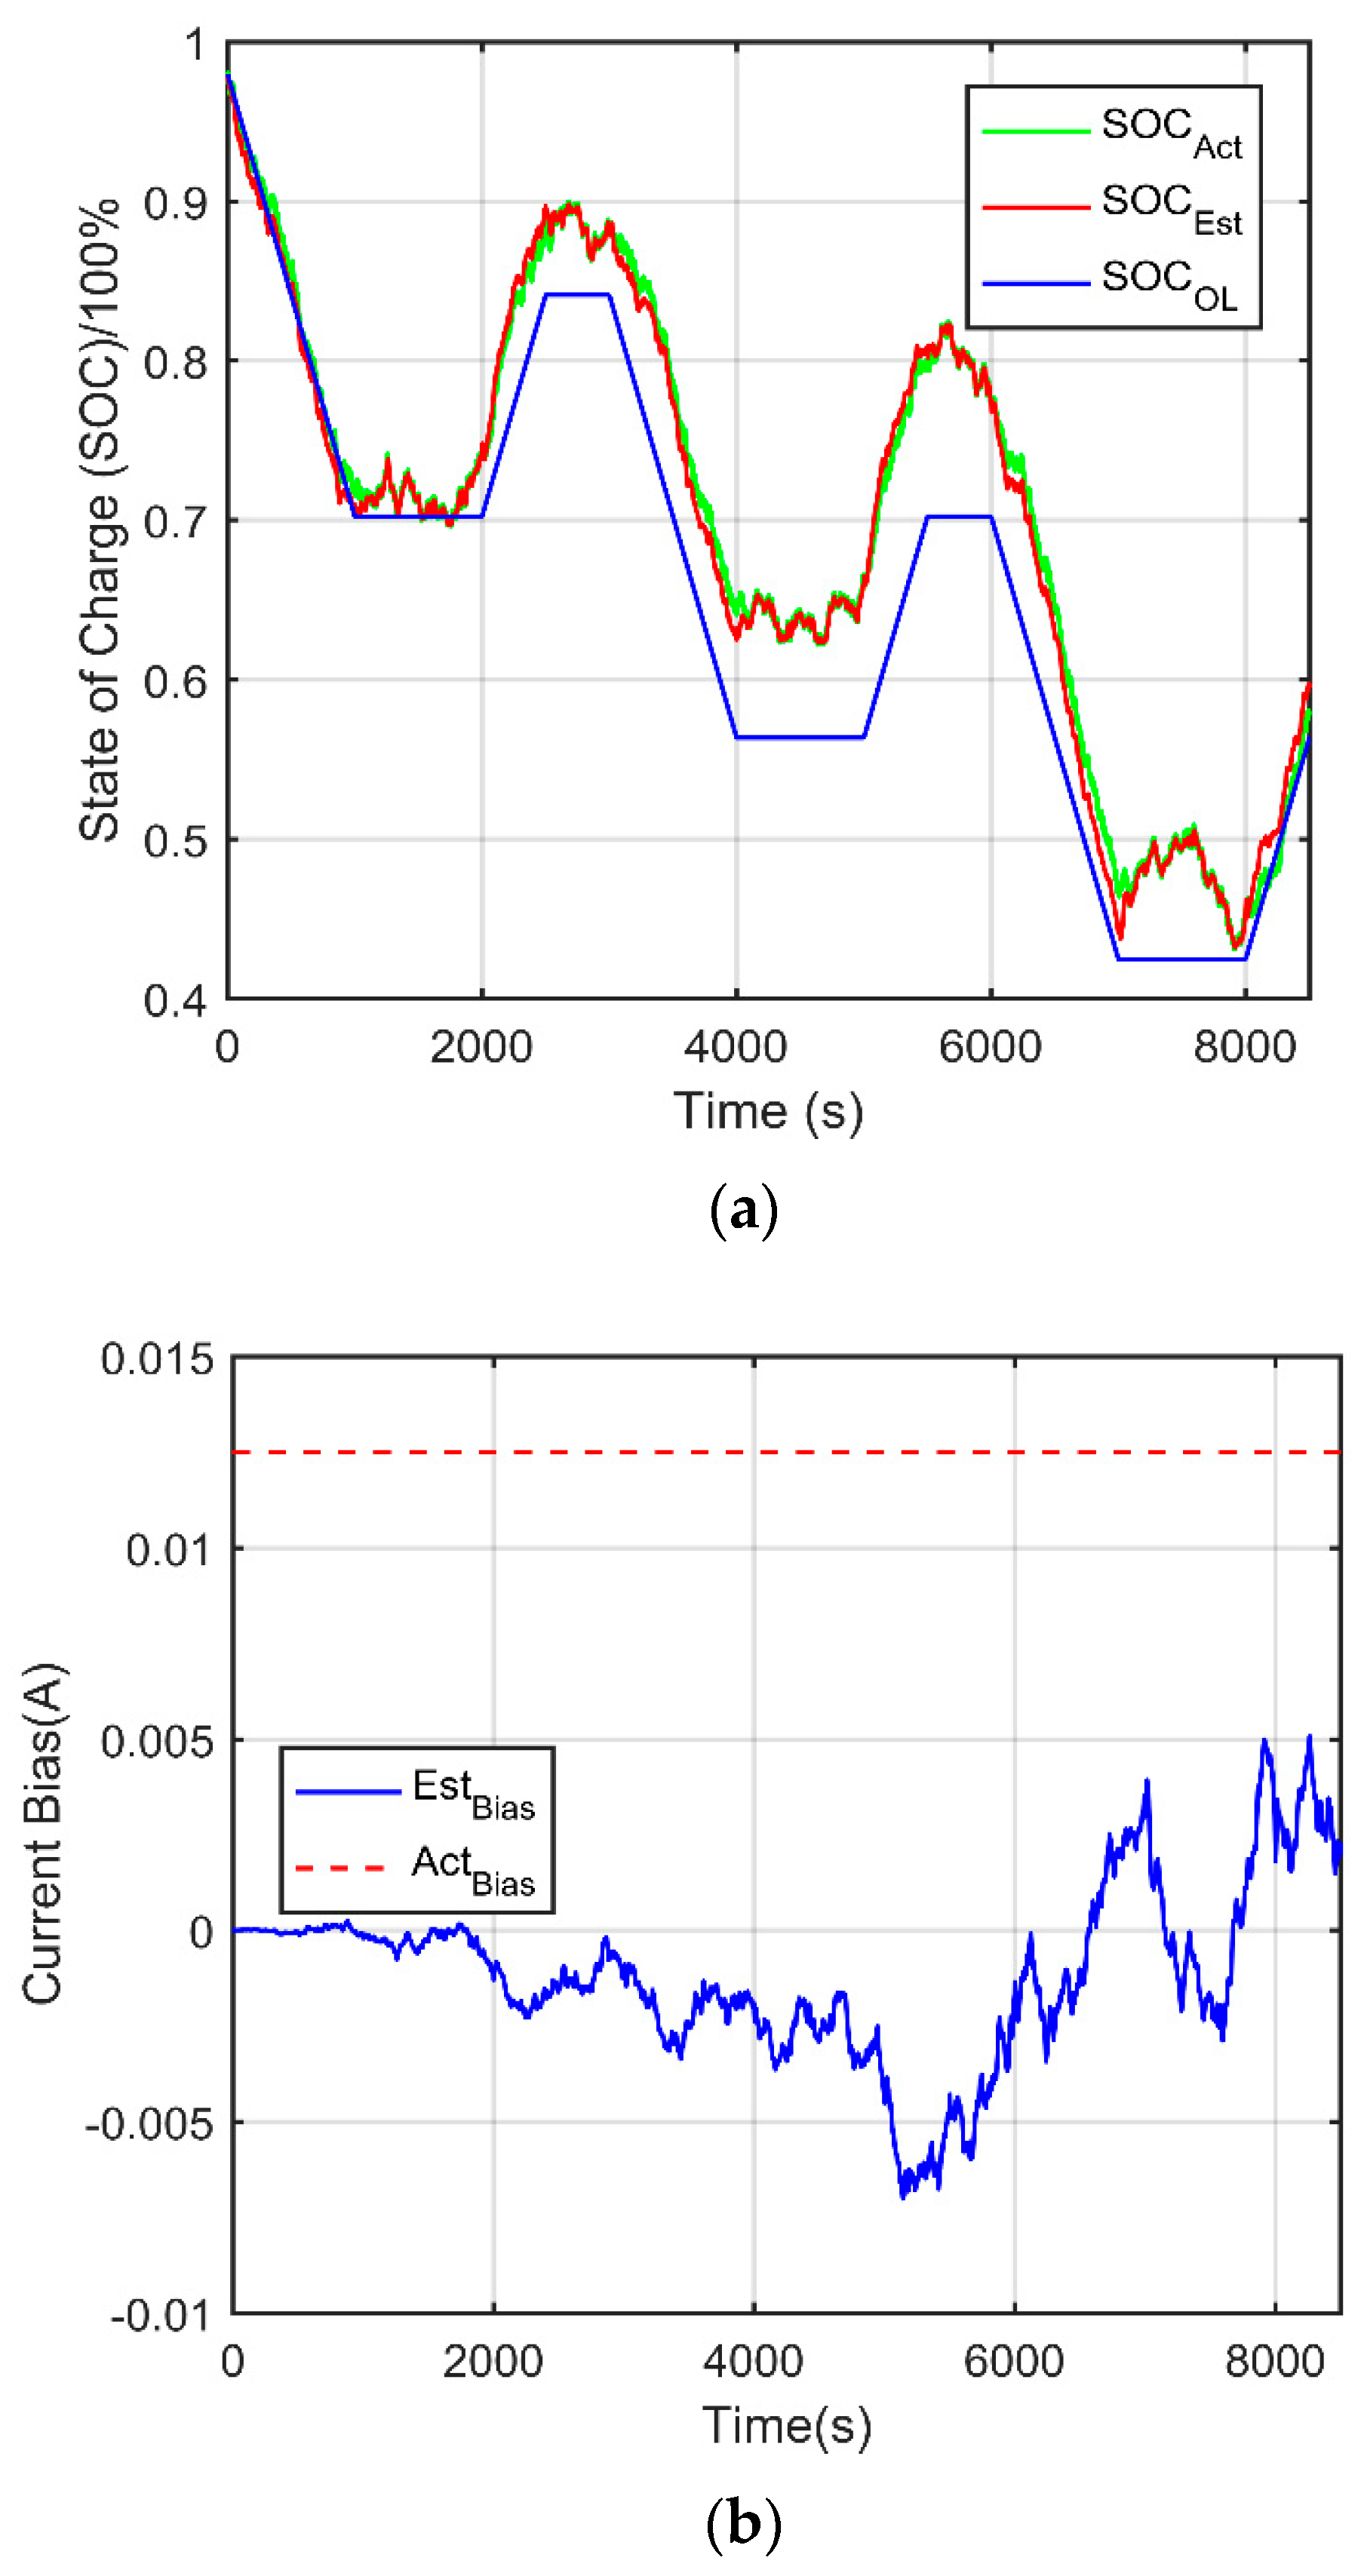
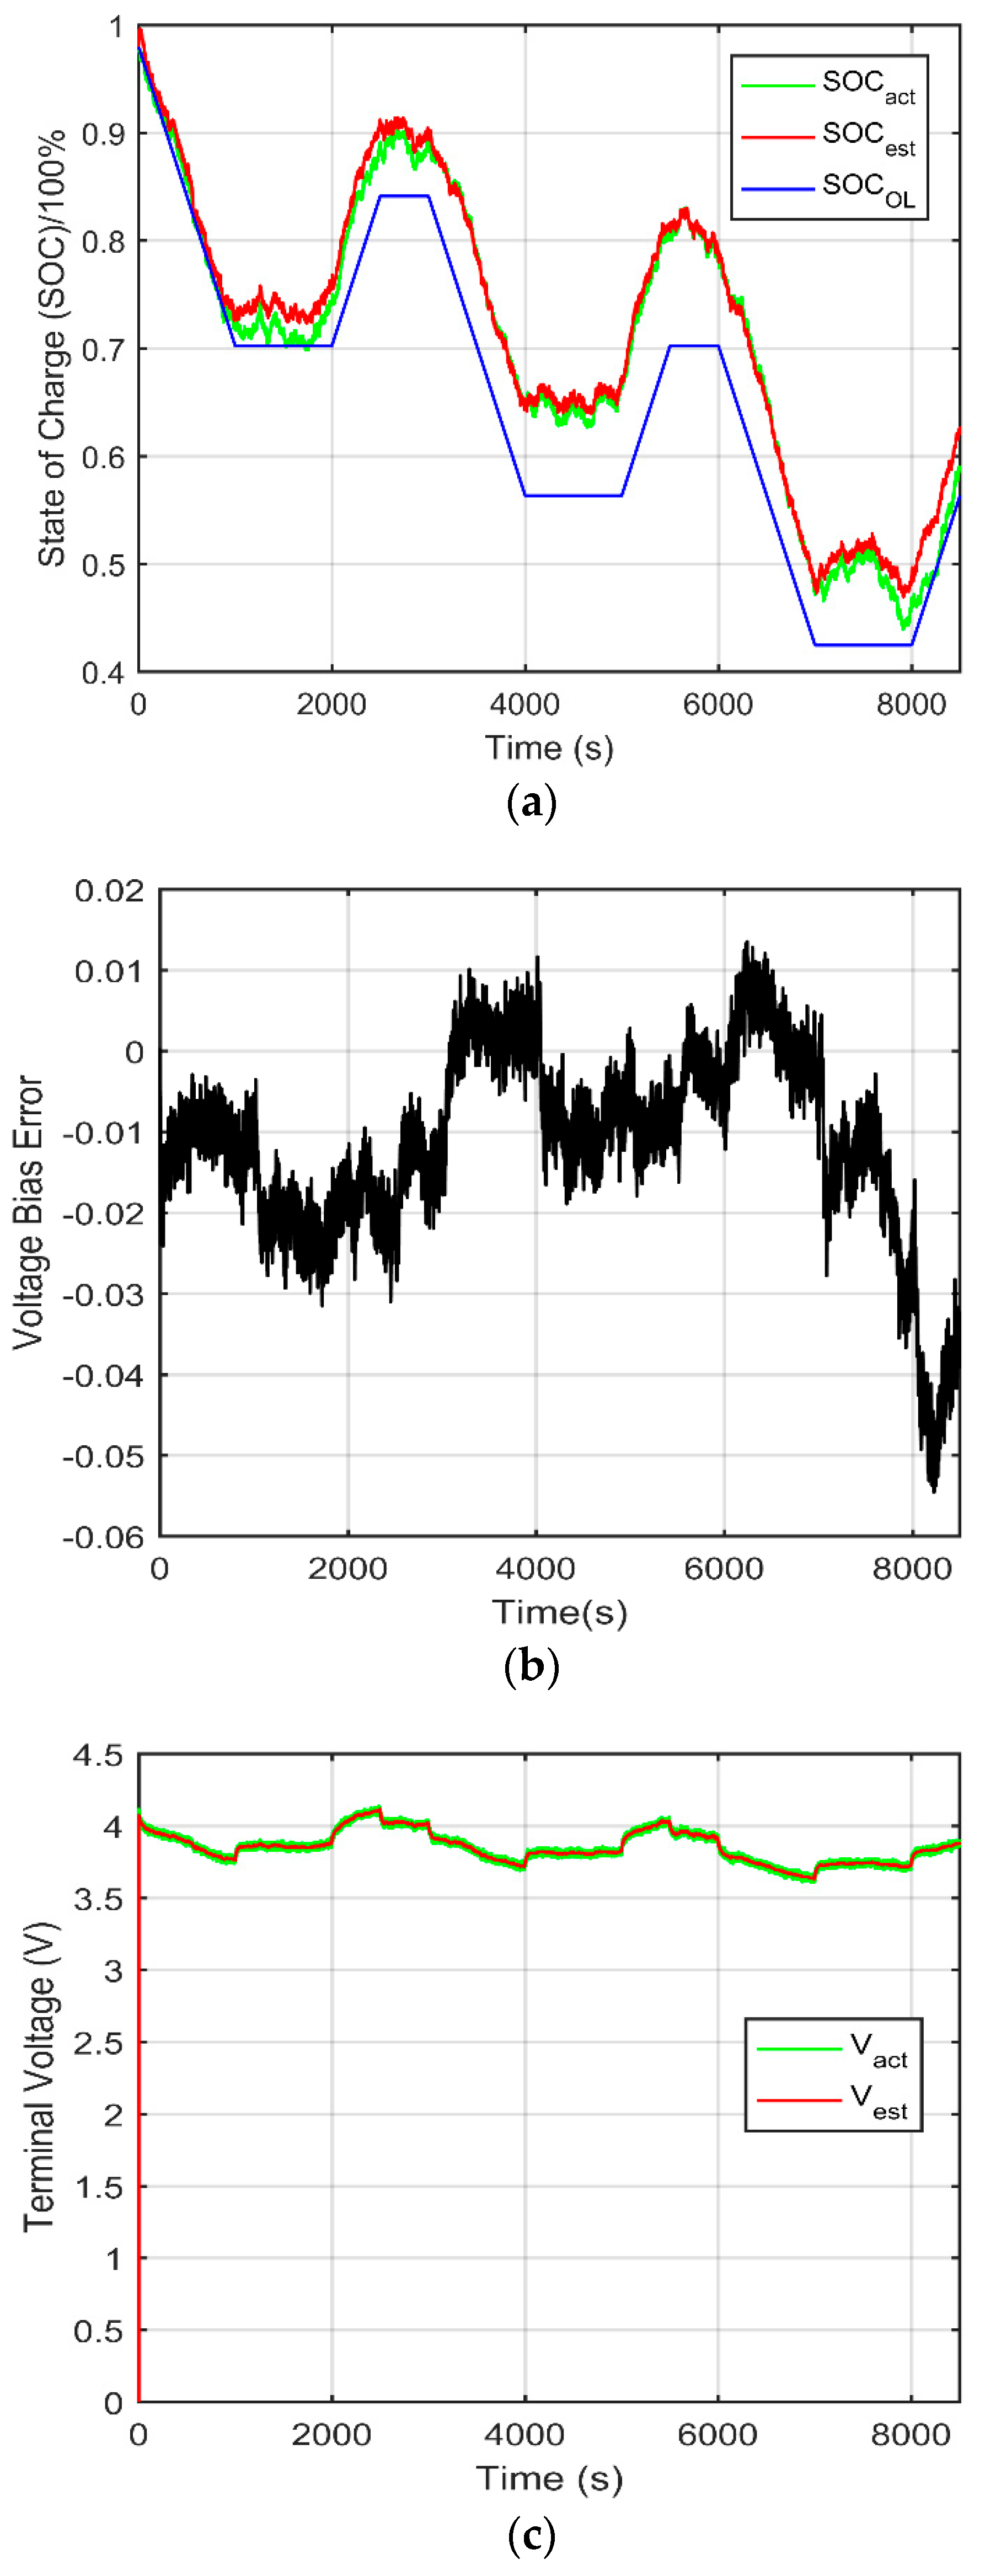
5.3. Results and Discussion

The parameter identification and state estimation of LIBs is characterized through the analysis of voltage and current curves versus time curves, capacity versus time curves, and hybrid pulse power characterization (HPPC) test curve results before vibration and after vibration, and with or without temperature effects.
In Figure 9, the resistance can be calculated through the curve for the HPPC test, basically by identifying the time profile points and their corresponding current and voltage values.
The LIB cell’s test profile, which incorporates both discharge and regen pulses, is conducted through the HPPC test to determine the dynamic power capability of the battery cell’s usable voltage range. After discharge as shown from Figure 9, the HPPC test, for Cell5, we can calculate the resistance. The time points t0, t1, t2, and t3 will aid in calculating the resistance of the battery cell. From Figure 9 t0 = 13 s, t1 = 24 s, t2 = 65 s, t3 = 76 s, respectively.
D i s c h a r g e   R e s i s t a n c e = Δ V d i s c h a r g e Δ I d i s c h a r g e = V t 1 V t 0 ( I t 1 I t 0 ) = V t 1 V t 0 I t 0 I t 1
R e g e n   R e s i s t a n c e = Δ V r e g e n Δ I r e g e n = V t 3 V t 2 ( I t 3 I t 2 ) = V t 3 V t 2 I t 2 I t 3
From Table 3, and using Equations (7) and (8), we can compute the discharge resistance and regen resistance as follows respectively
D i s c h a r g e   R e s i s t a n c e = V t 1 V t 0 I t 0 I t 1 = 3.9186 V 4.1325 V 0 2.9002 = 0.2139 2.9002 = 0.073753   Ω
R e g e n   R e s i s t a n c e = V t 3 V t 2 I t 2 I t 3 = 3.3996 3.2037 0 2.1752 = 0.1959 2.1752 = 0.090061   Ω
The discharge resistance and the regen resistance can be calculated at any point in the curves. The user can freely choose any point of the PULSE in the PULSE step, sample the voltage and current, and then calculate the voltage and current difference to obtain the resistance as shown in our workings. From our experiment, the regen resistance is negative, which means negative differential resistance (NDR), which means that there was an increase in voltage across the battery terminal which resulted in a decrease in current.
From Figure 9, the battery cell that was fully charged was allowed to rest for 10 min before it started to discharge for approximately another 10 min. After full discharge, the battery was allowed to cool down by being allowed to rest for 40 min, and then it was charged again until it attained its maximum charge.
The discharge trajectories of battery cells #5, #6, #7, and #8 are shown in Figure 10a. This discharge took place at constant current as shown in Figure 10b. The battery cut-off voltage was set at 2.5 V for all cells in the battery pack. The discharge voltage dropped spontaneously at constant current, as shown in Figure 10b. But as the current rises, the voltage too rises up to the level where it again becomes constant when the current is maintained at a constant rate, where the current is either zero or negative throughout.
From Figure 10a, when the battery cells reach their cut-off voltage during discharge, they stop discharging, or else they over-discharge and that will affect the battery health state. At this time the current remains constant during the discharge phase and increase immediately the battery stops discharging, as shown in Figure 10b. Similarly, as shown in Figure 10b, the voltage of the cell and current during the charge and discharge phase, depicts how they are affected by the vibration in the system, thus calling the BMS to balance the battery cells in the pack. From Figure 10c, the post-test voltage is lower than the pre-test voltage and the battery reaches its cut-off voltage faster during vibration. Furthermore, as seen in Figure 10e, the battery capacity is lowered with the presence of vibration effect, and hence all these confirm that the presence of vibration effect, affects the battery state.
The battery SOC before and after the vibration test is shown in Figure 10f, and its statistical analysis indicates that the standard deviation of the pre-test battery SOC is 0.2906, while the standard deviation of the post-test battery SOC is 0.3070, thus recording a variance of 0.0164. This shows that vibrations, when induced on battery performance, causes some effects. As vibration frequency increases, as depicted in Figure 11a–c, the charge-discharge capacity is affected, causing a wide gap between individual cell charge and discharge capacity value.
Temperature variations, whether too low or too high, will lead to adverse effects on the battery’s life and battery state. When the temperatures soar so high, a lot of heat is generated, and this affects the SOC and SOH; while when the temperature is too low, it affects the battery life. As the temperature rises, the SOC of the batteries increases in equal measure yielding in the generation of high temperatures that can result in an explosion; thus, the SOC is proportional to the temperature. The performance and mileage of EVs are affected, since the EVs run on roads under different temperature features.
S t a t e o f C h a r g e ( S O C ) = k . T
where k   is a constant k > 0 , and T is the measured temperature.
The LIB’s voltage and capacity at different c-rates is shown in Figure 12. It demonstrates that when the c-rate is low, the SOC is low, but the voltage is higher, as well as the battery cell capacity. Consequently, when the c-rate is higher, the lower the voltage and battery capacity. This demonstrates that the SOC is affected greatly by the variations in c-rates under which the EVs are operating.
From Figure 13, it can be seen that the discharge voltage of battery cell1 at different temperature values differs from each other. At the temperature value of 45°C, there is experienced a higher discharge value of about 2.8 Ah, while at temperature negative 15, the discharge capacity is 2.48 Ah. Thus, there is a variation of discharge capacity of about 11.43% between the two experimental instances of highest and lowest temperature values. This implies that temperature affects the state of the battery charge or discharge values. The battery generates heat during the charge-discharge period, which results in an increase in the surface temperature of the batteries, but the design of the batteries requires them to be tested with temperature control factors similar to the one at which the rising heat temperature and the ambient temperature are balanced. However, batteries are designed in a way that they can operate well under certain temperature ranges, but when such ranges are exceeded then failure may occur in the system due to undesirable occurrences.
When the battery was subjected to low and high temperature, together with a sudden change in battery current, different battery Ohmic polarization resistance values are experienced which oppose the free flow of electric current. The decrease in ambient temperatures causes an instant increase in internal resistance, whereby the resistance of a battery at low temperature is approximately three times that at high temperatures. Therefore, the decrease in ambient temperature causes an increase in internal resistance because as the internal resistance of the battery increase there is corresponding increase in voltage on internal resistance causing a further reduction of the discharge voltage. The Ohmic resistance R 0 of the battery is the resistance which results as the battery is put underuse when undergoing maintenance, or during aging. When the battery is aging, it causes the plates to corrode resulting in the loss of active materials on the plate which further causes the rise in battery impedance; thus, the EV battery pack, which contains many battery cells, can experience impedance differences across the batteries causing imbalances in the battery pack system. The BMS monitors any drastic change in battery impedances and perform equitable battery balancing to ensure that the batteries deliver the required charge to the EVs during the driving cycles. The estimation of R 0 can be used to estimate battery parameters including SOC, SOH, power, etc. According to Ohms law   V = I R , which means that ohmic resistance R = V / I , with the initial battery voltage   U 0 voltage as the current changes   U 1 , and the current   I , ohmic resistance can be calculated as:
R 0 = U 0 U 1 I
From the experiments, the temperature variations gave rise to variations in Ohmic resistance and polarization resistance, as shown in Figure 14. This happens because when the temperature rises, the charging is very fast and a lot of heat is generated, while when the temperature is very low, there is high degradation in the LIB pack cells.
The simulations were performed on the battery pack to establish the relationship of room temperature and internal battery temperature, together with the SOC and SOH, as represented in Figure 15a–d. The battery SOC and SOH is very important to the EVs battery and energy management system as it determines the vehicle’s optimal operating strategy to minimize consumption of fuel, while maximizing the battery back longevity.
Based on the experiments and simulations, the battery is tuned to operate within the current of 0 to −1.2 Amperes. From Figure 15a, the SOC rises steadily during the charge up to 87.41%, which shows that the battery SOC improves when the battery is being charged. The SOH cannot be always 100% as it slightly degrades based on the battery parameter and other environmental functions as shown in Figure 15b. From Figure 15c,d, the internal temperature is usually high, compared to the external temperature, as there is a lot of electrochemical reactions that take place inside the battery, which makes the battery to generate a lot of heat leading to the rise in temperature.

5.4. Future Application of DEKF to Address the Challenges of Battery State Estimation

In the reference [52], the authors systematically reviewed the various battery states from SOC, state-of-energy (SOE), SOH, state-of-power (SOP), state-of-temperature (SOT), and state-of-safety (SOS) respectively. All these battery states depict a battery that is mostly motionless, and hence to make the states to depict a battery which on motion then the battery state-of-vibration (SOV) requires to be introduced to the list. Therefore, the seven battery states will be known as SOC/SOE/SOH/SOP/SOT/SOS/SOV, which will clearly illustrate the battery in motion for the EV. In this literature, there are many challenges that have been outlined, but for the sake of this study’s scope, the challenges of SOC and SOH are discussed in relation to how the application of the DEKF can yield some vital results.
The main challenges of estimating LIBs SOH and SOC include [4,52]:
-
Non-uniform power delivered by the battery as it depends on the current state of the battery;
-
Intensive computational efforts;
-
Difficulty in model parameterization, since parameters requires to be adjusted, and they are difficult to measure them;
-
Poor robustness and relatively low accuracy;
-
The problem of potential over-fitting;
-
The problem of sensitivity of optimization methods in terms of quality and quantity of data, etc.
These problems of battery state estimation can be solved by the DEKF if there is an introduction of model hybridization. In this form, many models are coupled to work together so that their strengths can be taken advantage of. Consequently, the batteries can be fitted with internal sensors to measure the internal battery chemical reactions, and the data relayed in real-time by the BMS for analysis, and quick response in case of any fault that can be predicted thereof. However, hybridization of the algorithms increases the computational burden under various conditions to be implemented in an actual BMS. The power delivered by the battery can be made constant by introducing a backup power source, meaning that on the event the current battery SOC deteriorates, the operations continue as normal.

5.5. Future Research Directions and Discussions

There are many research dimensions that should be pursued, based on our study. They include:
(1) The conversion of vibrational energy into useful power for EVS. This will be a boost in making power savings, instead of the vibrational energy left to go into waste. Vibrational energy can be harvested and stored to boost battery efficiency and lifespan. Vibrations both internal and external if anything to go by will be hard to eliminate and thus the best solution is to make meaningful use of the free energy that is generated out of vibrations.
(2) The conversion of the rising temperature into useful power for the EVs. When batteries are charging or discharging, sometimes there is a rise in temperatures that requires cooling. However, since it is the battery energy that is heating up the battery during charge and discharge, the same can be converted into useful energy in the EV system.
(3) The design and development of smart batteries that can switch themselves off when they get too hot, and restart once they are cooled down again. However, to meet the energy demand for the EVs without stressing up the other unheated batteries, perhaps the battery pack should have a backup to be used up when the heated up batteries automatically switch themselves off. This is an innovative technology using nanotechnology, which could be used to preserve the safety and performance of the batteries.
(4) Model the lithium-ion batteries with coupled vibration and temperature based on the DEKF, since this method reduces the voltage and current sensor noise.

6. Conclusions

The performance of EVs which are powered by batteries can be optimized by improving the efficiency of battery packs on an active energy balancing system for LIBs. This energy balancing can be partly achieved by combining the SOC and SOH estimation, while also looking at other withholding battery parameters including aging, battery mismatch, and cases of rising battery impedances. To achieve the desired results, the BMS will activate the cell balancing in real-time to ensure that the batteries in the EVs battery pack operate within the predefined conditions throughout the driving cycle process. This can also be achieved by further collecting the data on battery capacity and internal resistance in real-time so as to improve state estimation results while ensuring that there is no energy loss during the driving cycles. Several parameters, which include degradation, capacity mismatch, temperature, and vibration, must be considered as vehicles are subjected to operate under diverse conditions. This diversity of the environmental conditions when it keeps varying, the batteries can be affected too yielding to reduced battery efficiency. Specifically, the following conclusions can be drawn from the tests:
(1) The parameter identification was performed using the non-linear fitting methods based on the look-up table of interpolation as discussed.
(2) The battery test samples under vibration at different frequencies were studied and compared with their counterparts under no vibration. It was observed that the capacity of the individual batteries is affected most as the vibration frequency is increased, which can yield to increase of vibrational heat.
(3) The impact of temperature in the charge-discharge of the LIBS was also accessed and discovered that low temperatures can result in over-discharge and affects the lifespan of the battery, while high temperatures increase heat which can result in the fire. The resistance of the battery at low temperature is approximately three times higher than that of the battery at high temperature.
(4) At present, there are few studies on the effect of mechanical vibrations of battery balancing performance. This study suggests that the performance of battery balancing during long-term cycling should be evaluated from various temperatures and vibrational frequencies.
(5) Finally, the variation in battery c-rates affects the battery voltage and capacity; hence, the battery state is affected. The higher the c-rate, the lower the battery capacity and voltage during the charge-discharge period.
From the experimental results, it can be concluded that vibration affects the battery SOC by reducing it by 1.64%, since it was observed between the pre-test and post-test results. Therefore, the presence of vibration affects the performance of the battery and hence the temperature, and vibrations must be considered in the design of the batteries.

Author Contributions

Conceptualization, Z.B.O.; formal analysis, Z.B.O. and L.Z.; funding acquisition, L.Z. and D.S.; methodology, Z.B.O. and L.Z.; supervision, L.Z. and D.S.; validation, L.Z.; writing—original draft, Z.O.; writing—review & editing, L.Z. and H.K. All authors have read and agreed to the published version of the manuscript.

Funding

This work was financially supported by the Joint Fund of Ministry of Education of China for Equipment Pre-research (No. 6141A0202022260), the Fundamental Research Funds for Central Universities of China (No. FRF-BD-18-001A), and the National Natural Science Foundation of China (No. 51775037). And this work was also financially supported by the China Scholarship Council (CSC).

Conflicts of Interest

The authors declare no conflict of interest regarding the publication of this paper. The funders had no role in the design of the study; in the collection, analyses, or interpretation of data; in the writing of the manuscript, or in the decision to publish the results.

Abbreviations

AKFAdaptive Kalman filter
AEKFAdaptive extended Kalman filter
BTSBattery testing system
BMSBattery management system
CCCVConstant current constant voltage
DODDepth-of-discharge
DEKFDual-extended Kalman filter
ECMEquivalent circuit voltage
EOLEnd of life
EVsElectric vehicles
EKFExtended Kalman filter
HPPCHybrid pulse power characterization
KFKalman filter
LIBLithium-ion battery
MATLABMATrix LABoratory
OCVOpen-circuit voltage
RCResistance-capacitance
RLSRecursive least square
SOCState-of-charge
SOHState-of-health
SOEState-of-energy
SOFState-of-function
SOPState-of-power
SOTState-of-temperature
SOSState-of-safety
SOVState-of-vibration
UKFUnscented Kalman filter
VEHsVibration al energy harvesters

References

  1. Misyris, G.S.; Doukas, D.I.; Papadopoulos, T.A.; Labridis, D.P.; Agelidis, V.G. State-of-Charge Estimation for Li-Ion Batteries: A More Accurate Hybrid Approach. IEEE Trans. Energy Convers. 2018, 34, 109–119. [Google Scholar] [CrossRef] [Green Version]
  2. Leng, F.; Tan, C.M.; Pecht, M. Effect of Temperature on the Aging rate of Li Ion Battery Operating above Room Temperature. Sci. Rep. 2015, 5, 1–12. [Google Scholar] [CrossRef] [Green Version]
  3. Omariba, Z.; Zhang, L.; Sun, D. Review on Health Management System for Lithium-Ion Batteries of Electric Vehicles. Electronics 2018, 7, 72. [Google Scholar] [CrossRef] [Green Version]
  4. Baek, D.; Chen, Y.K.; Bocca, A.; Bottaccilli, L.; Di Cataldo, S.; Gatteschi, V.; Pagliari, D.J.; Patti, E.; Urgese, G.; Chang, N.; et al. Battery-Aware operation range estimation for terrestrial and aerial electric vehicles. IEEE Trans. Veh. Technol. 2019, 68, 5471–5482. [Google Scholar] [CrossRef]
  5. Baek, D.; Chen, Y.; Bocca, A.; di Cataldo, S.; Chang, N. Estimation of the residual energy in battery electric vehicles. In Proceedings of the 2019 AEIT International Conference of Electrical and Electronic Technologies for Automotive (AEIT AUTOMOTIVE), Torino, Italy, 2–4 July 2019; IEEE: Piscataway, NJ, USA, 2019; pp. 1–6. [Google Scholar]
  6. Zhang, L.; Mu, Z.; Gao, X. Coupling Analysis and Performance Study of Commercial 18650 Lithium-Ion Batteries under Conditions of Temperature and Vibration. Energies 2018, 11, 2856. [Google Scholar] [CrossRef] [Green Version]
  7. Hooper, J.M.; Marco, J.; Chouchelamane, G.H.; Lyness, C.; Taylor, J. Vibration durability testing of Nickel Cobalt Aluminum Oxide (NCA) lithium-ion 18,650 battery cells. Energies 2016, 9, 281. [Google Scholar] [CrossRef] [Green Version]
  8. Hooper, J.M.; Marco, J.; Chouchelamane, G.H.; Chevalier, J.S.; Williams, D. Multi-axis vibration durability testing of lithium ion 18650 NCA cylindrical cells. J. Control Sci. Eng. 2018, 15, 103–123. [Google Scholar] [CrossRef]
  9. Zhang, L.; Ning, Z.; Peng, H.; Mu, Z.; Sun, C. Effects of Vibration on the Electrical Performance of Lithium-Ion Cells Based on Mathematical Statistics. Appl. Sci. 2017, 7, 802. [Google Scholar] [CrossRef] [Green Version]
  10. Chiang, C.J.; Yang, J.L.; Cheng, W.C. Temperature and state-of-charge estimation in ultracapacitors based on extended Kalman filter. J. Power Sources 2013, 2234, 234–243. [Google Scholar] [CrossRef]
  11. Chaoui, H.; Gualous, H. Online parameter and state estimation of lithium-ion batteries under temperature effects. Electr. Power Syst. Res. 2017, 145, 73–82. [Google Scholar] [CrossRef]
  12. Qu, Z.G.; Jiang, Z.Y.; Wang, Q. Experimental study on pulse self–heating of lithium–ion battery at low temperature. Int. J. Heat Mass Transf. 2019, 135, 696–705. [Google Scholar] [CrossRef]
  13. Xi, Z.; Dahmardeh, M.; Xia, B.; Fu, Y.; Mi, C. Learning of Battery Model Bias for Effective State of Charge Estimation of Lithium-ion Batteries. IEEE Trans. Veh. Technol. 2019, 68, 8613–8628. [Google Scholar] [CrossRef]
  14. Arachchige, B.; Perinpanayagam, S.; Jaras, R. Enhanced Prognostic Model for Lithium Ion Batteries Based on Particle Filter State Transition Model Modification. Appl. Sci. 2017, 7, 1172. [Google Scholar] [CrossRef] [Green Version]
  15. Abada, S.; Marlair, G.; Lecocq, A.; Petit, M.; Sauvant-Moynot, V.; Huet, F. Safety focused modeling of lithium-ion batteries: A review. J. Power Sources 2016, 306, 178–192. [Google Scholar] [CrossRef]
  16. Zhang, L.; Peng, H.; Ning, Z.; Mu, Z.; Sun, C. Comparative Research on RC Equivalent Circuit Models for Lithium-Ion Batteries of Electric Vehicles. Appl. Sci. 2017, 7, 1002. [Google Scholar] [CrossRef] [Green Version]
  17. Rivera-Barrera, J.; Muñoz-Galeano, N.; Sarmiento-Maldonado, H. SoC Estimation for Lithium-ion Batteries: Review and Future Challenges. Electronics 2017, 6, 102. [Google Scholar] [CrossRef] [Green Version]
  18. Ramadan, H.S.; Becherif, M.; Claude, F. Extended kalman filter for accurate state of charge estimation of lithium-based batteries: A comparative analysis. Int. J. Hydrogen Energy 2017, 42, 29033–29046. [Google Scholar] [CrossRef]
  19. Liu, G.; Xu, C.; Jiang, K.; Wang, K. State of charge and model parameters estimation of liquid metal batteries based on adaptive unscented Kalman filter. Energy Procedia 2019, 158, 4477–4482. [Google Scholar] [CrossRef]
  20. He, W.; Pecht, M.; Flynn, D.; Dinmohammadi, F. A Physics-Based Electrochemical Model for Lithium-Ion Battery State-of-Charge Estimation Solved by an Optimised Projection-Based Method and Moving-Window Filtering. Energies 2018, 11, 2120. [Google Scholar] [CrossRef] [Green Version]
  21. Luo, Y.; Kan, Y.; Yin, Y.; Liu, L.; Cui, H.; Wu, F. Study on a High-Accuracy Real-Time Algorithm to Estimate SOC of Multiple Battery Cells Simultaneously. J. Control Sci. Eng. 2017, 2017, 1–11. [Google Scholar] [CrossRef] [Green Version]
  22. Orcioni, S.; Buccolini, L.; Ricci, A.; Conti, M. Lithium-ion Battery Electrothermal Model, Parameter Estimation, and Simulation Environment. Energies 2017, 10, 375. [Google Scholar] [CrossRef] [Green Version]
  23. Zhang, C.; Allafi, W.; Dinh, Q.; Ascencio, P.; Marco, J. Online estimation of battery equivalent circuit model parameters and state of charge using decoupled least squares technique. Energy 2018, 142, 678–688. [Google Scholar] [CrossRef]
  24. Yang, X.; Chen, L.; Xu, X.; Wang, W.; Xu, Q.; Lin, Y.; Zhou, Z. Parameter identification of electrochemical model for vehicular lithium-ion battery based on particle swarm optimization. Energies 2017, 10, 1811. [Google Scholar] [CrossRef] [Green Version]
  25. Li, J.; Lai, Q.; Wang, L.; Lyu, C.; Wang, H. A method for SOC estimation based on simplified mechanistic model for LiFePO4 battery. Energy 2016, 114, 1266–1276. [Google Scholar] [CrossRef]
  26. Xiong, R.; Cao, J.; Yu, Q.; He, H.; Sun, F. Critical Review on the Battery State of Charge Estimation Methods for Electric Vehicles. IEEE Access 2017, 6, 1832–1843. [Google Scholar] [CrossRef]
  27. Luo, Q.; He, X.; Jiang, S.; Wang, X. Impact-Based Electromagnetic Energy Harvester with. Energies 2017, 10, 1848. [Google Scholar] [CrossRef] [Green Version]
  28. Brand, M.J.; Schuster, S.F.; Bach, T.; Fleder, E.; Stelz, M.; Glaser, S.; Muller, J.; Sextl, G.; Jossen, A. Effects of vibrations and shocks on lithium-ion cells. J. Power Sources 2015, 288, 62–69. [Google Scholar] [CrossRef]
  29. Zhang, M.; Fan, X. Review on State of Charge Estimation Methods for Electric Vehicle Battery. World Electr. Veh. J. 2020, 11, 23. [Google Scholar] [CrossRef] [Green Version]
  30. Kong, Q.; Ruan, M.; Zi, Y. A health management system for marine cell group. IOP Conf. Ser. Earth Environ. Sci. 2017, 69, 1–7. [Google Scholar] [CrossRef] [Green Version]
  31. Capron, O.; Jaguemont, J.; Gopalakrishnan, R.; van den Bossche, P.; Omar, N.; van Mierlo, J. Impact of the Temperature in the Evaluation of Battery Performances During Long-Term Cycling—Characterisation and Modelling. Appl. Sci. 2018, 8, 1364. [Google Scholar] [CrossRef] [Green Version]
  32. Lin, J.-C.M. Development of a New Battery Management System with an Independent Balance Module for Electrical Motorcycles. Energies 2017, 10, 1289. [Google Scholar] [CrossRef] [Green Version]
  33. Gandoman, F.H.; Ahmadi, A.; Van den Bossche, P.; Van Mierlo, J.; Omar, N.; Nezhad, A.E.; Mavalizadeh, H.; Mayet, C. Status and future perspectives of reliability assessment for electric vehicles. Reliab. Eng. Syst. Saf. 2019, 183, 1–16. [Google Scholar] [CrossRef]
  34. Daowd, M.; Omar, N.; van den Bossche, P.; van Mierlo, J. Capacitor based battery balancing system. World Electr. Veh. J. 2012, 5, 385–393. [Google Scholar] [CrossRef] [Green Version]
  35. Andwari, M.; Pesiridis, A.; Rajoo, S.; Martinez-Botas, R.; Esfahanian, V. A review of Battery Electric Vehicle technology and readiness levels. Renew. Sustain. Energy Rev. 2017, 78, 414–430. [Google Scholar] [CrossRef]
  36. Dai, H.; Zhu, L.; Zhu, J.; Wei, X.; Sun, Z. Adaptive Kalman filtering based internal temperature estimation with an equivalent electrical network thermal model for hard-cased batteries. J. Power Sources 2015, 293, 351–365. [Google Scholar] [CrossRef]
  37. Xing, Y.; He, W.; Pecht, M.; Tsui, K.L. State of charge estimation of lithium-ion batteries using the open-circuit voltage at various ambient temperatures. Appl. Energy 2014, 113, 106–115. [Google Scholar] [CrossRef]
  38. Yu, T.K.; Tseng, A.; Yen, J.; Fu, T.; Huang, E. Battery cell modeling and online estimation of the state of charge of a lithium-ion battery. J. Chin. Inst. Eng. 2018, 41, 412–418. [Google Scholar]
  39. Lu, L.; Han, X.; Li, J.; Hua, J.; Ouyang, M. A review on the key issues for lithium-ion battery management in electric vehicles. J. Power Sources 2013, 226, 272–288. [Google Scholar] [CrossRef]
  40. Xi, Z.; Jing, R.; Yang, X.; Decker, E. State of Charge Estimation of Lithium-Ion Batteries Considering Model Bias and Parameter Uncertainties. In Proceedings of the ASME 2014 International Design Engineering Technical Conferences & Computers and Information in Engineering Conference IDETC/CIE 2014, Buffalo, NY, USA, 17–20 August 2014; pp. 1–7. [Google Scholar]
  41. Hannan, M.A.; Lipu, M.S.H.; Hussain, A.; Mohamed, A. A review of lithium-ion battery state of charge estimation and management system in electric vehicle applications: Challenges and recommendations. Renew. Sustain. Energy Rev. 2017, 78, 834–854. [Google Scholar] [CrossRef]
  42. Perdana, F.A.; Supriyanto, A.; Purwanto, A.; Jamaluddin, A. Study of imbalanced internal resistance on drop voltage of LiFePO 4 battery system connected in parallel. J. Phys. Conf. Ser. 2017, 795, 012036. [Google Scholar] [CrossRef] [Green Version]
  43. Feng, X.N.; Weng, C.H.; He, X.M.; Han, X.B.; Lu, L.G.; Ren, D.S.; Ouyang, M.G. Online State-of-Health Estimation for Li-ion Battery Using Partial Charging Segment Based on Support Vector Machine. IEEE Trans. Veh. Technol. 2019, 68, 8583–8592. [Google Scholar] [CrossRef]
  44. Huang, S.; Tseng, K.; Liang, J.; Chang, C.; Pecht, M.G. An Online SOC and SOH Estimation Model for Lithium-Ion Batteries. Energies 2017, 10, 512. [Google Scholar] [CrossRef]
  45. Wassiliadis, N.; Adermann, J.; Frericks, A.; Pak, M.; Reiter, C.; Lohmann, B.; Lienkamp, M. Revisiting the dual extended Kalman filter for battery state-of-charge and state-of-health estimation: A use-case life cycle analysis. J. Energy Storage 2018, 19, 73–87. [Google Scholar] [CrossRef]
  46. Zheng, L.; Zhu, J.; Wang, G.; Lu, D.D.C.; He, T. Differential voltage analysis based state of charge estimation methods for lithium-ion batteries using extended Kalman filter and particle filter. Energy 2018, 158, 1028–1037. [Google Scholar] [CrossRef]
  47. Wang, L.; Lu, D.; Liu, Q.; Liu, L.; Zhao, X. State of charge estimation for LiFePO4 battery via dual extended kalman filter and charging voltage curve. Electrochim. Acta 2019, 296, 1009–1017. [Google Scholar] [CrossRef]
  48. Fang, L.; Li, J.; Peng, B. Online estimation and error analysis of both SOC and SOH of lithium-ion battery based on DEKF method. Energy Procedia 2019, 158, 3008–3013. [Google Scholar] [CrossRef]
  49. Shi, Y.; Wen, L.; Pei, S.; Wu, M.; Li, F. Choice for graphene as conductive additive for cathode of lithium-ion batteries. J. Energy Chem. 2019, 30, 19–26. [Google Scholar] [CrossRef] [Green Version]
  50. Li, W.; Jiao, Z.; Zhou, L. Analysis of performance degradation and residual life prediction of batteries for electric vehicles under driving conditions. IEEJ Trans. Electr. Electron. Eng. 2019, 14, 493–498. [Google Scholar] [CrossRef]
  51. Tremblay, O.; Dessaint, L.A. Experimental Validation of a Battery Dynamic Model for EV Applications. World Electr. Veh. J. 2015, 3, 289–298. [Google Scholar]
  52. Hu, X.; Feng, F.; Liu, K.; Zhang, L.; Xie, J.; Liu, B. State estimation for advanced battery management: Key challenges and future trends. Renew. Sustain. Energy Rev. 2019, 114, 109334. [Google Scholar] [CrossRef]
Figure 1. A cylindrical cell LiFePO4 (A18650) used in this work.
Wevj 11 00050 g001
Figure 2. The equivalent circuit model (ECM) for lithium-ion battery.
Wevj 11 00050 g002
Figure 3. Model parameter identification based on the recursive least square algorithm.
Wevj 11 00050 g003
Figure 4. The dual extended Kalman filter (DEKF) process steps.
Wevj 11 00050 g004
Figure 5. Results for DEKF model with current noise of 0.0125A: (a) DEKF based state of charge (SOC) estimation; (b) DEKF based parameter estimation.
Wevj 11 00050 g005
Figure 6. Simulation results for DEKF model with voltage bias: (a) SOC estimation; (b) Error estimation; (c) terminal voltage estimation; (d) voltage sensor noise
Wevj 11 00050 g006aWevj 11 00050 g006b
Figure 7. Experimental test bench with vibration and temperature chambers.
Wevj 11 00050 g007
Figure 8. ZD/AB-XTP Vibration Test Bench.
Wevj 11 00050 g008
Figure 9. Battery cell charge-discharge states and time points for resistance calculation.
Wevj 11 00050 g009
Figure 10. Discharge trajectories of battery cells: (a) discharge with no vibration in battery cell 5–8, (b) discharge voltage-current vs. time, (c) discharge-voltage before and after vibration, (d) discharge-capacity before and after vibration, (e) discharge capacity before vibration (0 Hz) and after vibration (f = 10 Hz), and (f) pre-test and post-test battery SOC.
Wevj 11 00050 g010aWevj 11 00050 g010bWevj 11 00050 g010c
Figure 11. Effects of vibrations on battery state of charge-discharge capacity: (a) HPPC test for battery cell SOC after vibration F = 10 Hz stopped; (b) battery cell charge-discharge capacity after and before vibration F = 30 Hz; (c) battery cell charge and discharge capacity without vibration.
Wevj 11 00050 g011
Figure 12. LIB’s voltage-capacity trajectory at different c-rates.
Wevj 11 00050 g012
Figure 13. Battery cell1 discharge voltage at different temperatures.
Wevj 11 00050 g013
Figure 14. Relationship of temperature and resistance.
Wevj 11 00050 g014
Figure 15. Simulation results of battery pack: (a) state-of-charge, (b) state-of-health, (c) internal temperature curve, (d) internal and external temperature variations
Wevj 11 00050 g015aWevj 11 00050 g015b
Table 1. Characteristics of the cell under investigation-18650 lithium-ion battery (LIB) cell.
Cell PropertyValue
Nominal capacity2.9 Ah
Rated capacity2.7 Ah
Nominal voltage3.6 V
Dimensions (D × l)18 mm × 65 mm
Internal resistance35 mΩ
Charging Voltage4.20 ± 0.03V
End of Discharge Voltage2.5 V
Standard charging current1.35 A
Charge/discharge efficiency80–90%
Approximate Weight47.0 g
SeriesCylindrical cell
Table 2. Specifications of the vibration generator.
PropertyValuePropertyValue
Maximum acceleration20 gAmplitude Range0~5 mm
Frequency range (0.1 Hz)1~600 HzVibration waveformSine wave (half-wave/full-wave)
Rated Frequency1–600 HzVibration directionUp and down + left and right + before and after (three axes)
Table size1000 × 1000 mmPrecision0.1 Hz
Max. Test Load100 kgPower5 Kw
Table 3. Hybrid pulse power characterization (HPPC) test profile table for battery cell1.
Time Rise (s)Cumulative Time (s)Relative Current (I)Relative Voltage (V)
131304.1325
1124−2.90023.9186
416504.1183
11762.17524.3086

