Article

Study on the Capacity Fading Effect of Low-Rate Charging on Lithium-Ion Batteries in Low-Temperature Environment

1
China Electric Power Research Institute, Beijing 100085, China
2
School of Electrical and Electronic Engineering, Harbin University of Science and Technology, Harbin 150080, China
3
State Key Laboratory of Automotive Safety and Energy, Tsinghua University, Beijing 100084, China
*
Author to whom correspondence should be addressed.
World Electr. Veh. J. 2020, 11(3), 55; https://0-doi-org.brum.beds.ac.uk/10.3390/wevj11030055
Submission received: 26 June 2020 / Revised: 25 July 2020 / Accepted: 5 August 2020 / Published: 7 August 2020

Abstract

:
By taking a cylindrical LiFePO4 power battery as the research object, the cycle performance test was conducted under different charging current aging paths in a preset low-temperature environment and combined with EIS results to analyze the dynamic characteristics of the battery during the aging process, using the PDF (Probability Density Function) curve to analyze the change of battery energy storage characteristics, and analyze the aging mechanism of the power battery by analyzing the change in the lithium precipitation energy difference. The experimental results showed that under a low-temperature environment, the effect of increasing the charge rate is mainly reflected in slowing down the phase transformation reaction. From the analysis of lithium precipitation of the battery, it can be seen that the main mechanism of the aging of the battery is the loss of active lithium under the conditions of low-rate cycling at sub-zero temperature. The products from the side reaction between the lithium plating and the electrolyte build up on the SEI (Solid Electrolyte Interphase) film, which significantly increases the battery impedance late in the cycle. The work in this paper complements the mechanistic studies of lithium-ion batteries under different aging paths and is also useful for capacity estimation models and research on battery health.

1. Introduction

Due to the advantages of high energy density, low cost and low pollution, lithium-ion batteries are widely used in electric vehicles and energy storage systems [1,2]. However, under a harsh-use environment, such as high and low temperature, high-rate charging and discharging, among others, the service life of lithium-ion batteries will be greatly impacted [3]. In the cold northern winters, lithium-ion batteries are inevitably used at sub-zero temperatures, which challenges the life of lithium-ion batteries [4]. Therefore, it is important to study the aging of lithium-ion batteries in harsh environments.
At low temperature, the capacity of lithium-ion batteries decreases due to the impedance effect, and the maximum state of charge (SOC) of the battery will decrease by about 7% to 23%. The reason for this phenomenon is considered to be the slow chemical reaction, poor charge transfer dynamic characteristics, lower electrolyte conductivity and reduced lithium-ion diffusivity inside the anode [5]. Yan et al. [6] found that the most important factor determining the performance limitation of lithium-ion batteries at low temperature is the presence of lithium ions in the electrolyte of the diffusivity and the solid lithium in the anode carbon atom, rather than the charge transfer dynamic characteristics or ohmic impedance. In addition to the capacity and power characteristics, the lifetime of lithium-ion batteries at low temperature can be severely affected [7,8,9]. Jaguemont et al. [10] have shown that not only does the consumption of lithium ions increase dramatically at harsh low temperatures, the electrode deterioration is also exacerbated by the loss of active material and contact area. Li et al. [11] proved that when the cycle temperature of the NCM battery is set to −10 °C, the loss of active material will increase with the increase in the current rate. The main cause of aging of lithium-ion batteries at low temperature is due to the lithium plating generated during charging [12,13,14]. When the intercalation potential of the anode is below 100 mV during charging, inhomogeneous lithium plating occurs on the surface of the carbon anode [15,16,17]. These metal deposits interfere with the embedding of lithium ions from the electrolyte to the anode, increasing lithium loss and causing capacity loss. Burow et al. [18] found that at −15 °C, an 8 C high-rate pulse will cause an uneven distribution of temperature and lithium plating on the negative electrode of the ternary battery, while lithium plating recovery occurs when the SOC rises to 60%. Wu et al. [19] found that discharging at a low rate at −20 °C will partially restore the decayed capacity at low temperature. Petzl [20] showed that with an increase in the number of low-temperature cycles, the lithium plating would appear to be self-canceled. The capacity degradation caused by this portion of the lithium plating is also restored, but the unrestored lithium plating continues to be in the growth on the negative SEI film, and lithium dendrites on the plating will continue to grow and even puncture the separator under mechanical stress, causing short circuit and premature failure in the battery [21]. Nazari et al. [22] simulated the charging and discharging energy efficiency of LFP/graphite, LMO/graphite and LCO/graphite batteries with different capacities at −20 °C. The results show that at an extremely low temperature of −20 °C, the particle size in the cathode plays a crucial role in maintaining the charge and discharge efficiency of the lithium-ion battery at a high C-rate. Generally speaking, the smaller the particles, the higher the charging and discharging efficiency of the lithium-ion battery. In addition, the diffusion coefficient in the lithium-ion battery has a significant impact on the charging and discharging performance. Farhad et al. [23] established a lithium-ion battery energy efficiency map, using the efficiency map to study the effects of rapid charging, rated capacity and chemical composition of a typical lithium-ion battery on its energy efficiency, providing a reference for new energy designers to obtain accurate battery efficiency.
Lithium plating, which forms easily at subzero temperature, is the main cause of aging and safety problems in batteries, so many scholars have focused on the detection of lithium plating. Bitzer et al. [24] proposed a method to measure lithium plating using an experimental device with an accuracy of 1 μm to measure the thickness of a pouch cell, and the variation in thickness correlated well with the amount of visible lithium metal after battery disassembly. Uhlmann et al. [25] applied a high-rate 10 C pulse to a graphite half-cell for lithium plating and found that the kink of transient voltages during charging and the voltage platform during relaxation after charging can provide a basis for lithium plating detection. Scanning electron microscopy (SEM) observations showed that the lithium plating appeared immediately after a high-rate pulse; only a small amount of visible lithium plating remained after a relaxation time of more than one week. Schindler et al. [26] proposed a differential relaxation voltage method for lithium plating, which in combination with impedance spectroscopy can detect the consumption of the reversible fraction of lithium plating. The results show an average consumption rate of 1/86 Cnom (nominal capacity) of the lithium plating in the stripping reaction in the relaxation case, thus complete stripping requires a very long relaxation time. Zhang et al. [27] proposed the internal resistance-quantity (R-Q) trajectory method and the Arrhenius criterion method based on the cycle experiments of multi-stress batteries, which can determine the conditions that initiate lithium precipitation. Smart et al. [28], in investigating the effect of different component electrolytes on the lithium plating, found that the lithium plating formed during the charging phase produces a high-voltage platform on a low-rate discharge curve. This voltage platform corresponds to the oxidation reaction of the lithium plating. The oxidation of the lithium plating layer takes precedence over the release of lithium from the carbon anode during the rise of the anode potential during discharge, because the lithium plating layer has a lower intercalation equilibrium potential for lithium than the lithiated carbon anode [29]. Petzl et al. [30] performed a DV analysis of the voltage platform generated during the oxidation of lithium plating under different SOC values and concluded that the oxidized is the reversible part of the lithium plating, which corresponds to Qrev.plating, and the “dead lithium” of the irreversible part was the corresponding capacity Qirrev.plating, the difference between the charge and discharge capacity in one charge and discharge cycle. The results show that the amount of lithium plating has a linear relationship with SOC in the low-medium SOC range. This method quantifies the negative electrode lithium plating from two aspects: reversible partial oxidation peeling of the lithium plating layer and reduction in the Coulomb efficiency by the irreversible portion. However, when the Coulomb efficiency is greater than 1 during the battery cycle, the capacity of the irreversible portion of the lithium plating layer cannot be obtained.
In this paper, a cylindrical 32,650 LiFePO4 power battery is chosen as the object of study, set at a low-temperature environment of different charging current aging path cycle experiments and performance parameter testing experiments to explore its aging characteristics. The changes in the characteristics of each parameter of the power battery during aging are investigated by electrochemical impedance spectra (EIS), direct current internal resistance (DCIR) and probability density function (PDF) curves of the cycling process. In addition, the aging mechanism of the battery under different paths is analyzed through the energy variation involved in the irreversible part of the lithium plating. The work in this paper can provide a reference for the study of the mechanism of battery aging and the health status estimation of battery management.
The paper is organized as follows:
  • Lithium-ion battery aging experiments and experiment platform construction. Design of the aging paths and experimental plans of the lithium-ion battery, and explanation of the flow of the cycle experiment and parameter performance test experiment;
  • Analysis of the parameter characteristics of lithium-ion batteries under a low-temperature and low-rate cycling path. The aging of the battery is described in terms of each parameter such as capacity, direct current internal resistance (DCIR), electrochemical impedance and energy storage characteristics;
  • Analysis of aging characteristics of lithium-ion batteries under a low-temperature, low-rate cycling path. The aging process of lithium-ion batteries will be further analyzed in terms of lithium precipitation during the aging process, and the capacity fade mechanism of power batteries will be summarized.

2. Lithium-Ion Battery Experimental Platform Construction and Aging Path Design

2.1. Experimental Battery and Test Equipment

The battery used in this paper is a cylindrical 32,650 commercial LiFePO4 battery with a nominal capacity of 5 Ah. The basic parameters of the experimental battery are shown in Table 1. The experimental test platform for the battery is shown in Figure 1.
In Figure 1, the voltage measurement range of each channel of the battery test system is 25 mV~5 V, and the accuracy is 0.1% of full scale, which is 5 mV. The current output range is 0.15~30 A, and the accuracy can reach 0.03 A. The test system has the functions of charge and discharge, cycle and DCIR test. In this paper, the test system is used to control the cycle rate of the experimental battery and perform the performance test experiment between cycles.
The temperature adjustment range of the high- and low-temperature alternating heat and test chamber used in the experiment is −40~100 °C, the temperature fluctuation is within ±0.5 °C and the temperature uniformity is ≤2 °C under no load. The chamber can simulate natural high-temperature, low-temperature and humid environments. In this experiment, it is used to control the cycling temperature conditions of the lithium-ion battery in the electro-thermal coupling aging path.
The electrochemical workstation used in the experiments has a potential range of ±10 V, a current range of ±10 to ±10 A and a minimum current resolution of 15 pA. AC impedance frequency range is 10 μHz to 1 MHz. It is capable of performing many electrochemical tests such as AC impedance, chronoamperometric current, chronopotentiometry, cyclic voltammetry and linear sweep voltammetry, among others. It has many functions such as corrosion measurement and electrochemical noise measurement.

2.2. Design of Lithium-Ion Battery Aging Cycle Experimental Scheme

The low-temperature environment designed by the low-rate charge lithium-ion battery aging cycle experiments is shown in Table 2. The three selected LiFePO4 power batteries are the test objects, −10 °C and −20 °C are the temperature conditions and 0.3 C (1.5 A current) and 0.5 C (2.5 A current) are the charging rates.
The sub-zero temperature cycle experiment designed in this paper adopts the constant current and constant voltage charging method. In order to highlight the influence of the charging current rate, the discharge rate of 1/3 C is adopted at different temperatures. The cycle flow chart is shown in Figure 2. N represents the cycle period number, which is selected as 10, and the performance test is performed after every 10 cycles. Since the battery capacity fades too quickly at −20 °C, the number of cycles in one cycle is changed to 5 times.
Performance test experiments are conducted at room temperature, including capacity test, HPPC test and low-rate test, to evaluate the key performance of the battery. The actual capacity of the battery is determined by three 1/3 C discharge cycles, and the discharge capacity of the last cycle is used as the current capacity of the battery. After the capacity test is completed, perform a HPPC test on the fully charged battery to determine the battery impedance in the full SOC range (0% to 100% SOC). The low-rate test selects a 0.25 C charge rate to perform a constant current charge on the vented battery. Due to the small polarization in this process, it is possible to explore the subtle and gradually changing electrochemical characteristics of the battery.
The flowchart of the performance test is shown in Figure 3.
After the performance test is completed, the fully charged battery is placed at room temperature to perform the electrochemical AC impedance EIS test. The EIS test uses a constant current frequency scan, taking 22 points including the boundary in the range of 0.1~1.5 kHz, and applying an AC sinusoidal potential wave of corresponding frequency to the battery to obtain the ratio of AC potential to current at different frequencies, which is the battery system’s impedance response.
The EIS measurement process is shown in Figure 4, with the following basic steps:
  • Generate a small amplitude sinusoidal potential signal by a waveform generator;
  • The signal is applied to the experimental battery through the control and adjustment of the potentiostatic instrument;
  • Convert the output current/potential signal;
  • The converted signal outputs its impedance and its modulus or phase angle via a lock-in amplifier or spectrum analyzer.

3. Analysis of the Impact of Low-Temperature Low-Rate Charging on the Parameters of Lithium-Ion Batteries

3.1. Capacity Fading Analysis

Figure 5 shows the battery capacity fading of three cells under different charging rates in a low-temperature environment. It can be seen from Figure 5 that the Cell 1 and Cell 3 batteries with the fastest capacity fading reached the end of life (EOL) after only 40 cycles. The capacity of Cell 2, whose capacity fading is the slowest, also decayed to 83.9% after 100 cycles.

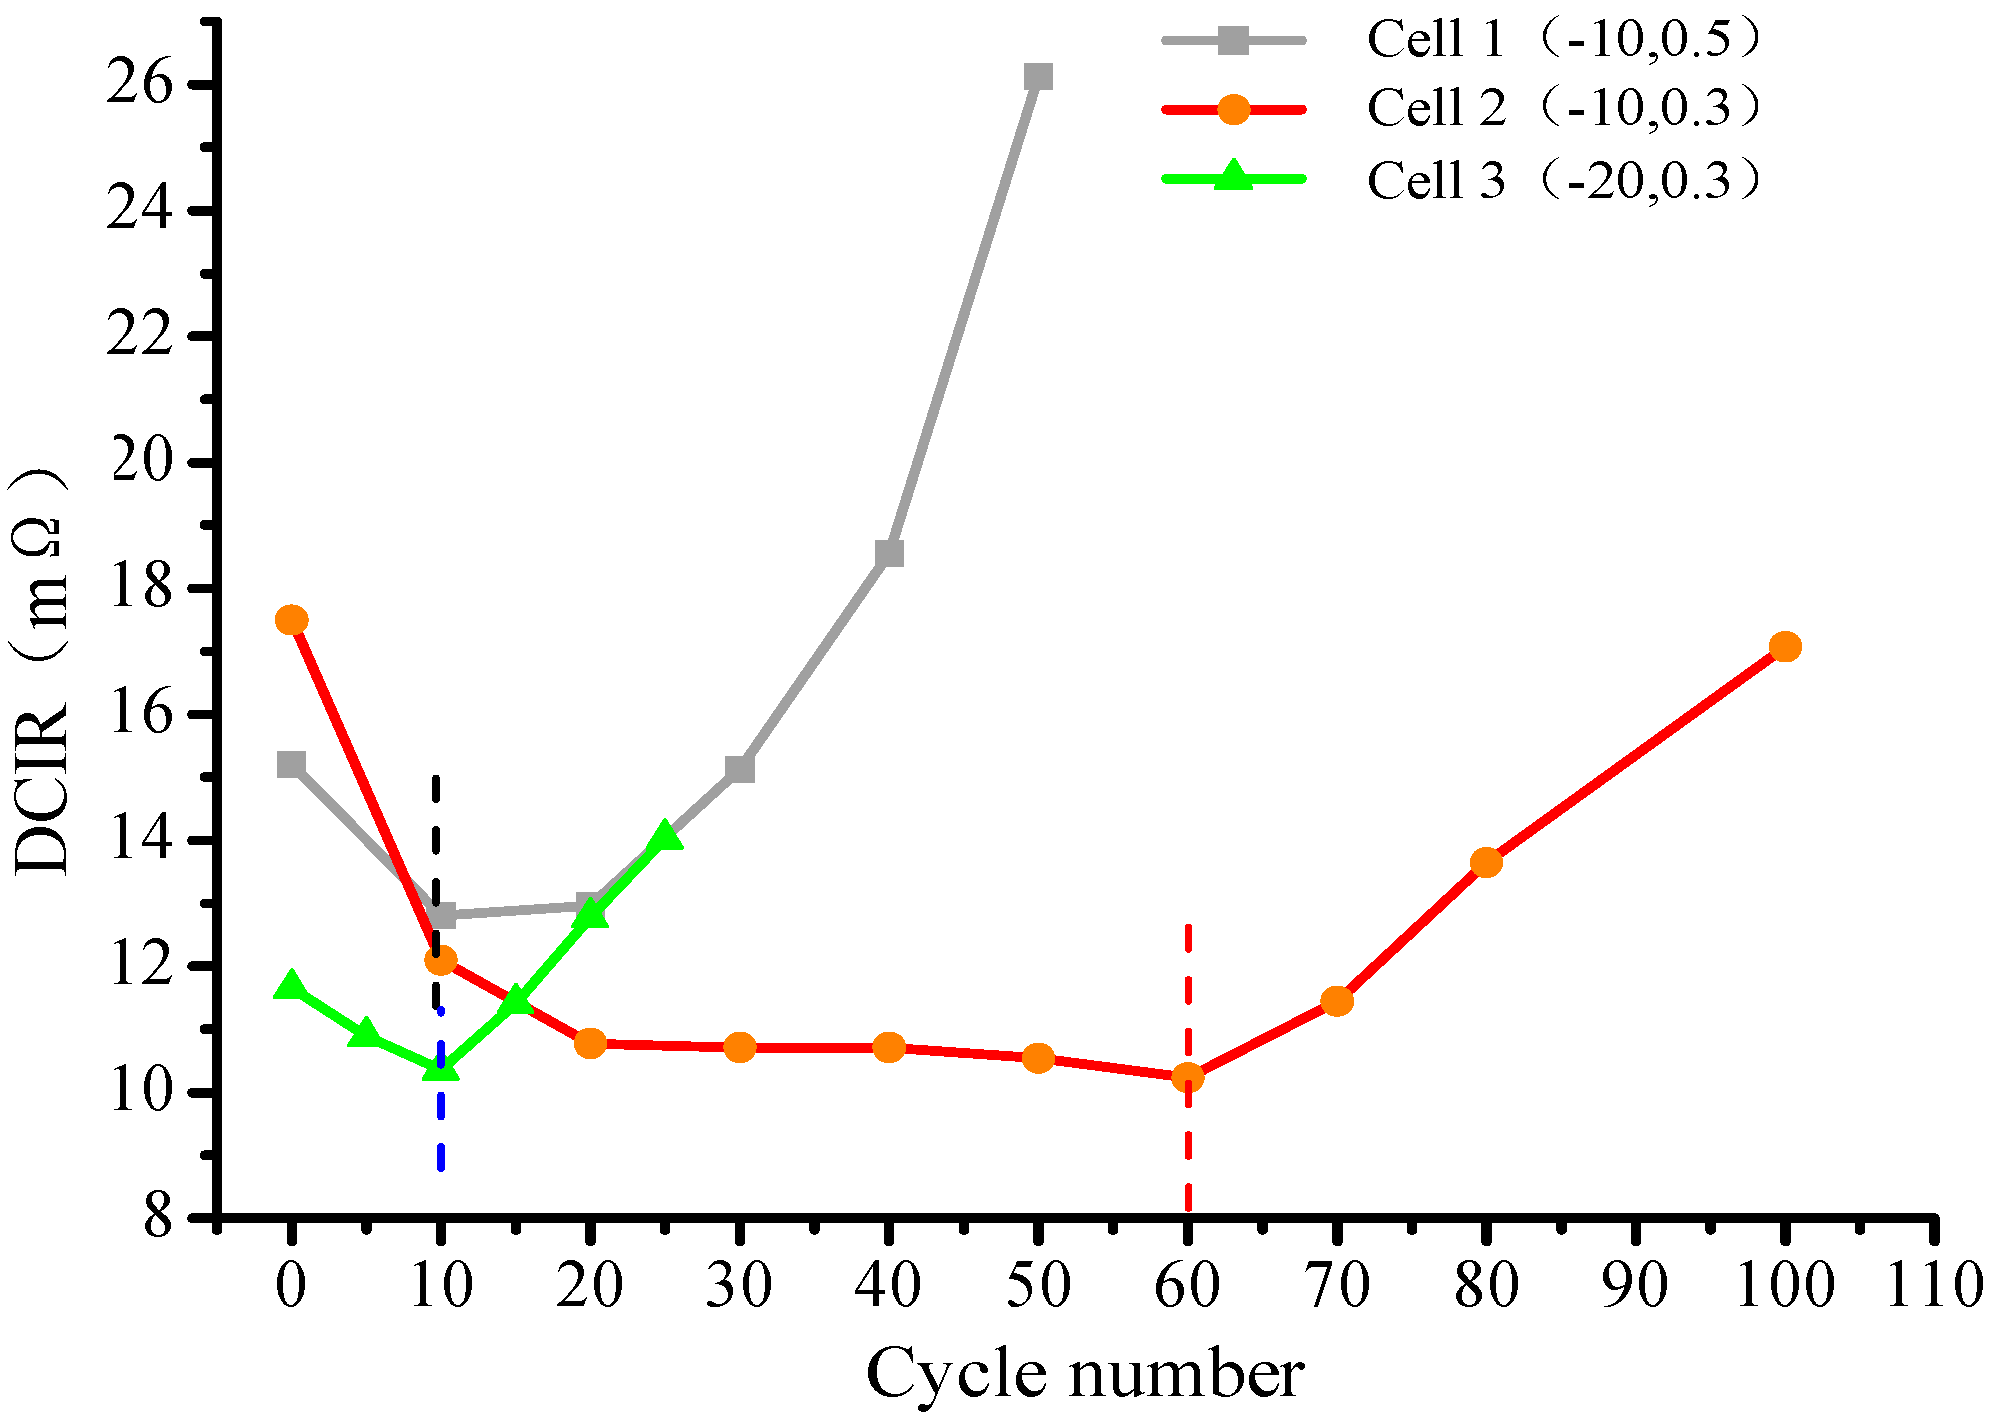
3.2. Impedance Analysis

In addition to the available capacity, battery impedance is another indicator to measure the health of the battery, and it is also an important parameter that reflects the difficulty of lithium ion transmission inside the battery. Full impedance includes ohmic internal resistance and polarization impedance. The response generated by current excitation on the ohmic internal resistance is immediate, and the response on the polarized internal resistance is delayed because the diffusion rate of lithium ions participating in the chemical reaction in the solid phase of the electrode active material is less than the chemical reaction rate. Ohmic internal resistance or DCIR is related to temperature, current rate, SOC and SOH. For convenience of comparison, the DCIR value of each battery at 50% SOC under different cycle times is taken to represent the change in DCIR with the cycle number, as shown in Figure 6.
As can be seen from Figure 6, the DCIR of all experimental batteries can be divided into descending stage and ascending stage with the increase in cycle number. For Cell 1 and Cell 3 at sub-zero temperatures, the turning point occurred around 10 cycles, while for Cell 2, it occurred around 60 cycles. The reason for the turning point may be that at absolute temperature, due to special reasons such as a low-temperature environment, the performance of the lithium battery may change, or the performance of the battery itself may cause this difference. Compared with DCIR, electrochemical impedance spectroscopy can reflect more detailed changes in battery dynamics characteristics. The electrochemical impedance spectra of Cell 2 and Cell 3 change with the increase in cycle times as shown in Figure 7.
Early in the cycle, the reduction in internal resistance indicates the destruction and reconstruction of SEI. As the number of cycles increases, the increase in DC internal resistance indicates that under low-temperature environments, the deposited lithium causes the thickening of the SEI film during battery cycling, and some lithium deposits are lost in a “dead lithium” manner, resulting in battery capacity fade.
Understanding the kinetic properties of lithium migration in the oxide matrix of lithium-ion batteries is an important factor in determining its cycle performance. Therefore, it is necessary to study the stability of oxides during charge and discharge to improve the performance of lithium-ion batteries [31]. The typical Nyquist diagram of the electrochemical impedance spectrum of a lithium-ion battery is composed of two semicircles and a diagonal line, where the effect of the SEI film on the electrode reaction is shown in the high-frequency stage of the impedance spectrum, which is represented by the first semicircle, and the arc and the real intersection of the axes are the ohmic internal resistance of the battery. The second semicircle represents the material transfer impedance at the battery electrode, and the diagonal line represents the diffusion process of the active material inside the battery. As can be seen from Figure 7, after 80 cycles to 100 cycles of Cell 2, the charge transfer resistance Rct increases by about 1.1 mΩ. Cell 3 has no significant change in charge transfer impedance after 20 cycles compared to 10 cycles, but the real component impedance Re (z) increases. Rct did not increase again after 25 cycles, and Rct increased by 0.6 mΩ compared to 20 cycles.
With the progress of the battery, the side reaction of the electrolyte on the SEI film causes the SEI film to thicken, which gradually increases the impedance. With the increase in the number of charge and discharge, the influence of a low-temperature environment, the SEI film will be destroyed and then regenerated, and due to the oxide deposition will gradually thicken, thus the resistance increases, which makes the diffusion and migration of lithium ions in the SEI film more difficult and causes the capacity of the lithium-ion battery to decay. The lithium ion insertion process includes three steps: the diffusion of solvated lithium ions in the electrolyte, the interfacial charge-transfer process and the diffusion of Li in the solid electrode material. Under low-temperature conditions, the conductivity of the battery electrolyte is reduced, the diffusion process of lithium ions is hindered and the charge transfer process is slow. This will cause the lithium ion to insert into the graphite at a slower rate, resulting in anode lithium plating.

3.3. Cyclic Process PDF Analysis

According to the introduction of the PDF method in the literature [32], probability density Pk can reflect the change in a capacity increment curve. Therefore, this paper adopts the PDF analysis method to carry out the analysis of battery aging. Figure 8 shows PDF peaks during the cycle at different temperatures and rates.
As can be seen from Figure 8, both experiment temperature and cycle rate have great influence on the PDF peak of the battery. In the case of sub-zero temperature, the conductivity of the electrolyte decreases, the movement of lithium ions is hindered and the chemical reaction rate between the components decreases, leading to a higher degree of coincidence between the reactions, so only the ②*II peak can be observed. At −10 °C, only 0.2 C of rate increment causes the position of the ②*II peak to move back about 0.05 V, and the polarization effect of the rate is amplified by low temperature. The peak position of ②*II moved closer to the charging cutoff voltage under the condition of −20 °C and the condition of −10 °C with the cycle rate of 0.3 C.
Figure 9 shows the variation in voltage offset and peak value at the peak position of the PDF curve ②*II during each battery cycle. The peak position voltage offset refers to the percentage of the difference between the peak position voltage and the peak position voltage trendline intercept in a certain time.
As can be seen from Figure 9, the voltage offset and peak values of the peak position both change linearly. Within a certain range of peaks, the peak of the PDF peak corresponds to the phase equilibrium state of two-phase coexistence in a certain phase transition phase, and the peak represents the proportion of the capacity change involved in reaching the phase equilibrium in the total charging capacity. The peak voltage reflects the response delay degree to the voltage during the phase transition. The lower the peak voltage in the charging process, the smaller the response delay of the phase transition reaction to the voltage, and the faster it reaches the phase equilibrium state. If the total charge capacity is very small, the peak may be distorted and cannot reflect the actual phase transition correctly.
For the cycling condition of sub-zero temperature, extremely low temperature will make it difficult for lithium ion to move inside the battery, and the transmission between the electrolyte and interface will be blocked, and the resistance of the chemical reaction will increase greatly, leading to the constant current charging capacity at a relatively low level. In addition, the aggregation and deposition of lithium ions on the surface of the carbon negative electrode will directly affect the lithium intercalation process of the carbon negative electrode and the number of embeddable lithium ions, so as to reduce the capacity proportion in the phase equilibrium phase of lithium intercalation. With the increase in the rate, the voltage deviation degree of the sub-zero temperature increases significantly. It is noted that the charging capacity of Cell 3 at −20 °C is at a very low level compared with that at −10 °C (as shown in Figure 10). Therefore, the PDF peak has been distorted with no significant change in peak position and the peak is falsely high, as shown in Figure 9. However, considering that the rechargeable capacity level of Cell 3 has not decreased, the trend of the peak is still credible. At −20 °C, the main phase transition reaction of the battery involves capacity reduction faster than −10 °C.
From the situation of Cell 1 with 0.5 C, before reaching EOL, although the voltage deviation degree is larger than that of Cell 2 with 0.3 C, the constant current charging capacity does not decrease significantly in the later stage of aging, as shown in Figure 10, and the PDF peak shows no sign of decline. That indicates that the 0.5 C charging cycle rate causes a significant delay in the phase transition response but has little impact on the capacity proportion of the reaction. At very low temperature, the effect of increasing the current rate is mainly reflected in slowing the phase transition reaction.

4. Lithium Precipitation Analysis of Low-Temperature Low-Rate Charge-State Lithium-Ion Batteries

At sub-zero low temperature, lithium ions tend to accumulate on the negative surface SEI film during charging due to the poor ion transmission performance inside the battery and blocked movement at the electrolyte/electrode interface. When the charge rate is high, a large number of lithium ions move to the negative surface under the action of the electric field. When the concentration of lithium ions reaches saturation at the solid–liquid interface, lithium ions will also accumulate on the surface of the SEI membrane. Both of the above conditions will form a lithium plating on the surface of SEI films.
A part of the lithium plating with discharge or static will become active lithium ions again and participate in the positive and negative delay motion; the other part reacts with the electrolyte to produce by-products, or loses electrical connection with the negative pole, and becomes floating debris lithium in the electrolyte, namely “dead lithium”. This part of the lithium plating caused irreversible loss of the battery capacity. The authors of [28] put the difference between the charging capacity Qch and the releasing capacity Qdc in a discharging cycle, that is, Qch − Qdc is the capacity loss caused by the irreversible lithium plating on it. However, irreversible lithium plating cannot be described if the difference between Qch and Qdc is negative.
The difference between charging energy Wch and discharging energy Wdc in a cycle is taken as the energy loss caused by the irreversible part, Wirrev.plating = Wch − Wdc, and Figure 11 shows the change of irreversible energy Wirrev.plating and its energy proportion Wirrev.plating/Wch of each battery with the number of cycles.
Under sub-zero temperature, the internal reaction rate of the battery decreases, and the irreversible part of the lithium plating mostly keeps accumulating on the surface of the SEI film, forming lithium dendrites. The dendrites of lithium will fall off and form “dead lithium”, causing greater loss of active lithium. According to the impedance analysis of the battery, the reaction by-products of the lithium plating and electrolyte mostly accumulated on the SEI film, resulting in the rapid thickening of the SEI film and the serious decrease in ion transmittance, and the impedance of the aging stage increased significantly. After a small amount of cycles, the thickened SEI membrane further prevents lithium ions from embedding in the negative electrode, increasing the formation of lithium dendrites. When the temperature decreased, at the same rate, the lithium dendrite formed at the initial stage was less, but the SEI membrane thickened more quickly, thus causing the increase in lithium dendrite and “dead lithium” at a faster rate. When Cell 3 reached EOL, Wirrev.plating increased about 1.25 times. As the rate increases, the ion accumulation at low temperature is intensified, so more lithium dendrites are formed.
The energy efficiency of the battery is Wdc/Wch, which can also be expressed as 1-Wirrev.plating/Wch. The higher the energy efficiency is, the stronger the lithium intercalation/deferral is. Therefore, as the number of cycles increases, the energy proportion Wirrev.plating/Wch is negatively correlated with the lithium intercalation/deactivation properties. At sub-zero low temperature, as the battery reaches EOL, the Wirrev.plating/Wch of each battery segment increases significantly, which indicates that the performance of embedded/delithium decreases significantly. Based on the analysis of Wirrev.plating, it can be seen that the decrease in the lithium intercalation performance of the negative electrode is caused by the thickening of the SEI film at the temperature below zero.

5. Conclusions

In this paper, the attenuation mechanism of a commercial 32,650 LiFePO4 power battery was studied under different charging rate aging paths in a low-temperature environment. The aging process of the battery was analyzed from the parameters and aging characteristics of the battery, and the aging mechanism of the power battery under the charging cycle path of low temperature and low current rate was revealed. The main conclusions of this paper are as follows:
  • According to the analysis of impedance parameters, the influence of the contact between the SEI membrane of the electrode or the particles of the active material on the impedance of the commercial battery is weakened at the beginning of the cycle. As the cycle progresses, the SEI film thickens and the impedance gradually increases. The change in the real-part impedance and charge transfer impedance Rct at sub-zero temperature indicates that the thickening of the negative SEI film occurs earlier than the aging of the positive electrode material;
  • The PDF peak characteristics of the cycling process indicate that the sub-zero temperature has a serious polarization effect on the battery cycle, and the effect of increasing the rate at the sub-zero temperature is mainly reflected in slowing down the phase transition reaction;
  • The change in irreversible energy Wirrev.plating indicates that the irreversible part of the lithium plating consumes the dendrite growth on the surface of the SEI membrane at the sub-zero temperature. Increasing the rate will aggravate the formation of lithium dendrites, while decreasing the temperature will accelerate the thickening speed of SEI films. The change in the ratio of binding energy Wirrev.plating/Wch further indicates that the degradation of the cathode embedded/delithium is caused by the thickening of SEI films.

Author Contributions

Project administration, X.W., writing—original draft preparation, W.W.; writing—review and editing, Y.S.; data analysis and processing, T.W.; experiment and verification, J.C.; supervision and modification, J.D. All authors have read and agreed to the published version of the manuscript.

Funding

This work was supported by Open Fund of Operation and Control of Renewable Energy & Storage Systems (China Electric Power Research Institute) (No.EPRI 4124-190889).

Conflicts of Interest

The authors declare no conflict of interest.

Nomenclatures

SEIsolid electrolyte interphase
SOCstate of charge
SOHstate of health
C-rate/Cthe measurement of the charge or discharge current with respect to its nominal capacity. e.g., 2 C = 2 × Cn(A)
RPTreference performance test
HPPChybrid pulse power characterization
Cnnominal capacity of battery
CC-CVconstant-current and constant-voltage
DCIRDirect Current Internal Resistance
PDFProbability Density Function
EISElectrochemical Impedance Spectra

References

  1. Shang, Y.L.; Cui, N.X.; Duan, B.; Zhang, C. Analysis and optimization of star-structured switched-capacitor equalizers for series-connected battery strings. IEEE Trans. Power Electron. 2018, 33, 9631–9646. [Google Scholar] [CrossRef]
  2. Liu, K.L.; Li, Y.; Hu, X.S.; Lucu, M.; Widanage, W.D. Gaussian process regression with automatic relevance determination kernel for calendar aging prediction of lithium-ion batteries. IEEE Trans. Ind. Inf. 2020, 16, 3767–3777. [Google Scholar] [CrossRef] [Green Version]
  3. Xiong, R.; Li, L.L.; Yu, Q.Q.; Jin, Q.; Yang, R. A set membership theory based parameter and state of charge co-estimation method for all-climate batteries. J. Clean. Prod. 2020, 249, 119380. [Google Scholar] [CrossRef]
  4. Wu, S.J.; Xiong, R.; Li, H.L.; Nian, V.; Ma, S. The state of the art on preheating lithium-ion batteries in cold weather. J. Energy Storage 2020, 27, 101059. [Google Scholar] [CrossRef]
  5. Zhang, S.S.; Xu, K.; Jow, T.R. The low temperature performance of Li-ion batteries. J. Power Sources 2003, 115, 137–140. [Google Scholar] [CrossRef]
  6. Ji, Y.; Zhang, Y.; Wang, C.Y. Li-Ion Cell Operation at Low Temperatures. J. Electrochem. Soc. 2013, 160, A636–A649. [Google Scholar] [CrossRef]
  7. Ma, S.; Jiang, M.; Tao, P.; Song, C.; Wu, J.; Wang, J.; Deng, T.; Shang, W. Temperature effect and thermal impact in lithium-ion batteries: A review. Prog. Nat. Sci. Mater. Int. 2018, 28, 653–666. [Google Scholar] [CrossRef]
  8. Liu, D.; Zhu, W.; Kim, C.; Cho, M.; Guerfi, A.; Delp, S.A.; Allen, J.L.; Jow, T.R.; Zaghib, K. High-energy lithium-ion battery using substituted LiCoPO4: From coin type to 1Ah cell. J. Power Sources 2018, 388, 52–56. [Google Scholar] [CrossRef]
  9. Xiong, R.; Li, L.; Tian, J. Towards a smarter battery management system: A critical review on battery state of health monitoring methods. J. Power Sources 2018, 405, 18–29. [Google Scholar] [CrossRef]
  10. Jaguemont, J.; Boulon, L.; Venet, P.; Dubé, Y.; Sari, A. Lithium-Ion Battery Aging Experiments at Subzero Temperatures and Model Development for Capacity Fade Estimation. IEEE Trans. Veh. Technol. 2016, 65, 4328–4343. [Google Scholar] [CrossRef] [Green Version]
  11. Li, Y.; Qian, K.; He, Y.B.; Kaneti, Y.V.; Liu, D.; Luo, D.; Li, H.; Li, B.; Kang, F. Study on the reversible capacity loss of layered oxide cathode during low-temperature operation. J. Power Sources 2017, 342, 24–30. [Google Scholar] [CrossRef]
  12. Gao, F.; Tang, Z. Kinetic behavior of LiFePO4/C cathode material for lithium-ion batteries. Electrochim. Acta 2008, 53, 5071–5075. [Google Scholar] [CrossRef]
  13. Maruyama, J.; Maruyama, S.; Fukuhara, T.; Chashiro, K.; Uyama, H. Ordered mesoporous structure by graphitized carbon nanowall assembly. Carbon 2017, 126, 452–455. [Google Scholar] [CrossRef]
  14. Maruyama, S.; Fukutsuka, T.; Miyazaki, K.; Abe, Y.; Yoshizawa, N.; Abe, T. Lithium-ion intercalation and deintercalation behaviors of graphitized carbon nanospheres. J. Mater. Chem. A 2018, 6, 1128–1137. [Google Scholar] [CrossRef]
  15. Kabir, M.M.; Demirocak, D.E. Degradation mechanisms in Li-ion batteries: A state-of-the-art review. Int. J. Energy Res. 2017, 41, 1963–1986. [Google Scholar] [CrossRef]
  16. Li, X.; Meng, X.; Choe, S.Y.; Joe, W.T. Modeling and analysis of LiFePO4/Carbon battery considering two-phase transition during galvanostatic charging/discharging. Electrochim. Acta 2015, 155, 447–457. [Google Scholar] [CrossRef]
  17. Li, Z.; Huang, J.; Liaw, B.Y.; Metzler, V.; Zhang, J. A review of lithium deposition in lithium-ion and lithium metal secondary batteries. J. Power Sources 2014, 254, 168–182. [Google Scholar] [CrossRef]
  18. Burow, D.; Sergeeva, K.; Calles, S.; Schorb, K.; Boerger, A.; Roth, C.; Heitjans, P. Inhomogeneous degradation of graphite anodes in automotive lithium ion batteries under low-temperature pulse cycling conditions. J. Power Sources 2016, 307, 806–814. [Google Scholar] [CrossRef]
  19. Wu, C.M.; Chang, C.C.; Avdeev, M.; Pan, P.I.; Li, W.H. In operando detection of lithium diffusion behaviors at low temperature in 18650 Li-ion battery anode. Phys. B Condens. Matter 2018, 551, 305–308. [Google Scholar] [CrossRef]
  20. Petzl, M.; Kasper, M.; Danzer, M.A. Lithium plating in a commercial lithium-ion battery–A low-temperature aging study. J. Power Sources 2015, 275, 799–807. [Google Scholar] [CrossRef]
  21. Lu, L.; Han, X.; Li, J.; Hua, J.; Ouyang, M. A review on the key issues for lithium-ion battery management in electric vehicles. J. Power Sources 2013, 226, 272–288. [Google Scholar] [CrossRef]
  22. Nazari, A.; Kavian, S.; Nazari, A. Lithium-Ion Batteries’ Energy Efficiency Prediction Using Physics-Based and State-of-the-Art Artificial Neural Network-Based Models. J. Energy Resour. Technol. 2020, 142, 10. [Google Scholar] [CrossRef]
  23. Farhad, S.; Nazari, A. Introducing the energy efficiency map of lithium-ion batteries. Int. J. Energy Res. 2019, 43, 931–944. [Google Scholar] [CrossRef]
  24. Bitzer, B.; Gruhle, A. A new method for detecting lithium plating by measuring the cell thickness. J. Power Sources 2014, 262, 297–302. [Google Scholar] [CrossRef]
  25. Uhlmann, C.; Illig, J.; Ender, M.; Schuster, R.; Ivers-Tiffée, E. In situ detection of lithium metal plating on graphite in experimental cells. J. Power Sources 2015, 279, 428–438. [Google Scholar] [CrossRef]
  26. Schindler, S.; Bauer, M.; Petzl, M.; Danzer, M.A. Voltage relaxation and impedance spectroscopy as in-operando methods for the detection of lithium plating on graphitic anodes in commercial lithium-ion cells. J. Power Sources 2016, 304, 170–180. [Google Scholar] [CrossRef]
  27. Jian-bo, Z.H.; Lai-suo, S.U.; Xin-yu, L.I.; Hao, G.E.; Ya-kun, Z.H.; Zhe, L.I. Lithium plating identification from degradation behaviors of lithium-ion cells. J. Electrochem. 2016, 22, 607–616. [Google Scholar]
  28. Smart, M.C.; Ratnakumar, B.V. Effects of Electrolyte Composition on Lithium Plating in Lithium-Ion Cells. J. Electrochem. Soc. 2011, 158, A379. [Google Scholar] [CrossRef]
  29. Liu, Q.; Du, C.; Shen, B.; Zuo, P.; Cheng, X.; Ma, Y.; Yin, G.; Gao, Y. Understanding undesirable anode lithium plating issues in lithium-ion batteries. RSC Adv. 2016, 6, 88683–88700. [Google Scholar] [CrossRef]
  30. Petzl, M.; Danzer, M.A. Nondestructive detection, characterization, and quantification of lithium plating in commercial lithium-ion batteries. J. Power Sources 2014, 254, 80–87. [Google Scholar] [CrossRef]
  31. Wang, L.; Zhao, J.; He, X.; Gao, J.; Li, J.; Wan, C.; Jiang, C. Electrochemical impedance spectroscopy (EIS) study of LiNi1/3Co1/3Mn1/3O2 for Li-ion batteries. Int. J. Electrochem. Sci. 2012, 7, 345–353. [Google Scholar]
  32. Feng, X.; Li, J.; Ouyang, M.; Lu, L.; Li, J.; He, X. Using probability density function to evaluate the state of health of lithium-ion batteries. J. Power Sources 2013, 232, 209–218. [Google Scholar] [CrossRef]
Figure 1. Battery test platform.
Wevj 11 00055 g001
Figure 2. Flow diagram of sub-zero temperature cycle.
Wevj 11 00055 g002
Figure 3. Flow diagram of reference performance test (Cn means nominal capacity).
Wevj 11 00055 g003
Figure 4. The EIS measurement process.
Wevj 11 00055 g004
Figure 5. Capacity fading of the experimental batteries.
Wevj 11 00055 g005
Figure 6. Variation trend of DC impedance with the number of cycles.
Wevj 11 00055 g006
Figure 7. EIS changes of Cell 2 and Cell 3. (a) Cell 2(−10 °C, 0.3 C); (b) Cell 3(−20 °C, 0.3 C).
Wevj 11 00055 g007
Figure 8. PDF (Probability Density Function) curves at different temperatures and rates.
Wevj 11 00055 g008
Figure 9. Changes in PDF peak characteristics during the cycle at different temperatures and rates.
Wevj 11 00055 g009
Figure 10. Variation in the rechargeable capacity of Cell 1, Cell 2 and Cell 3.
Wevj 11 00055 g010
Figure 11. Changes in Wirrev.plating and Wirrev.plating/Wch values under different experimental conditions.
Wevj 11 00055 g011
Table 1. Basic parameters of commercial 32,650 LiFePO4 battery.
Parameter/UnitValue
Operating voltage/V3.2
Nominal capacity/A•h5.0
Charge cut-off voltage/V3.65
Discharge cut-off voltage/V2.5
Max. continuous charge current/A5
Max. continuous discharge current/A12.5
Table 2. Aging cycle experiment of lithium-ion battery with low-rate charge in a low-temperature environment.
Battery NumberTest Conditions
1−10 °C, 0.5 C
2−10 °C, 0.3 C
3−20 °C, 0.3 C

