
Modelling of Humidity Dynamics for Open-Cathode Proton Exchange Membrane Fuel Cell

School of Automotive Studies, Tongji University, Shanghai 201804, China
*
Author to whom correspondence should be addressed.
World Electr. Veh. J. 2021, 12(3), 106; https://0-doi-org.brum.beds.ac.uk/10.3390/wevj12030106
Submission received: 13 July 2021
/
Revised: 30 July 2021
/
Accepted: 2 August 2021
/
Published: 4 August 2021
(This article belongs to the Special Issue Towards Intelligent E-Mobility—Selected Papers from The 34th International Electric Vehicles Symposium and Exhibition (Nanjing, China))
Abstract
:The durability and output performance of a fuel cell is highly influenced by the internal humidity, while in most developed models of open-cathode proton exchange membrane fuel cells (OC-PEMFC) the internal water content is viewed as a fixed value. Based on mass and energy conservation law, mass transport theory and electrochemistry principles, the model of humidity dynamics for OC-PEMFC is established in Simulink® environment, including the electrochemical model, mass flow model and thermal model. In the mass flow model, the water retention property and oxygen transfer characteristics of the gas diffusion layer is modelled. The simulation indicates that the internal humidity of OC-PEMFC varies with stack temperature and operating conditions, which has a significant influence on stack efficiency and output performance. In order to maintain a good internal humidity state during operation, this model can be used to determine the optimal stack temperature and for the design of a proper control strategy.
1. Introduction
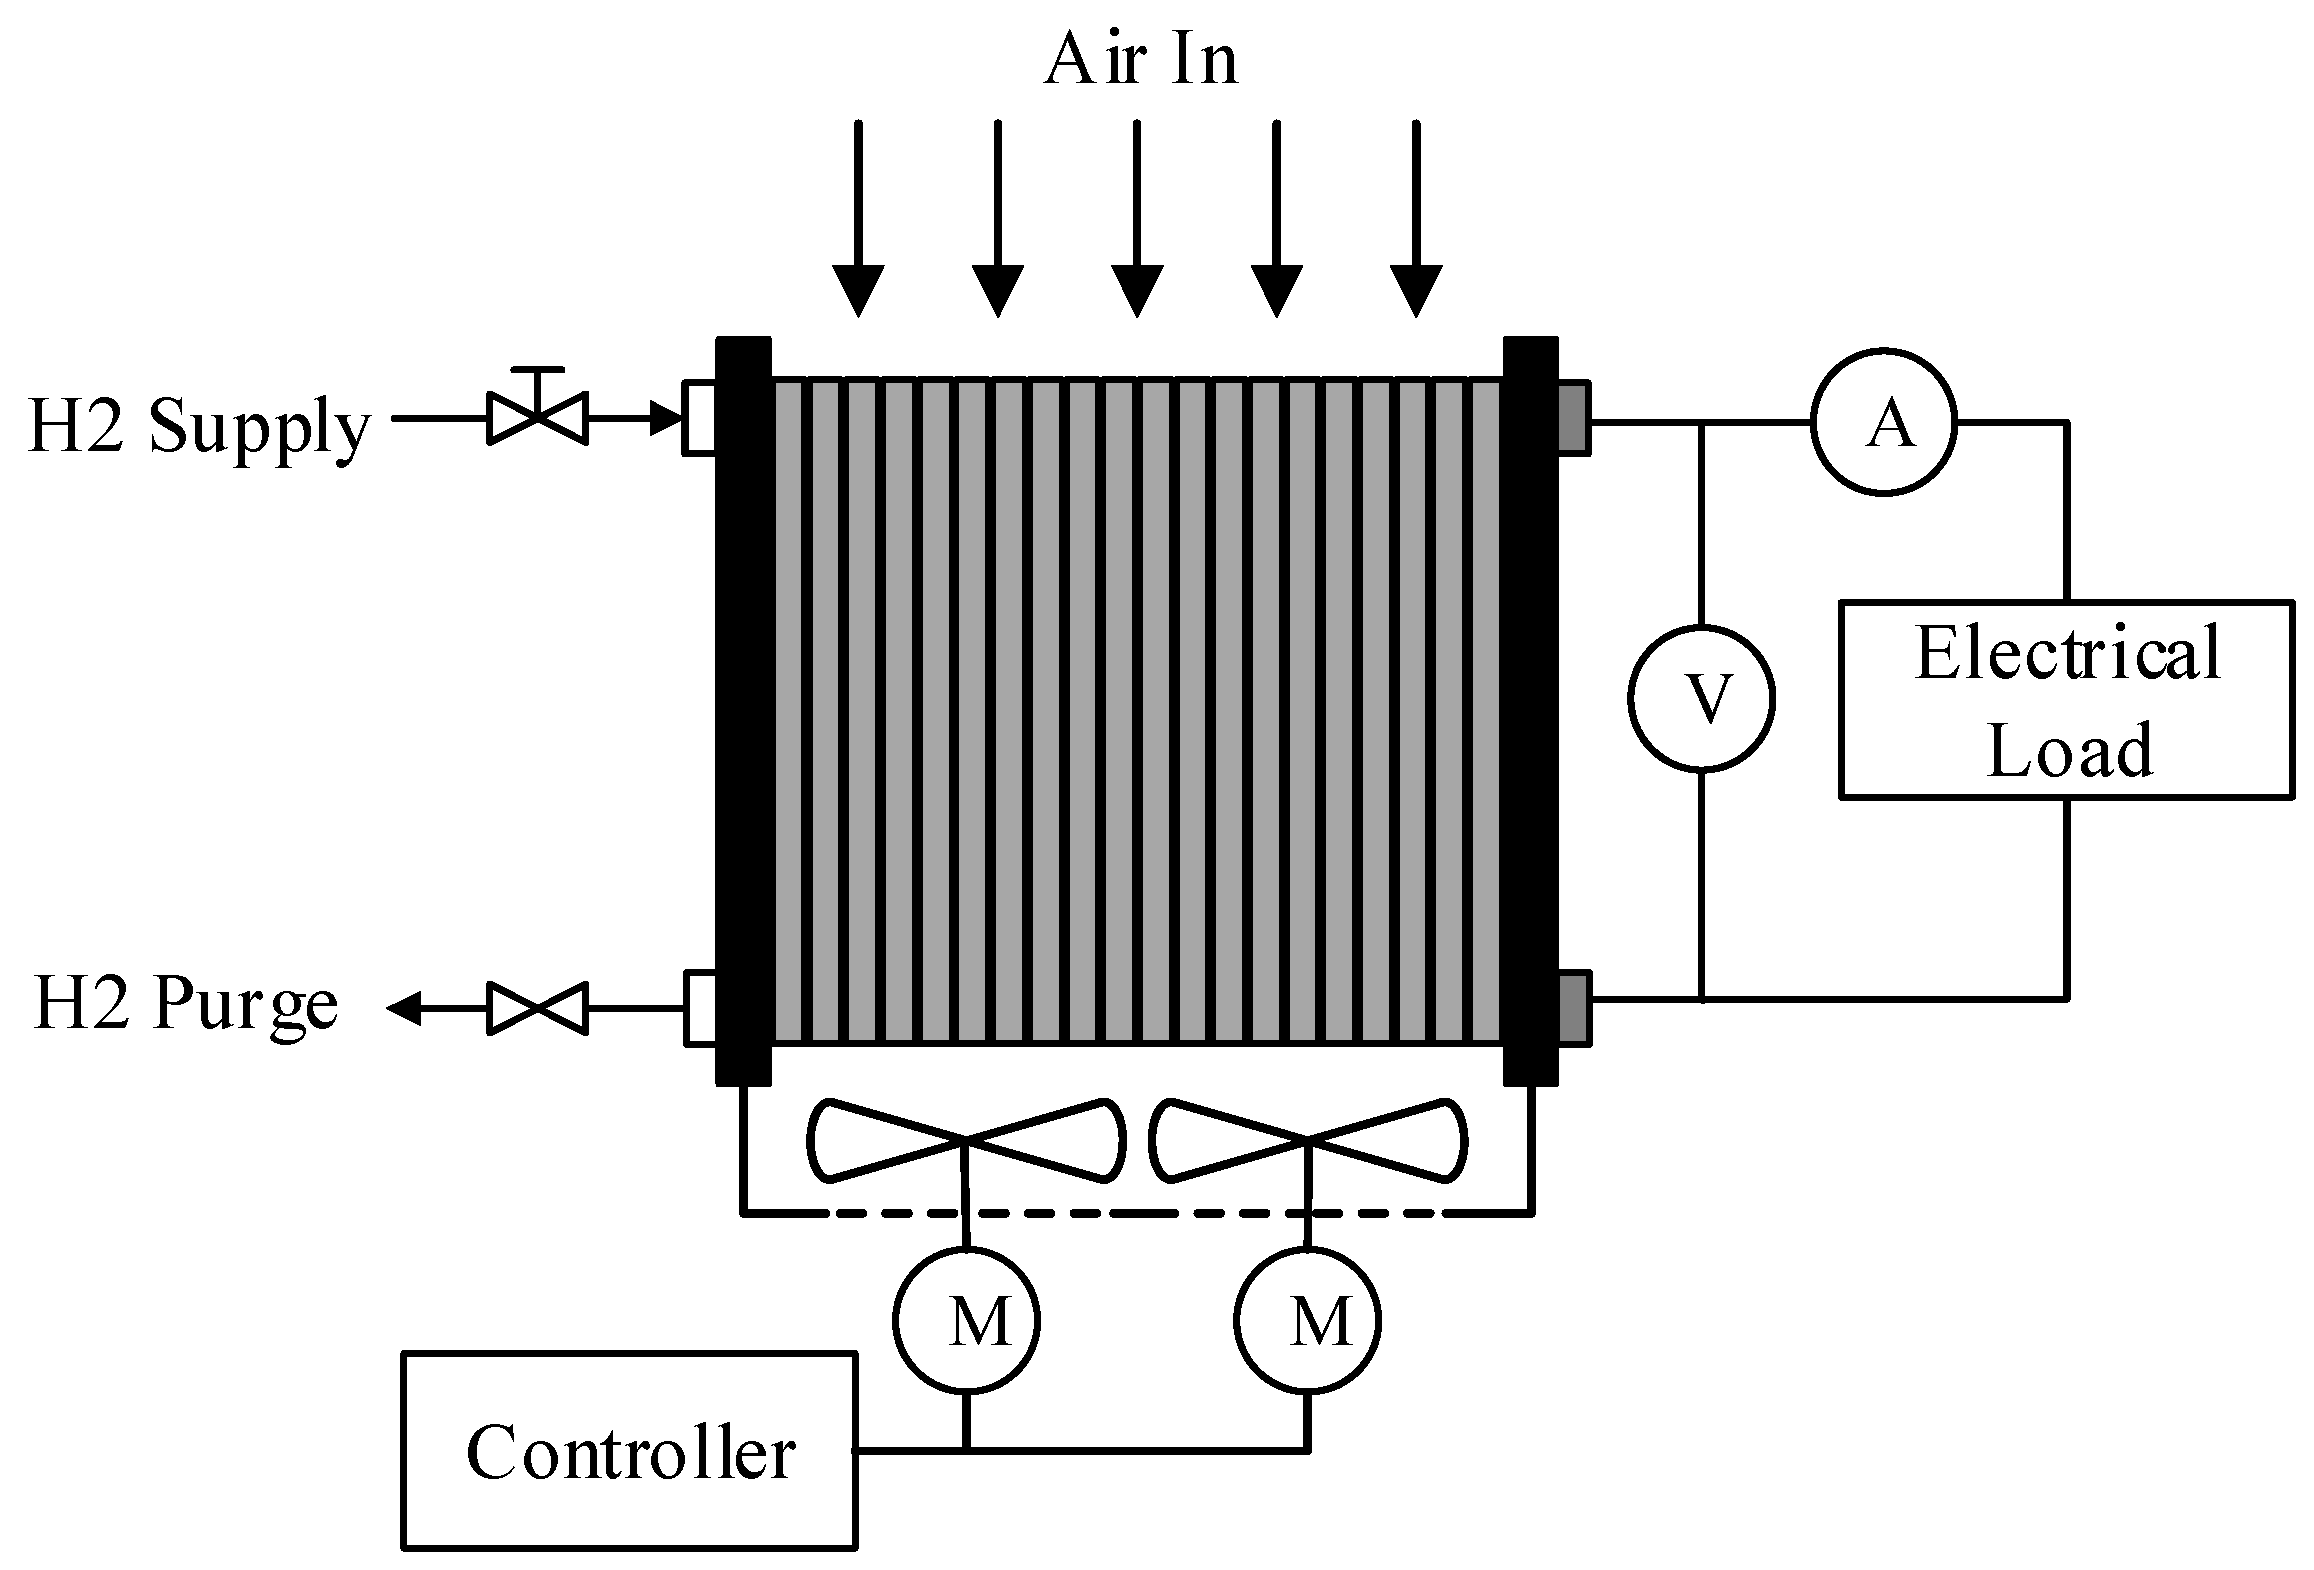
Due to the advantages of zero emission, low operating temperature, high efficiency and high energy density, the proton exchange membrane fuel cell (PEMFC) has been recognized as a promising clean power source [1,2,3]. The open-cathode PEM fuel cell (OC-PEMFC) is a type of PEMFC which is characterized by an open cathode flow channel and air fans at the cathode [4]. The schematic diagram of OC-PEMFC is shown in Figure 1. Without auxiliary parts such as an air compressor, humidifier, radiator and water pump, OC-PEMFC consumes less accessory power, which leads to higher operation efficiency [5]. With a simple auxiliary system and low cost, OC-PEMFC is suitable for applications with lower power demand, such as unmanned aerial vehicles, small portable devices and back-up power sources [6,7,8].
The durability and output performance of the fuel cell is highly influenced by the internal humidity [9,10]. With lower operation temperature and higher relative humidity, channel flooding happens in high current conditions, causing the drop of stack voltage and efficiency [11]. On the other hand, low membrane water content increases the internal resistance of the membrane, which leads to higher ohmic loss and also reduces efficiency [12]. In addition, membrane dehydration can possibly cause severe damage to the membrane itself, which reduces significantly the operation lifetime of a fuel cell [13]. Furthermore, at the cathode of OC-PEMFCs, the air fan is the only actuator which regulates stack cooling, reactant feeding and water management simultaneously. Under a large range of operation conditions, the humidity dynamics inside the fuel cell is not negligible, which significantly affects the operation lifetime, output performance and efficiency of the OC-PEMFC [14,15].
However, the humidity state inside OC-PEMFC is assumed to be static in several recent studies on control-oriented modelling of OC-PEMFC. Strahl, S. [16] studied thermal management and the improvement of stability and efficiency of open-cathode PEMFC based on a dynamic control-oriented model. However, the internal ohmic resistance of the model is assumed to be a fixed value. Mahjoubi C. [17] developed a multi-physic model of OC-PEMFC and proposed a control strategy which combined the stack temperature regulation and the reactant feeding adjustment. However, in this model, the internal humidity dynamics is also ignored. Zhang B. [18] proposed a thermal system model of OC-PEMFC and studied the implementation of model predictive control on OC-PEMFC. However, a good internal humidity state is assumed in the model and the membrane water content is set to a fixed value. Yan Z. [19] developed a portable PEMFC model based on the PEM fuel cell thermodynamics and the electrochemical reaction principles. However, this model ignores the water retention property of the cathode gas diffusion layer, which is important for describing the internal humidity state of OC-PEMFC. Lu L. [20] and Sun L. [21] used a data-driven method to obtain the thermal model of OC-PEMFC. However, these identification models are not proper to study the internal humidity dynamics of OC-PEMFC.
In this study, in order to analyze the dynamic behavior of the internal humidity in OC-PEMFC, a lumped parameter control-oriented model is developed. Firstly, based on mass and energy conservation law, mass transport theory and electrochemistry principles, the model is established, including the electrochemical model, mass flow model and thermal model. Secondly, simulation is carried out in Simulink® environment and simulation results of output voltage follows the experimental data with acceptable error. According to simulation results, humidity dynamics of the model under different current conditions and different stack temperatures are analyzed. Lastly, main conclusions are summarized in the last section.
2. Modelling
The model used was developed based on mass conservation law, energy conservation law, mass transport theory and electrochemistry principles, also utilizing the electrochemical model, mass flow model and thermal model. In Simulink® environment, the model of OC-PEMFC is established, as shown in Figure 2. In the electrochemical model, the cell output voltage is determined by the Nernst potential and three major voltage losses (activation overvoltage, ohmic overvoltage and concentration overvoltage). In the thermal model, heat generated through electrochemical reaction and dissipation caused by forced convection is considered. In the mass flow model, the air delivery system, the anode flow channel, the cathode flow channel, the cathode gas diffusion layer (CGL), the cathode catalyst layer and the membrane is modelled. Due to the cathode flow channel being exposed to atmosphere, the water retention property of CGL is needed to be modelled, in order to describe the internal humidity state.
2.1. Electrochemical Model
The cell output voltage is determined by the Nernst potential and three major voltage losses (activation overvoltage , ohmic overvoltage and concentration overvoltage ) as follows [14]:
The Nernst potential [V], also known as the thermodynamic reversible potential, is expressed as:
where is the standard thermodynamic reversible voltage [V], is the universal gas constant [8.314 J mol−1 K−1], is the temperature of the stack [K], is the Faraday constant [96,485 C mol−1], is the partial pressure of hydrogen [bar], is the partial pressure of oxygen [bar].
The activation overvoltage [V] caused by slow kinetics of the oxygen reduction reaction is calculated using Equation (3):
where is the universal gas constant [8.314 J mol−1 K−1], is the charge transfer coefficient, is the Faraday constant [96,485 C mol−1], is the current density [A m−2], is the exchange current density [A m−2] expressed by the following equation:
where is the reference exchange current density [A m−2] measured at reference stack temperature [K] and reference reactant pressure [Pa], is the reactant partial pressure [Pa], is the pressure coefficient [-], which can be set from 0.5 to 1, is the activation energy for oxygen reduction on Pt [66,000 J mol−1].
The ohmic overvoltage [V] is determined using the following equation:
where is the cell active area [m2], is the lumped cell electrical resistance [], is the internal electrical resistance of the membrane [] which is expressed as:
where is the membrane thickness [m] and is conductivity of the membrane [m−1], given by the following empirical equation [19]:
where is the membrane water content that varies between 0 and 14 [-].
In order to describe the concentration overvoltage [V] more consistently with the actual situation in practical fuel cells, the empirical equation is used as follows:
where and are empirical coefficients [-] that can be tuned according to actual polarization curves.
2.2. Mass Flow Model
2.2.1. Air Delivery System
With air blowers directly attached to the fuel cell stack, air is delivered into the cathode channel according to the controller signal, affecting the stack temperature and the cathode oxygen stoichiometry . The pressure change caused by the rotation of air blowers [Pa] is described by the performance curves of air blowers as follows:
where is the rotate speed of air blowers [rpm], is the volumetric flow rate of air [m3 s−1], is the function relation expressed by the performance curves of air fans.
According to Bernoulli’s equation, when ignoring the effects of gravity, the pressure drop of delivering air into the cathode flow channel [Pa] is expressed by the following equation:
where is the empirical parameter of flow resistance [Pa s m−3], which is obtained experimentally.
By combining the Equations (9) and (10) above, the air flow rate [m3 s−1] at any rotational speed is obtained as follows:
According to the Ideal Gas Law, the molar flow rate of air delivered into the cathode [mol s−1] is expressed using the following equation:
where is the ambient pressure [Pa], is the ambient temperature [K]. Hence, the molar flow rate of oxygen [mol s−1], nitrogen [mol s−1] and water vapor [mol s−1] into the cathode flow channel is calculated:
where is the ambient molar fraction of oxygen in dry air [-], is the ambient relative humidity [-], is the saturation pressure of water vapor [Pa] at temperature [K] [22].
2.2.2. Cathode Flow Channel
According to the Ideal Gas Law and Mass Conservation Law, the pressure dynamics of the cathode flow channel is determined:
where , and are the oxygen, nitrogen and water vapor partial pressure in the cathode [Pa], is the volume of the cathode flow channel [m3], , , are the molar flow rate of oxygen, nitrogen and water vapor in exit flow [mol s−1], is the molar flow rate of oxygen from cathode to cathode catalyst layer [mol s−1], is the molar flow rate of water vapor from the cathode catalyst layer to the cathode [mol s−1].
With the pressure dynamics in the cathode, the pressure of the cathode flow channel is expressed as follows:
Since the cathode is directly exposed to the atmosphere, the pressure difference between the cathode flow channel and ambient conditions is significantly small. Hence, according to the linearized nozzle flow equation, the exit molar flow rate of air is calculated:
where is the cathode outlet nozzle constant [kg s−1 Pa−1], is the ambient pressure [Pa] and is molar mass of the cathode gas mixture [kg mol−1], which is obtained using the following equation:
where , and are the molar mass of oxygen, nitrogen and water vapor [kg mol−1].
With the outlet molar flow rate of air, cathode pressure and partial pressure of component gas, the exit molar flow rate of oxygen [mol s−1], nitrogen [mol s−1], water vapor [mol s−1] is determined:
2.2.3. Anode Flow Channel
In this paper, for the simplification of the model, it’s assumed that enough hydrogen is supplied into the anode, ensuring the anode works under ideal conditions. Furthermore, anode hydrogen pressure dynamics is ignored, which means the hydrogen pressure in the anode is assumed to be constant. Since the open-cathode PEMFC system is fuelled by dry pure hydrogen and works in a dead-ended mode, the anode water vapor pressure dynamics is influenced by the electro-osmotic drag phenomenon and back-diffusion phenomenon as follows:
where is the water vapor pressure in the anode [Pa], is the volume of the anode flow channel [m3], is the molar flow rate of water flow caused by back-diffusion phenomenon [mol s−1], is the molar flow rate of water flow from anode to cathode caused by electro-osmotic drag phenomenon [mol s−1].
2.2.4. Cathode Gas Diffusion Layer
For self-humidifying open-cathode PEMFC, the water retention and removal properties of the cathode gas diffusion layer are important to ensure the good internal humidity conditions of the stack [23,24]. On the other hand, good water retention property means the gas transfer characteristic is comparatively worse, which significantly affects the output performance of the fuel cell. Hence, both the oxygen transfer characteristic and water transfer characteristic are modelled. According to Fick’s first law, the molar flow rate of oxygen from the cathode to the catalyst layer of the cathode [mol s−1] is obtained:
where is the effective diffusion coefficient of oxygen in the cathode gas diffusion layer [m2 s−1], is the number of fuel cell in stack [-], is the thickness of the cathode gas diffusion layer [m], is the oxygen concentration in the cathode catalyst layer [mol m−3] and is the oxygen concentration in the cathode flow channel [mol m−3],which is determined:
The effective diffusion coefficient of oxygen in the cathode gas diffusion layer depends on stack temperature , cathode pressure and geometry of the gas diffusion layer, which is calculated:
where is the porosity of gas diffusion layer [-], is the tortuosity of gas diffusion layer [-], is the binary diffusivity of oxygen in nitrogen [m2 s−1] measured at reference temperature [K] and reference pressure [Pa].
In the same way, the molar flow rate of water vapor from the cathode catalyst layer to the cathode [mol s−1] is determined:
where is the effective diffusion coefficient of water in the cathode gas diffusion layer [m2 s−1], is the water concentration in the cathode catalyst layer [mol m−3], is the water concentration in the cathode flow channel [mol m−3] obtained by the following equation:
The effective diffusion coefficient of water in the cathode gas diffusion layer is determined:
where is the binary diffusivity of water in nitrogen [m2 s−1] measured at reference temperature [K] and reference pressure [Pa].
2.2.5. Cathode Catalyst Layer
Compared with the gas diffusion layer, the catalyst layer is significantly thin. Hence, it is assumed that the concentration of oxygen and water is uniform across the cathode catalyst layer. According to Mass Conservation Law, the concentration dynamics of oxygen is modelled using the following equation:
where is the volume of the cathode catalyst layer, is the consumption rate of oxygen due to the electrochemical reaction [mol s−1], which is calculated:
where is the stack current [A].
Similarly, the concentration dynamics of water is obtained as follows:
where is the production rate of water due to the reaction [mol s−1], which is calculated:
2.2.6. Membrane
In our model, the membrane water content is represented, because it directly affects the output performance and durability of the stack. The dynamic model of is established as follows:
where is the volume of membrane [m3], is the dry density of the membrane [kg m−3], is the dry equivalent weight of the membrane [kg mol−1], , is the molar flow rate of water flow caused by back-diffusion phenomenon [mol s−1], which is determined:
where , is the water concentration at membrane surfaces on the anode and cathode sides [mol m−3], is the membrane thickness [m], is the water diffusion coefficient in membrane [m2 s−1], which is calculated [14]:
where is the empirical coefficient which is obtained using Equation (37). The water concentration in membrane is obtained:
where subscript represents an, ca or mem, , is the water content at the membrane surfaces on the anode and cathode sides [-], which is determined as follows [25]:
where subscript represents an, ca, is the water activity of the membrane anode side [-], is the water activity of the membrane cathode side [-].
The water activity of the membrane anode side is defined as:
Similarly, the water activity of the membrane cathode side is obtained:
where is the water partial pressure in cathode catalyst layer [Pa], is the water concentration in the cathode catalyst layer [mol m−3], which is calculated using Equation (32).
Furthermore, the membrane water content affects the water flow across the membrane. The molar flow rate of water flow caused by electro-osmotic drag phenomenon is influenced by the electro-osmotic drag coefficient [-] and stack current as follows:
where is calculated using the following empirical equation [26]:
2.3. Thermal Model
Since the heat dissipates by natural convection and radiation is significantly small, only the dissipation caused by forced convection is taken into consideration. Hence, in the thermal model, the stack generates heat through electrochemical reaction and is cooled by the forced convection caused due to the rotation of fans. The stack temperature dynamics is described as follows:
where is the mass of the stack [kg], is the specific heat capacity of the stack [J kg−1 K−1], is the heat dissipated by the fans [W], is the heat generated by the electrochemical reaction [W], which is obtained:
where is the molar enthalpy change of the electrochemical reaction. is determined as follows:
where is the molar mass of air [kg mol−1], is the specific heat capacity of air [J kg−1 K−1].
3. Results and Discussion
In order to verify the established model, experiments have been carried out on a 2kW OC-PEMFC, as shown in Figure 3. In the experimental system, a thermocouple is inserted into the fuel cell stack and the temperature signal is transmitted to the controller. The output power of the fuel cell is consumed by the electronic load. Through serial communication, experimental data of fuel cell voltage and current in the electronic load is obtained.
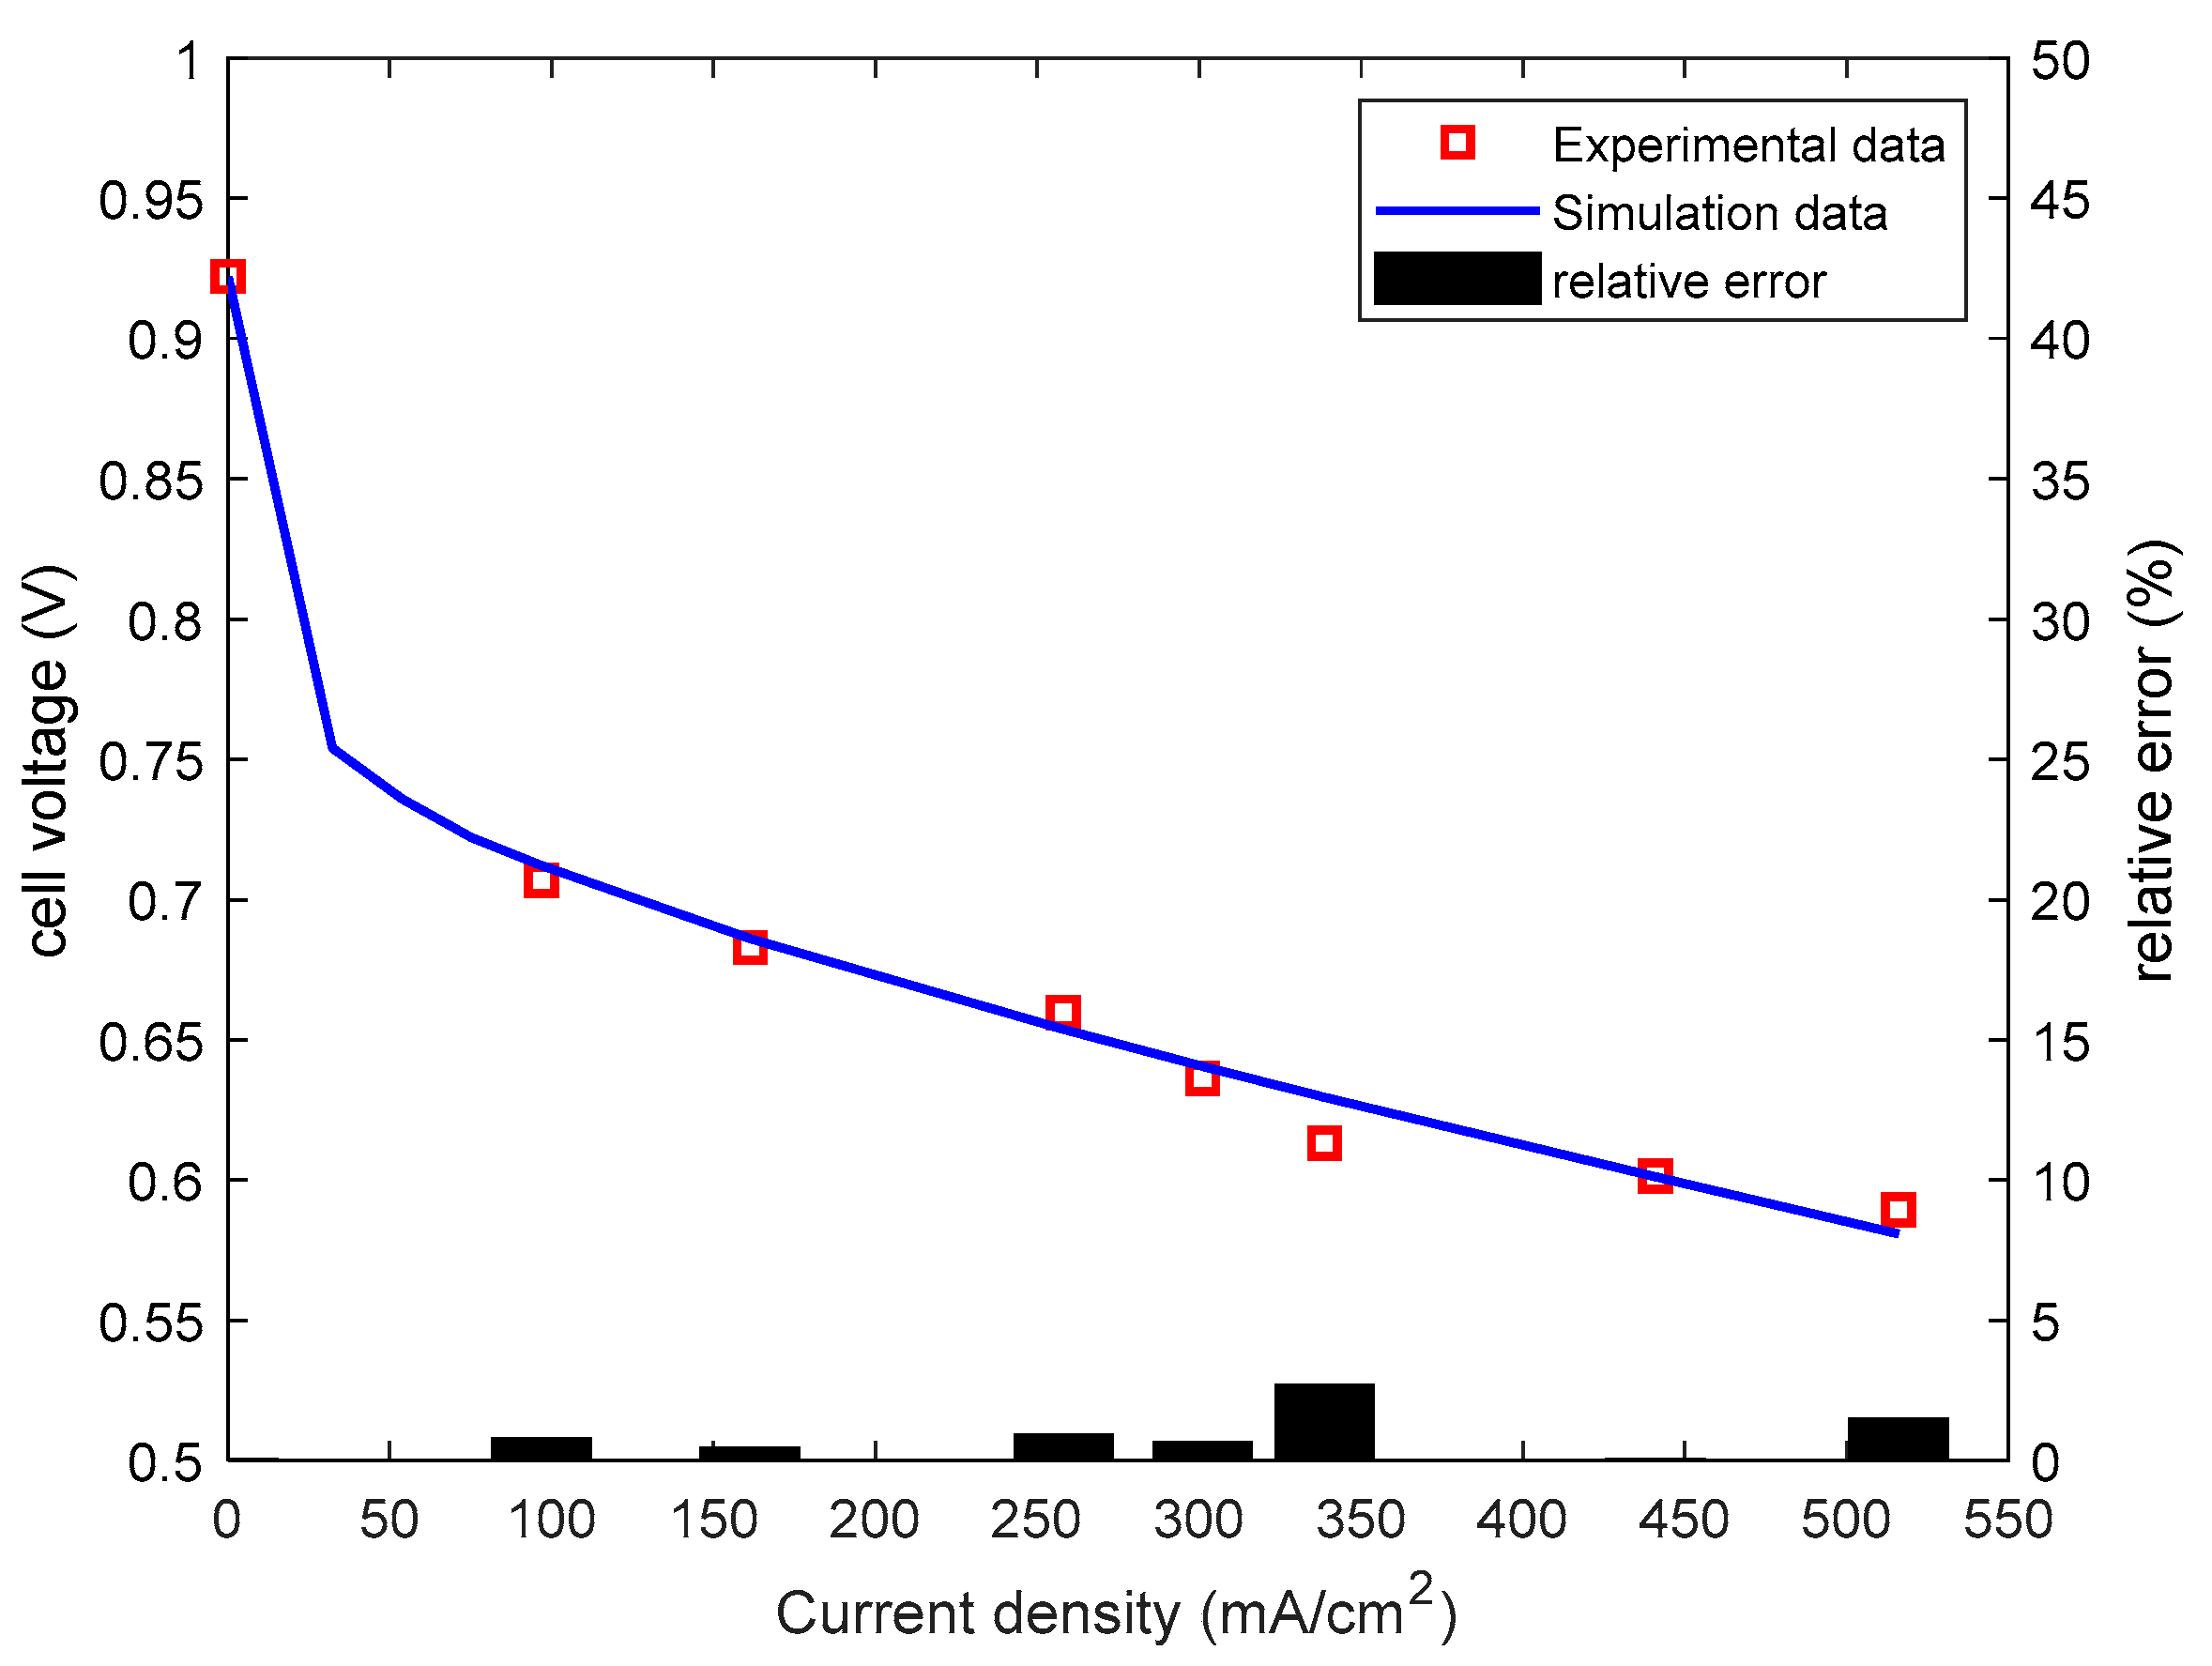
For the comparison between the simulation and experimental data, the calculation of relative error is introduced, which is shown in Equation (47).
where is the relative error between the simulation and experimental data [%], is the output cell voltage of simulation, is the output cell voltage of experiment.
The output performance considering the effect of the internal humidity state and error analysis is shown in Figure 4. The maximum relative error is less than 3%, which indicates that the simulation result follows the experimental data with acceptable error. Hence, the model can be used to predict the output performance of the system, which is helpful for the determination of the best system operation conditions.
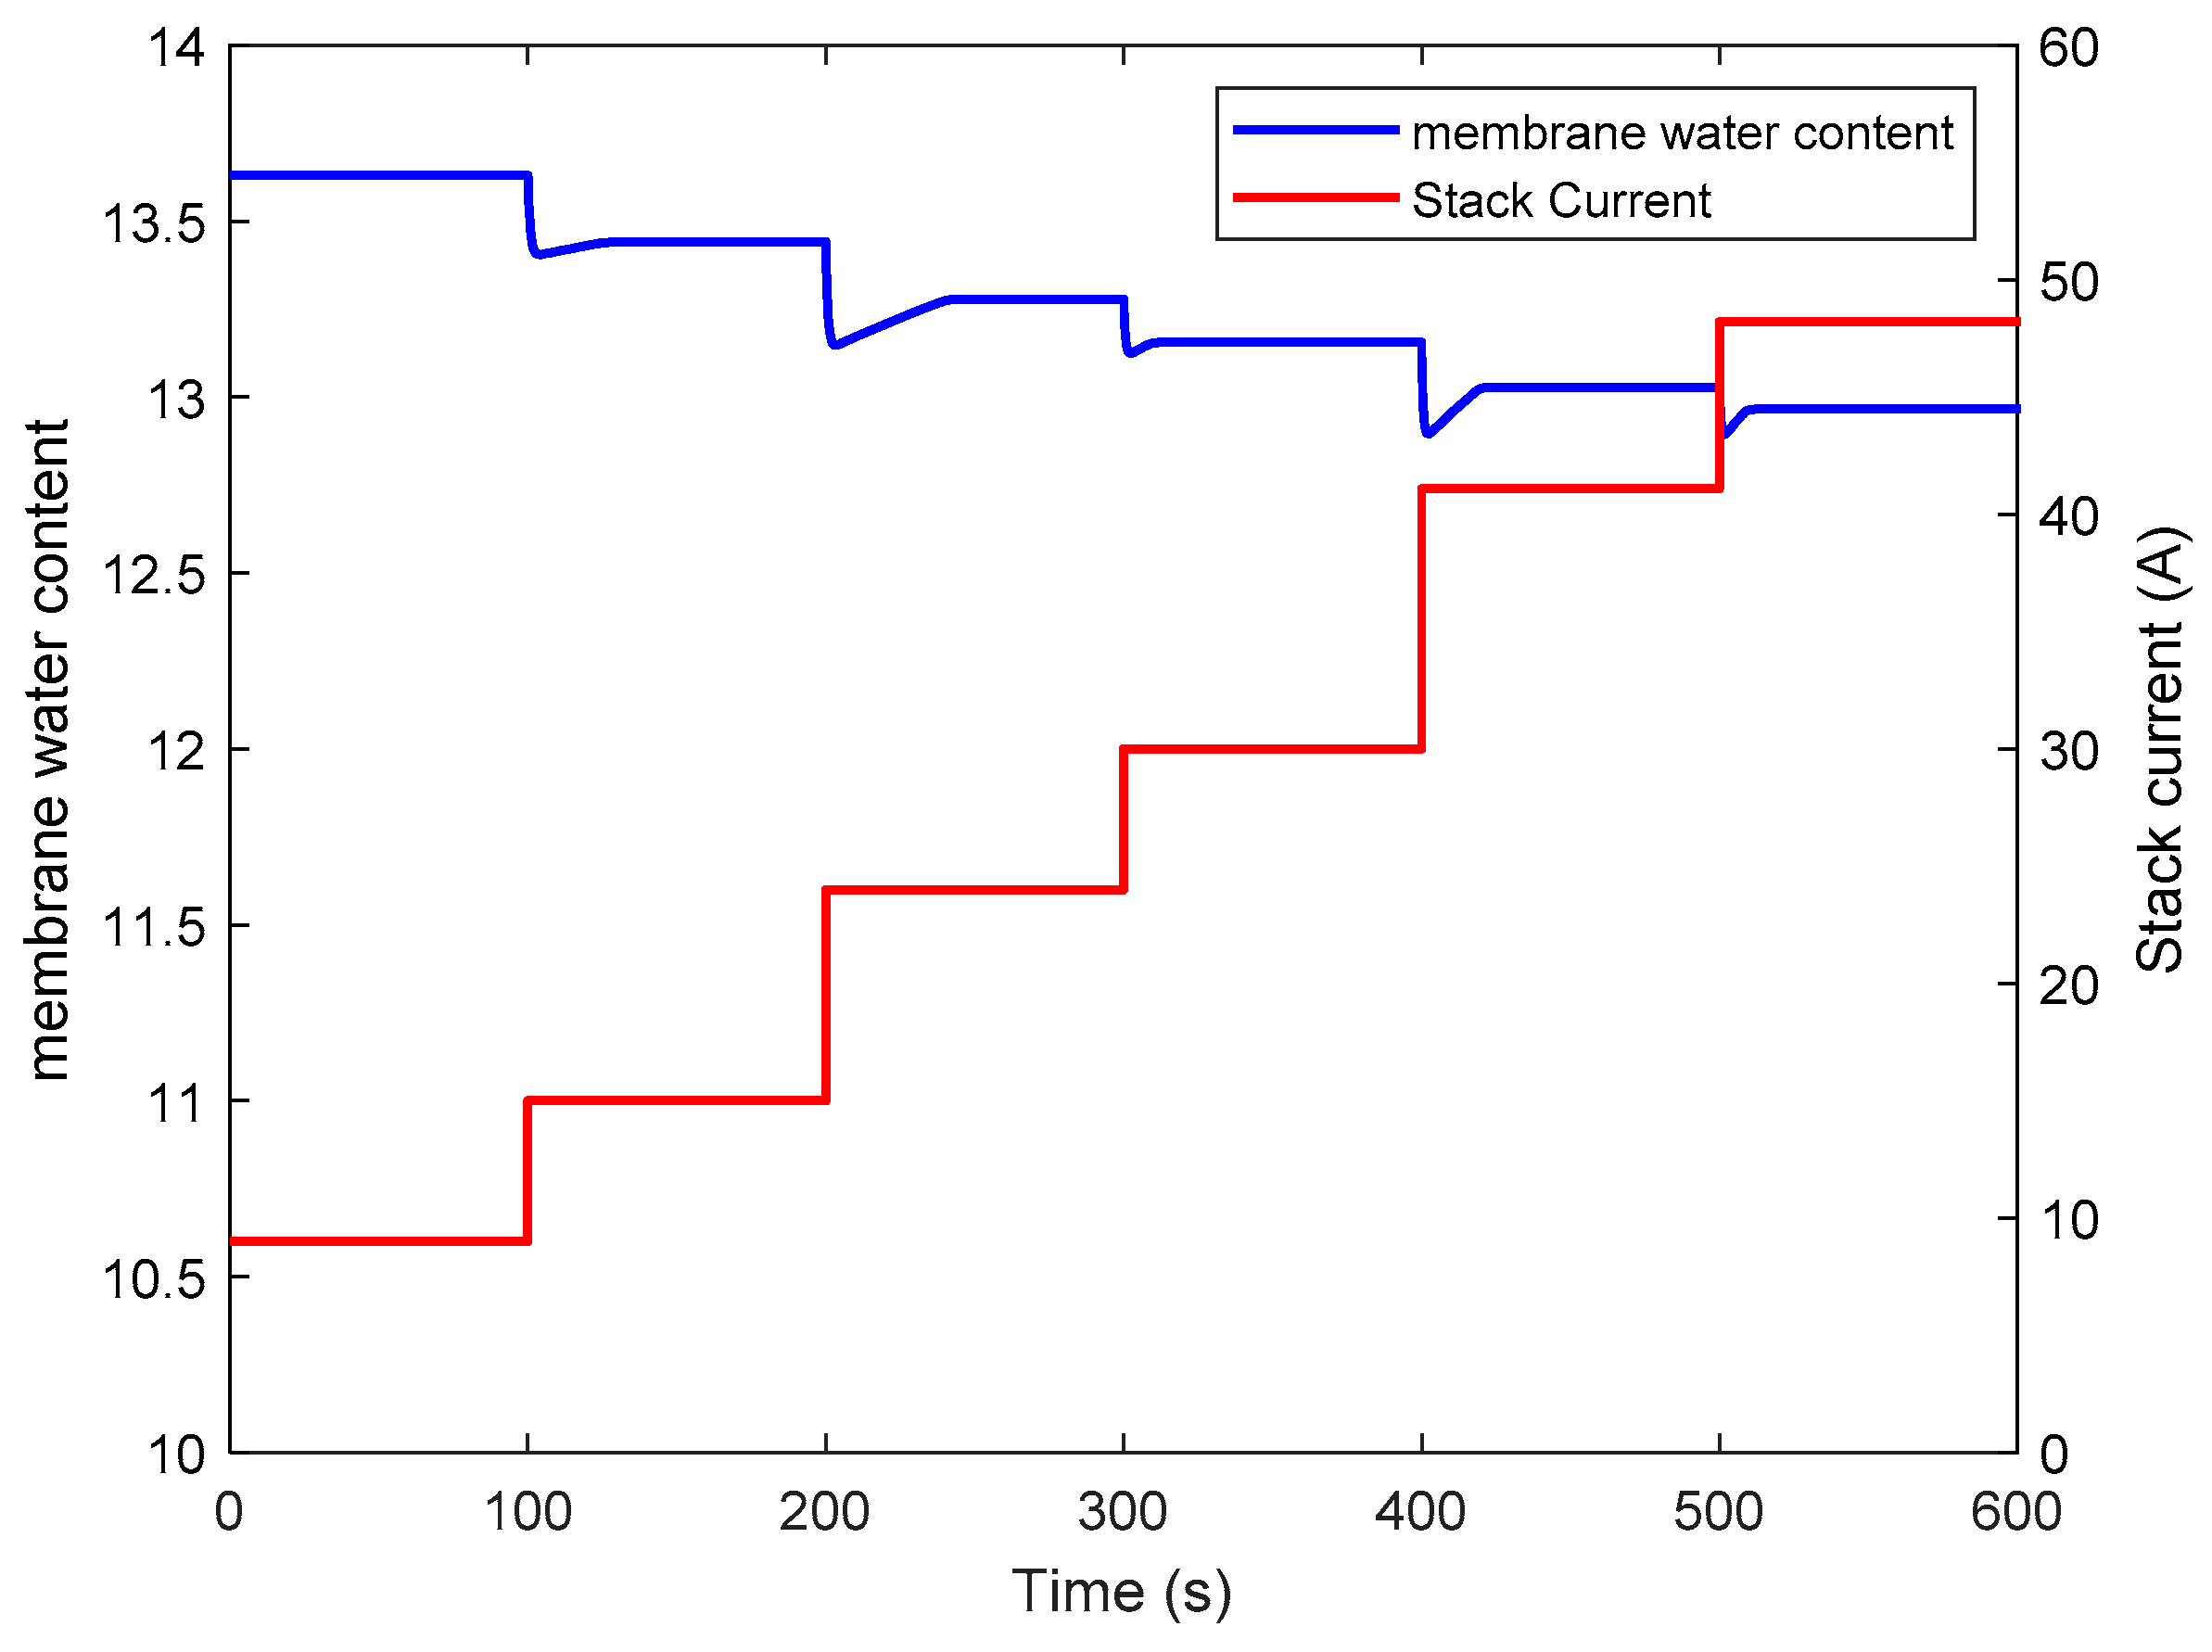
Humidity dynamics of the model under different current conditions is shown in Figure 5. Under each current condition, a proper operating temperature has been set to ensure a good internal humidity state. The following discussions are carried out on this basis.
The settling time of the internal humidity under such current step tests is shown in Table 1. As shown in Figure 5, with the current step, there is always a drop of membrane water content. There are two reasons for this phenomenon.
- Firstly, this is because the water flow rate caused by electro-osmotic drag suddenly increases in response to the step of current. Therefore, more water moves from the anode to cathode, which leads to the decrease of the water content in the anode. However, the humidity at the cathode catalyst layer is already in saturation state. Hence, the water content at the membrane cathode side remains nearly unchanged. According to the dynamic model of membrane, with unchanged water content at the membrane cathode side and a decreased water content at the anode, a drop of membrane water content occurs.
- Secondly, in order to ensure the output performance and efficiency of the stack, the operation temperature of the stack is higher with the increase of stack current, which leads to a rise in saturated vapor pressure. Hence, the relative humidity within the stack is decreased, so that there is a decline in membrane water content. In this respect, the relationship between temperature and humidity dynamics is illustrated.
After the drop in membrane water content, there is a slight rise. The main reason for this is that the water diffusion coefficient in the membrane increases with the rise of the stack temperature. Due to back-diffusion, more water moves from the cathode to the anode, so that the water content in the anode increases. Due to the saturation state in the cathode catalyst layer, the humidity state at the cathode catalyst layer remains the same, although more water moves to the anode. Therefore, the slight rise shown in Figure 5 occurs.
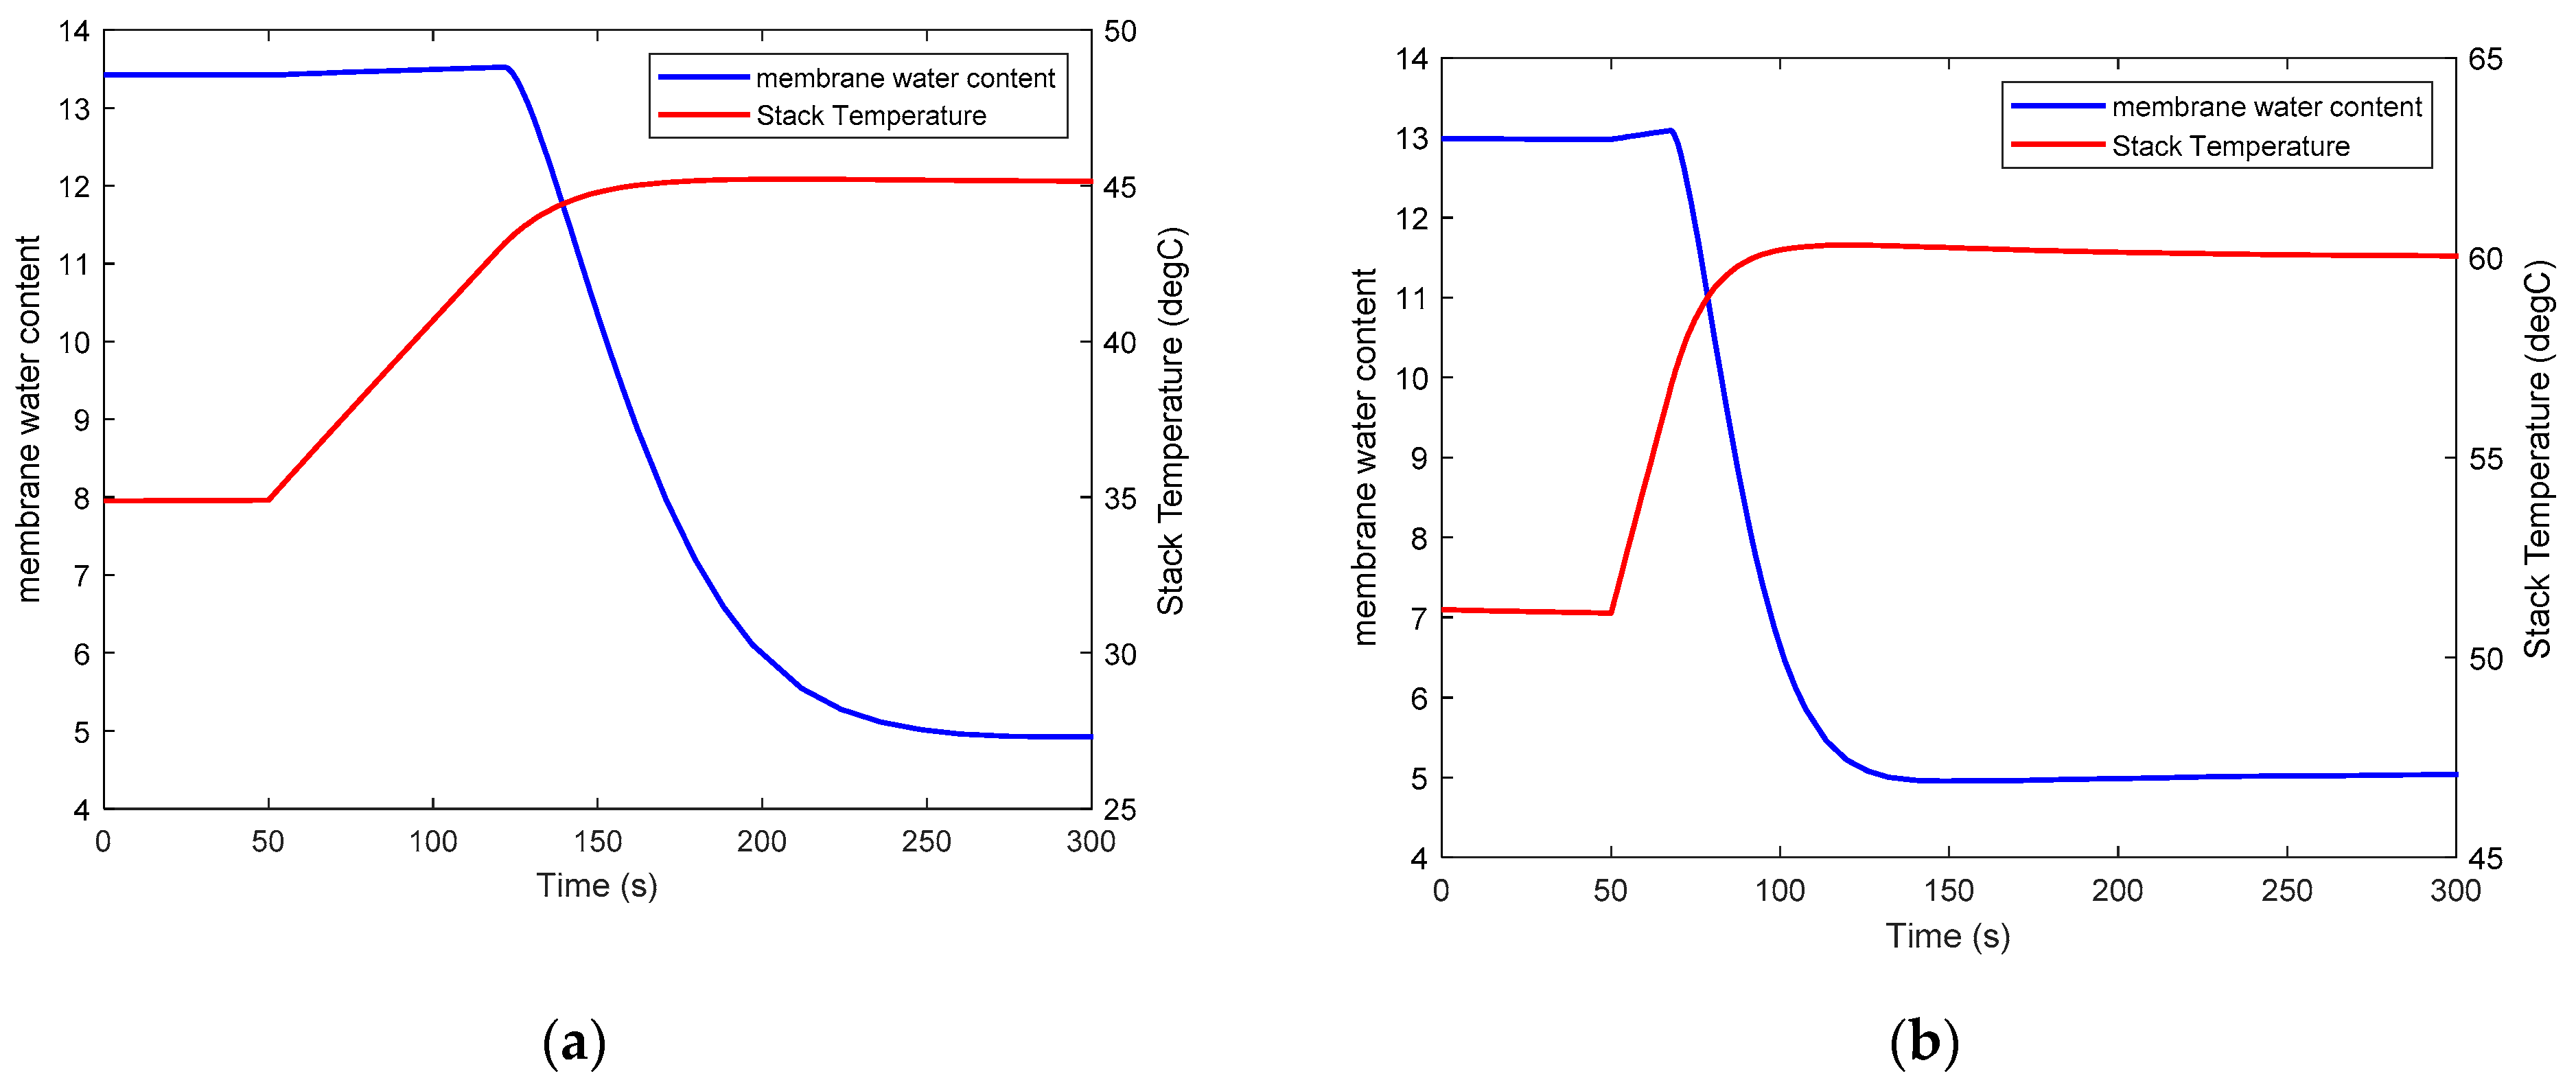
Humidity dynamics at 15 A and 41 A under different temperatures is shown in Figure 6a,b. As shown from these simulation results, the internal humidity of the OC-PEMFC is affected by the operation temperature. In a certain temperature range, a good internal humidity state is ensured. However, when the stack temperature is too high, the internal humidity drops, which possibly leads to the dehydration of the proton exchange membrane. In order to ensure a good internal humidity state, high output voltage and low accessory power, an optimal operation temperature of a 2kW OC-PEMFC is determined by the model, which is shown in Table 2. In our future work, this model can also be used to design a proper control strategy for OC-PEMFC.
4. Conclusions
Based on this model, the output performance of OC-PEMFC considering the effect of the internal humidity state is predicted. The simulation results show the dynamic process of the membrane humidity state in response to the current step tests. The settling time of the internal humidity under such current step tests is shown in Table 1. The reasons for the drop in membrane water content, with the increase of current, is the increase of electro-osmotic drag and the rise of the stack temperature. The increase of the water diffusion coefficient in the membrane leads to a slight rise in membrane water content, as shown in Figure 5. Within a certain range of operation temperature, the stack is in a good internal humidity state. However, when the stack temperature rises too high, dehydration of the proton exchange membrane occurs. In order to maintain a good internal humidity state during operation, this model can be used to determine the optimal stack temperature and for the design of a proper control strategy.
Author Contributions
Conceptualization, F.C.; methodology, L.Z. and J.J.; software, L.Z.; validation, L.Z.; formal analysis, L.Z. and J.J.; investigation, F.C., L.Z. and J.J.; resources, F.C.; data curation, L.Z.; writing—original draft preparation, L.Z.; writing—review and editing, F.C.; visualization, L.Z.; supervision, F.C.; project administration, F.C.; funding acquisition, F.C. All authors have read and agreed to the published version of the manuscript.
Funding
This study was supported by National Key R&D Program of China. (No. 2017YFB0103104) and Key Technology R&D Program of Anhui Province (No. 2019b05050004, high power density self-humidification fuel cell system based on a stack of self-owned core technology).
Institutional Review Board Statement
Not applicable.
Informed Consent Statement
Not applicable.
Conflicts of Interest
The authors declare no conflict of interest. The funders had no role in the design of the study; in the collection, analyses, or interpretation of data; in the writing of the manuscript, or in the decision to publish the results.
References
- Saleh, I.M.M.; Ali, R.; Hongwei, Z. Simplified mathematical model of proton exchange membrane fuel cell based on horizon fuel cell stack. J. Mod. Power Syst. Clean Energy 2016, 4, 668–679. [Google Scholar] [CrossRef] [Green Version]
- Li, X.; Han, K.; Song, Y. Dynamic behaviors of PEM fuel cells under load changes. Int. J. Hydrogen Energy 2020, 45, 20312–20320. [Google Scholar] [CrossRef]
- Hao, W.; Xianguo, L.; Berg, P. Numerical analysis of dynamic processes in fully humidified PEM fuel cells. Int. J. Hydrogen Energy 2007, 32, 2022–2031. [Google Scholar] [CrossRef]
- Dong Gyun, K.; Chanyeong, P.; In Seop, L.; Sung Hoon, C.; Dong Keun, L.; Min Soo, K. Performance enhancement of air-cooled open cathode polymer electrolyte membrane fuel cell with inserting metal foam in the cathode side. Int. J. Hydrogen Energy 2020, 45, 27622–27631. [Google Scholar] [CrossRef]
- Sagar, A.; Chugh, S.; Sonkar, K.; Sharma, A.; Kjeang, E. A computational analysis on the operational behaviour of open-cathode polymer electrolyte membrane fuel cells. Int. J. Hydrogen Energy 2020, 45, 34125–34138. [Google Scholar] [CrossRef]
- Bidoggia, B.; Kaer, S.K. Estimation of membrane hydration status for standby proton exchange membrane fuel cell systems by complex impedance measurement: Constant temperature stack characterization. Int. J. Hydrogen Energy 2013, 38, 4054–4066. [Google Scholar] [CrossRef]
- Santa Rosa, D.T.; Pinto, D.G.; Silva, V.S.; Silva, R.A.; Rangel, C.M. High performance PEMFC stack with open-cathode at ambient pressure and temperature conditions. Int. J. Hydrogen Energy 2007, 32, 4350–4357. [Google Scholar] [CrossRef]
- Lopez-Sabiron, A.M.; Barroso, J.; Roda, V.; Barranco, J.; Lozano, A.; Barreras, F. Design and development of the cooling system of a 2 kW nominal power open-cathode polymer electrolyte fuel cell stack. Int. J. Hydrogen Energy 2012, 37, 7289–7298. [Google Scholar] [CrossRef]
- Fu, H.; Shen, J.; Sun, L.; Lee, K.Y. Fuel cell humidity modeling and control using cathode internal water content. Int. J. Hydrogen Energy 2021, 46, 9905–9917. [Google Scholar] [CrossRef]
- Fengxiang, C.; Jieran, J.; Zhongjun, H.; Wei, C.; Jun, C.; Zenggang, X.; Jie, C. Robust polymer electrolyte membrane fuel cell temperature tracking control based on cascade internal model control. J. Power Sources 2020, 479, 229008. [Google Scholar] [CrossRef]
- Headley, A.; Yu, V.; Borduin, R.; Dongmei, C.; Wei, L. Development and experimental validation of a physics-based PEM fuel cell model for cathode humidity control design. IEEE/ASME Trans. Mechatron. 2016, 21, 1775–1782. [Google Scholar] [CrossRef]
- Hong, P.; Xu, L.; Li, J.; Ouyang, M. Modeling of membrane electrode assembly of PEM fuel cell to analyze voltage losses inside. Energy 2017, 139, 277–288. [Google Scholar] [CrossRef]
- Dongmei, C.; Huei, P. Modeling and simulation of a PEM fuel cell humidification system. In Proceedings of the 2004 American Control Conference, Piscataway, NJ, USA, 30 June–2 July 2004; pp. 822–827. [Google Scholar]
- Pukrushpan, J.T.; Peng, H.; Stefanopoulou, A.G. Control-oriented modeling and analysis for automotive fuel cell systems. J. Dyn. Syst. Meas. Control. Trans. ASME 2004, 126, 14–25. [Google Scholar] [CrossRef]
- Strahl, S.; Husar, A.; Serra, M. Development and experimental validation of a dynamic thermal and water distribution model of an open cathode proton exchange membrane fuel cell. J. Power Sources 2011, 196, 4251–4263. [Google Scholar] [CrossRef] [Green Version]
- Strahl, S.; Costa-Castello, R. Model-based analysis for the thermal management of open-cathode proton exchange membrane fuel cell systems concerning efficiency and stability. J. Process. Control. 2016, 47, 201–212. [Google Scholar] [CrossRef] [Green Version]
- Mahjoubi, C.; Olivier, J.C.; Skander-mustapha, S.; Machmoum, M.; Slama-belkhodja, I. An improved thermal control of open cathode proton exchange membrane fuel cell. Int. J. Hydrogen Energy 2019, 44, 11332–11345. [Google Scholar] [CrossRef]
- Zhang, B.; Lin, F.; Zhang, C.; Liao, R.; Wang, Y.-X. Design and implementation of model predictive control for an open-cathode fuel cell thermal management system. Renew. Energy 2020, 154, 1014–1024. [Google Scholar] [CrossRef]
- Yan, Z.; Biao, Z. Modeling and control of a portable proton exchange membrane fuel cell-battery power system. J. Power Sources 2011, 196, 8413–8423. [Google Scholar] [CrossRef]
- Lu, L.; Liangzhen, Y.; Qi, L.; Weirong, C. Control-oriented temperature dynamic modeling of open-cathode PEM fuel cell via on-line T-S fuzzy identification method. In Proceedings of the 2017 IEEE Transportation Electrification Conference and Expo, Asia-Pacific (ITEC Asia-Pacific), Piscataway, NJ, USA, 7–10 August 2017; p. 5. [Google Scholar]
- Sun, L.; Jin, Y.; You, F. Active disturbance rejection temperature control of open-cathode proton exchange membrane fuel cell. Appl. Energy 2020, 261, 114381. [Google Scholar] [CrossRef]
- Ismail, M.S.; Ingham, D.B.; Hughes, K.J.; Ma, L.; Pourkashanian, M. An efficient mathematical model for air-breathing PEM fuel cells. Appl. Energy 2014, 135, 490–503. [Google Scholar] [CrossRef]
- O’Hayre, R.; Fabian, T.; Litster, S.; Prinz, F.B.; Santiago, J.G. Engineering model of a passive planar air breathing fuel cell cathode. J. Power Sources 2007, 167, 118–129. [Google Scholar] [CrossRef]
- Yalcinoz, T.; Alam, M.S. Dynamic modeling and simulation of air-breathing proton exchange membrane fuel cell. J. Power Sources 2008, 182, 168–174. [Google Scholar] [CrossRef]
- Liso, V.; Araya, S.S.; Olesen, A.C.; Nielsen, M.P.; Kaer, S.K. Modeling and experimental validation of water mass balance in a PEM fuel cell stack. Int. J. Hydrogen Energy 2016, 41, 3079–3092. [Google Scholar] [CrossRef]
- Shang-Wen, T.; Yong-Song, C. A mathematical model to study the energy efficiency of a proton exchange membrane fuel cell with a dead-ended anode. Appl. Energy 2017, 188, 151–159. [Google Scholar] [CrossRef]
Figure 1.
Schematic diagram of OC-PEMFC.

Figure 2.
OC-PEMFC model.

Figure 3.
The 2 kW OC-PEMFC.

Figure 4.
Polarization curve and error analysis.

Figure 5.
Humidity dynamics under different current conditions.

Figure 6.
Humidity dynamics at under different stack temperature: (a) at 15 A; (b) at 41 A.


Table 1.
The settling time of the internal humidity under such current step tests.
| Current Step Test | Settling Time(s) |
|---|---|
| 9 A to 15 A | 22.5 |
| 15 A to 24 A | 39.4 |
| 24 A to 30 A | 8.5 |
| 30 A to 41 A | 18.9 |
| 41 A to 48 A | 9.8 |
Table 2.
Optimal operation temperature of a 2kW OC-PEMFC determined by the model.
| Stack Current (A) | Current Density (mA/cm2) | Operation Temperature (°C) |
|---|---|---|
| 9 A | 96.8 | 33 |
| 15 A | 161.3 | 36 |
| 24 A | 258.1 | 44 |
| 30 A | 322.6 | 46 |
| 41 A | 440.9 | 53 |
| 48 A | 516.1 | 57 |
Publisher’s Note: MDPI stays neutral with regard to jurisdictional claims in published maps and institutional affiliations. |
© 2021 by the authors. Licensee MDPI, Basel, Switzerland. This article is an open access article distributed under the terms and conditions of the Creative Commons Attribution (CC BY) license (https://creativecommons.org/licenses/by/4.0/).
Share and Cite
MDPI and ACS Style
Chen, F.; Zhang, L.; Jiao, J. Modelling of Humidity Dynamics for Open-Cathode Proton Exchange Membrane Fuel Cell. World Electr. Veh. J. 2021, 12, 106. https://0-doi-org.brum.beds.ac.uk/10.3390/wevj12030106
AMA Style
Chen F, Zhang L, Jiao J. Modelling of Humidity Dynamics for Open-Cathode Proton Exchange Membrane Fuel Cell. World Electric Vehicle Journal. 2021; 12(3):106. https://0-doi-org.brum.beds.ac.uk/10.3390/wevj12030106
Chicago/Turabian StyleChen, Fengxiang, Liming Zhang, and Jieran Jiao. 2021. "Modelling of Humidity Dynamics for Open-Cathode Proton Exchange Membrane Fuel Cell" World Electric Vehicle Journal 12, no. 3: 106. https://0-doi-org.brum.beds.ac.uk/10.3390/wevj12030106