
Techno-Economic Analysis and Feasibility Studies of Electric Vehicle Charging Station


Faculty of Integrated Technologies, Universiti Brunei Darussalam, Jalan Tungku Link BE1410, Brunei
*
Author to whom correspondence should be addressed.
World Electr. Veh. J. 2021, 12(4), 264; https://0-doi-org.brum.beds.ac.uk/10.3390/wevj12040264
Submission received: 28 November 2021
/
Revised: 6 December 2021
/
Accepted: 13 December 2021
/
Published: 15 December 2021
(This article belongs to the Special Issue Modern Charging Techniques for Electrical Vehicles)
Abstract
:Recent United Nations high-level dialogue on energy, which had emphasized on energy usage and environmental protection, has renewed commitments by different countries on the adoption of electric vehicle (EVs). This paper aims to analyze the economic feasibility of establishing electrical charging stations, which is an important factor for the wide adoption of EVs, using life cycle cost analysis. Although local data have been used, the method can be easily adopted to analyze economic feasibility at different markets. The findings have revealed that an electrical charging station is only feasible when the acquisition cost is kept to a minimum to return 1.47 times the initial investment in terms of life cycle cost. An acquisition cost of BND 29,725 on the electrical charging station represents the threshold below which an electrical charging station is more attractive. In order to promote these charging stations, the government needs to provide multiple incentives, including a subsidy to reduce the acquisition cost, relaxing control on the electric selling price, taxing the establishment of conventional filling stations, and minimally reducing the profit margin on the selling price of fossil fuel. It has been shown that a 40% initial subsidy on the purchase of electrical charging stations, coupled with a slight subsidy of BND 0.018/kWh on electricity, would make electrical charging stations economically competitive. To reach its target of 60% electrification of the transportation sector, Brunei would need to implement a structure program to establish between 646 and 3300 electrical charging stations by the year 2035, to cater for its expected number of EVs.
1. Introduction
Coupled with a general increase in the standard of living and urbanization, the ever-increasing world population has resulted in an overall increase in energy demand, with the energy sector primarily relying on fossil fuel to satisfy these needs. Naturally, the consumptions of these fossil fuels tax the environment. Pollution, contamination of water sources, an increase in water levels, and greenhouse effects are some of the environmental problems associated with the burning of fossil fuel for energy purposes. With the latest United Nations 2019 report, a further increase in the world’s population has been projected, from the current 7.7 billion in 2019 to 8.5 billion in 2030, and to 10.9 billion at the end of the century [1]. If no meaningful action is taken by all parties, including governments and companies, as well as individuals, exacerbation of the problems would be inevitable, and the world would be set to follow a downward spiral.
Fortunately, many efforts have been made by all parties to reduce and, hopefully, reverse the environmental problems, which have resulted from the prolonged abuse of nature. Just recently, more than 130 global leaders, including heads of state and leaders of large companies, joined a high-level dialogue to discuss energy access, and the associated environmental problems [2]. Subsequently, ambitious targets were set, which had culminated in the first-ever global roadmap, enunciating strategies of reaching universal energy access and transition towards renewable energy generations by the year 2030. In fact, many studies have been carried out on renewable energies as alternatives to fossil fuel, and the roadmap merely showed commitments by the different parties to traverse the path towards renewable energy.
Different researchers have suggested different renewable energy sources, including solar, wind [3], biodiesel [4], and geothermal energy [5]. Of course, the practicality and feasibility of using these sources of renewable energy rely on their availability as well as their technological advancement. The use of geothermal energy may be feasible in the volcanic regions of Indonesia, but not in the cold European countries, and harvesting energy from the wind may be possible in the windy Drumderg region of Scotland but not in the foothills of Arizona. In the tropical region, researchers have explored the use of solar energy, due to its strategic geographical location with plenty of sunshine. Recently, the use of biodiesel using different feedstocks [6,7] has also been extensively discussed and researched.
Other than exploring alternative energy sources, researchers have also attempted to understand the demand side of things, by suggesting the use of standards [8] and labeling [9] to increase efficiencies during usage of the scarce energy. These include its implementation in power generation plants [8], which convert fossil fuel into electricity, and common household products and appliances [9,10], such as washing machines, refrigerators, and air-conditioning systems, as well as in the transportation sector [11], such as in internal combustion engine vehicles (ICEVs) and electric vehicles (EVs). Standards and labeling systematically remove inefficient products from the ecosystem, whilst at the same time encourage informed decisions on the part of the consumers, by providing them clear information on efficient energy usage and prices.
The transportation sector has traditionally been one of biggest environmental polluters. Whilst necessary, the use of land, air, and sea transports contributes a big proportion of CO2 emissions to the atmosphere, and as the number of vehicles worldwide is expected to increase even further, so does the impact on the environment. Numerous efforts have been made to reduce the environmental effect from the transportation sector, such as by introducing standards and labeling [11], encouraging the use of public transportation [12], and the use of alternative energy sources [13,14].
Among these efforts, studies on the use of hydrogen [13] and electric vehicles [14] deserve special mentions due to the fast development of these technologies, as well as their potentials in solving the energy–environmental quagmires [15]. As its name suggests, a hydrogen vehicle uses hydrogen as fuel, which, when combined with oxygen in the air, produces electricity to power the vehicle, as well as harmless H2O as a by-product. Hence, similar to an EV, a hydrogen vehicle has zero tailpipe emissions. As a hydrogen vehicle can be filled up with hydrogen relatively quickly, very similar to how ICEVs can be filled up at a conventional filling station, it has a substantial edge over EVs [16]. However, not all is green with hydrogen vehicle technology. Conversion of hydrogen gas into liquid hydrogen, to facilitate transportation to a fuel station, requires lots of energy, which commonly comes from fossil fuel. On the other hand, EVs consume battery-stored electricity, and depending on the energy sources, can be an extremely green technology.
Between hydrogen and electric vehicles, an EV is more mainstream, has been more extensively researched, and was introduced as early as the 19th century [17]. Strong interest in EVs, however, only started in the 1990s due to the introduction of the Zero Emission Mandate in the US. China and the US are at the forefront of the adoption of EVs, with the number of EVs worldwide expected to shoot up as battery technologies progress even further, and the effect of economies of scale kicks in [18]. Many research works have studied the economic viability and environmental effect of EVs to compete in markets dominated by ICEVs. References [19,20] have demonstrated that EVs are still relatively expensive, and are unable to compete against ICEVs in an open market. Other works [21,22], on the other hand, have indicated that EVs are already able to penetrate and compete with the ICEV-dominated car market. In fact, the ability of EVs to economically compete with existing technologies is dependent on many global and local factors [23,24,25], including prices and development of the technologies, assumed distance traveled, and local prices of gasoline and electric commodities. The government can play an important role in promoting the use of EVs by putting in place different incentives, such as the introduction of a subsidy for the acquisition cost of EVs, more attractive pricing of electricity, or taxing on the acquisition cost of ICEVs and selling price of fossil fuel.
Transition of the transportation sector from ICEVs to EVs requires a stable increase, and equal attention to the infrastructure requirement of EVs, with the existence of public charging stations acting as one of the keys for the growth of the EV market [26]. References [27,28] reported that a competitive market of EVs needs many forms of support policies, with policies on the provision of charging stations being one of the most important. A limited number of publicly accessible electrical charging stations would restrict drivers from using their EVs for longer trips, and hence virtually limit the usefulness and appeal of EVs. Indeed, China’s success in the public adoption of EVs (more than 300 k EVs sold in 2016 alone) has been attributed to, among other things, its large number of electrical charging stations, with almost half of the global electrical vehicle charging stations located in China [29].
There are several factors that need to be taken into consideration when discussing the provisions of public electrical charging stations, among them the use of different types of charging stations [26] and their costs [30], the ratio of EVs to public charging stations [31,32], charging stations’ placements [33,34,35], and their effect on the existing power supply [36]. Economic feasibility plays an important role when discussing the establishment of an electrical charging station, especially from the perspective of an investor, whose primary objective is commonly to derive economic benefit. Reference [37] describes a planning model method to site and size electrical charging stations, by taking into consideration life cycle cost and net present value of the project. Life cycle cost associated with the operation of an electrical charging station and its impact on commercial building electricity cost have been analyzed in reference [38], where it has been concluded that AC Level 1 and 2 workplace charging have a similar or even lower cost than home-based charging. Considering workplace charging, public AC Level 2 charging, and Level 3 DC fast charging stations, capital costs associated with the these three types of charging stations have been discussed [39], within the context of the US EV market. This study can be used as a reference for further studies.
Despite the importance of life cycle cost in determining the economic feasibility of establishing an electrical charging station, not a lot of studies have been performed on the topic, with a few exceptions [37,38,39]. Furthermore, our previous works on life cycle cost of EVs [20,40] have indicated the need to perform analysis using specific parameters derived from the market, to determine their competitiveness in a particular market. This paper attempts to analyze the feasibility of implementing an electrical charging station in the Bruneian market by performing life cycle cost analysis (LCCA) and comparing it with the LCCA of a conventional filling station which serves ICEVs. Important parameters, which strongly influence LCCs of both technologies, are also identified. Furthermore, the required number of electrical charging stations, in order for Brunei to achieve 60% electrification of its transportation sector, is also calculated. Although the analysis uses local data, the methods used can be easily adapted to analyze the competitiveness of establishing electrical charging stations in other markets, as well.
Geographically, Brunei is one of the producers of oil and gas in the Southeast Asian region and has one of the highest rates of vehicle ownership, with more than two vehicles per licensed driver [41]. Consequently, it also one of the highest emitters of CO2 from the transportation sector, with 12.3% of the country’s CO2 equivalent greenhouse gas emissions coming from its transportation sector. In its recent Brunei National Climate Change Policy (BNCCP) [42], it has outlined a target of 60% EVs on Brunei roads by the year 2035. Due to the close association of the provision of electrical charging stations with this objective, LCC analysis of the charging station would undoubtedly be beneficial, to identify focus areas to make this noble target more achievable.
2. Methodology
2.1. Vehicle and Infrastructure Selection
It is incontestable that the provision of infrastructure plays an important role in the adoption of electric vehicles (EVs). Other than homes, workplaces/universities and parking lots appear as the second most preferred locations for electric vehicle charging facilities, from an online survey conducted [43] on the topic. This is expected as most people spend a big portion of their days out of the home, mostly at work or study, and the provision of affordable charging facilities at these locations would be most convenient for them. Consequently, this would facilitate the adoption of electric vehicles specifically, in Brunei. As such, this study analyzes the economic feasibility of providing electric vehicle charging facilities at these locations, and this would be compared against the existing conventional filling stations dotted around the country serving the conventional internal combustion engine vehicles (ICEVs).
As the time spent at these locations may be relatively short, the fast Level 3 direct circuit fast charging (DCFC) is considered. The Level 3 DCFC charger is advantageous in terms of charging speed; it is typically able to bring most electric vehicles to 80% charged within 30 min. However, the Level 3 DCFC charger is relatively more expensive than Level 1 or Level 2 electric chargers.
The Mitsubishi i-MiEV and Toyota Vios have been selected to represent EVs and ICEVs, respectively. Similar representative vehicles of both EVs and ICEVs have been chosen in reference [20]; the i-MiEV is affordable as compared to other EVs and had been previously introduced to the general Brunei public through exhibitions, whilst the Toyota Vios is the best-selling model in Brunei. Both the i-MiEV and Vios are used to calculate the demand side, in terms of the amount electricity and fossil fuel required from the electric charging and fuel-filling stations.
2.2. Techno-Economic Analysis
Life cycle cost (LCC) [44] reflects the current cost of a technology over its lifetime. It is commonly used to determine the feasibility of a new technology, by comparing it against the current implementation, and in this study, LCC is used to analyze the feasibility of EVs. Specifically, this study focuses on the provision of infrastructure required for the adoption of EVs and studies its economic feasibility through comparison with conventional filling stations, which dispense fossil fuel for ICEVs. Additionally, LCC is also used to identify components which dominate the overall cost, and hence highly affect feasibility. This allows manufacturers, researchers, and government agencies to focus on the identified areas to improve feasibility, and allow the introduction of effective policy to encourage EV usage.
Four main components are considered for the analysis: acquisition cost (AC), operating cost (OCi), maintenance cost (MCi), and the selling revenue (SRi) from the sales of either electricity or fossil fuel, in different years i throughout its assumed n effective years. Time value of money is taken into consideration through discounting. The process converts the costs and benefits encountered at different points in time into the present time, by employing an appropriate discount interest rate that denotes the change in the value of money over a given time period. Given a discount interest rate r, the present value (PVi) of cost incurred in year i, with future value (FVi), can be presented as:
Total present values of all future and current costs associated with the stations can be encompassed in the cumulative present value (CPV):
2.2.1. Acquisition Cost
The acquisition cost (AC) consists of the cost of equipment, as well as installation costs, including labor, materials, permits, and taxes [39]. It is assumed that all acquisition costs are paid for through a lump sum direct payment without any borrowings, and are levied at the start of the project only. A lump sum payment frees the acquisition costs from the effect of varying interest rates.
2.2.2. Operation Cost
Operation costs (OCtotal) for electric charging and conventional fuel-filling stations differ. The cost associated with providing Level 3 DCFC during operation includes fuel cost, specifically the cost of electricity supplied to charge the EVs, and the usage monitoring and point of sale systems, which are additional equipment to measure the amount of energy used, charging time, number of events, and other important measures. Fuel cost for charging the EV in year is dependent on the number of EVs charged , their capacity , and the per unit electricity cost .
The amount of energy required for a one-time charge of the -capacity battery from and , with charger efficiency .
Common EV charging stations utilize a monitoring system. Given that is the cost of the monitoring system in year , then the discounted total operation cost of operating an electric charging station for EVs over its useful life is given by
On the other hand, the operation cost of a conventional fuel-filling station also consists of fuel cost, however, it comes from the purchase cost of fossil fuels bought, which are to be sold to its customers. As the conventional filling station in Brunei still primarily requires a labor force to fill the tank of the customer, labor cost is also included in our calculation. Similar to EVs, the fuel cost for filling ICEVs in year is dependent on the number of ICEVs served , their fuel capacity , and the per unit fuel cost , and is given by
For labor cost in year represented as , the discounted total operation cost of operating a conventional filling station for ICEVs over its useful life is given by
2.2.3. Maintenance Cost
Maintenance costs (MC) for both electric charging and conventional filling stations have been speculated in several studies. Given that represents the annual maintenance cost in year , the discounted total maintenance cost over the useful life of the stations is simply given by
2.2.4. Fuel Revenue
Revenue is generated from sales; sales of electricity in the case of electric charging station, and of fossil fuel in the case of the conventional fuel-filling station. For both conventional filling and electric charging stations, revenues are dependent on the number of vehicles ( or ), capacity of the vehicles ( or ), and selling price of the fuel. Given that the per unit selling prices of fossil fuel and electricity are and , respectively, the fuel revenue generated by the electric charging and conventional filling stations in year can be represented as and , respectively.
Subsequently, the discounted total revenue generated by both the electric charging and conventional filling stations is simply
2.2.5. Total Life Cycle Cost
Life cycle cost (LCC) of the stations is the total of the discounted values of the acquisition, operation, and maintenance, less the revenue generated from the sales of either electricity or fossil fuel. From a business perspective, it simply does not make sense to invest in a business venture with positive LCC values, as the investor would want some returns from their investment and effort. A lower LCC value indicates a more attractive business proposition. In the case of deciding whether to invest in establishing an electric charging station for EVs or a conventional filling station for ICEVs, an investor would aim for the one with the lower LCC value.
2.2.6. Payback Period
Other than LCC, the payback period (PP) can also be used to evaluate the feasibility and viability of implementing the electrical charging station. The payback period (PP) may be defined as the time required to recoup the initial investment of the station. This can be defined as the ratio of acquisition cost to net annual income composed of the total revenue generated less the operation and maintenance cost. A discounted payback period (DPP) can also be obtained by considering the discount interest rate. These are given by the following equations:
2.3. Sensitivity Analysis
Economic feasibility of the electrical charging station has been assessed and compared against the existing conventional filling station, by using LCCs. These values have been calculated based on assumptions, market knowledge, and projections. The electrical vehicle is a relatively new technology, and in Brunei, it has only made an appearance in expos and has not been sold locally. As such, the cost associated with an electrical charging station may be more speculative, and based on estimations from non-local market information which has implemented the electrical charging stations. Despite the presence of conventional filling stations, their operations and financial information are shrouded in relative secrecy, such that nobody can be 100% certain the estimations used in the LCC calculations are correct. This is natural in such a competitive market, due to possible competitive and financial implications of divulging this sensitive information. Market uncertainty due to supply and demand of raw materials and the technology itself, technological advancements, the existence of different competing manufacturers, government interventions, and others may cause some of these key input parameters to considerably vary, such that they affect the LCCs and other key financial parameters of the electrical charging and conventional filling stations.
Sensitivity analysis is commonly used to assess the effect of variations in key input parameters, on LCCs and other key financial parameters. It divulges important parameters that affect LCCs of electrical charging and conventional filling stations, which potential investors, manufacturers, and government agencies need to be wary of, to make the implementation of the technologies have greater chances of success.
Five (5) key important input parameters are included in sensitivity analysis: acquisition costs of both electrical charging and conventional filling stations, interest rate, and selling price of electricity and fossil fuel at the electrical charging and conventional filling stations, respectively.
Acquisition cost is the initial investment required for implementation, and is composed of equipment and installation costs. It is the only cost component in the LCC calculations that is not affected by variations in discount interest rate. As the EV is a new technology in Brunei, the acquisition cost is estimated based on reported acquisition costs in the US, which has been one of the countries at the forefront of the development and implementation of EV technology. Naturally, the acquisition costs reported were influenced by geographical and economical environments and determined by many factors, including taxation, labor costs, comparatively higher volume of sales, vicinity of the station to electrical connections, and locations. Although there is an abundance of conventional filling station, information on the acquisition cost associated with conventional filling stations is also limited and dependent on many factors. As such, sensitivity analysis on acquisition costs of both electrical charging and conventional filling stations would give important insights into the unavailability of complete data. Additionally, the effect of tax or subsidies on equipment may be analyzed by varying the acquisition cost, with subsidies commonly used to encourage usage and tax to penalize usage. All other cost and revenue components of the LCC, including operating and maintenance costs, as well as the revenue, are affected by the interest rate. A higher interest rate generally reduces the effect of future costs or revenues.
Finally, selling prices of both electricity and fossil fuel are also expected to affect LCCs. These analyses are particularly interesting, as both commodities are heavily controlled in Brunei in terms of buying price as well as selling price. This is due to the abundance of oil and natural gas in Brunei, with fossil fuel (gasoline) being a processed product of oil, and electricity being produced primarily from natural gas, allowing the government to heavily subsidize both commodities for its population. Of course, varying the selling price of fossil fuel at the conventional filling station would not directly affect the LCC of the electrical charging station, but being direct substitutes of one another, it will somehow determine the attractiveness of the electrical charging station. A higher selling price of fossil fuel would make the LCC of the conventional filling station lower, and hence, making the electrical charging station comparatively less attractive.
2.4. Projection on the Number of Electrical Charging Stations
In this paper, the number of electrical charging stations that are needed for Brunei to achieve its 60% electrification target of transportation is studied. This requires estimations of the number of vehicles by the year 2035 from historical trends in the number of vehicles. Given a replacement rate and total number of vehicles in year i, the total number of EVs in the year is given by
Taking the annual distance traveled and efficiency of the EV as and , respectively, the number of electrical charging stations required in year i is given by
where represents percentage usage or the proportion of the total EVs that are using the electrical charging stations for charging.
3. Results and Discussion
Methods given in the previous section have been used as the basis for analysis on the feasibility of EVs, specifically in determining the feasibility of providing charging infrastructure in Brunei, using local data obtained from the literature, technical notes, and reports from current service providers.
3.1. Data Requirement
The economic feasibility of establishing electric charging stations for EVs has been assessed by considering the LCC and comparing it against the LCC of conventional filling stations. Brunei dollars (B$) have been used and, where applicable, the prevailing currency conversion rates to US dollars (US$1: B$1.36) have been used. Currency fluctuations have been conveniently excluded from the analysis. A discount interest rate r is taken to be 5.5%, as per the stable historical local interest rate. Lifetime n of the project is taken to be 10 years. Important parameters used in the calculation are given in Table 1.
Like most countries around the world, Brunei still predominantly uses ICEVs as a means of transportation. In fact, the country has one of the highest ownership rates of private vehicles per capita. For the acquisition cost of conventional filling stations, US market data [45] have been used, which specify an average cost of a new gas station with four dispensers and associated petroleum equipment to be approximately USD 500,000. This amount has been proportioned for a single dispenser, to give an acquisition cost of BND 170,000. The annual maintenance cost is taken at BND 200 per annum [46]. As EV technologies are relatively new in Brunei and have not made it into the mainstream market, the acquisition and maintenance costs for the electric charging station have been taken from the U.S. Department of Energy [30]. The maintenance cost is taken to be BND 544 per annum, whilst three cases of acquisition cost have been considered [30]:
- Minimum acquisition cost of BND 19,040; composed of BND 7353 equipment and BND 5440 installation costs,
- average acquisition cost of BND 71,400; composed of BND 34,000 equipment and BND 37,400 installation costs, and
- maximum acquisition cost of BND 98,772; composed of BND 29,412 equipment and BND 69,360 installation costs.
The prices of both fossil fuel and electricity are heavily subsidized by the government. The per liter price of fuel is fixed at B$0.53/L. The buying price of electricity for commercial buildings in Brunei follows a tiered tariff system, ranging from an initial rate of B$0.20/kWh for the first 10 units to B$0.05/kWh for high-energy users. For this study, is set at B$0.05/kWh [40] as electrical charging stations are highly energy intensive businesses. The heavily regulated fossil fuel market specifies a profit margin of 10% for conventional fuel-filling stations, to give the cost price of one liter of fuel at B$0.477/L. The selling price is taken to be similar to the selling electricity price of domestic buildings at B$0.10/kWh [20] to ensure the electrical charging station is competitive. For comparison purposes, the profit margin of electricity charging stations is also fixed at 10%, to give a selling price of 1 kWh of electricity at B$0.22/kWh. Vehicles considered in this study are private use vehicles; the Mitsubishi i-MiEV for EVs, and Toyota Vios for ICEVs. Capacities for the i-MiEV and Vios are 16 kWh and 22 L, respectively [20]. State of charge (SOC) usage for LFP batteries is assumed to be 10–90% [47], with charging efficiency of 97% [40]. The number of vehicles charged up or filled up by either the electrical charging or conventional filling stations are estimated based on the common operating time of filling station, as well as the length of time required to fill up or charge the considered vehicles, approximately 30 vehicles per day in the case of electrical charging stations, and approximately 50 vehicles per day in the case of conventional filling stations. For the conventional filling station, this assumes 80% occupancy rate, a 12 h operating period per day, with 12 min per fill, including dwelling time [48]. On the other hand, a longer 18 h operating period and 30 min charging time per vehicle, with 80% occupancy rate, are assumed for the electrical charging station. The longer operating time is due to the fact that an automatic monitoring system is used. The operating cost of electric charging stations also includes the annual cost for the monitoring system, which gives access to the software and network system, which costs approximately BND 680 annually. On the other hand, as the conventional filling station is still labor intensive, a minimal labor cost of BND 6000 per annum is added to its operating cost.
3.2. Life Cycle Cost Analysis
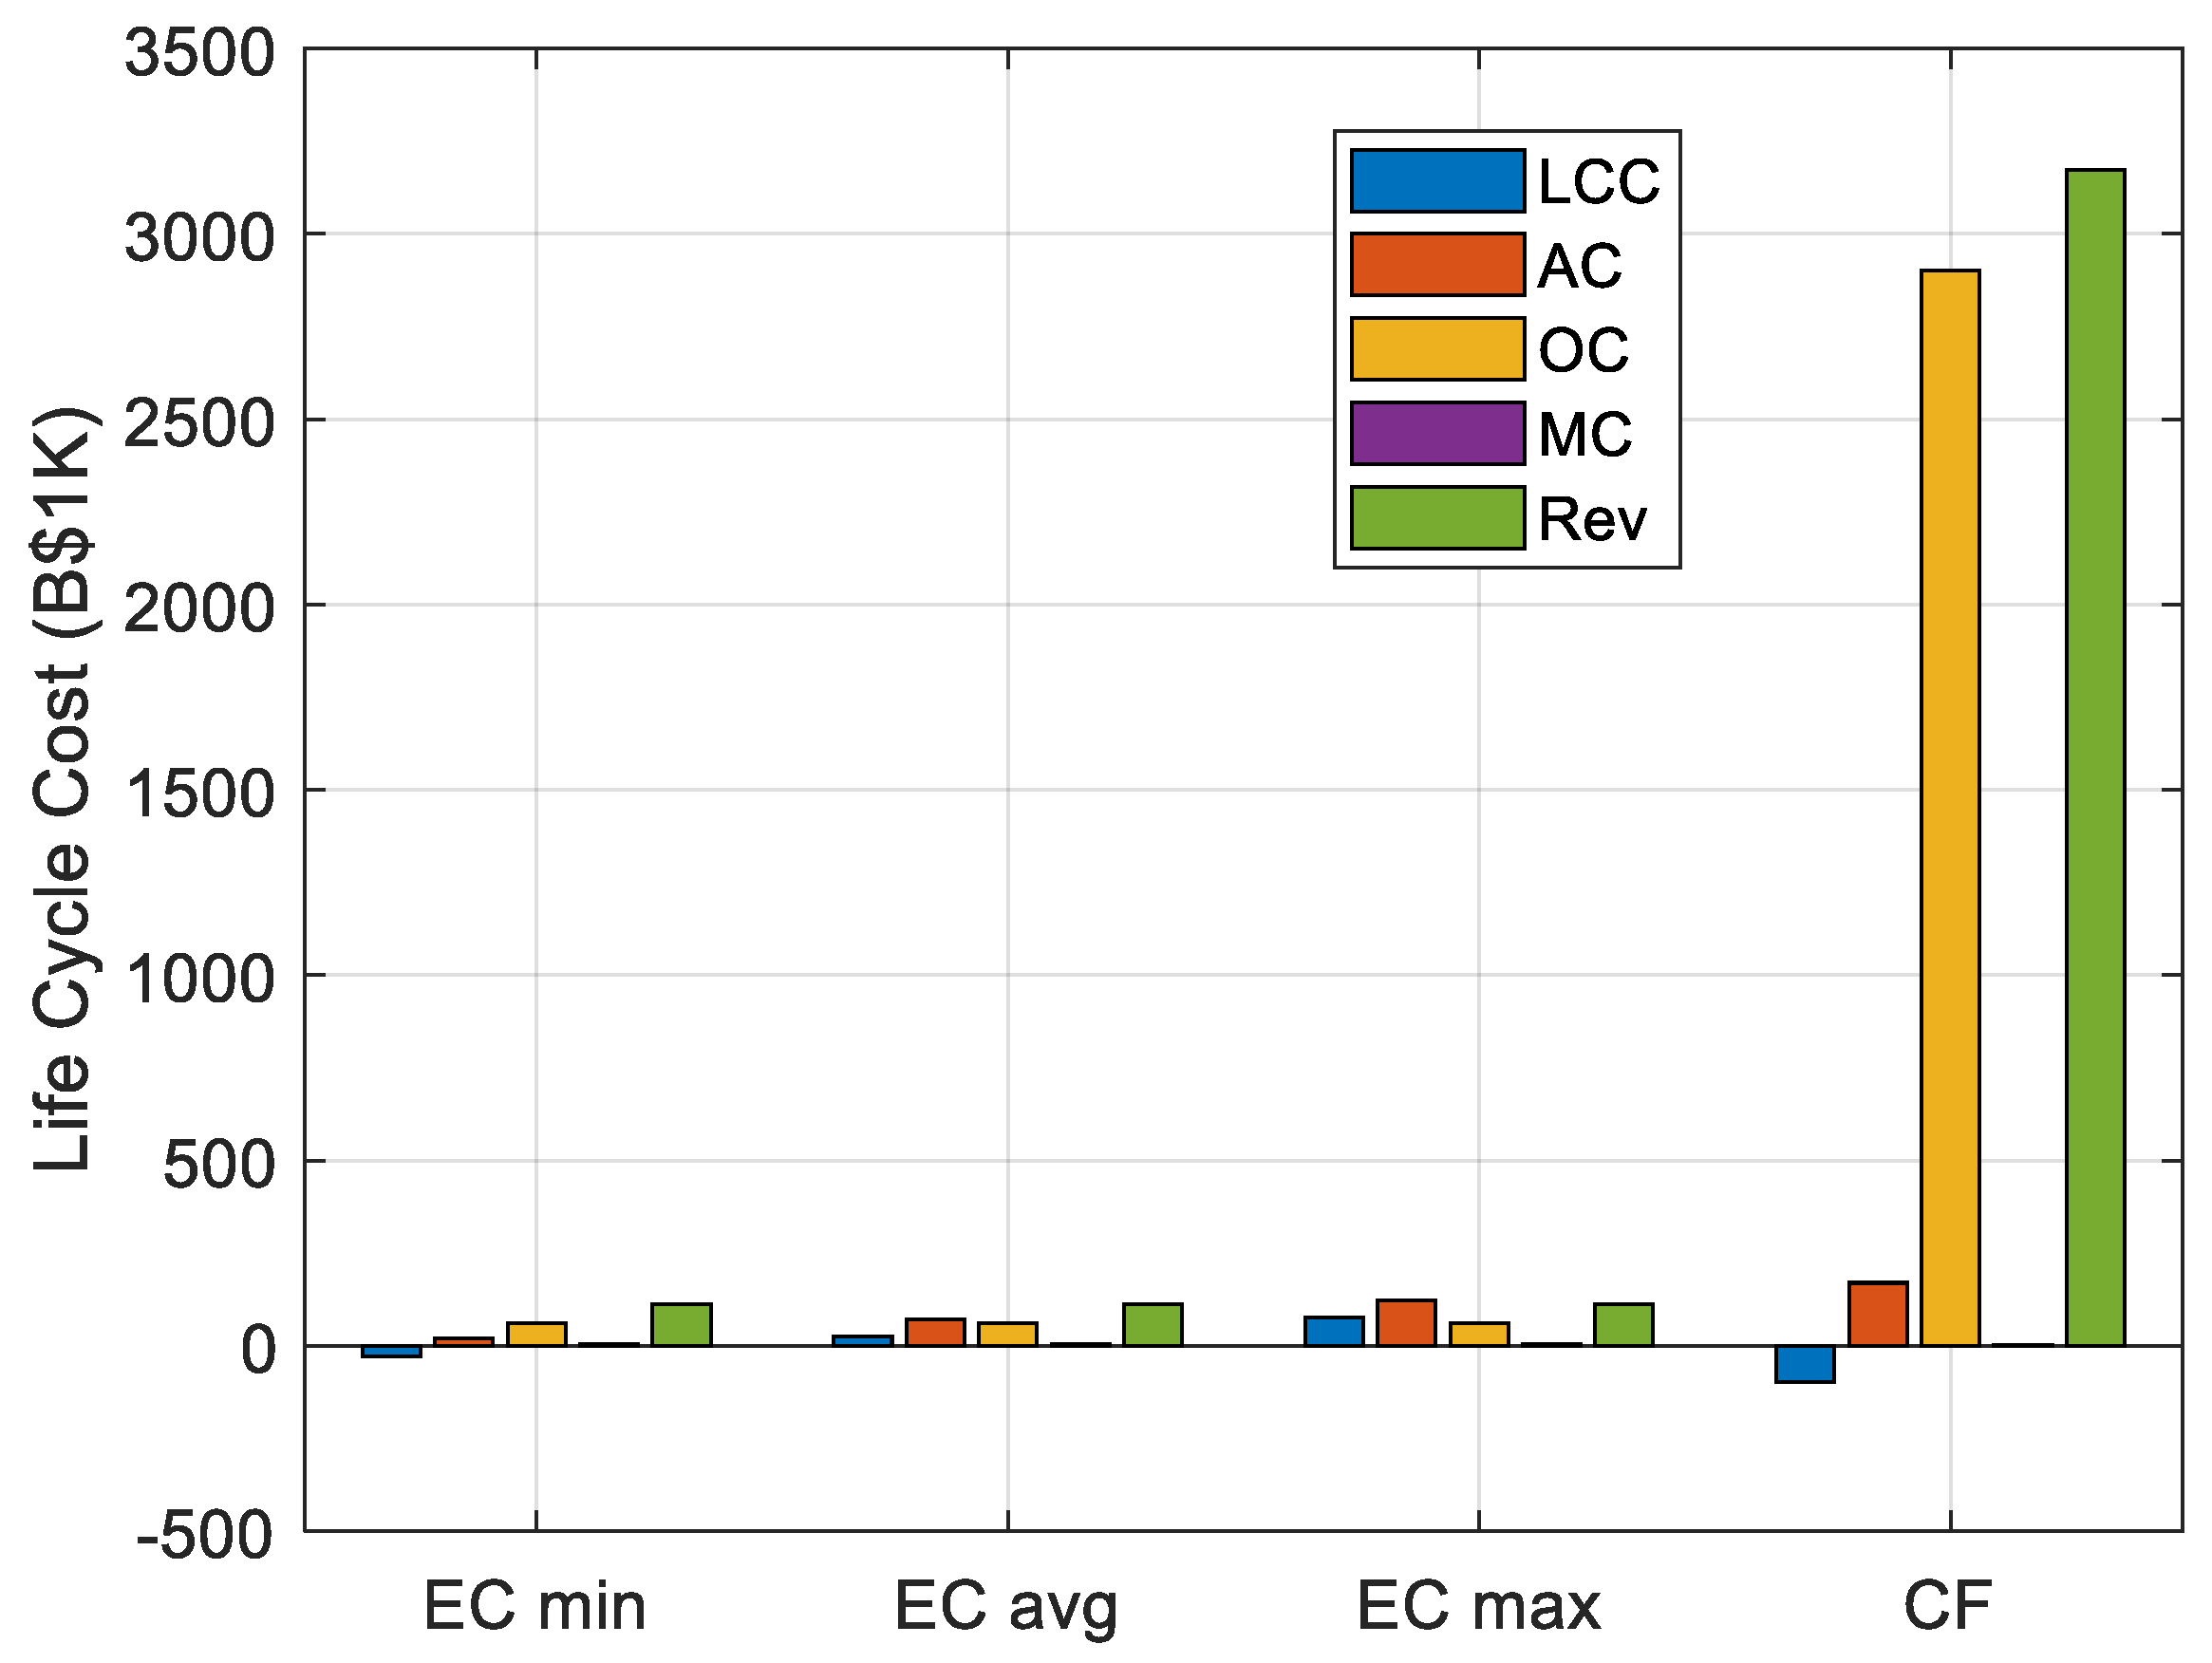
Life cycle cost calculations and comparisons between conventional filling and electrical charging stations, with minimum, average, and maximum acquisition costs, are given in Figure 1 and Table 2. It can be seen that the LCC of electric charging stations is only profitable over a 10 years lifetime with the minimum acquisition cost. However, it is less profitable than the LCC of a conventional filling station. The LCC is only (BND 27,968) for electrical charging stations with the minimum acquisition cost, as compared to a conventional filling station with an LCC of (BND 98,880).
The operating cost represents the biggest outflow for all cases. In the case of an electric charging station with the minimum acquisition cost, BND 61,729 or 72.7% of the total outflow comes from the operating cost, which is followed by the initial acquisition cost of BND 19,040. The maintenance is only BND 4100 during the lifetime of the project. In the case of a conventional filling station, the operating cost represents an even bigger proportion of total outflow, with 94.4% of the total cost. In real discounted terms, however, this equates to BND 2.9 M. This is followed by the initial acquisition cost of BND 170,000 (5.53%) and then a maintenance cost of only BND 1508 (0.05%).
Total revenue expected from the sales of fossil fuel is more than BND 3.17 M, as compared to the relatively meager amount of BND 112,838 from the sales of electricity from the electrical charging station. It is noted that with the minimum acquisition cost of BND 19,040 for the electrical charging station, discounted revenue of more than 5.9 times can be expected throughout the expected lifetime of the project, whilst for the conventional filling station, the amount is proportionately lower at 18.7 times the initial acquisition cost of BND 170,000. To put it simply, for a given fixed initial investment of BND X, the electrical charging station would give an expected revenue of 5.9 times the initial investment, in contrast to the 18.7 times the initial investment of a conventional filling station.
Payback periods for the electrical charging station with the minimum acquisition cost and the conventional filling station are 0.318 and 0.494 years, respectively. Taking into consideration the discounted amount, discounted payback periods are 0.405 and 0.632 years for the electrical charging station with the minimum acquisition cost and conventional filling station, respectively.
It can be seen that out of the three assumptions of acquisition costs, only an electrical charging station with the minimum acquisition cost makes economic sense, to give an overall negative LCC of (BND 27,968). Average and even worse maximum acquisition costs give positive LCCs of BND 24,392 and BND 76,752, respectively, and hence are economically infeasible. However, even an electrical charging station with the minimum acquisition cost gives a much lower negative LCC of (BND 27,968) as compared to that of a conventional filling station, with an LCC of (BND 98,880). However, taking the initial acquisition cost into consideration, the electrical charging station with the minimum acquisition cost of BND 19,040 gives an LCC which is −1.47 times the initial investment; this is much higher than the conventional filling station, which gives only −0.58 times the initial investment of BND 170,000. As such, for a given fixed initial investment of BND X, the electrical charging station gives a better proposition than the conventional filling station, in terms of LCCs. Additionally, the conventional filling station has a relatively high initial investment, which is a barrier to entry for a new company, thereby making the electrical charging station, which requires comparatively less investment, even more attractive. It is noted, however, that this is only true with the assumption of minimum acquisition cost.
3.3. Sensitivity Analysis
To investigate the effect of variations of different parameters, and hence feasibility of the electrical charging station to compete, sensitivity analysis has been performed. The key parameters chosen are acquisition costs (AC) of both electrical charging and conventional filling stations, interest rate, and per unit selling prices of electricity () and fossil fuel () at the electrical charging and conventional filling stations, respectively. These key parameters have been varied to analyze their effects on LCCs of both stations. Varying the acquisition cost of an electrical charging station and per unit selling price of electricity directly affects the LCC of the electrical charging station only. On the other hand, varying the acquisition cost of a conventional filling station and per unit selling price of fossil fuel directly affects the LCC of the conventional filling station only. Nevertheless, these changes affect the feasibility, as the two are direct substitutes of one another. Varying the interest rate affects both electrical charging and conventional filling stations.
Acquisition cost (AC) represents the initial investment, consisting of equipment and installation costs. As EV technology is very new in Brunei, currently, there are no local data available, but rather data from the U.S. Department of Energy [30] have been used as estimates of the acquisition cost of electrical charging stations. Minimum, average, and maximum acquisition costs have been used in the LCC calculation, with only minimum acquisitions giving a negative LCC value. For the sensitivity analysis, acquisition cost is varied around the minimum acquisition cost, with results given in Figure 2. It can be seen that an acquisition cost of approximately BND 47,050 represents the threshold whereby the electrical charging station would make economic sense, in terms of LCC. An acquisition cost of less than BND 47,050 would give a negative LCC value over its lifetime, with reducing the AC even lower making the electrical charging station more attractive. With zero acquisition cost, the LCC of the electrical charging station is approximately (BND 47,000), which is still comparatively higher than the LCC of the conventional filling station of (BND 98,880). A reduction in AC may result from a reduction in the equipment and installation cost from the manufacturers and contractors, or through subsidy by the government, to encourage the adoption of EV technology.
It is noted that the acquisition cost of an electrical charging station is much lower than the acquisition cost of a conventional filling station. Previous discussion has indicated that whilst an electrical charging station gives a better proposition in terms of the ratio of LCC against AC (−0.58 times for conventional filling stations, against −1.47 for electrical charging stations with minimum acquisition cost), a higher AC of the electrical charging station may tip the balance towards the conventional filling station. A higher AC is likely given that the AC of the electrical charging station ranges from the minimum of BND 19,040 to BND 123,760. The ratio of LCCs to acquisition costs of electrical charging and conventional filling stations, for different acquisition costs of the electrical charging station, is given in Figure 3. Generally, the lower the acquisition cost of the electrical charging station, the higher the negative ratio of LCC to AC. Lowering the acquisition cost to less than BND 29,725 gives a higher negative LCC/AC ratio for the electrical charging station as compared to the conventional filling station. To put it simply, for a given fixed initial investment of BND X, the electrical charging station would be a better proposition provided its acquisition cost is lower than BND 29,725.
Although the conventional filling station is already established in Brunei, and is locally abundant, the acquisition cost of a conventional filing station is difficult to obtain. Subsequently, sensitivity analysis was performed by varying the acquisition cost of the conventional filling station, as given in Figure 4. Increasing the acquisition cost results in an increase in LCC, with the acquisition cost having to increase to approximately BND 241 K to give an equivalent LCC to the LCC of an electrical charging station of (BND 27,968). This is equivalent to an approximately 52% increase in acquisition cost, from the initial amount of BND 170 K. However, an electrical charging station with the minimum acquisition cost gives a better proposition in terms of the ratio of LCC against AC; in other words, the electrical charging station would be a better proposition for a given fixed initial investment of BND X. It would be interesting to estimate the AC of a conventional filling station which would make it more attractive than an electrical charging station, in terms of return of initial investment. The ratio of LCCs to acquisition costs of electrical charging and conventional filling stations, for different acquisition costs of the conventional filling station, is given in Figure 5. Generally, the lower the acquisition cost of the conventional filling station, the lower the negative ratio of LCC to AC. Decreasing the acquisition cost to less than BND 109 K gives a higher negative LCC/AC ratio for the conventional filling station as compared to the electrical charging station, making the conventional filling station a better proposition for a given investment. This is a variation of approximately 36% from the original estimated acquisition cost.
The effect of variation in interest rate r on the life cycle costs are given in Figure 6, by assuming an identical initial investment of BND 170 K for both technologies. An initial investment of BND 170 K in the electrical charging station would give approximately 8.9 electrical charging stations, with a total LCC of (BND 357 K). The LCC of an electrical charging station is noticeably lower than that of the conventional filling station over the whole range of interest rates considered. It can be seen that, generally, the LCC increases with an increase in interest rate. A higher discounting interest rate reduces the effect of future expected costs as well as revenue, with no effect on the current initial acquisition cost. However, since revenue Ri is generally larger than operation OCi and maintenance MCi costs in year i, the LCC also subsequently increases, as can be seen from the figure. The electrical charging station is more sensitive to variations in interest rate due to its higher profit margin, composed of future revenue Ri and operation OCi and maintenance MCi costs, all of which are affected by interest rate.
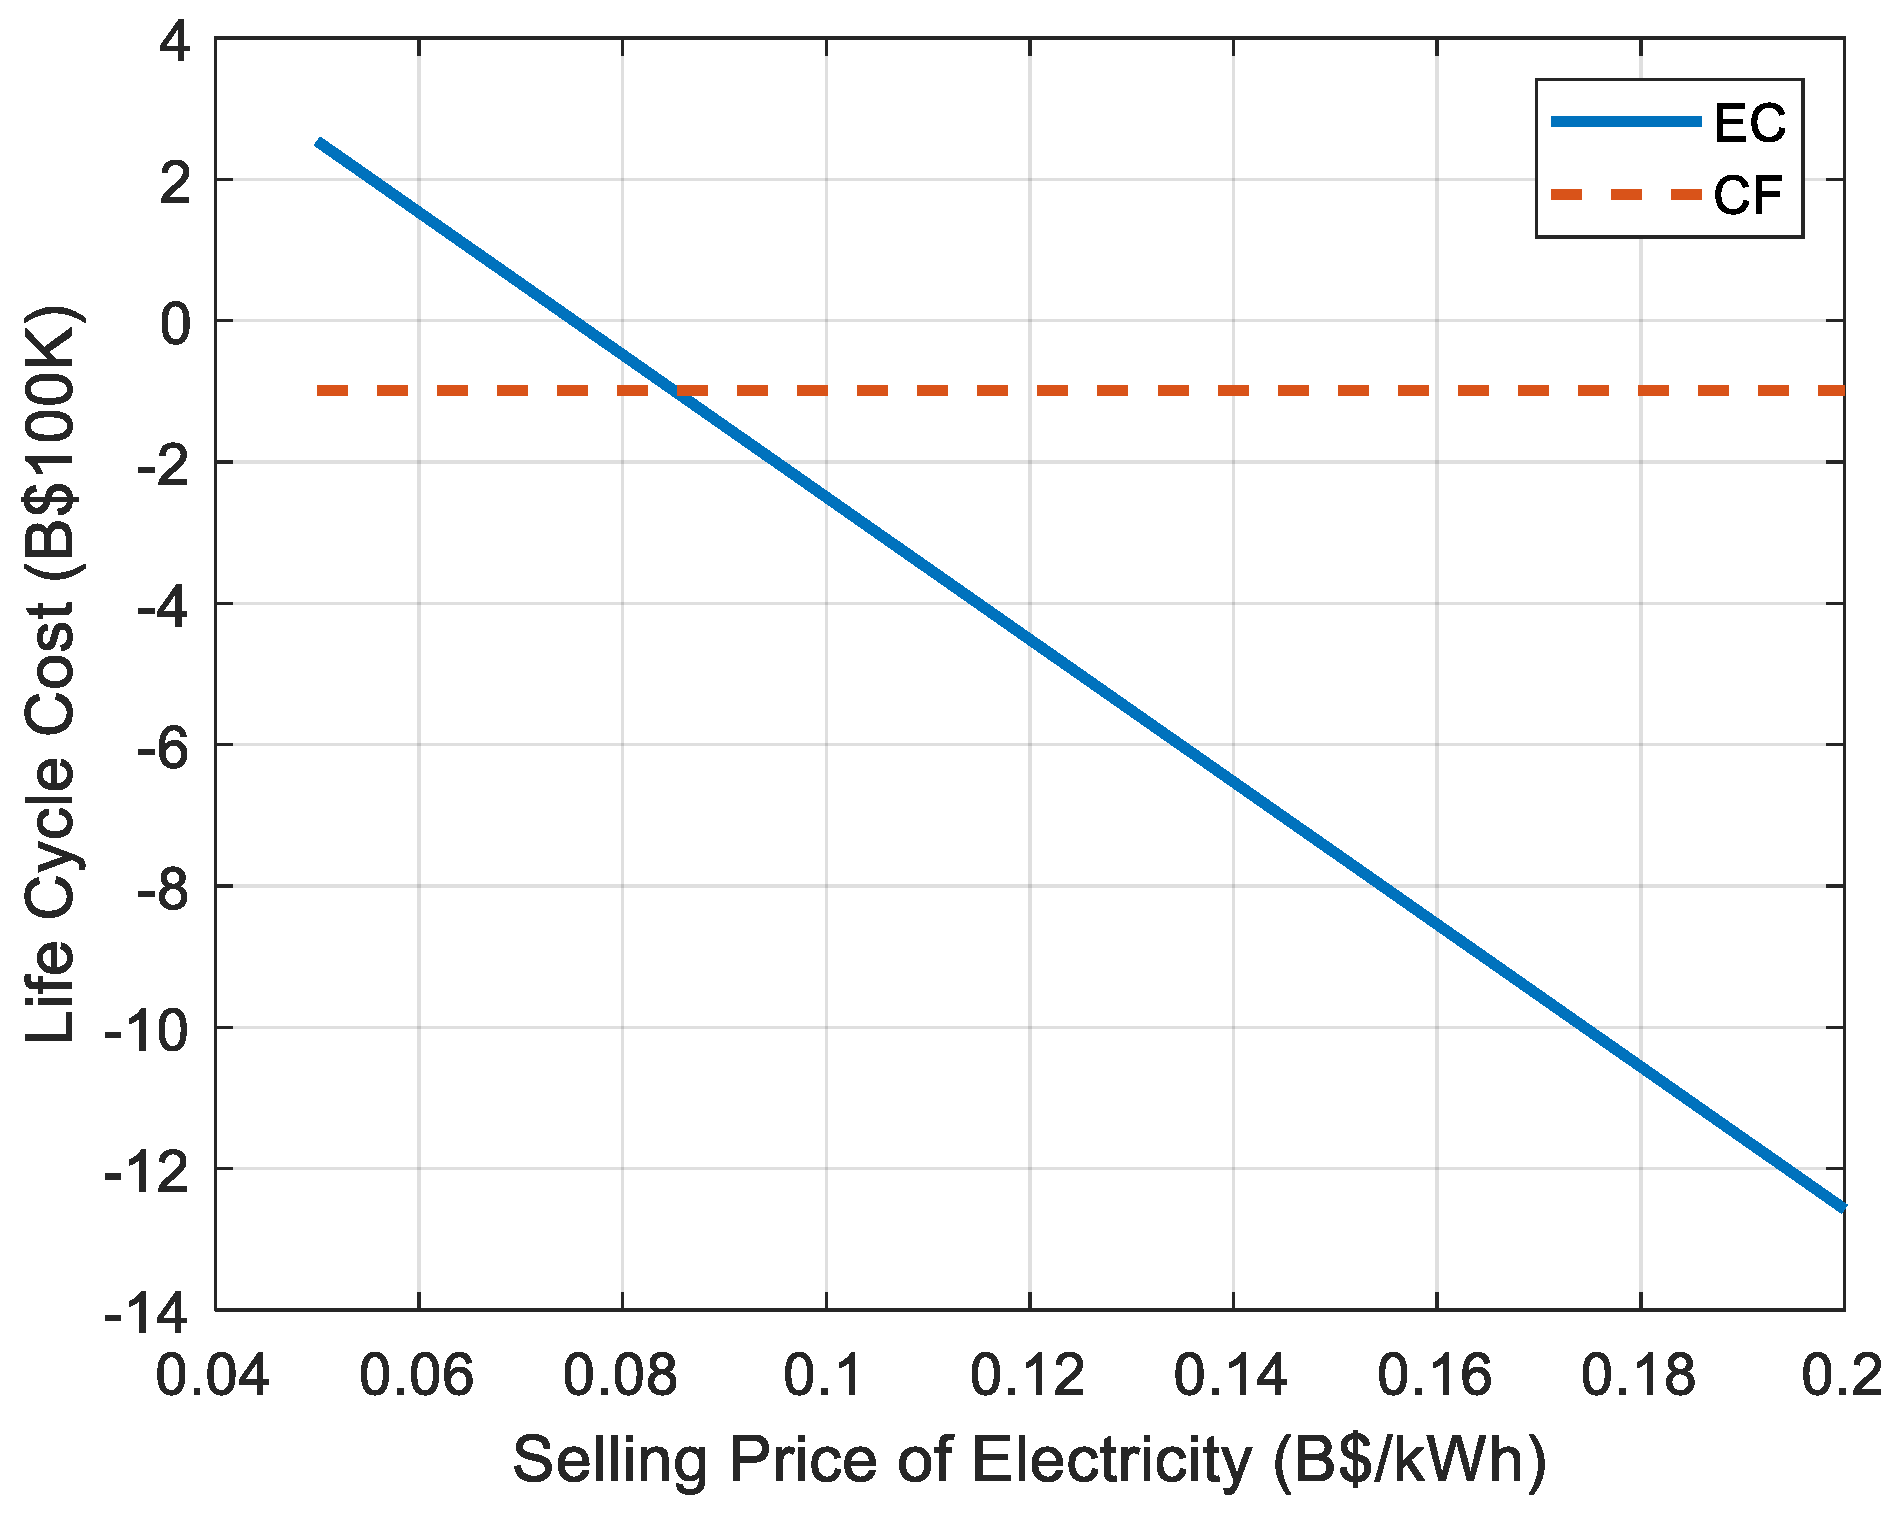
It is highlighted that the assumed selling price of fossil fuel is B$0.53/L, which is the current selling price at the existing filling stations. This price as well as the buying price of fossil fuel has been set by the government, with . The buying price of electricity is set at B$0.05/kWh, whilst the selling price is taken to be similar to the selling electricity price of domestic buildings at B$0.10/kWh [20]. This ensures that the use of the electrical charging station is attractive and comparable to home charging. The relationships between LCCs of the electrical charging and conventional filling stations, and the selling prices of electricity at the electrical charging station and fossil fuel at the conventional filling station, are given in Figure 7 and Figure 8, respectively. Similar to the above figures, an identical initial investment of BND 170 K for both technologies is assumed.
Increasing the selling price of electricity increases revenue and, subsequently, reduces the LCC of the electrical charging station, and vice versa, as can be seen in Figure 7. Decreasing the per unit selling price below B$0.085/kWh whilst keeping the per unit selling price of fossil fuel at B$0.53/L gives a higher LCC as compared to the LCC of the conventional filling station. Decreasing the per unit selling price even further to below B$0.075/kWh or 25% above the buying price would make investing in an electrical charging station not to have any financial sense as it has a positive LCC value. At B$0.10/kWh, which is the average price of electricity for domestic buildings, the LCC of an electrical charging station is (BND 27,968) per electrical charging station or (BND 249,716) by assuming an initial investment of BND 170 K. This is in comparison to the LCC of a conventional filling station of (BND 98,880). This is definitely good news for electrical charging stations, as the selling price of electricity can be varied between B$0.085/kWh and B$0.10/kWh, and it would still be more attractive than a conventional filling station as well as home charging.
From Figure 8, it can be seen that the LCC of a conventional filling station becomes higher as the selling price of fossil fuel is reduced. Although selling the fossil fuel at the current price of B$0.53/L favors an electrical charging station, increasing it by just B$0.025/L to B$0.555/L would switch the balance, and make the conventional filling station better. At B$0.555/L, the LCC of a conventional filling station is (BND 249 K), just above the LCC of an electrical charging station, by assuming an initial investment of BND 170 K.
As can be seen, acquisition costs of both electrical charging and conventional filling stations, and the selling price of electricity and fossil fuel, play important roles in the competitiveness of an electrical charging station. Analysis in the paper, thus far, has been based on a minimum acquisition cost for the electrical charging station. Figure 9 shows the life cycle cost comparison for the electrical charging station with an average acquisition cost of BND 71,400 as well as with 20% and 40% reductions in acquisition cost, against variation in the per unit electricity price. This is compared with the life cycle cost of a conventional filling station. An identical initial investment of BND 170 K is assumed for all cases. It can be seen that the selling price of electricity would need to be increased to B$0.16/kWh for the electrical charging station to compete with the conventional filling station. This represents a price increase of B$0.06/kWh over the assumed selling price of B$0.10/kWh. However, the selling price of electricity would only need to be increased to B$0.138/kWh and B$0.118/kWh with reductions of 20% and 40% of the acquisition cost of the electrical charging station, respectively.
Whilst the selling price of electricity at the electricity charging station needs to be maintained at B$0.10/kWh for it to be competitive against home charging, the government may intervene by providing subsidies on the selling price, in order to encourage the growth of the electrical charging stations. Additionally, the government may also provide a one-off subsidy to reduce the purchase cost of an electrical charging station, thereby reducing the running cost from the electric subsidy. For one-off 20% and 40% subsidies on the acquisition cost, subsidies of B$0.038/kWh and B$0.018/kWh are required for the electrical charging station to compete.
3.4. Number of Electrical Charging Stations Required
Analysis on the number electrical charging stations required, in order for Brunei to achieve its commitment to electrify its means of transportation to 60% electric vehicles [42] by the year 2035, is given in this section. Brunei has one of the highest numbers of private vehicles per capita in the region. The historical numbers of vehicles from 2009–2016 have been linearly interpolated and are shown in Figure 10, to give estimates on the number of vehicles in 2035. It has been estimated that the number of vehicles in the year 2035 will be 453,583 vehicles; more than 1.75 times the number of vehicles in the year 2016. The expected growth in population by the year 2035 is also shown in Figure 10 based on the historical data from 2009–2016, and the population is expected to grow slower due to the reduction in the number of children per family. The population is expected to reach 546,750 people by 2035. With the 2016 average of approximately 0.6 vehicles per capita, the number of vehicles is expected to be around 325,973 vehicles; lower than the interpolation based on the number of vehicles. However, in order to ensure that Brunei achieves its 60% transport electrification target and to err on the side of caution, the higher prediction of 453,583 vehicles is used. Additionally, the aging population of Brunei indicates an increase in the average number of vehicles per person.
At the moment, 99% of the vehicles are ICEVs, with 77% and 22.9% of the vehicles running on gasoline and diesel, respectively. Hybrid vehicles only account for the remaining 0.1% of total vehicles. To achieve its target, a linear replacement rate of its vehicles from ICEVs to EVs is assumed, with 60% of the vehicles being EVs by the year 2035. Table 3 estimates the number of electrical charging stations required between the year 2022 and 2035, with different assumptions on the percentage of EVs using the public electrical charging stations analyzed in this study. A 60% usage indicates 60% of the total EVs present at the time are using the public electrical charging stations, with the remainder relying on private Level 1 and Level 2 charging ports. It can be seen that the number of EVs increases exponentially, due to the natural increase in the number of vehicles over the years, as well as the increased replacement rate. In the year 2035, it is expected that 272,150 vehicles of the 453,583 vehicles on the road would be of the electric type. The numbers of public electrical charging stations required by the year 2035, to cater for the expected EVs on the road, are 1938, 2584, and 3230 electrical charging stations for 60%, 80%, and 100% expected usage of the public charging stations. This equates to an investment of BND 36.9 M, BND 49.2 M, and BND 61.5 M for acquiring and installing the electrical charging stations around the country between 2022 and 2035, assuming a minimum acquisition cost of BND 19,040. In discounted terms, the values of the acquisition costs over the 13 years are BND 25.6 M, BND 34.1 M, and BND 42.7 M.
4. Conclusions
A method of calculating and estimating LCC of a public electrical charging station for charging EVs has been presented in this paper, and has been used to analyze the economic feasibility of establishing stations by comparing them against conventional filling stations. The method has also been used to analyze the dominant component, which largely influences the feasibility of the electrical charging station.
Due to uncertainty in the acquisition cost of establishing an electrical charging station, which depends on many factors, including the type of chargers, locations, and availability of a suitable electrical connection for the charging station, minimum, average, and maximum charging acquisition costs have been assumed. As the EV is a relatively new technology in Brunei, these estimates of acquisition costs are at best rough ball-park figures, obtained from a more developed EV market, with a different market structure than the local context. LCCs of the electrical charging stations are (BND 27,968), BND 24,392, and BND 76,752, with minimum, average, and maximum acquisition costs, respectively, illustrating that with the assumptions, only an electrical charging station with the minimum acquisition cost would make economic sense. This LCC of (BND 27,968) for the electrical charging station with a minimum acquisition cost is far less attractive than that of a conventional filling station with an LCC of (BND 98,880). However, if ones look into the initial investment, the comparisons do not look so bleak; the electrical charging station with a minimum acquisition cost gives an LCC of −1.47 times the initial investment as compared to −0.58 times for the conventional filling station. In other words, for a given fixed initial investment of BND X, the electrical charging station is a much better proposition than the conventional filling station, returning 1.47 times the investment, whilst requiring comparatively less investment. This is only true, however, with a low acquisition cost.
Looking into the components of the LCCs, it can be seen that operating cost represents the majority of outflows, at 72.73%. This is lower compared to a conventional filling station with 94.4% of the outflow coming from its operating cost. This is very much expected due to government interventions, which control both the buying and selling prices of the commodities. The acquisition costs represent 22.43% and 5.53% of the outflows from the electrical charging station with a minimum acquisition cost and the conventional filling station, respectively.
Sensitivity analysis has also been performed by varying five parameters: acquisition costs of both electrical charging and conventional filling stations, interest rate, and selling prices of both electricity and fossil fuel. An acquisition cost of an electrical charging station of BND 29,725 represents the threshold beyond which the electrical charging station would become less attractive as compared to a conventional filling station. In terms of the acquisition cost of a conventional filling station, it needs to be more than BND 109 K to make the establishment of electrical charging stations more financially attractive. These reductions in acquisition cost of an electrical charging station or increase in acquisition cost of a conventional filling station can come in the form of an initial subsidy for the electrical charging station or a tax on the conventional filling station. Varying the selling prices of electricity and fossil fuel has also been shown to affect the competitiveness of an electrical charging station. At the current selling price of fossil fuel of B$0.53/L, and assumed selling price of electricity of B$0.10/kWh, an electrical charging station with a minimum acquisition cost remains attractive. However, reducing the price of electricity to B$0.075/kWh or increasing the price of fossil fuel to B$0.55/L would make electrical charging stations with the minimum acquisition cost comparably less attractive. This suggests sensitivity of the life cycle costs to minimal price changes in the two commodities.
These results indicate that the government needs to look into the introduction of multiple incentives, including subsidies to lower the acquisition cost of electrical charging stations, relaxing the control of the selling price of electricity, and taxation on conventional filling stations. Our result has shown that the government would only need to provide a running subsidy of the B$0.018/kWh on the cost of electricity, with an initial subsidy of 40% on the acquisition cost. On the investor’s side, efforts must be expended on finding a suitable site for the electrical charging station, such that acquisition cost, which includes equipment and installations costs, can be minimized. Finally, the manufacturers of equipment and contractors for the installation of electrical charging stations need to focus their efforts on reducing equipment and installation costs, to make it more affordable.
Additionally, the study has also provided estimates on the number of public electrical charging stations required for Brunei to be able to serve the expected EVs by the year 2035. It is expected that Brunei would have approximately 454 K vehicles on its roads by 2035, with 60% or approximately 273 K being EVs. This would require between 646 and 3300 electrical charging stations. Brunei needs to start a program to gradually put in the necessary infrastructure, in anticipation of the year 2035.
Based on the study, it can be concluded that the establishment of plentiful electrical charging stations, which are the backbone for the wide adoption of EVs in Brunei, has the potential to become a reality, with assistance from government agencies by providing different incentives. Economies of scale and skillful contractors may also help in making electrical charging stations more affordable. They are necessary for Brunei to be able to fulfill its commitments of 60% electrification of the transportation sector by 2035.
Author Contributions
Conceptualization, M.D. and P.E.A.; methodology, M.D. and P.E.A.; software, M.D. and P.E.A.; validation, F.A.A. and P.E.A.; formal analysis, M.D. and P.E.A.; investigation, M.D. and P.E.A.; resources, M.D. and P.E.A.; data curation, M.D. and P.E.A.; writing—original draft preparation, M.D. and P.E.A.; writing—review and editing, F.A.A. and P.E.A.; visualization, M.D., F.A.A., and P.E.A.; supervision, P.E.A.; project administration, P.E.A.; funding acquisition, P.E.A. All authors have read and agreed to the published version of the manuscript.
Funding
This work was supported by UBD Research Grant No: UBD/RSCH/1.3/FICBF(b)/2018/001.
Conflicts of Interest
The authors declare no conflict of interest. The funders had no role in the design of the study; in the collection, analyses, or interpretation of data; in the writing of the manuscript, or in the decision to publish the results.
References
- United Nations. World Population Prospects 2019: Ten Key Findings; UN: New York, NY, USA, 2019. [Google Scholar]
- United Nations. New Commitments at UN Energy Summit a Major Stride towards Affordable and Clean Energy, but Much Work Ahead to Halve Energy Access Gap by 2025. Available online: https://www.un.org/en/hlde-2021/page/new-commitments-un-energy-summit (accessed on 28 November 2021).
- Lowe, R.J.; Drummond, P. Solar, wind and logistic substitution in global energy supply to 2050—Barriers and implications, Renew. Sustain. Energy Rev. 2022, 153, 111720. [Google Scholar] [CrossRef]
- Mahlia, T.; Syazmi, Z.; Mofijur, M.; Abas, A.P.; Bilad, M.; Ong, H.C.; Silitonga, A. Patent landscape review on biodiesel production: Technology updates. Renew. Sustain. Energy Rev. 2020, 118, 109526. [Google Scholar] [CrossRef]
- Duggal, R.; Rayudu, R.; Hinkley, J.; Burnell, J.; Wieland, C.; Keim, M. A comprehensive review of energy extraction from low-temperature geothermal resources in hydrocarbon fields. Renew. Sustain. Energy Rev. 2021, 154, 111865. [Google Scholar] [CrossRef]
- Preethi, M.G.; Kumar, G.; Karthikeyan, O.P.; Varjani, S. Lignocellulosic biomass as an optimistic feedstock for the production of biofuels as valuable energy source: Techno-economic analysis, Environmental Impact Analysis, Breakthrough and Perspectives. Environ. Technol. Innov. 2021, 24, 102080. [Google Scholar] [CrossRef]
- Jung, S.; Shetti, N.P.; Reddy, K.R.; Nadagouda, M.N.; Park, Y.-K.; Aminabhavi, T.M.; Kwon, E.E. Synthesis of different biofuels from livestock waste materials and their potential as sustainable feedstocks—A review. Energy Convers. Manag. 2021, 236, 114038. [Google Scholar] [CrossRef]
- Mahlia, T.M.I.; Lim, J.Y.; Aditya, L.; Riayatsyah, T.; Abas, A.E.P. Methodology for implementing power plant efficiency standards for power generation: Potential emission reduction. Clean Technol. Environ. Policy 2017, 20, 309–327. [Google Scholar] [CrossRef] [Green Version]
- Abas, A.E.; Mahlia, T. Development of energy labels based on consumer perspective: Room air conditioners as a case study in Brunei Darussalam. Energy Rep. 2018, 4, 671–681. [Google Scholar] [CrossRef]
- Schleich, J.; Durand, A.; Brugger, H. How effective are EU minimum energy performance standards and energy labels for cold appliances? Energy Policy 2020, 149, 112069. [Google Scholar] [CrossRef]
- Galarraga, I.; Kallbekken, S.; Silvestri, A. Consumer purchases of energy-efficient cars: How different labelling schemes could affect consumer response to price changes. Energy Policy 2020, 137, 111181. [Google Scholar] [CrossRef]
- Azcuy, I.; Agatz, N.; Giesen, R. Designing integrated urban delivery systems using public transport. Transp. Res. Part E Logist. Transp. Rev. 2021, 156, 102525. [Google Scholar] [CrossRef]
- Li, Y.; Taghizadeh-Hesary, F. The economic feasibility of green hydrogen and fuel cell electric vehicles for road transport in China. Energy Policy 2021, 160, 112703. [Google Scholar] [CrossRef]
- Verma, S.; Mishra, S.; Gaur, A.; Chowdhury, S.; Mohapatra, S.; Dwivedi, G.; Verma, P. A comprehensive review on energy storage in hybrid electric vehicle. J. Traffic Transp. Eng. Engl. Ed. 2021, 8, 621–637. [Google Scholar] [CrossRef]
- AlHajri, I.; Ahmadian, A.; Elkamel, A. Techno-economic-environmental assessment of an integrated electricity and gas network in the presence of electric and hydrogen vehicles: A mixed-integer linear programming approach. J. Clean. Prod. 2021, 319, 128578. [Google Scholar] [CrossRef]
- Fan, L.; Tu, Z.; Chan, S.H. Recent development of hydrogen and fuel cell technologies: A review. Energy Rep. 2021, 7, 8421–8446. [Google Scholar] [CrossRef]
- Chan, C.C. The Rise & Fall of Electric Vehicles in 1828–1930: Lessons Learned; IEEE: Piscataway, NJ, USA, 2013. [Google Scholar]
- Yan, S. The economic and environmental impacts of tax incentives for battery electric vehicles in Europe. Energy Policy 2018, 123, 53–63. [Google Scholar] [CrossRef]
- Kara, S.; Li, W.; Sadjiva, N. Life Cycle Cost Analysis of Electrical Vehicles in Australia. Procedia CIRP 2017, 61, 767–772. [Google Scholar] [CrossRef]
- Abas, A.E.P.; Yong, J.; Mahlia, T.M.I.; Hannan, M.A. Techno-Economic Analysis and Environmental Impact of Electric Vehicle. IEEE Access 2019, 7, 98565–98578. [Google Scholar] [CrossRef]
- Onat, N.C.; Kucukvar, M.; Aboushaqrah, N.N.; Jabbar, R. How sustainable is electric mobility? A comprehensive sustainability assessment approach for the case of Qatar. Appl. Energy 2019, 250, 461–477. [Google Scholar] [CrossRef]
- Palmer, K.; Tate, J.E.; Wadud, Z.; Nellthorp, J. Total cost of ownership and market share for hybrid and electric vehicles in the UK, US and Japan. Appl. Energy 2018, 209, 108–119. [Google Scholar] [CrossRef]
- Mitropoulos, L.K.; Prevedouros, P.D.; Kopelias, P. Total cost of ownership and externalities of conventional, hybrid and electric vehicle. Transp. Res. Procedia 2017, 24, 267–274. [Google Scholar] [CrossRef]
- Breetz, H.; Salon, D. Do electric vehicles need subsidies? Ownership costs for conventional, hybrid, and electric vehicles in 14 U.S. cities. Energy Policy 2018, 120, 238–249. [Google Scholar] [CrossRef]
- Parker, N.; Breetz, H.L.; Salon, D.; Conway, M.W.; Williams, J.; Patterson, M. Who saves money buying electric vehicles? Heterogeneity in total cost of ownership. Transp. Res. Part D Transp. Environ. 2021, 96, 102893. [Google Scholar] [CrossRef]
- Hall, D.; Lutsey, N. Emerging Best Pratices for Electric Vehicle Charging Infrastructure; ICCT White Paper; The International Council on Clean Transportation: Washington, DC, USA, 2017. [Google Scholar]
- Sierzchula, W.; Bakker, S.; Maat, K.; Van Wee, B. The influence of financial incentives and other socio-economic factors on electric vehicle adoption. Energy Policy 2014, 68, 183–194. [Google Scholar] [CrossRef]
- Harrison, G.; Thiel, C. An exploratory policy analysis of electric vehicle sales competition and sensitivity to infrastructure in Europe. Technol. Forecast. Soc. Chang. 2017, 114, 165–178. [Google Scholar] [CrossRef]
- Ministry of Industry and Information Technology, Medium- and Long-Term Development Plan for the Auto Industry. Available online: http://www.miit.gov.cn/n1146290/n4388791/c5600433/content.html (accessed on 1 April 2021).
- Smith, M.; Castellano, J. Costs Associated with Non-Residential Electric Vehicle Supply Equipment; US Department of Energy: Washington, DC, USA, 2015.
- Van den Bossche, P. Electric Vehicle Charging Infrastructure. Electr. Hybrid Veh. 2010, 20, 517–543. [Google Scholar]
- Global EV Outlook 2016 Electric Vehicles Initiative; International EV Outlook Report; International Energy Agency: Paris, Fraance, 2016; Available online: https://www.interregeurope.eu/fileadmin/user_upload/tx_tevprojects/library/Global_EV_Outlook_2016.pdf (accessed on 6 December 2021).
- Vazifeh, M.M.; Zhang, H.; Santi, P.; Ratti, C. Optimizing the deployment of electric vehicle charging stations using pervasive mobility data. Transp. Res. Part A Policy Pract. 2019, 121, 75–91. [Google Scholar] [CrossRef] [Green Version]
- Cai, H.; Jia, X.; Chiu, A.S.F.; Hu, X.; Xu, M. Siting public electric vehicle charging stations in Beijing using big-data informed travel patterns of the taxi fleet. Transp. Res. Part D Transp. Environ. 2014, 33, 39–46. [Google Scholar] [CrossRef] [Green Version]
- Ji, W.; Nicholas, M.; Tal, G. Electric vehicle fast charger planning for metropolitan planning organizations: Adapting to changing markets and vehicle technology. Transp. Res. Rec. 2015, 1, 134–143. [Google Scholar] [CrossRef]
- Hall, D.; Lutsey, N. Literature Review on Power Utility Best Practices Regarding Electric Vehicles; ICCT White Paper; The International Council on Clean Transportation: Washington, DC, USA, 2017. [Google Scholar]
- Huang, X.; Chen, J.; Yang, H.; Cao, Y.; Guan, W.; Huang, B. Economic planning approach for electric vehicle charging stations integrating traffic and power grid constraints. IET Gener. Transm. Distrib. 2018, 12, 3925–3934. [Google Scholar] [CrossRef]
- Raustad, R. Cost Analysis of Workplace Charging for Electric Vehicles; Electrical Vehicle Transportation Centre: Washington, DC, USA, 2016; p. 17. [Google Scholar]
- Nicholas, M. Estimating electric vehicle charging infrastructure costs across major U.S. metropolitan areas. Int. Counc. Clean Transp. 2019, 14, 11. [Google Scholar]
- Yusof, N.; Abas, P.; Mahlia, T.; Hannan, M. Techno-Economic Analysis and Environmental Impact of Electric Buses. World Electr. Veh. J. 2021, 12, 31. [Google Scholar] [CrossRef]
- Asia-Pacific Economic Cooperation. Peer Review on Energy Report for the APEC Energy Working Group; APEC: Singapore, 2013; Available online: https://www.apec.org/docs/default-source/Groups/EWG/PREE_Guidelines.pdf (accessed on 6 December 2021).
- Brunei Darussalam National Council on Climate Change. Brunei Darussalam National Climate Change Policy (BNCCP). 2020. Available online: https://www.climate-laws.org/geographies/brunei-darussalam/policies/brunei-darussalam-national-climate-change-policy-2020 (accessed on 6 December 2021).
- Danial, M. Life-Cycle Cost Analysis of Electric Vehicle Infrastructure in Brunei; Internal Report; University Brunei Darussala: Bandar Seri Begawan, Brunei, 2020. [Google Scholar]
- Abas, P.E.; Mahlia, T. Techno-Economic and Sensitivity Analysis of Rainwater Harvesting System as Alternative Water Source. Sustainability 2019, 11, 2365. [Google Scholar] [CrossRef] [Green Version]
- Tank, C. CommTank Website. Available online: https://www.commtank.com/tank-articles/ (accessed on 6 December 2021).
- Savsar, M. Analysis and Scheduling of Maintenance Operations for a Chain of Gas Stations. J. Ind. Eng. 2013, 2013, 1–7. [Google Scholar] [CrossRef]
- LiFePO4-Lithium Iron Phosphate Technical Specification. Available online: https://power.tenergy.com/battery-packs/lifep04-packs/ (accessed on 6 December 2021).
- Voelcker, J. Gas, Electricity, Hydrogen: How Many Cars Can ‘Fuel’ and What Will It Cost, Green Car Reports. 2015. Available online: https://www.greencarreports.com/news/1099548_gas-electricity-hydrogen-how-many-cars-can-fuel-and-what-will-it-cost (accessed on 6 December 2021).
Figure 1.
Breakdown of life cycle cost of electrical charging stations with minimum, average, and maximum acquisition costs, as well as those of conventional filling stations.
Figure 1.
Breakdown of life cycle cost of electrical charging stations with minimum, average, and maximum acquisition costs, as well as those of conventional filling stations.

Figure 2.
Effect of changing the acquisition cost of the electrical charging station on its LCC, as compared to the LCC of the conventional filling station.
Figure 2.
Effect of changing the acquisition cost of the electrical charging station on its LCC, as compared to the LCC of the conventional filling station.

Figure 3.
Effect of changing the acquisition cost of the electrical charging station on the ratio of LCC to AC.
Figure 3.
Effect of changing the acquisition cost of the electrical charging station on the ratio of LCC to AC.

Figure 4.
Effect of changing the acquisition cost of the conventional filling station on its LCC, as compared to the LCC of the electrical charging station.
Figure 4.
Effect of changing the acquisition cost of the conventional filling station on its LCC, as compared to the LCC of the electrical charging station.

Figure 5.
Effect of changing the acquisition cost of the conventional filling station on the ratio of LCC to AC.
Figure 5.
Effect of changing the acquisition cost of the conventional filling station on the ratio of LCC to AC.

Figure 6.
Effect of changing the interest rate on LCCs of both electrical charging and conventional filling stations.
Figure 6.
Effect of changing the interest rate on LCCs of both electrical charging and conventional filling stations.

Figure 7.
Effect of changing the selling price of electricity on the LCCs of the electrical charging and conventional filling stations.
Figure 7.
Effect of changing the selling price of electricity on the LCCs of the electrical charging and conventional filling stations.

Figure 8.
Effect of changing the selling price of fossil fuel on the LCCs of the electrical charging and conventional filling stations.
Figure 8.
Effect of changing the selling price of fossil fuel on the LCCs of the electrical charging and conventional filling stations.

Figure 9.
Effect of changing the selling price of fossil fuel on the LCCs of the electrical charging and conventional filling stations, with subsidies on acquisition cost.
Figure 9.
Effect of changing the selling price of fossil fuel on the LCCs of the electrical charging and conventional filling stations, with subsidies on acquisition cost.

Figure 10.
Expected number of vehicles in Brunei Darussalam in the year 2035.


Table 1.
Important parameters used for the life cycle cost analysis.
| Input Data | Electric Charging Station | Conventional Filling Station | |||
|---|---|---|---|---|---|
| Technology Type | EV | ICEV | |||
| Lifetime, n (years) | 10 | ||||
| Acquisition Cost | min | Avg | max | ||
| (US$) | $14,000 | $52,500 | $91,000 | $125,000 | |
| (B$) | $19,040 | $71,400 | $123,760 | $170,000 | |
| No. of Vehicles Served per Day ( or ) | 38 | 50 | |||
| Engine Capacity, or | (kWh) | 16 kWh | - | ||
| (L) | - | 42 L | |||
| Energy Cost, or | (B$/kWh) | $0.05/kWh | - | ||
| (B$/L) | - | $0.477/L | |||
| Monitoring System, MSi | (US$/yr) | $500 | - | ||
| (B$/yr) | $680 | - | |||
| Labor Cost | (B$/yr) | - | $6000 | ||
| Annual Maintenance Cost, MCi | (US$/yr) | $400 | |||
| (B$/yr) | $544 | $200 | |||
| Profit Margin | (%) | 100% | 10% | ||
| Selling Price or | (B$/kWh) | $0.10/kWh | - | ||
| (B$/L) | - | $0.53/L | |||
| Charging Efficiency [40] | (%) | 97% | - | ||
| EV Efficiency | (kWh/km) | 0.185 | - | ||
| Average Distance Traveled, | (km) | 14,235 | 14,235 | ||
Table 2.
Life cycle cost of electrical charging against conventional filling stations.
| Electrical Charging Station | Conventional Filling Station | ||||
|---|---|---|---|---|---|
| Min | Avg | Max | |||
| Life Cycle Cost— | (B$) | ($27,968) | $24,392 | $76,752 | ($98,880) |
| Acquisition Cost— | (B$) | $19,040 | $71,400 | $123,760 | $170,000 |
| Operating Cost— | (B$) | $61,729 | $2,902,035 | ||
| Maintenance Cost— | (B$) | $4100 | $1508 | ||
| Revenue— | (B$) | $112,838 | $3,172,421 | ||
| Payback Period—PP | yr | 0.318 yrs | 1.190 yrs | 2.062 yrs | 0.494 yrs |
| Discounted Payback Period—DPP | yr | 0.405 yrs | 1.519 yrs | 2.633 yrs | 0.632 yrs |
Table 3.
Estimates on the number of electrical charging stations required.
| Year | Rep. Rate (%) | Electrical Vehicles | Elect. Charging Station Req. for Different Usage | ||||
|---|---|---|---|---|---|---|---|
| 20% | 40% | 60% | 80% | 100% | |||
| 2022 | 4.29 | 13,579 | 32 | 64 | 97 | 129 | 161 |
| 2023 | 8.57 | 28,060 | 67 | 133 | 200 | 266 | 333 |
| 2024 | 12.86 | 43,442 | 103 | 206 | 309 | 412 | 516 |
| 2025 | 17.14 | 59,726 | 142 | 284 | 425 | 567 | 709 |
| 2026 | 21.43 | 76,911 | 183 | 365 | 548 | 730 | 913 |
| 2027 | 25.71 | 94,998 | 225 | 451 | 676 | 902 | 1127 |
| 2028 | 30.00 | 113,986 | 271 | 541 | 812 | 1082 | 1353 |
| 2029 | 34.29 | 133,876 | 318 | 635 | 953 | 1271 | 1589 |
| 2030 | 38.57 | 154,668 | 367 | 734 | 1101 | 1468 | 1835 |
| 2031 | 42.86 | 176,361 | 419 | 837 | 1256 | 1674 | 2093 |
| 2032 | 47.14 | 198,956 | 472 | 944 | 1417 | 1889 | 2361 |
| 2033 | 51.43 | 222,452 | 528 | 1056 | 1584 | 2112 | 2640 |
| 2034 | 55.71 | 246,850 | 586 | 1172 | 1758 | 2343 | 2929 |
| 2035 | 60.00 | 272,150 | 646 | 1292 | 1938 | 2584 | 3230 |
Publisher’s Note: MDPI stays neutral with regard to jurisdictional claims in published maps and institutional affiliations. |
© 2021 by the authors. Licensee MDPI, Basel, Switzerland. This article is an open access article distributed under the terms and conditions of the Creative Commons Attribution (CC BY) license (https://creativecommons.org/licenses/by/4.0/).
Share and Cite
MDPI and ACS Style
Danial, M.; Azis, F.A.; Abas, P.E. Techno-Economic Analysis and Feasibility Studies of Electric Vehicle Charging Station. World Electr. Veh. J. 2021, 12, 264. https://0-doi-org.brum.beds.ac.uk/10.3390/wevj12040264
AMA Style
Danial M, Azis FA, Abas PE. Techno-Economic Analysis and Feasibility Studies of Electric Vehicle Charging Station. World Electric Vehicle Journal. 2021; 12(4):264. https://0-doi-org.brum.beds.ac.uk/10.3390/wevj12040264
Chicago/Turabian StyleDanial, Muhammad, Fatin Amanina Azis, and Pg Emeroylariffion Abas. 2021. "Techno-Economic Analysis and Feasibility Studies of Electric Vehicle Charging Station" World Electric Vehicle Journal 12, no. 4: 264. https://0-doi-org.brum.beds.ac.uk/10.3390/wevj12040264