Article

Configuration of Electric Vehicles for Specific Applications from a Holistic Perspective

School of Engineering and Science, Tecnologico de Monterrey, Monterrey 64849, Mexico
*
Author to whom correspondence should be addressed.
World Electr. Veh. J. 2022, 13(2), 29; https://0-doi-org.brum.beds.ac.uk/10.3390/wevj13020029
Submission received: 12 December 2021 / Revised: 23 January 2022 / Accepted: 26 January 2022 / Published: 28 January 2022
(This article belongs to the Special Issue Fuel Consumption and Emissions from Vehicles)

Abstract

:
Electrification of heavy-duty vehicles (HDVs) used for passengers and goods transportation is a key strategy to reduce the high levels of air pollution in large urban centers. However, the high investment cost of the commercially available electrified HDVs has limited their adoption. We hypothesized that there are applications where the operation with tailored electrified HDVs results in a lower total cost of ownership and lower well-to-wheel emissions of air pollutants, with higher acceleration capacity and energy efficiency than the fossil-fueled counterparts. The road transportation services running on fixed routes with short span distances (<50 km), such as the last mile cargo distribution and the passenger shuttle services, is a clear example with a high possibility of cost reduction through tailored electric HDVs. In this work, we present a methodology to define the most appropriate configuration of the powertrain of an electric vehicle for any given application. As a case study, this work aimed to define an electric powertrain configuration tailored for a university shuttle service application. A multi-objective weighted-sum optimization was performed to define the best geometrical gearbox ratios, energy management strategy, size of the motor, and batteries required. Based on three different driving profiles and five battery technologies, the results showed that, based on a 50 km autonomy, the obtained powertrain configuration satisfies the current vehicle operation with a reduced cost in every driving profile and battery technology compared. Furthermore, by using lithium-based batteries, the vehicle’s acceleration capacity is improved by 33% while reducing energy consumption by 37%, CO2 emissions by 31%, and the total cost of ownership by 29% when compared to the current diesel-fueled buses.

1. Introduction

By 2019, more than 90% of the world’s population was living in places where the World Health Organization (WHO) air quality guidelines levels were not met, which was estimated to cause 7 million premature deaths worldwide per year [1,2]. Because road transport is known to be the largest pollutant emitter in urban centers, the use of electric vehicles has been a growing alternative to improve air quality in urban centers and help the transition to smart cities [3]. This technology has evolved remarkably in recent decades, reducing vehicles’ purchase cost and total cost of ownership (TCO) every year [4]. Over 7.2 million electric vehicles were sold globally by 2019 [5,6]. However, the electrification feasibility of road vehicles widely depends on the vehicle segment considered.
L. Franckx (2019) [7] determined that for every segment established in COPERT (small for <1.4 L engines, medium for 1.4 to 2.0 L engines, and big for >2.0 L engines), the electric vehicle purchase cost is higher, being ~62%, ~52% and ~74% for small, medium and big vehicles’ segments, respectively. However, in the same study, it was identified that the TCOs for small and medium electric vehicles and their fossil-fueled counterparts are almost on par, whereas for big electric vehicles, the TCO is still around 30% higher than that of their diesel alternative. As a result, between 2019 and 2020 there was a 43% increment in the sales of light-duty electric vehicles, but for heavy-duty electric vehicles, there was no evident incremental behavior [5]. Furthermore, the production and operation of electric buses are still uncertain, and mostly limited to China, where about 95% of the electric buses registered in 2019 were produced and sold, and where most of them (98%) operate [5]. The high investment cost and low autonomy of heavy-duty electric vehicles have limited worldwide vehicle electrification to the light-duty segment only.
Several studies have been carried out to improve the feasibility of implementing electric buses. These include evaluation of different Energy Storage Systems [8,9,10], battery sizing and charging infrastructure [11,12], operational features [13,14], range extenders [15], and powertrain configurations [16,17,18,19,20]. Within the latter strategy, the configuration of electric vehicles is mainly defined by the electric motor, battery, and transmission (if present). Other elements complement the powertrain, such as the motor controller and voltage converter, but do not define its configuration [15].
When optimizing powertrain configurations, most studies consider vehicles with transmission based on the rear-wheel-drive topology that major car manufacturers have standardized [21]. Generally, these studies have been carried out to optimize single elements of the powertrain by considering either individual element simulations or a total vehicle simulation environment under type-approval driving cycles. Considering individual element simulations, a multi-objective optimization with either the weighted-sum-method [22,23] or with a Pareto front [20,24] is a common technique focused on the layout (design parameters included) of a gearbox for electric vehicles. As an example, Hofstetter et al. (2018) obtained, using a Pareto-front gearbox optimization, relative differences of ±20% from the reference gearbox cost depending on the selected tradeoffs that decision makers consider appropriate (in terms of efficiency, package integration, and overall costs) [20].
Based on a total vehicle simulation environment, other studies have considered a holistic approach to the optimization process where gearing parameters are considered omitting the influences of the bearing selection, finding highly relevant results with significantly less effort. Optimizing the transmission ratio to reduce the energy consumption of vehicles is a clear example of this [19,25]. Schiffer et al. (2017) obtained differences in fuel consumption in diesel-fueled vehicles of 2.0%, 3.2%, and 0.9% for HDDC, NEDC, and WLTP driving cycles, respectively, by modifying the transmission ratios [25]. Similarly, Puma-Benavides et al. (2021) obtained energy savings of between 3% and 8% for electric vehicles in NEDC, WLTC-2, and WLTC-3 test cycles by modifying the final ratio of the differential [19]. Total vehicle simulators, such as ADVISOR and FASTSim, have also been used to compare powertrains and estimate the impact of different setups on vehicle efficiency, performance, cost, and battery life [26,27,28]. Verbruggen et al. (2020) compared the effect of switching from a single motor and a single-gear transmission to a continuously variable transmission (CVT), obtaining a reduction in energy consumption in the order of 1% to 10% and a motor size reduction of between 20% to 50% [29].
All these studies are aimed at general-purpose vehicles with long autonomy as a direct replacement of their current fossil-fueled counterpart. However, results are highly sensitive to the operational context and energy demand profile considered [30].
We propose a different approach. This consists of tailoring the powertrain of the electric vehicle for the specific application for which it will predominantly work. We intuited that the operation of those niches with electric heavy-duty vehicles (HDV) is economically feasible under the current development of electric vehicle technology.
For example, there are applications in the industry of passenger transportation or cargo distribution for HDV where the vehicles run on fixed routes with a relatively small length (<50 km), such as the last mile cargo distribution and the passenger shuttle services to work locations or schools. The current commercially available electric vehicles used for these applications were designed to replace the fossil-fueled counterpart. This means a general-purpose powertrain with an autonomy of over 250 km and certified energy consumption of ~300 Wh/km (driver only with standardized driving cycles) [31] or real-world energy consumption of ~450 Wh/km [32] (driver only). However, the average round trip of people commuting to work is generally lower than 50 km, being 23 miles (~37 km) in the UK, 32 miles (~51 km) in the US, and 40 km in Australia, to quote a few examples [33,34,35].
We hypothesized that downsizing the electric powertrain to match the needs of the specific application, along with an energy management strategy based on recharging or replacing empty batteries every time the vehicle completes a route, will reduce the investment and operative costs. The production of this small autonomy tailored electric HDV is feasible in several countries such as Mexico, which have the car manufacturing industry and capacities to undertake such endeavors. Currently, Mexico is the 6th largest manufacturer and the 4th largest exporter of HDVs. Furthermore, in this country, there are several initiatives under development toward the manufacturing of electric light-duty vehicles (class 1-2, USEPA Emission Classification) and medium-duty vehicles (class 3-4) [36].
Thus, the objective of this manuscript is to describe a holistic methodology based on a multi-objective optimization to define the powertrain configuration (motor, battery, and gearbox) and the energy management strategy for electric vehicles that satisfy the current diesel-based vehicle operation while minimizing TCO and CO2 emissions, and maximizing energy efficiency, acceleration capacity, and top speed. A step-by-step description of the methodology is presented, considering a university shuttle service as the case study. Although the methodology is presented for a specific case study, it can be applied to any case where diesel vehicles are being replaced by an electrified version. In this multi-objective optimization methodology, we highlight the use of different scenarios of real driving patterns.
In addition to the methodology, the contribution to new knowledge reported in this paper is related to the demonstration that, under the current state of the technology, the operation with electric HDVs can be made economically attractive by tailoring the powertrain configuration of the electric vehicle to the specific application where it will predominantly work, along with an adequate energy management strategy.

2. Material and Methods

The methodology to define the powertrain configuration (motor, battery, and gearbox) and energy management strategy for electric vehicles that satisfy the current diesel-based vehicle operation while minimizing TCO and CO2 emissions, and maximizing energy efficiency, acceleration capacity, and top speed, is divided into 3 phases:
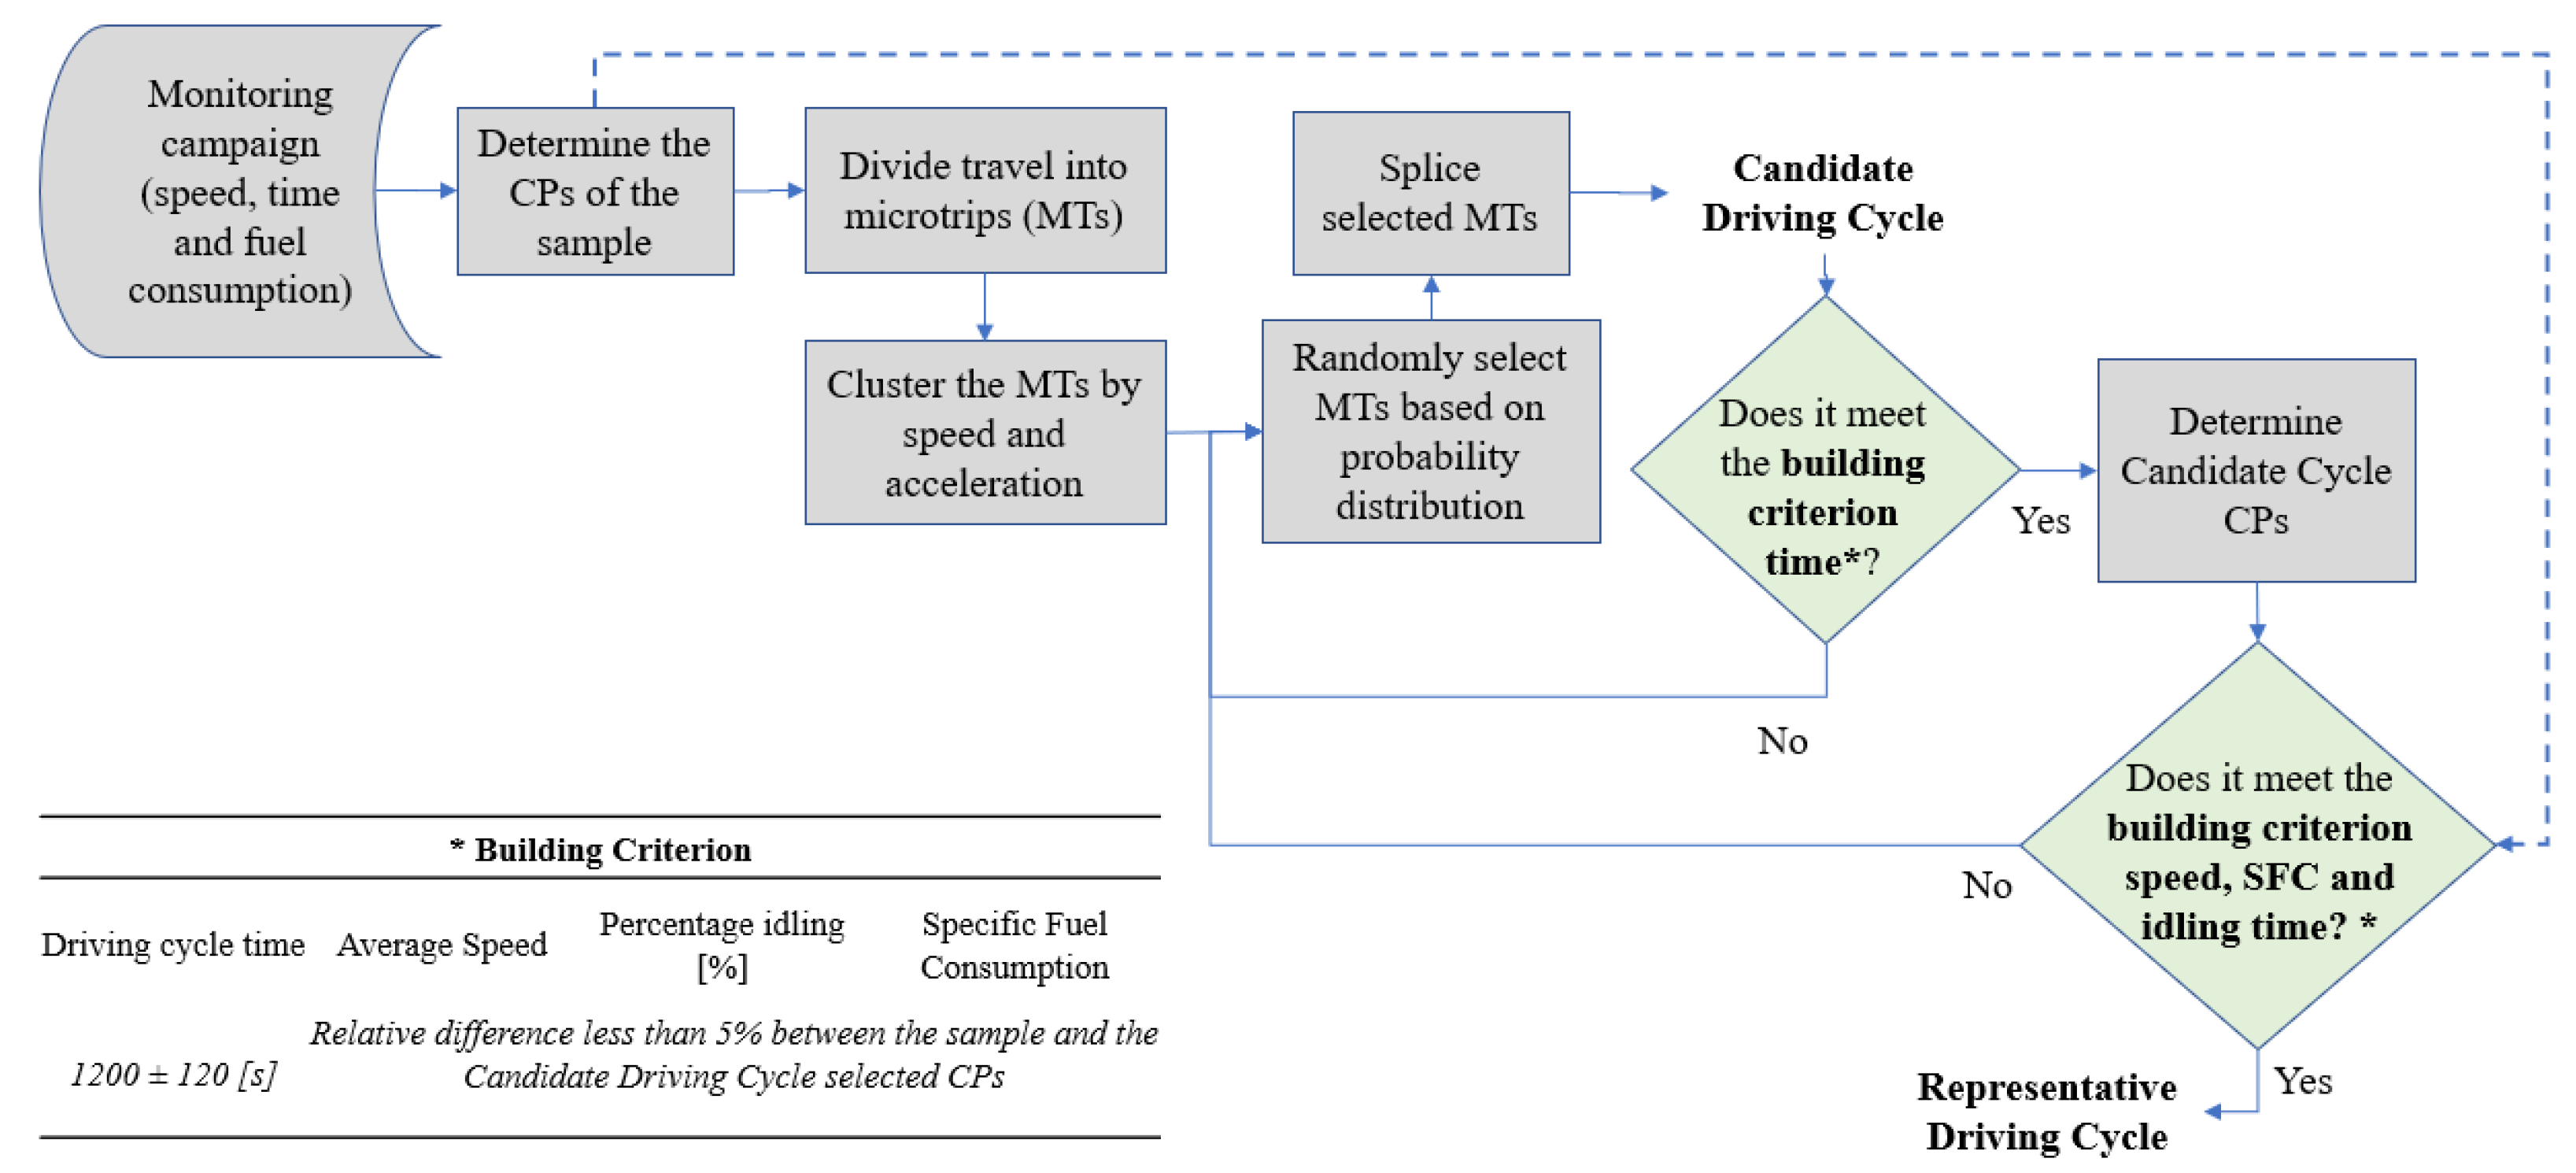
  • Phase 1: For the given application, monitor the current operation of the fossil-fueled vehicles for a long period to determine their real driving patterns and operational conditions.
  • Phase 2: Use the collected data to construct a representative real-world driving cycle.
  • Phase 3: Use a multi-objective optimization and an iterative energy-based approach to determine the best electric vehicle’s powertrain configuration (number of batteries, motor size, and gearbox transmission ratio) for the given application.
Next, each phase is explained in detail through an illustrative case study.

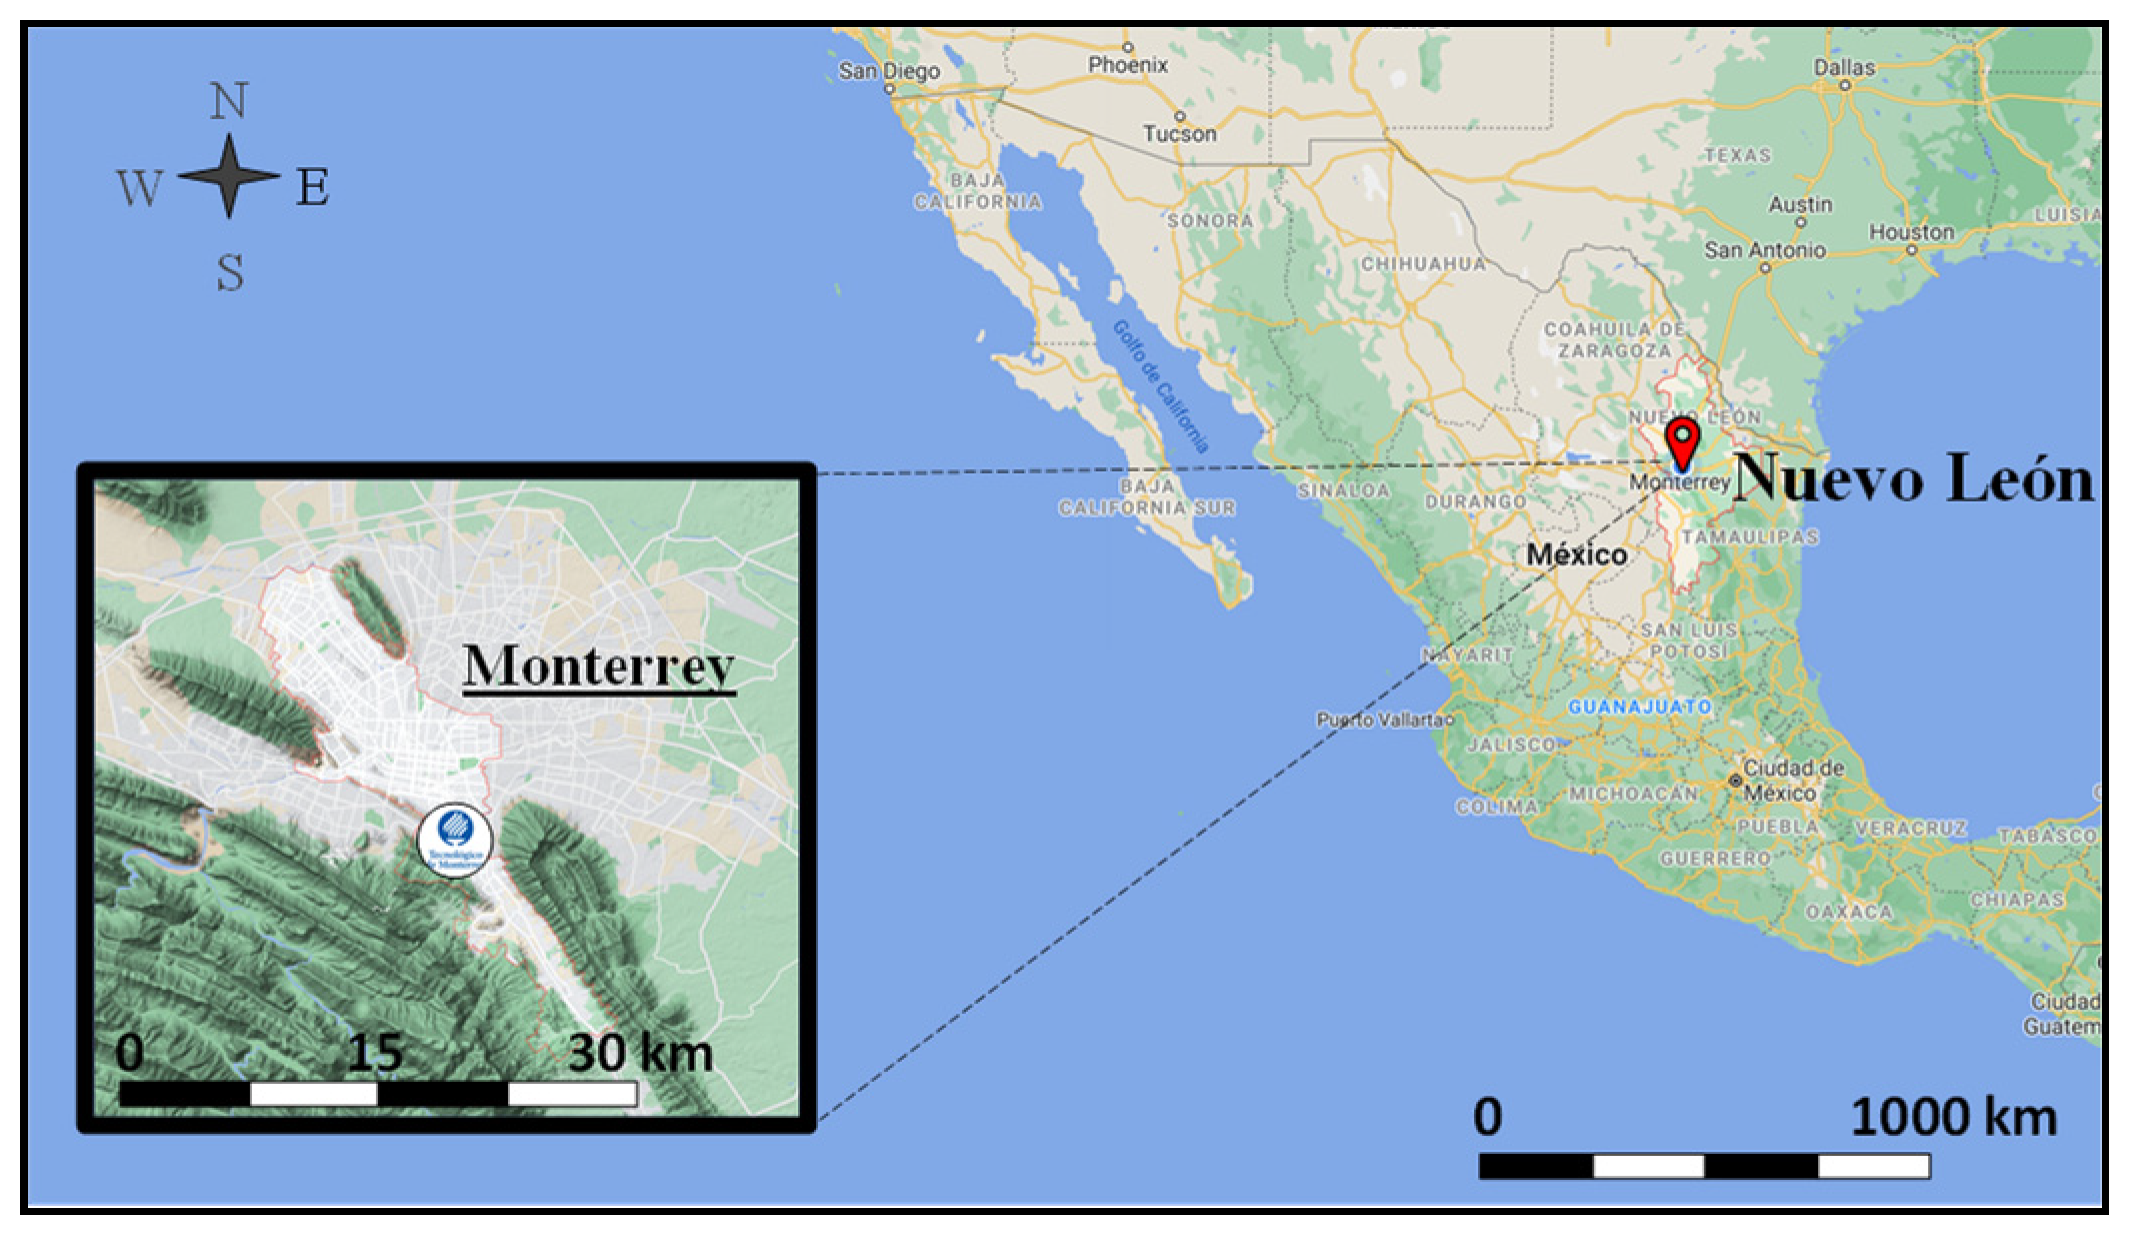
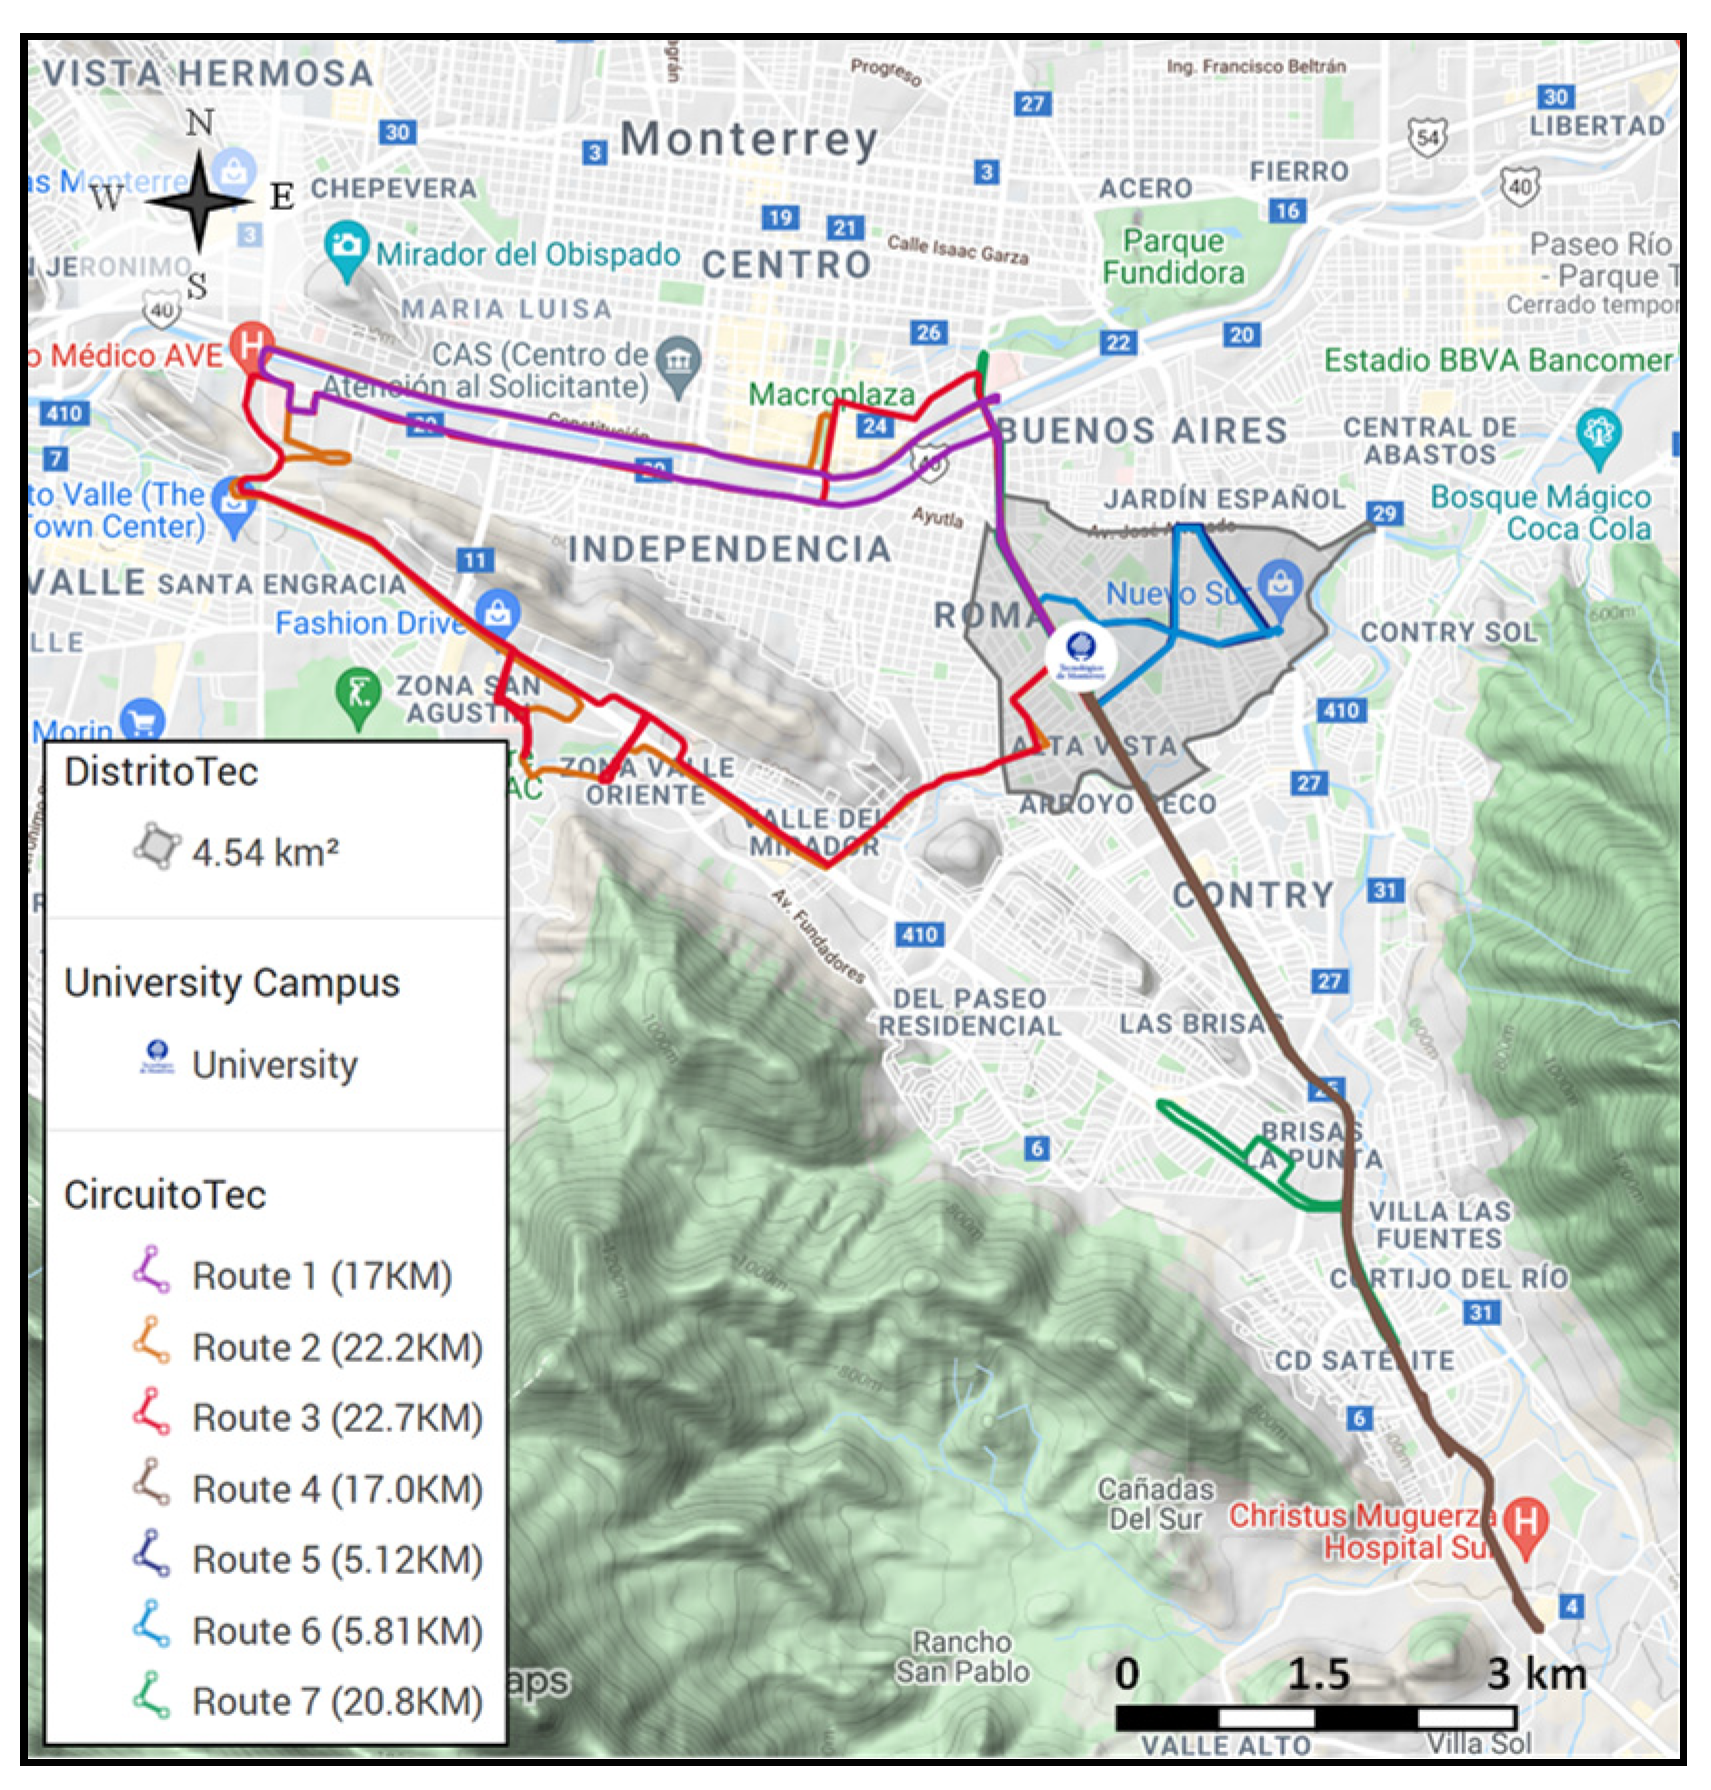
2.1. Phase 1: Current Operation of the Case Study

As an illustrative case study, this work focused on the existing university shuttle service of Tecnológico de Monterrey, which is one of the most important universities in Latin America (top 5 in QS ranking). The main campus is in the city of Monterrey, northeast Mexico, near the south border of the US (Figure 1). The university provides a free transportation service for students and staff around DistritoTec, which is the region composed of the university campus and 24 surrounding neighborhoods, with over 26,371 inhabitants and 11,206 households.
The shuttle service, which is known as CircuitoTec, operates with Class 2b HDV (Gross Vehicle Weight Rating between 3856 and 4536 kg, USEPA Emission Classification). These are diesel-fueled buses with a capacity of 18 passengers (driver included). The technical characteristics of the buses are detailed in Table 1. CircuitoTec is composed of seven fixed routes, of which the longest route covers 22.7 km on near flat roads (Figure 2). Each bus has a 5–30 min stop between consecutive trips. For the longest route, the distance traveled per year of these vehicles is approximately 64,896 km.
This work proposes the gradual replacement of these buses by an electrified version. As the first step, the normal operation of the buses that currently cover the previously described routes was monitored. An On-Board Diagnostic (OBD) interface was used (based on an ELM327 chipset), which was connected to the vehicle’s Electronic Central Unit (ECU) to obtain, per second, their speed, fuel consumption, torque, and engine speed, following the procedure described by Huertas et al. [20]. Additional sensors were used to record their geo-localization.
Of the seven routes detailed in Figure 2, three of them are duplicated but are operated in the opposite direction in a different work shift, resulting in only four fixed routes [37]. Therefore, the four buses that work simultaneously in CircuitoTec were instrumented and monitored (per second) during different monitoring campaigns carried out between 2017 and 2018. The amount of time the vehicle must be monitored to obtain a representative driving cycle of its operation is still not well defined in the literature. Ideally, vehicles should be monitored for about one year of operation to capture seasonal effects. However, that scope is not affordable, and in practice, the representativeness debate indicates that, the longer the monitoring campaign, the more representative it is. We observed in the literature that monitoring campaigns using Portable Emissions Measurement Systems (PEMS) generally last a single day due to their high cost of usage. For monitoring campaigns using high-precision GPS, we observed higher periods, but these are still within a week. Monitoring campaigns using telematics and OBD devices last about 3 months.
Then, data quality analysis was developed where data considered atypical or physically impossible were discarded. Microtrips (a sequence of a speed profile between two successive stops within a trip), where for any reason more than 5% of the data were lost, were also discarded. Ultimately, 31 trips, 725 microtrips, and 68,353 valid data records were kept between all routes (7+ trips and 170+ microtrips per route). Approximately 50% of the data records were discarded.
Next, the collected data were used to determine the driving pattern of the drivers that operate in the routes of CircuitoTec using diesel-fueled HDVs. In this work, we described their driving pattern using 14 characteristic parameters (CPs), which, as stated by several authors [38,39], implicitly describe the driving patterns that drivers follow in a region of interest. CPs are metrics based on any derivation of speed and time data, such as average speed, average positive acceleration, and idling time.

2.2. Phase 2: Driving Cycle

After obtaining the OBD database of the valid trips carried out by the drivers that operate in the CircuitoTec shuttle service and the 14 CPs that describe the driving pattern of the drivers, the construction of the representative driving cycle continued.
A driving cycle is a time series of speeds that represents how vehicles are being driven in a specific region or application. At the same time, it allows determination of the energy demanded by forces external to the vehicles. Aiming to build the driving cycle in CircuitoTec, the methodology detailed in [40] was followed. This method, named by the authors as the Energy-Based Micro-Trip (EBMT) method, constructs driving cycles that represent local driving patterns and reproduce the actual energy consumption of vehicles in the region of interest.
Figure 3 illustrates this methodology. Initially, and as stated before, 14 CPs that describe the driving pattern of the drivers are obtained based on the entire database (CP). Among the 14 CPs, the mean speed, mean fuel consumption, and mean percentage of idling time is used as comparative values in a later step. Then, each trip (time series of speed) is divided into microtrips, which are segments where the initial and final speeds are equal to zero, along with an idling condition at the end of the segment. These microtrips are clustered according to their mean speed and acceleration. Then, a collection of microtrips is selected randomly from each cluster according to the frequency distribution of the clusters until they form a candidate driving cycle with a pre-established duration (1200 s ± 10%). The representativeness of the obtained candidate driving cycle is then evaluated by comparing its characteristic parameters (CP*) with the corresponding characteristic parameters that describe the driving pattern of the drivers previously obtained (CP). When the relative differences in fuel consumption, mean speed, and idling time between the candidate driving cycle and the driving pattern are smaller than 5%, the criterion of representativeness is achieved, and the candidate driving cycle becomes the representative driving cycle of the drivers. The process is repeated 1000 times, and the representative driving cycle with the smallest relative difference between all the 14 CPs is reported as the most representative driving cycle of the drivers.
Aiming to define a tailored powertrain for a specific application, we considered the best (ecofriendly/gentle) and worst (aggressive) scenarios of driving conditions, in addition to the typical (normal) scenario, which is the scenario generally considered in the literature when defining the driving patterns and constructing driving cycles. Although the typical scenario considers all data gathered within the measurement campaign, the other two scenarios (best and worst) were obtained by considering only the trips with an average SFC below the 10th and above the 90th percentiles of all the data gathered for the best and worst scenarios, respectively. The use of the 90th percentile as a criterion to determine if a driver is within rational driving patterns was previously used by some authors [41,42]. As a result, three different representative driving cycles were constructed, which from this point on will be referred to as low SFC, typical SFC, and high SFC scenarios. This step is important due to the possibility of resulting in lower autonomies than needed if a driver exhibits an atypical driving pattern.

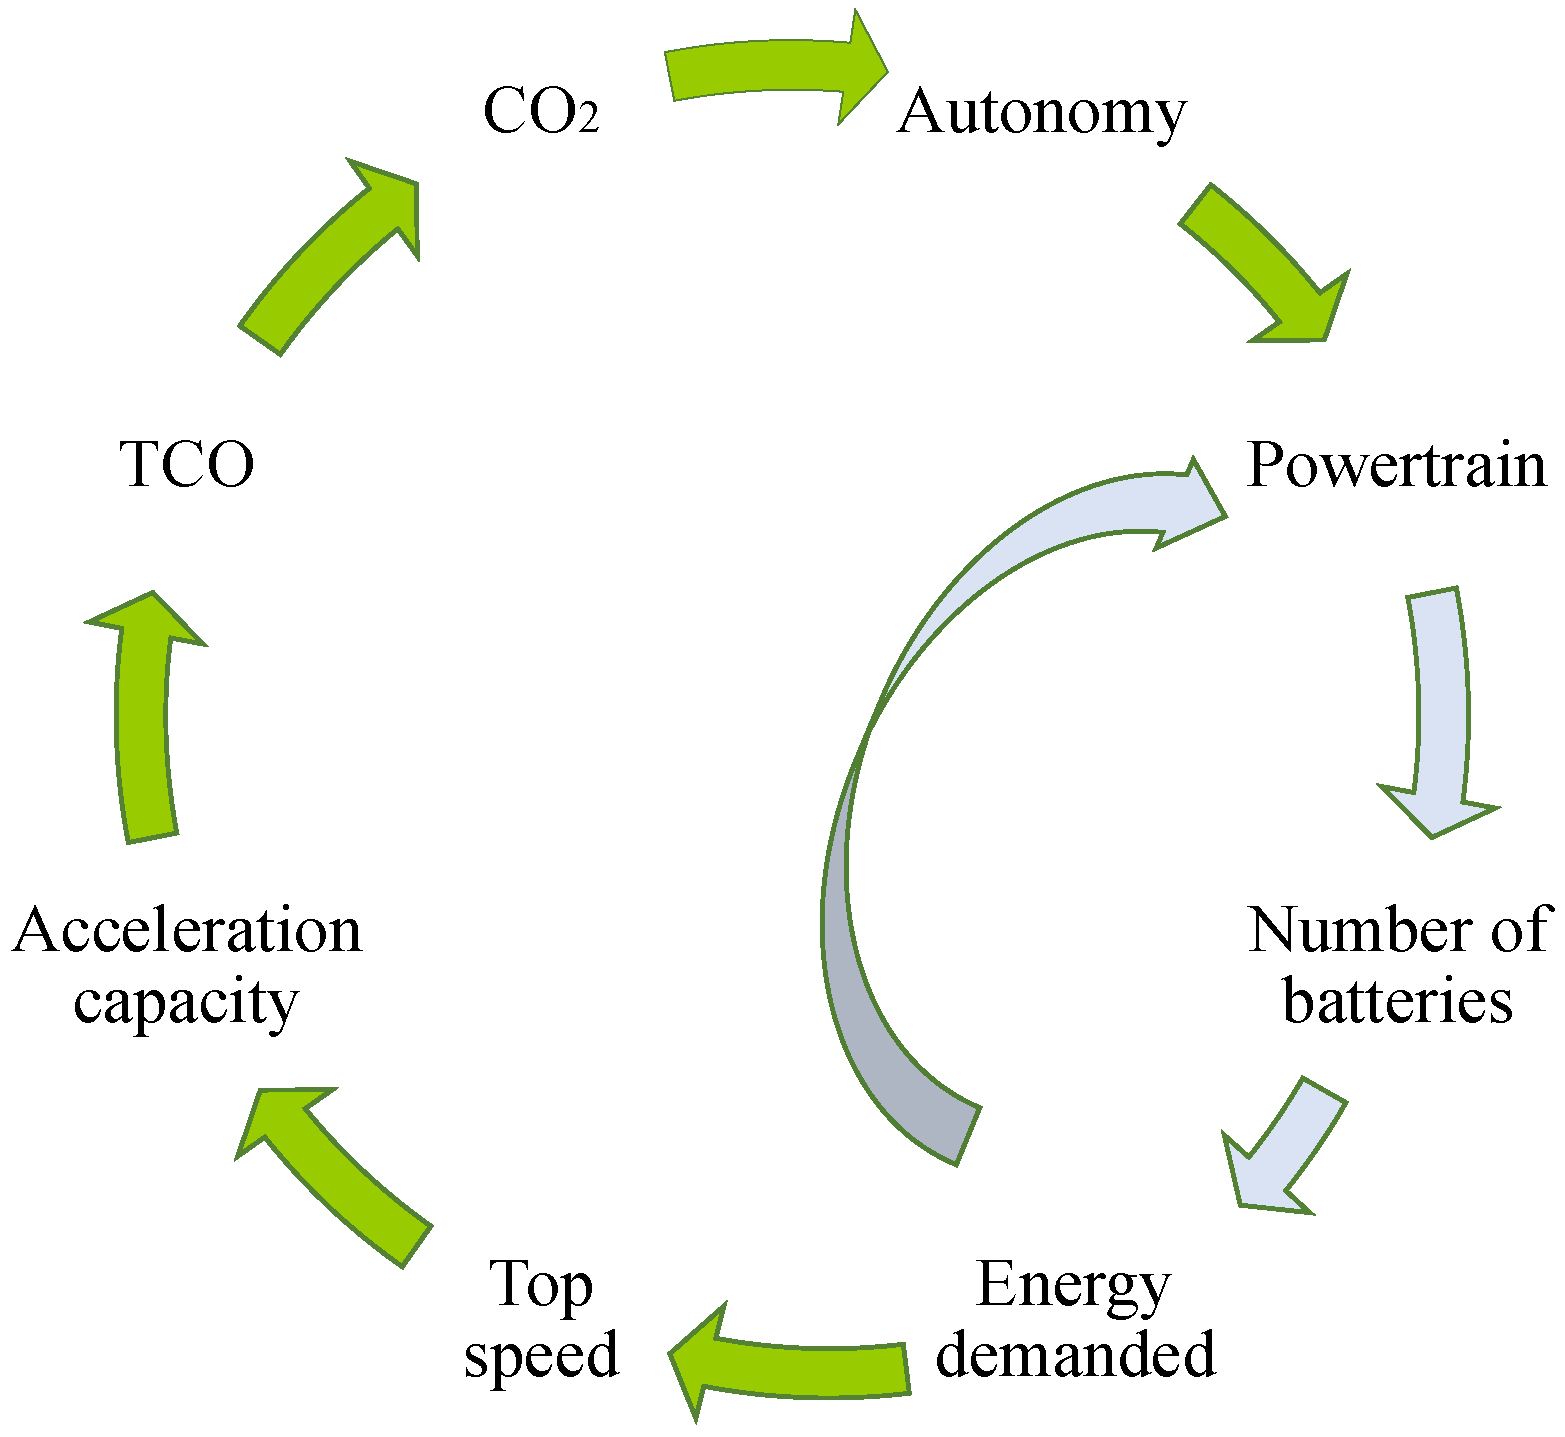
2.3. Phase 3: The Multi-Objective Powertrain Optimization

The main objective of this methodology is to define the minimum size of the components of the powertrain (to reduce its cost of investment and total operational cost) while maintaining the current vehicle operation with equivalent or improved performance (energy efficiency, acceleration capacity, and top speed).
For this purpose, the vehicle powertrain design considered to be optimized is based on the same chassis and design of the current diesel counterpart, but is now a traditional plug-in Battery Electric Vehicle (BEV) with a Single-Motor and Single-Axe (SM-SA) topology, as seen in Figure 4. Optimizing the technology/design of the vehicle or electric components was not the objective of this work, and thus is not addressed.
For defining the powertrain configuration, we consider the double loop of the optimization process illustrated in Figure 5. In the first loop, the size of the motor and battery pack are defined for the defined vehicle’s autonomy and transmission. In the second loop, the gear ratios of the transmission (gearbox and differential) are varied in the way that it:
  • Minimizes the power required from the motor while maintaining the current operation with the purpose of reducing the initial cost of the brand-new vehicle.
  • Minimizes energy consumption to minimize the operative cost.
  • Minimizes the net well-to-wheel CO2 emissions generated per kilometer driven.
  • Minimizes the total cost of ownership (TCO).
  • Maximizes the acceleration capacity of the vehicle (i.e., less time to reach a given reference speed).
  • Maximizes the top speed that the vehicle can reach. As long as the vehicle’s top speed satisfies the driving cycle maximum speed, this characteristic is irrelevant in defining the tailored powertrain for the specific application under consideration. However, high top speed increases the possibility of using the vehicle for eventual other applications. Furthermore, from the marketing point of view, vehicles with high top speed are preferred by drivers. Therefore, in this work, we kept this criterion in the optimization process with low relevance.
Aiming to define the best configuration, a multi-objective optimization process was established. In this process, the relative relevance of the performance metrics was established subjectively but in a collegiate manner, attending to the needs of the project (Table 2). The configuration that maximizes the weighted average of the criteria listed in Table 2 was selected as the tailored power train configuration.
Finally, the process is repeated for different autonomies to determine the sensibility of the results to this variable and to establish the point up to which the electrified tailored HDV can be a better option than the fossil-fueled counterpart. Next, we describe the multi-objective process in detail.

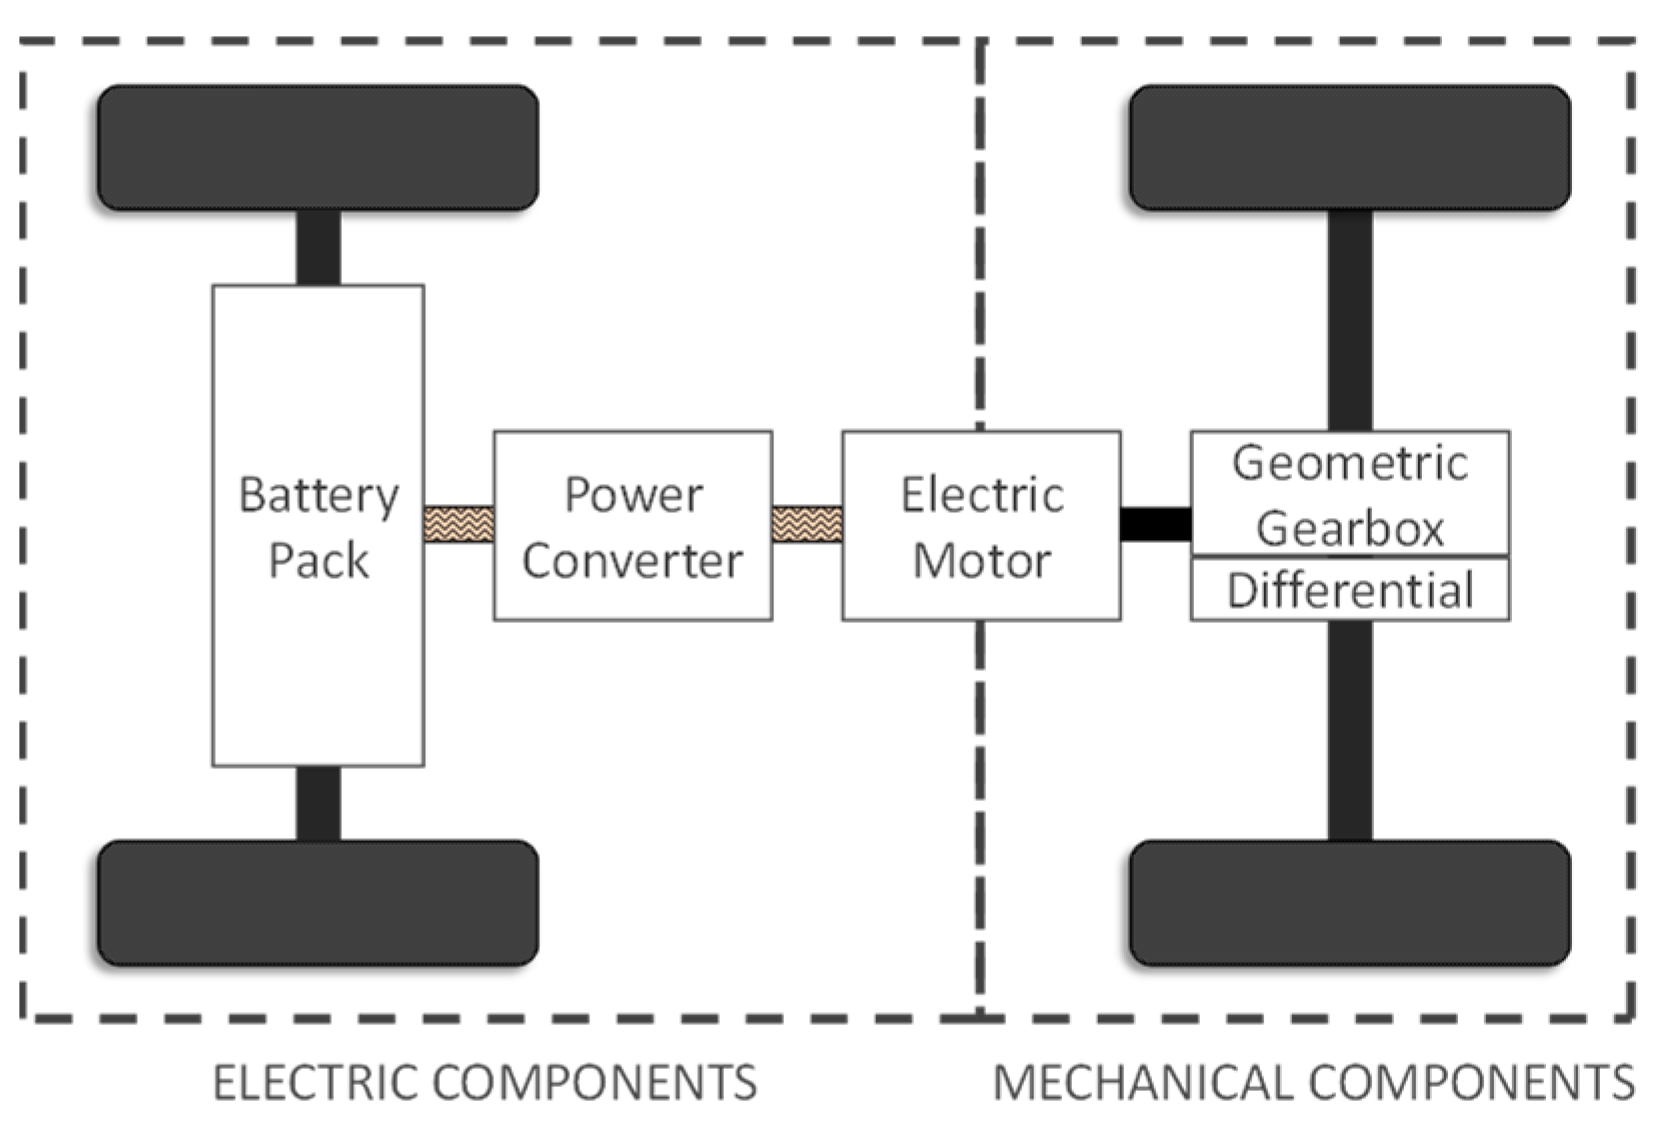
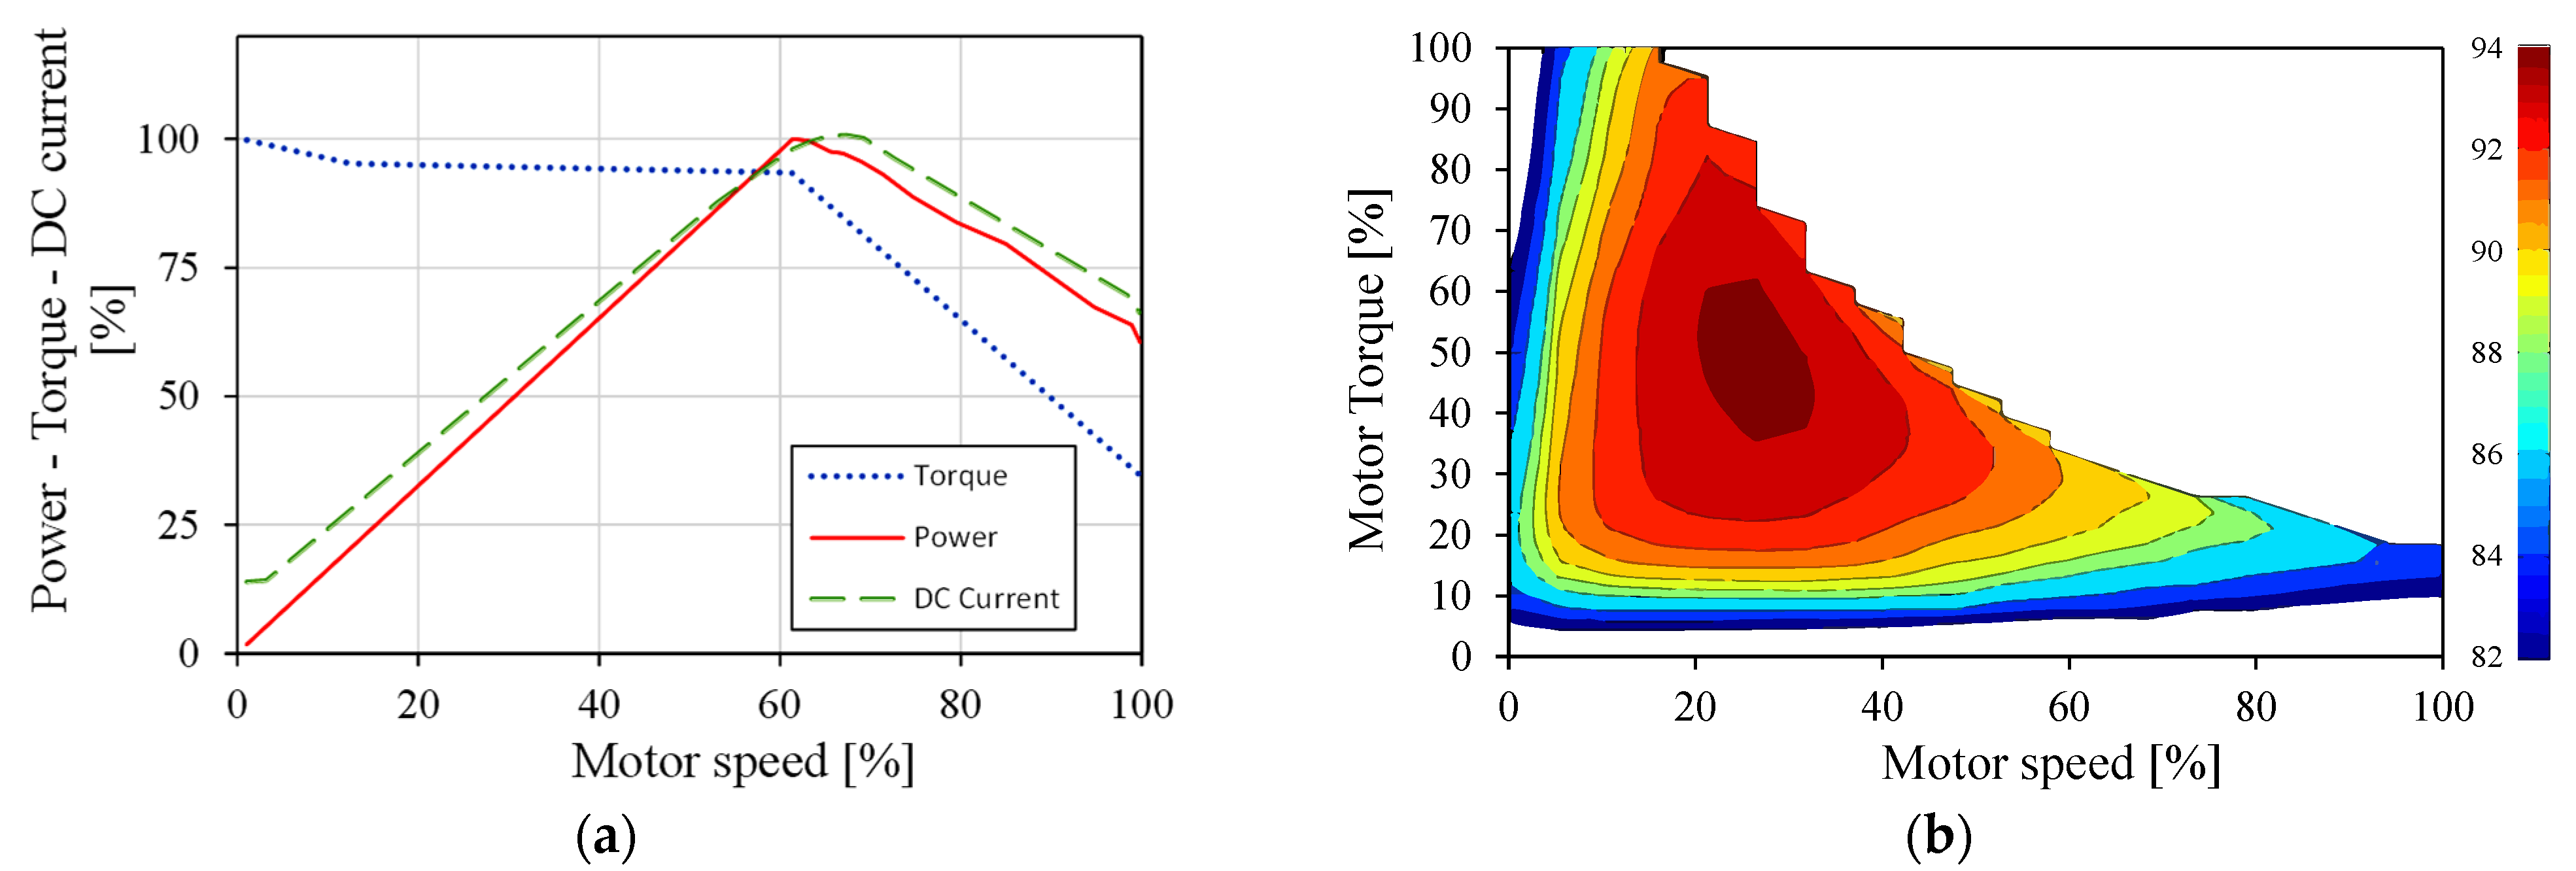
2.3.1. The First Loop of Optimization for Determining the Size of the Motor and Battery Pack

Initially, for a given autonomy and a specified set of transmission ratios, the total energy per autonomy and peak power demanded by the vehicle reproducing the driving cycle constructed in Phase 2 are determined. These values determine the minimum size of the electric motor and the battery pack required to power the vehicle while satisfying the given driving cycle and achieving the autonomy desired.
The total energy required by the vehicle to achieve the desired autonomy and the peak power demanded by the electric motor is calculated through vehicle dynamics fundamentals [43]. This consists of estimating the necessary instantaneous tractive force needed to overcome the forces that resist the vehicle movement while following the speed profile of the driving cycle. The resulting driving force is normally referred to as “road load or traction force” (Fx). It is obtained through Equations (1) and (2). It considers the vehicle inertial force ( F i ) and the forces external to the vehicle, such as the aerodynamic force ( F a ), the rolling resistance ( F r ), and (if present) the gravitational force resulting from a road grade ( F g ). This model assumes that the internal forces, for example, the twists of the chassis and the vibrations within it, do not have a substantial impact on the traction force [43].
F x = F i + F a + F r + F g ,
F x = M a + 1 2 C d ρ A V 2 + f r M g cos ( α ) + M g sin ( α ) ,
where:
M : mass of the vehicle V : instant velocity of the vehicle
a : resulting acceleration of the vehicle f r : rolling coefficient
C d : drag coefficient g : gravity
A : frontal area of the vehicle α : road grade
Because the traction force ( F x ) is connected to the motor through the transmission, this force is used to determine the required instantaneous motor torque ( τ m ) through Equation (3), where R r   ( assumed   constant )   is the wheel radius, N T D i   are the variable gear ratios, m f i   are the transmission respective mass factors (associated with the rotating masses), and η t refer to the transmission efficiencies. The gear-dependent mass factors are obtained through Equation (4).
τ m = ( ( F a + F r + F g ) + M   a   m f i ) · R r N T D i   η t ,
m f i = 1 + 0.04   N T D i + 0.0025   N T D i 2 ,
The required instantaneous power of the motor ( P m ) is now obtained by the product of the resulting torque and the motor speed ( ω ), as indicated in Equation (5).
P m = τ m   ω
Now, the energy consumed ( E C ) by the vehicle for the given autonomy is obtained. This mostly depends on the energy consumed by the motor, which is determined by the relationship of its instantaneous power over time ( t ). A constant value ( C ) can be added to account for the operation of auxiliary systems (e.g., motor controller, headlights, and air conditioning system), as shown in Equation (6). In this study, a constant value of 500 watts was considered for auxiliary systems, which was rounded from 340 watts of a typical 1.7 kW A/C [44] working 20% of the time as measured in a previous study [45], in addition to 20 watts for the audio system, 80 watts for the lighting system, and 60 watts for battery temperature maintenance. The typical values of the audio and lighting systems were taken from reference [46].
E C = P m   t + C
This energy consumed per desired autonomy determines the size of the battery pack, which, depending on the vehicle’s autonomy and battery technology, usually results in an adding excess weight to the vehicle. However, because the total energy demanded by the motor depends on the vehicle’s weight, the resulting excess weight of the estimated battery pack would increase the vehicle’s weight significantly and, therefore, the size of the motor required and the total energy demanded. Thus, additional batteries would be required. As evidenced from the previous description, this process needs an iterative process until no other changes in the battery pack are required. At the end of this iterative energy-based approach, the number of batteries and the motor power size are determined. The process is repeated for each driving profile (ecofriendly, typical, and aggressive).
The number of batteries needed also depends on the desired autonomy, motor characteristics, and battery technology. As stated previously, batteries increase the weight of the vehicle considerably and therefore increase the size of the motor and/or transmission ratios needed, which again results in the need for more batteries to compensate for the increased weight. Based on the previously iterative energy-based approach, the size of the battery pack was estimated. For this work, we considered five different battery technologies generally used when converting or constructing electric vehicles: deep-cycle lead-acid, lithium-ion (Li-Ion), sodium-nickel-chloride (Na-NiCl2), nickel-metal hydride (Ni-MH), and lithium-sulfur. Typical values were used based on TROJAN and SAMSUNG commercial models with reduced costs per unit of energy [47,48] for lead-acid and Li-Ion batteries; for the remainder, typical values were obtained from reference [10]. Table 3 shows the characteristics of each battery type included. In this work, we took into consideration commercially available battery units. It was outside of the scope of the present work to optimize the composition of the cells within the battery.
Then, we considered the impact of the operation mode on the energy management system. Electric vehicles generally operate in two forms: opportunity and overnight [49]. Their differences rely on the needed autonomy and recharging time. The opportunity mode has a smaller battery pack and autonomy (<50 km). In this case, a full battery charge (80–100%) can usually be achieved within 5–10 min. By comparison, the overnight mode has a large battery pack with autonomous ranges of up to 300–400 km, but its recharging time increases to around 4 h [49,50]. Mohamed et al. (2016) concluded that when considering the added range due to recharging for a few minutes between trips, all opportunity electric buses provide similar performance to their diesel counterparts [30]. For the case study considered (fixed routes under 50 km), the opportunity operating mode is the best choice because the routes and distances driven are known, which allows identification of the specific locations and moments at which the vehicle can be frequently recharged, hence reducing the battery pack weight, and thus the size of the powertrain.
For the estimation of the state of charge of the batteries during the driving cycle reproduction, the Coulomb counting method was chosen [51]. This method, described in Equation (7), is a good first approximation to determine the State of Charge (SoC). However, this method does not consider factors that affect the life of the battery and/or performance, such as the discharge curve of the batteries or the temperature, which may have a substantial effect on the battery energy efficiency [52]. The SoC is calculated by integrating the amount of energy (amperes) used each time the vehicle completes the defined driving cycle to know how much capacity is being consumed and how much is stored. Assuming that S o C 0 is the initial state of charge at time t 0 , the SoC is defined as:
S o C = S o C 0 ( t 0 t η   i ( t ) C t d t ) ,   0 < S o C < 1
In this equation, i ( t ) is the instantaneous current in amperes. In this work, regenerative braking is not considered, and thus the instances where the current is negative are discarded. The parameter η is the coulombic efficiency and C t is the capacity in ampere-seconds.
Nevertheless, the input voltage of the motor also has a major impact on the number of batteries needed to power the vehicle. The motor’s chosen bus voltage depends on its application. For instance, when converting small-size fossil-fueled vehicles (e.g., golf carts) to electric power, it is frequent to use low-voltage motors (<60 V) with lead-acid batteries due to their reduced cost [53]. High voltage motors (>60 V) boost the overall vehicle energy efficiency and autonomy. Therefore, high voltage motors are generally used in commercial electric vehicles, with typical values between 300 and 600 V (depending on the vehicle segment and application) [54]. However, vehicles with these high-voltage motors would not be feasible with lead-acid batteries because they would require 30+ of these heavy batteries per rack to achieve this voltage, which are counterproductive due to their low energy density and charging speeds. Consequently, there is the need for better battery technologies, such as lithium-based batteries, for today’s high voltage motors.
To estimate the minimum number of batteries required in one rack ( B a t s ), the batteries required are estimated as a function of the bus voltage ( V b ) of the motor selected and the output voltage of the selected battery ( V b a t ) with Equation (8). Because the power delivered by a motor relies on the voltage and amperage, the higher the voltage chosen, the lower the current needed, resulting in cost benefits in terms of energy distribution (cables, connectors, etc.). Low-voltage systems are usually considered for low-power applications where battery technologies can have lower costs because the number of cell connections can be reduced. Consequently, lead-acid batteries, despite being the cheapest option for low-voltage motors, would not be the best option for high-voltage motors. For all battery types, we considered a 300 V motor in consideration of the vehicle size (<7.5 ton). The typical voltage level used in commercial vehicles of this category is 300 V [54].
Now, to obtain the number of battery racks required ( B a t p ), the autonomy ( Λ ) and the charging strategy are taken into consideration. In this work, we considered the opportunity operating mode as the energy management strategy. Therefore, the number of battery racks required for the desired autonomy is calculated through Equation (9), where S E C is the energy consumed per kilometer (Wh/km) and E b a t is the energy that can be obtained from each battery in watt-hours (Wh).
B a t s = V b   V b a t
B a t p = S E C   Λ B a t s   E b a t
One additional consideration must be included in the optimization process: the battery pack estimated must be able to supply enough instant energy to satisfy the peaks of power that the motor has to deliver within the driving cycle.

2.3.2. The Second Loop of Multi-Objective Powertrain Optimization
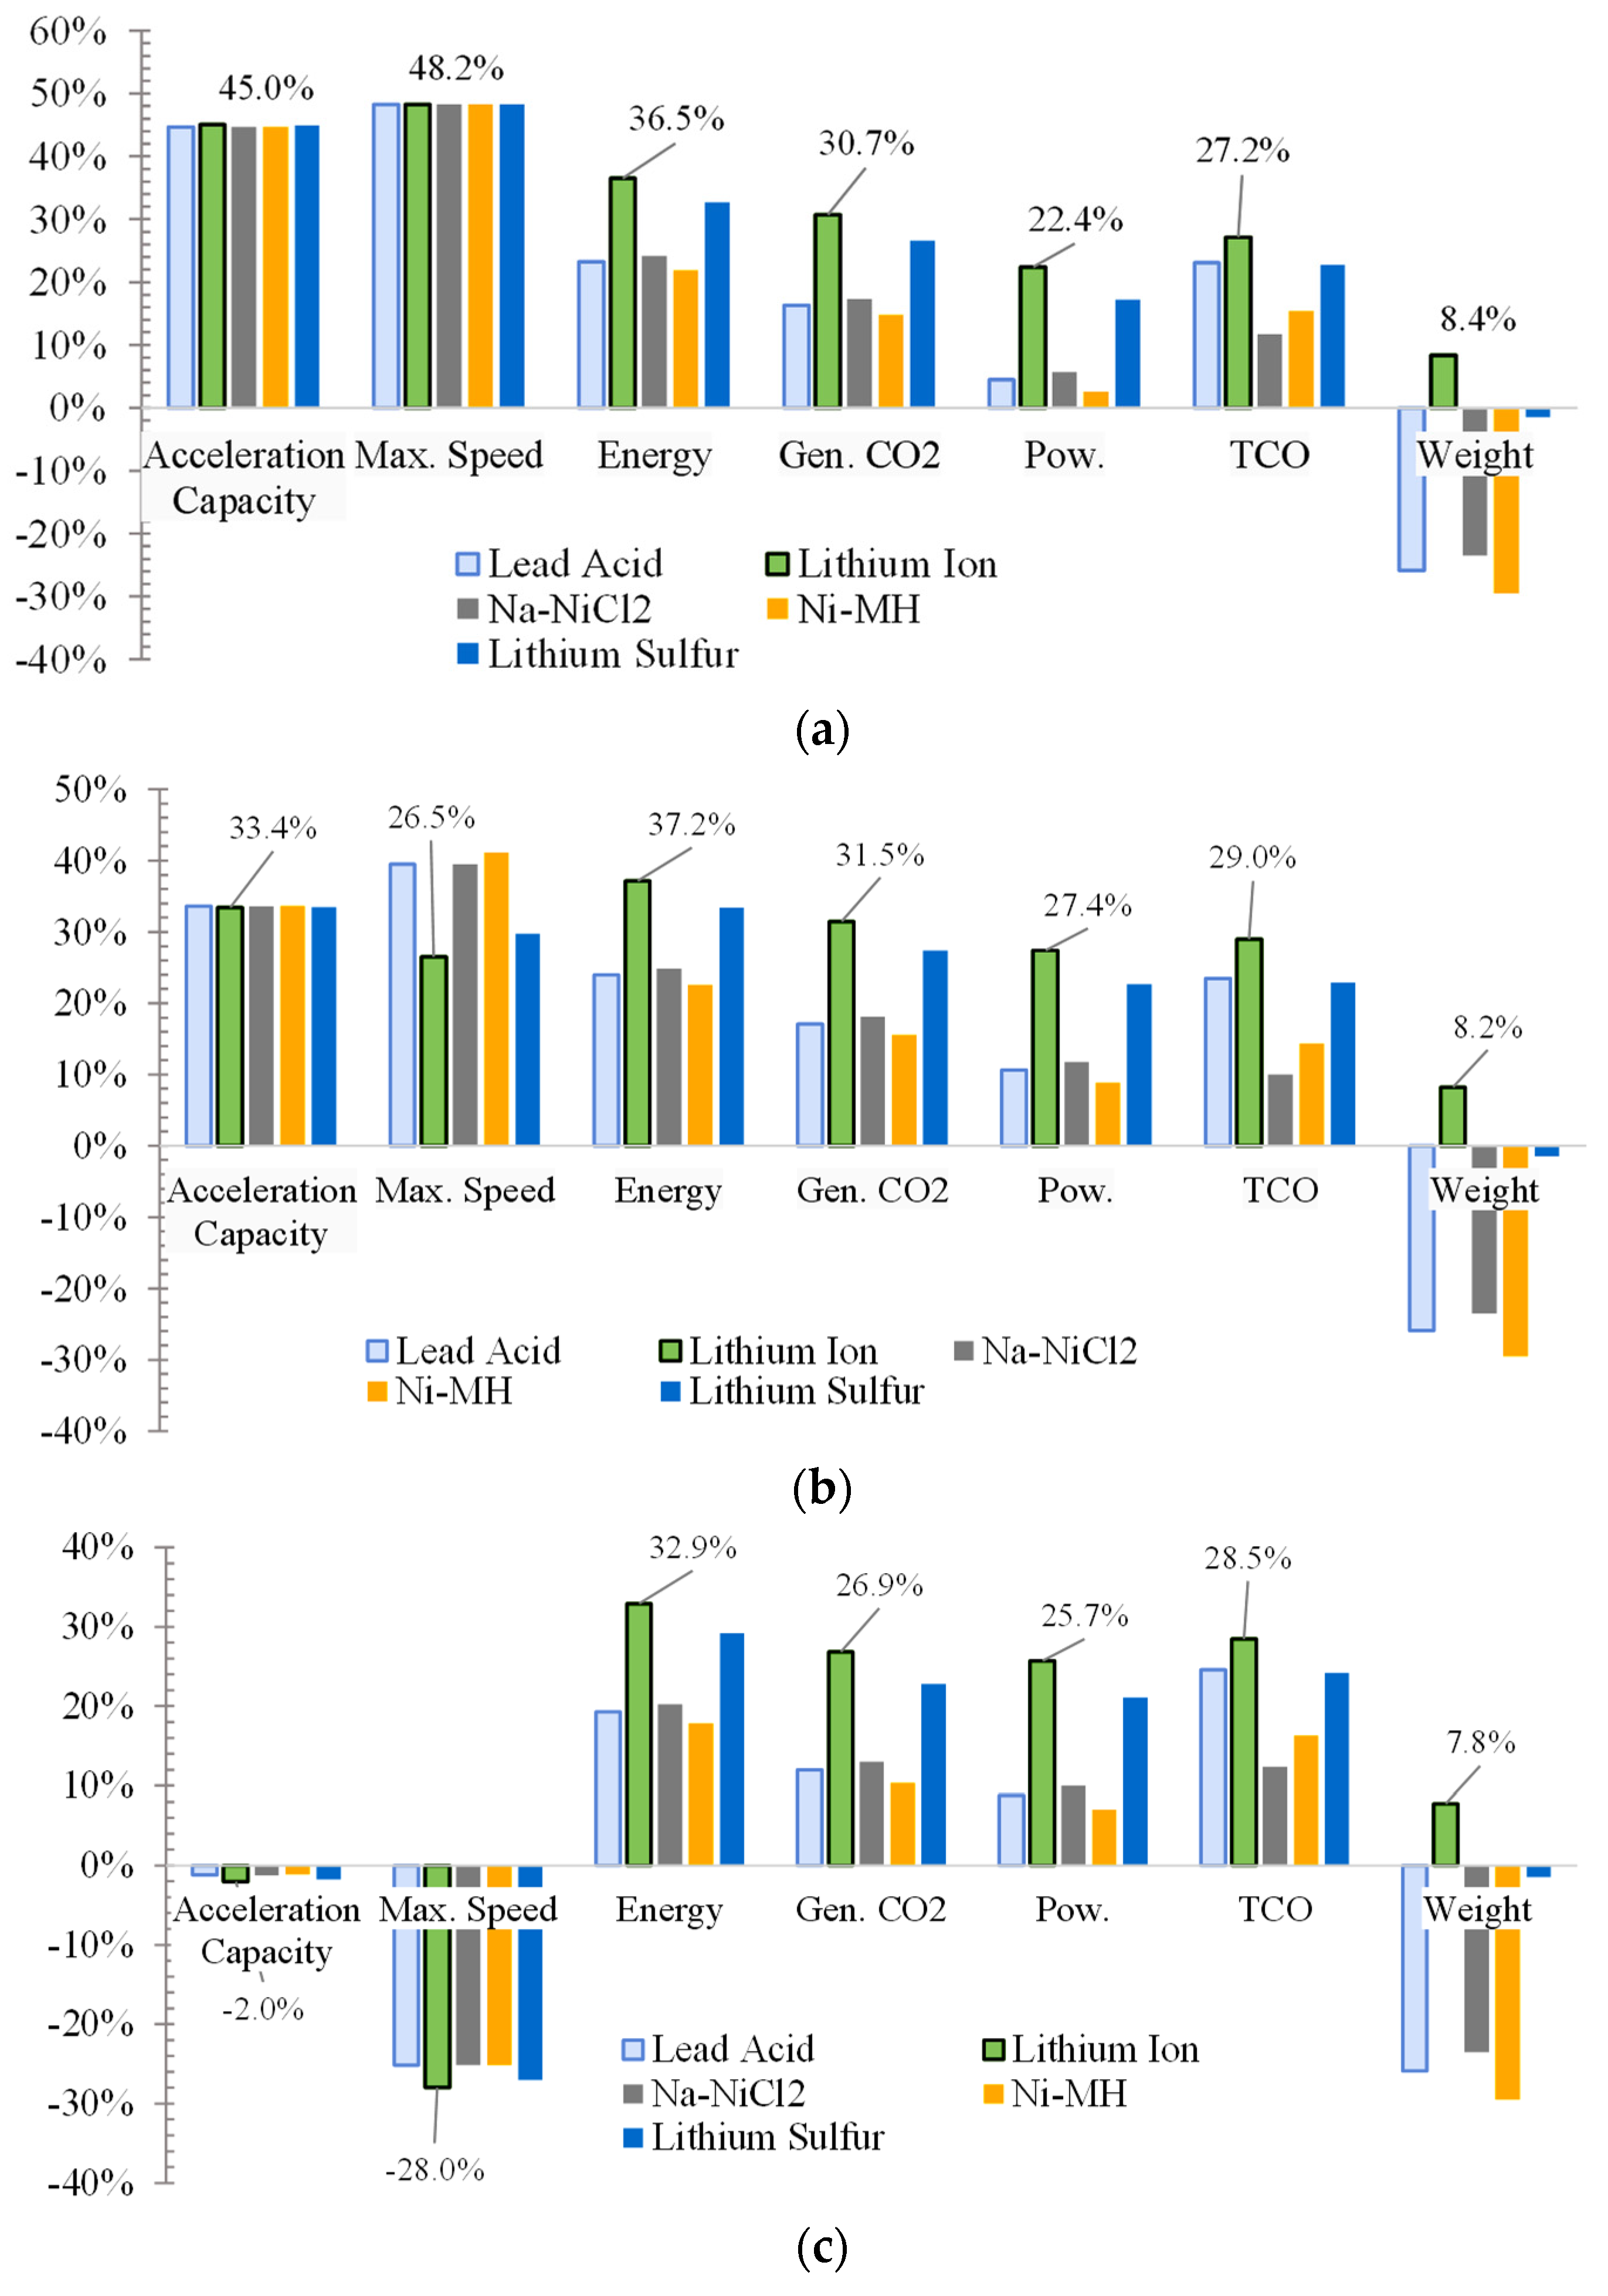
In the first loop of optimization, the size of the motor and the battery pack was determined for the given autonomy and specified transmission. In the second loop of optimizations, the CO2 emissions, acceleration capacity, and total cost of ownership are determined, as described next.

CO2 Net Emissions

Determination of the CO2 net emissions produced by a vehicle must consider those generated on-road (Tank-to-Wheel, C O 2 T W ) and those generated when the consumed fuel or electricity was produced (Well-to-Tank, C O 2 W T ), as described by Equation (10). The C O 2 T W emissions are estimated by the product of the energy consumed by the vehicle ( E C ) and the corresponding fuel emissions factor ( E F T W ). The C O 2 W T emissions consider the E C with an emissions factor that depends on the most common electricity production process within the region of study ( E F W T , Equation (11)).
Although electric vehicles do not produce C O 2 T W emissions, they may produce substantial CO2 net emissions because the energy consumed by this vehicle is not necessarily obtained from green sources within the C O 2 W T   process. For this step, the CO2 emissions per unit of energy produced in the region of study are connected to the energy consumed by the electric vehicle per unit of distance driven. This concept is generally known as well-to-wheel CO2 emissions.
C O 2 = C O 2 W T + C O 2 T W
C O 2 W T = E C   E F W T   ;     C O 2 T W = E C   E F T W

Acceleration Capacity

Acceleration capacity is the time it takes for the vehicle (at its maximum capacity) to reach a given reference speed starting from idle; the shorter this time, the greater the acceleration capacity. To estimate this time, the instantaneous acceleration ( a x ) is estimated from Equation (12), which is obtained from Equation (3) considering the motor works at 100% load. We consider a typical torque vs. motor speed profile from AC electric motors (Figure 6a) when working at full load ( τ m f u l l ).
a x = τ m f u l l   N T D i   η t R r ( F a + F r + F g ) M   m f i
In this equation, N T D i is the gear ratio in gear i and η t is the transmission efficiency. The forces resisting the vehicle movement ( F a + F r + F g ) are estimated as a function of vehicle speed. Gear shifting occurs to keep the motor within its most efficient region (Figure 6b). Once the instantaneous acceleration of the vehicle is determined, the acceleration capacity is obtained through Equation (13), which must be carried out progressively in each of the transmission gears. For this case study, we considered 70 km/h as the reference speed for the determination of acceleration capacity. This reference value corresponds to the maximum speed observed within the trips, with SFC higher than the 90th percentile previously mentioned (high SFC scenario), which is approximately 40% higher than the typical driving cycle maximum speed observed (~50 km/h). In the optimization process, we took into consideration the performance of the electric motor (energy efficiency) as a function of torque and RPM (Figure 6b). Because we did not have access to this information for different motor trademarks, we used the performance of a typical electric motor and assumed that the motor performance scales linearly with the motor size (torque), and max RPM, as is shown in Figure 6a,b.
t =   V 0   V   d V a x

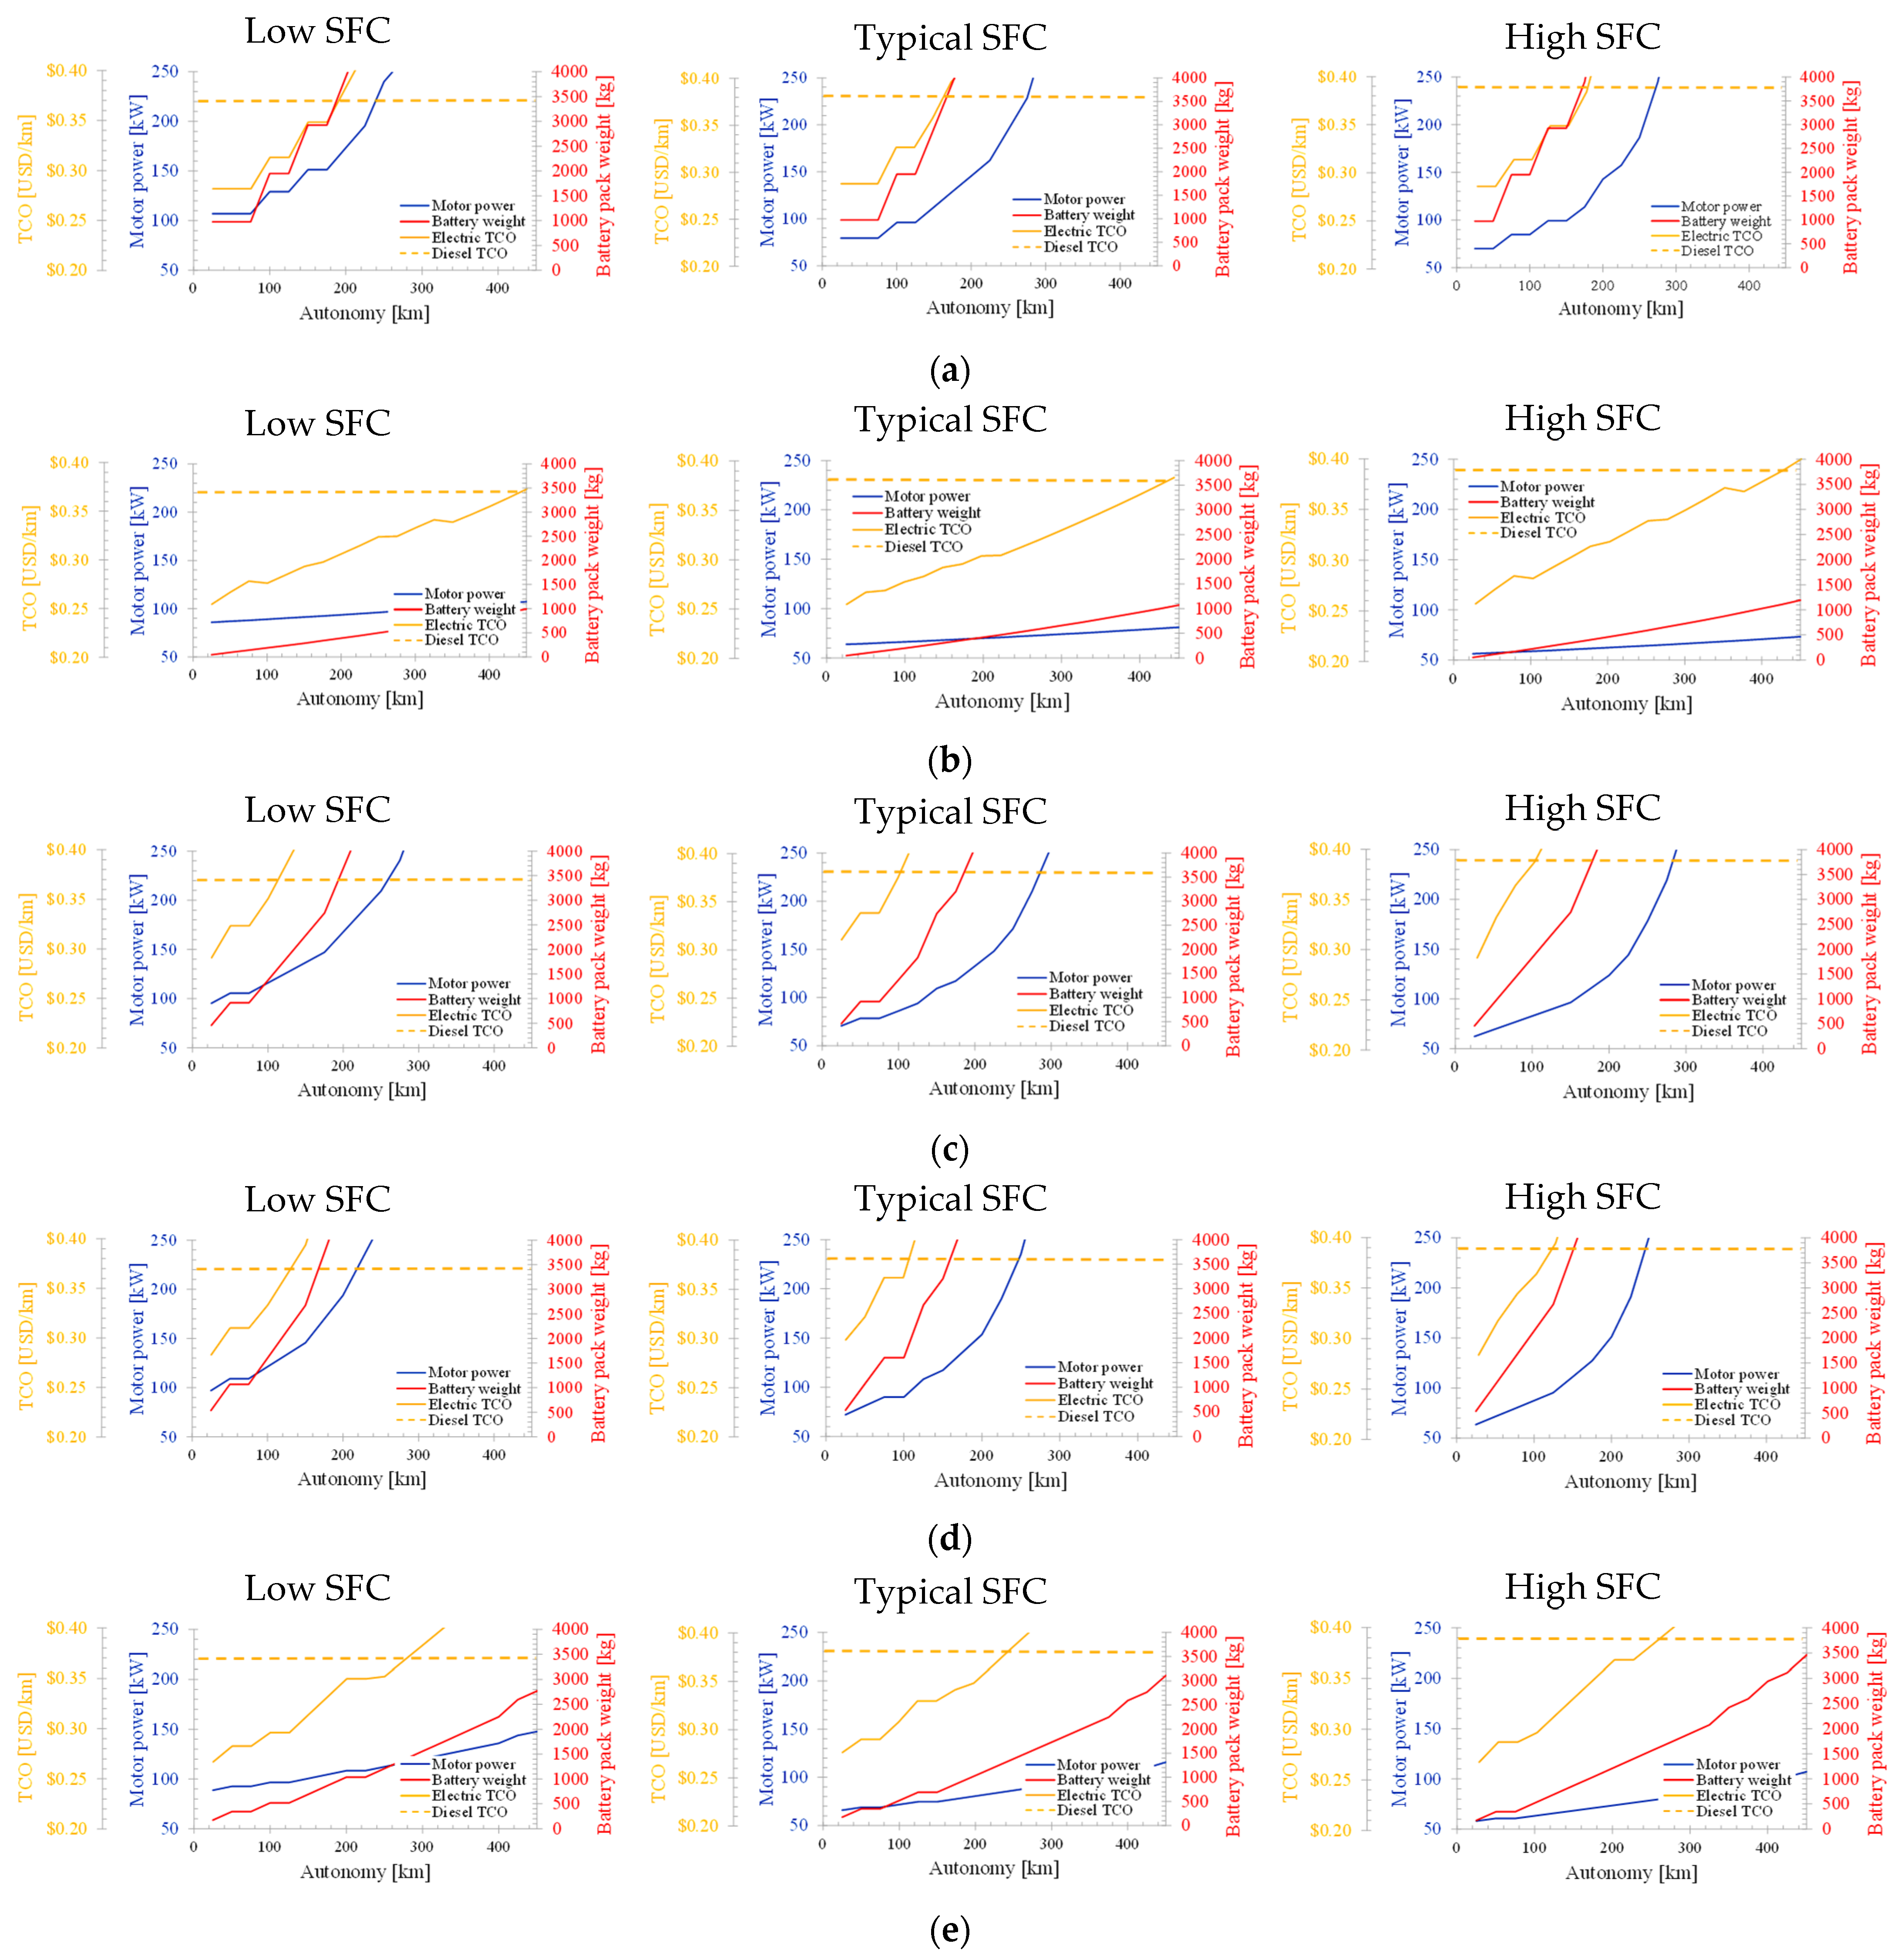
Total Cost of Ownership—TCO

This metric assesses the long-term cost of operating a vehicle and is the main criterion in decision making. The TCO is the purchase cost of an asset added to the variable costs of operating it. This work aimed to quantify the cost of operating electric buses under a given configuration and energy strategy. For this purpose, the TCO estimated considers three major aspects:
  • Initial investment costs: For electric buses, we considered the cost of the defined motor, transmission, battery pack, chassis with body and accessories, and a charging station; for diesel buses, we considered the cost of the current commercial vehicle.
  • Operational costs: This includes the cost of diesel or electricity, corrective and preventive maintenance, insurance, battery-pack replacements, emissions penalties, and driver’s salary.
  • Financial costs: This includes loans, financing interest rates, taxes, inflation, depreciation, and savage value after the expected lifespan of the vehicle.
The comparison of the total cost of ownership between diesel and electric alternatives is based on a single bus in each case and one charging station for every ten electric buses. This scenario assumes a charging strategy of a 10–30 min stop between every trip to charge using a 7 kW DC dual fast-charging station, which would recharge more than enough energy for an additional trip [30].
A few considerations and assumptions were included when estimating the TCO in this case study, and these are detailed in Table 4.

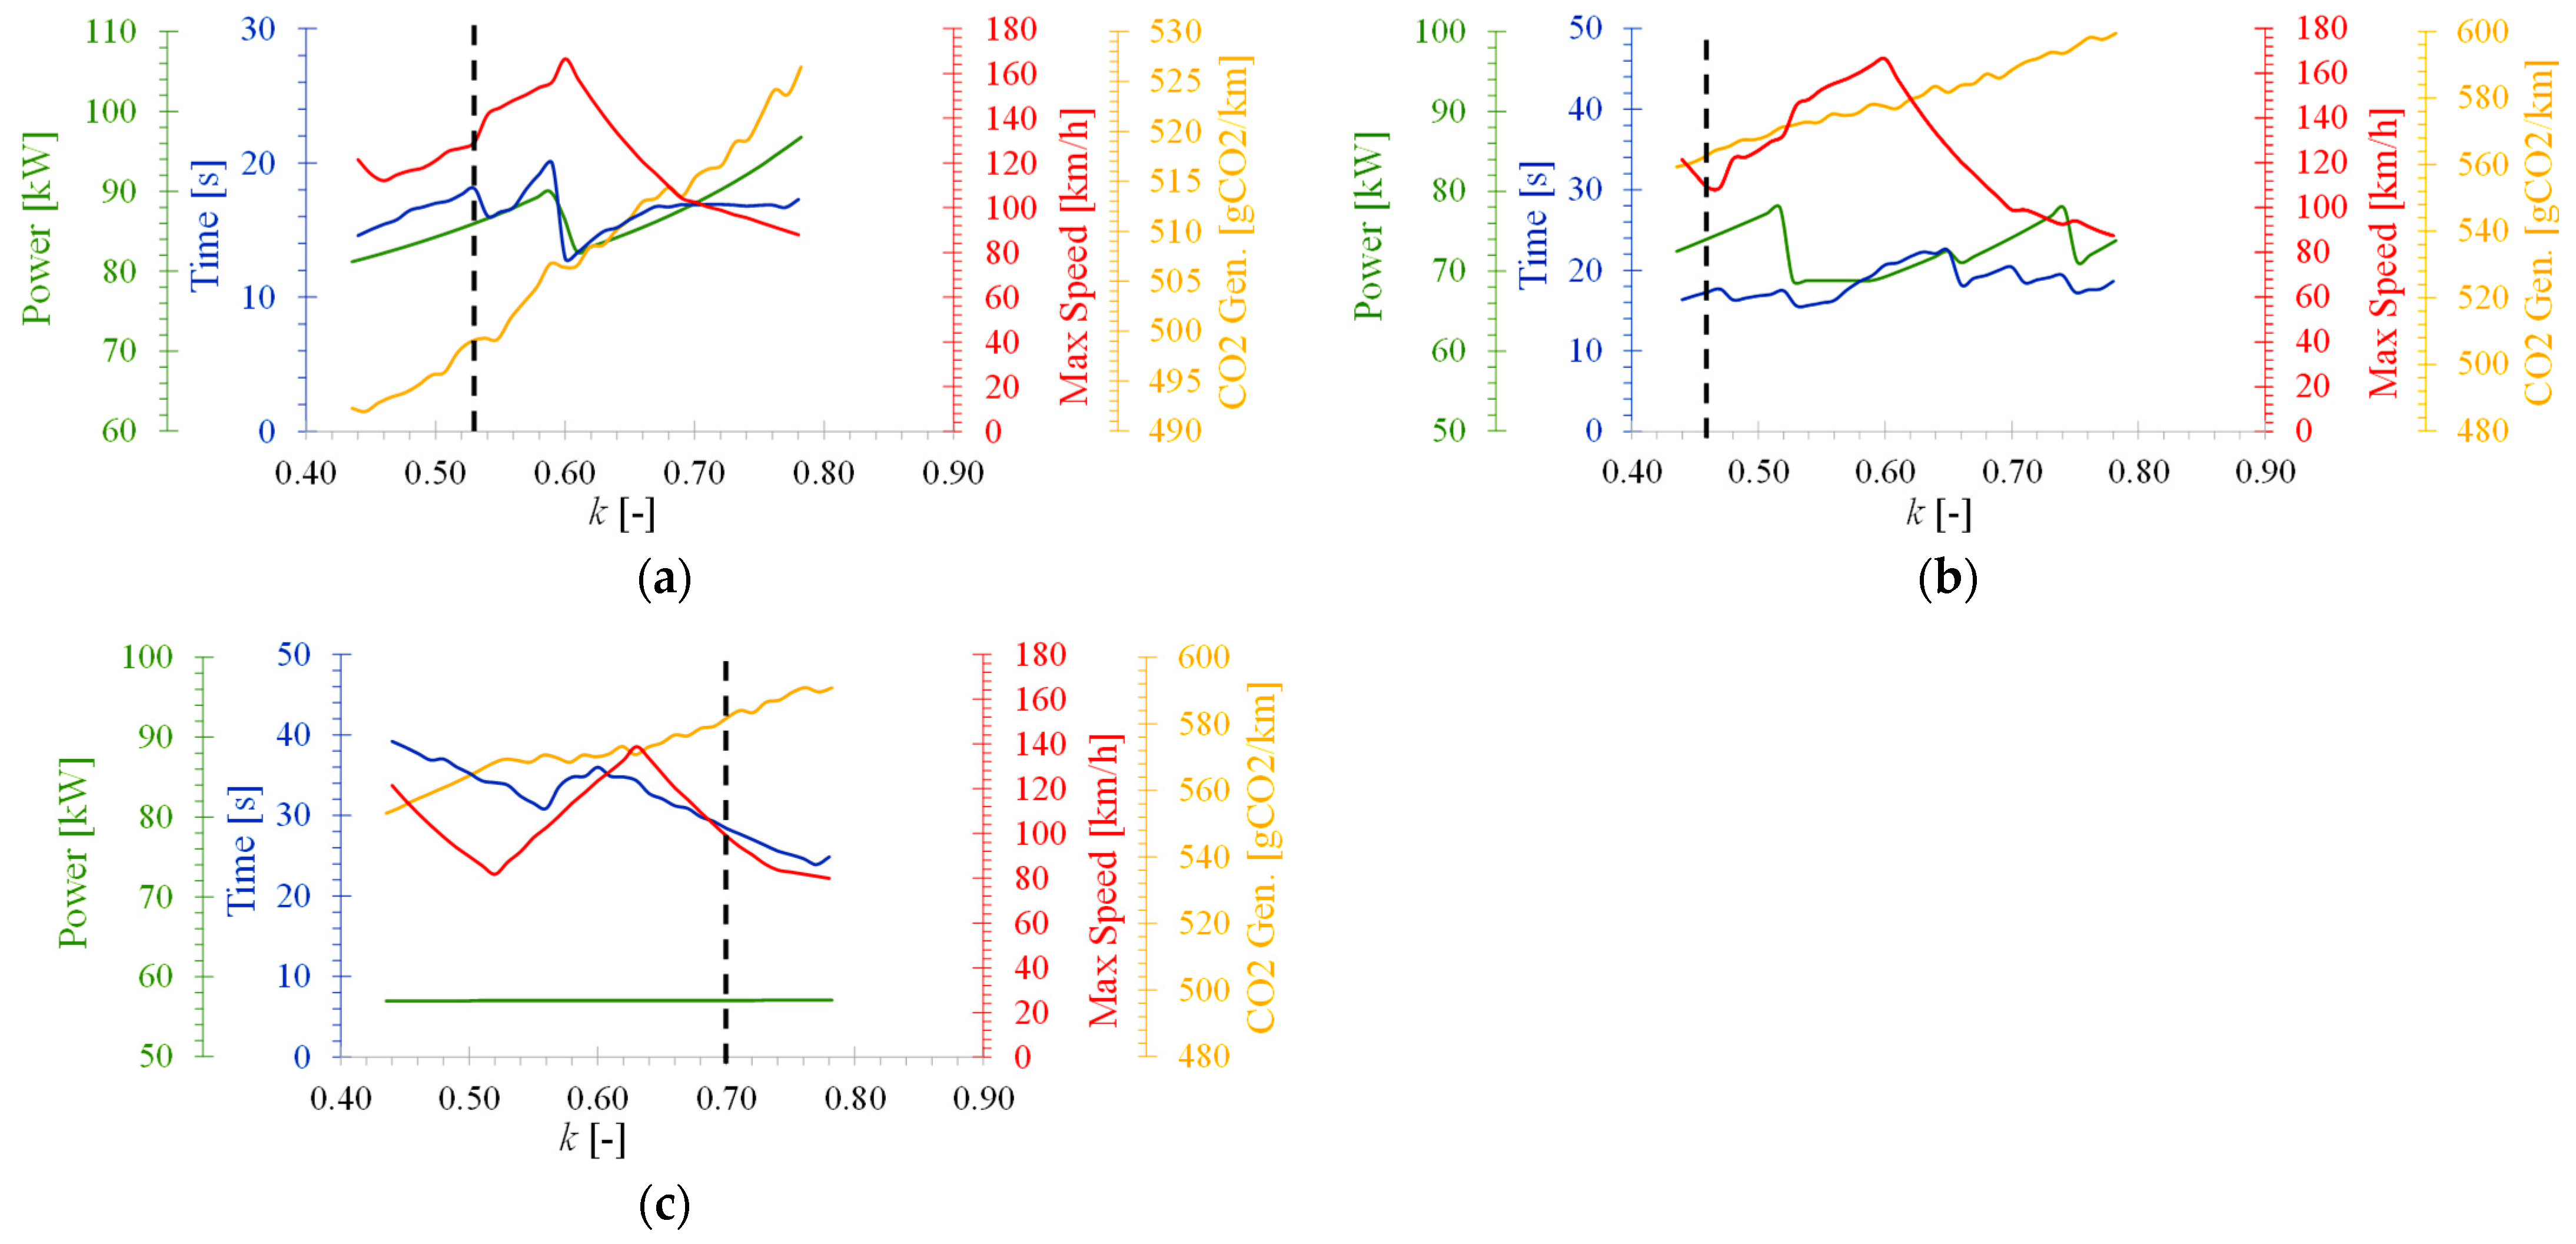
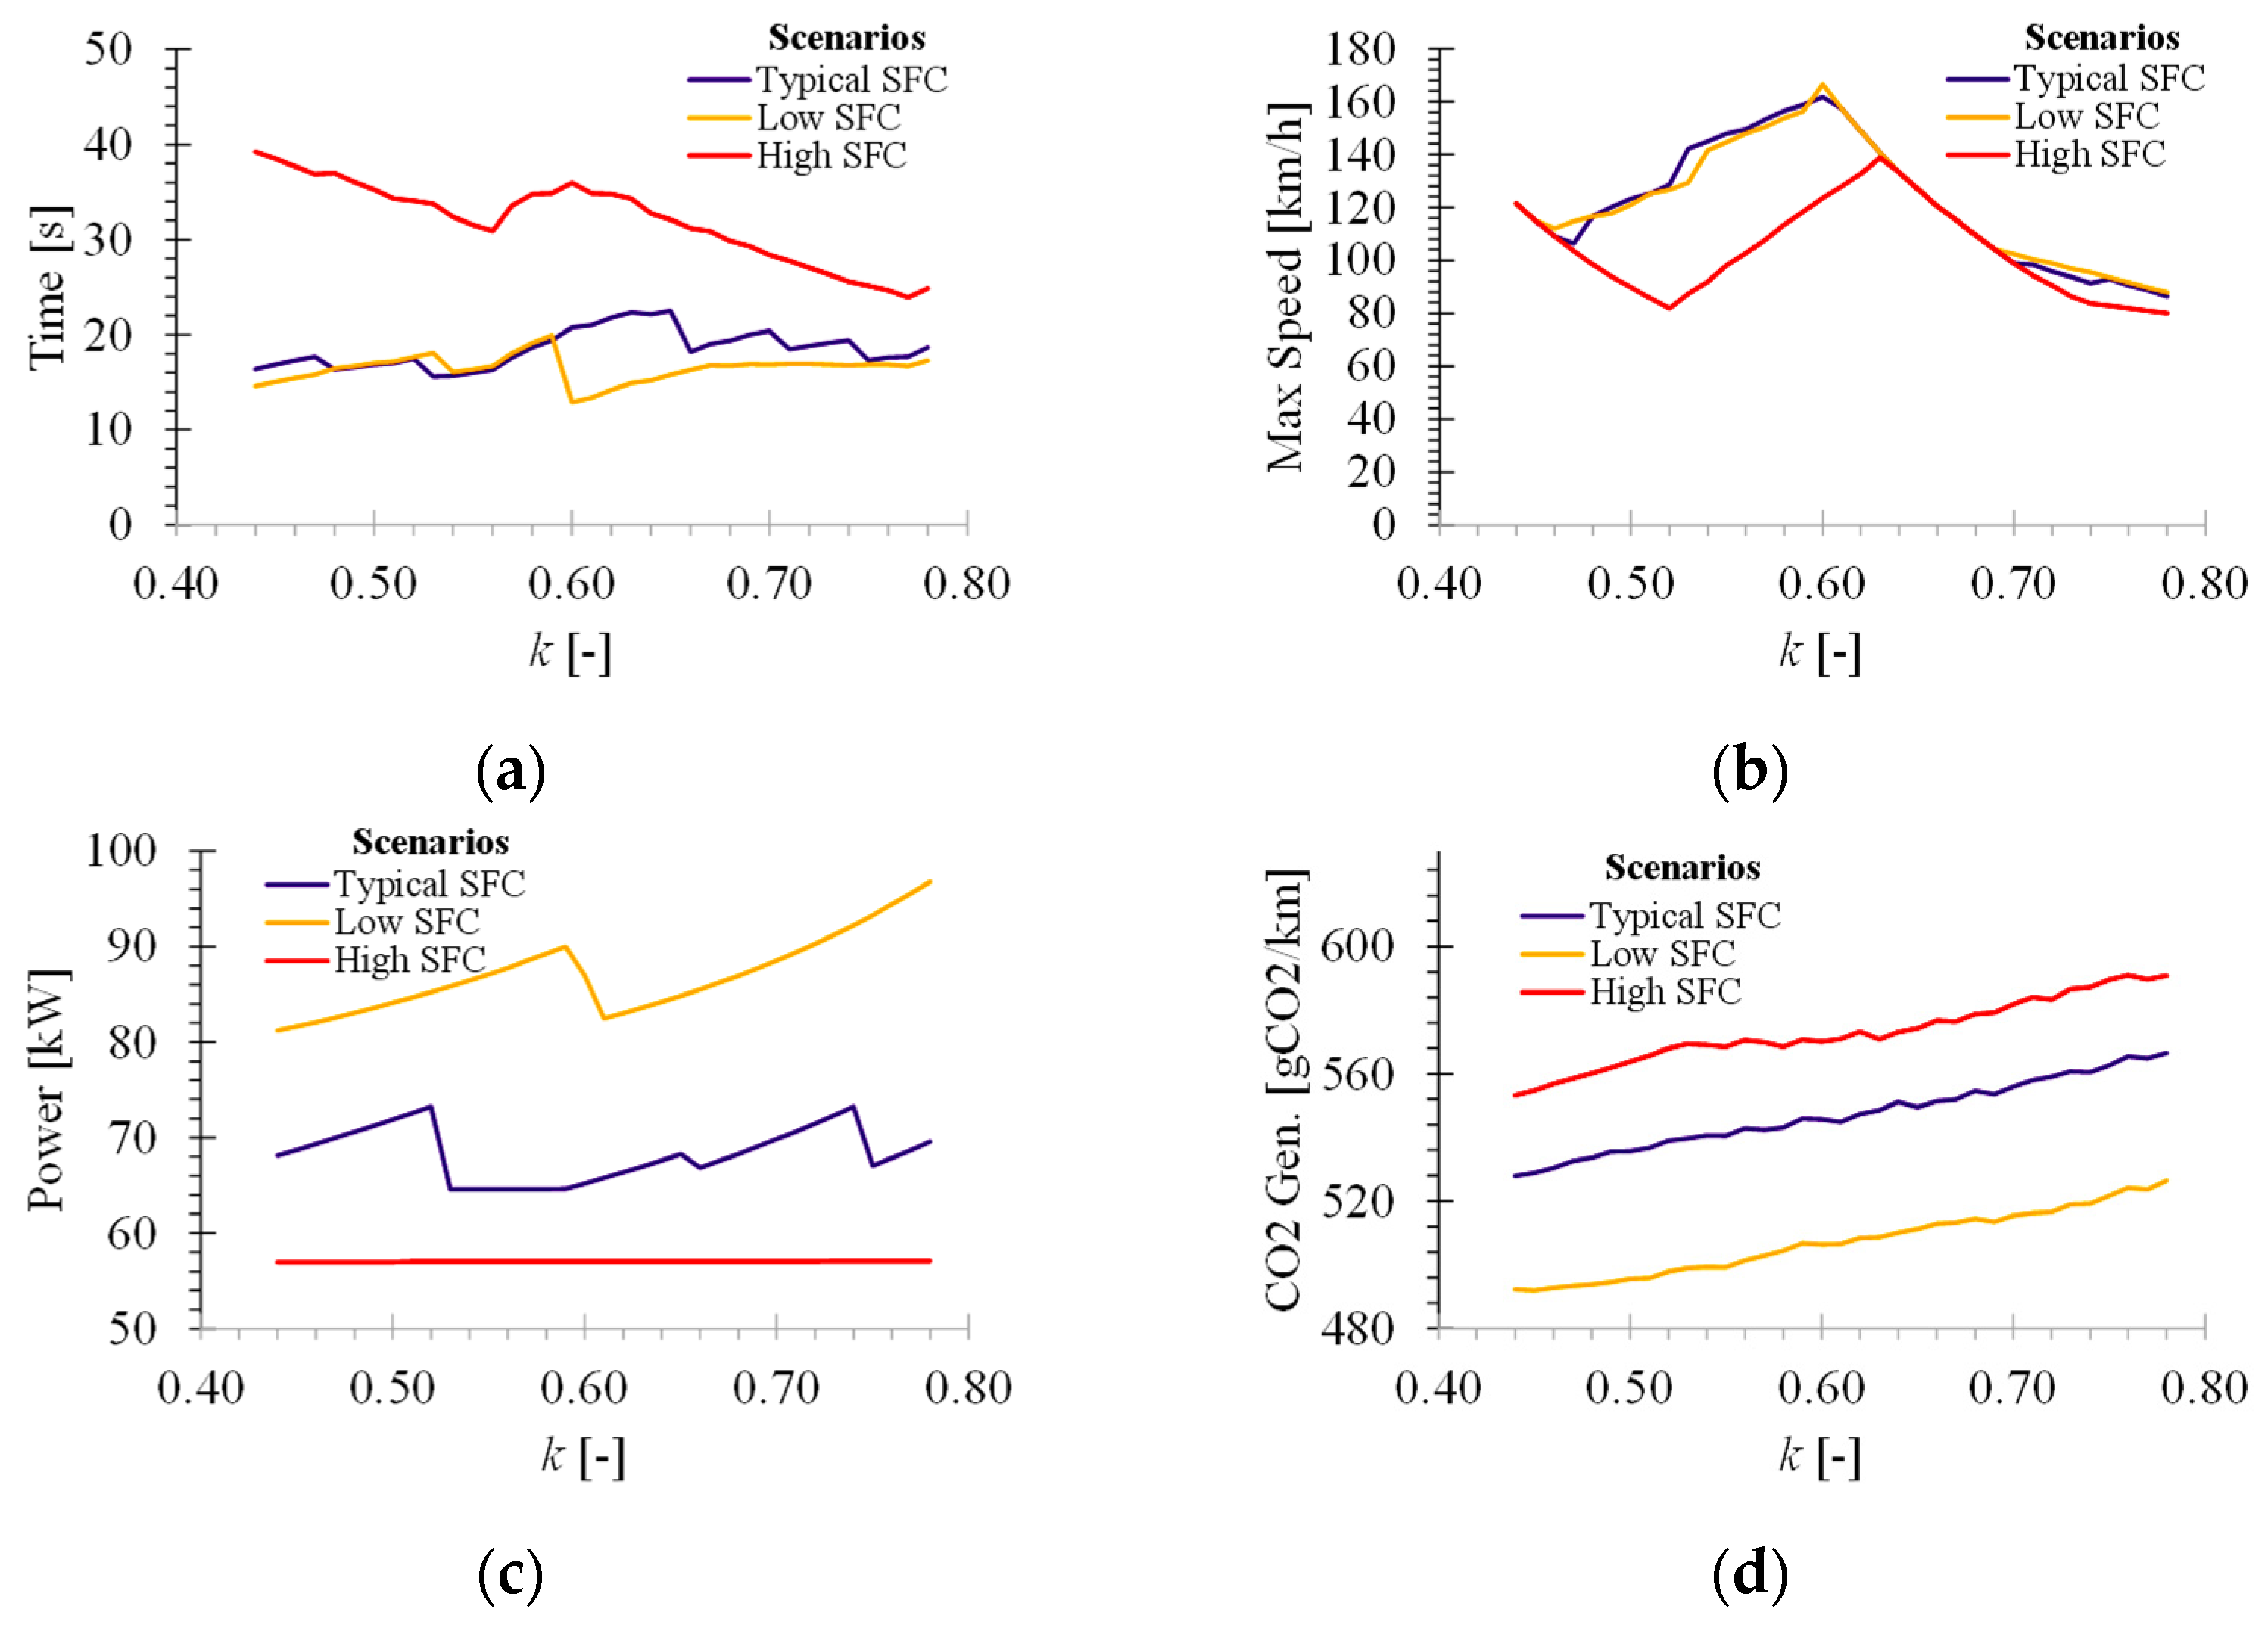
Muti-Objective Optimization Varying the Transmission Ratios

As previously described in the energy-based approach (Equations (3)–(6)), the gear ratios of the transmission ( N T D i ) have an inverse relationship with the maximum torque and power demanded of the motor, and hence the size of the battery pack; that is, the bigger the gear ratio, the smaller the motor needed. However, the maximum gear ratio is limited by two factors (excluding size limitations): (i) the top speed needed by the vehicle because big gear ratios reduce the top speed; and (ii) the desired operating range of the motor, which highly influences its performance (power, torque, and current) and efficiency, as seen in Figure 6a and Figure 6b, respectively. The latter factor indicates the importance of defining the gear ratio in combination with the desired operating range of the motor considering its typical behavior. Because both factors are connected, an option is to define the first gear ratio (based on typical values of commercial gearboxes of similar electric vehicles), and then the remainder of the gear ratios will be defined based on the weighted factors shown in Table 2.
For this, a geometrical gearbox ( N T D i + 1 N T D i = k ) was considered, where the value of the ratio between gears ( k ) is constant. This can be optimized based on the specific number of gear-shifting ratios selected (most EV gearboxes use four gear-shifting ratios), aiming to reduce the torque and power required by the motor, while at the same time setting the gear shifting speed in the way the motor works in its region of highest efficiencies.
Finally, after defining the gear shifting speed and number of gear-shifting ratios, the multi-objective optimization process was carried out, repeating the iterative energy-based approach (Figure 5) under different values of the ratio between gears ( k ).

3. Results

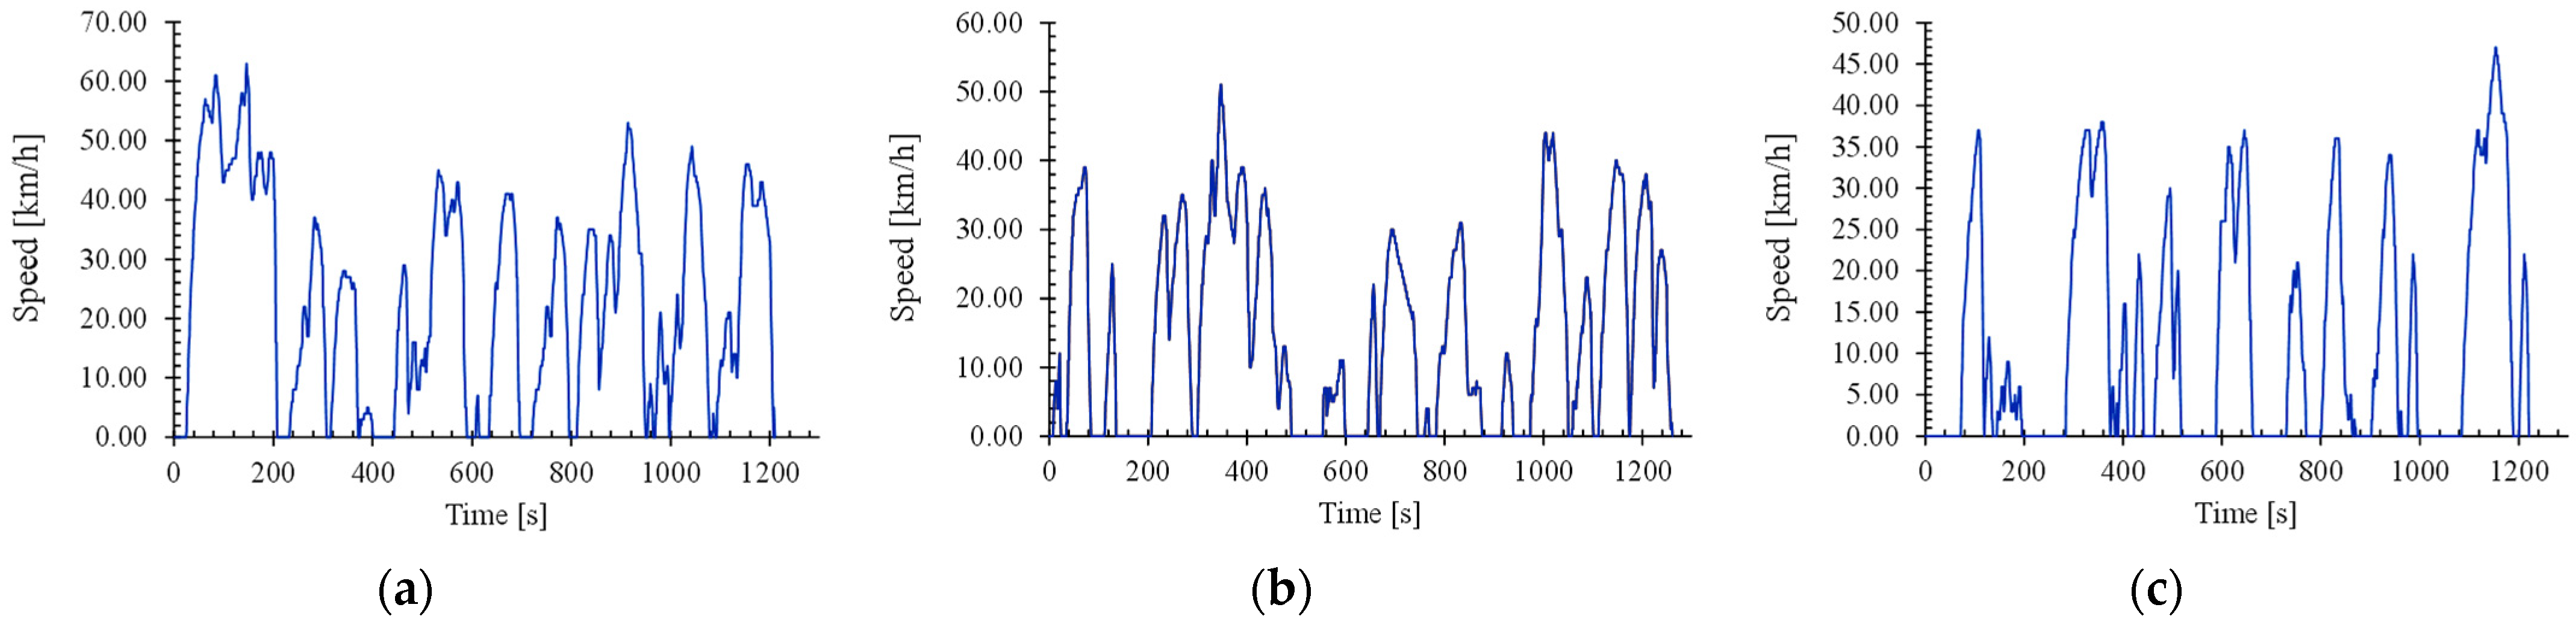
3.1. The Current Vehicle Operation

Table 5 shows the 14 CPs used to describe driving patterns and the values obtained for the current CircuitoTec service based on diesel vehicles and for the three scenarios considered (low SFC, typical SFC, and high SFC). The most important parameters are the average SFC, idle percentage, and average speed. However, kinetic intensity is a particularly important measure in electric vehicles. It is the ratio of characteristic acceleration to aerodynamic speed. In EV, high values of kinetic intensity generally indicate frequent stop-and-go driving. A high number of accelerations per kilometer driven indicates opportunities for regenerative braking [57]. As a reference value, the average kinetic intensity of the EPA’s Heavy Duty—Urban Dynamometer Driving Schedule is 0.377 per km, which is lower than the value obtained in CircuitoTec (5.15 for the typical scenario). Nevertheless, in this work, we did not consider regenerative braking.

3.2. Driving Cycle

Following the procedure detailed in Quirama et al. (2020), the construction of the representative driving cycle was carried out 1000 times for each scenario [40]. Figure 7 shows the relative differences (RD) of the CP*s of 1000 candidate driving cycles compared to CPs of the driving pattern. Figure 7 shows that the driving cycles produced are highly representative of the driving patterns (RDi < 20%) and reproduce the fuel consumption. Kinetic intensity (KI) and maximum breaking acceleration (a-max) are the characteristic parameters that are less well reproduced by the driving cycles obtained.
From the 1000 driving cycles produced, we kept the one with the lowest RDi for each scenario (Figure 8). These driving cycles were used to design the optimum electrified power train.

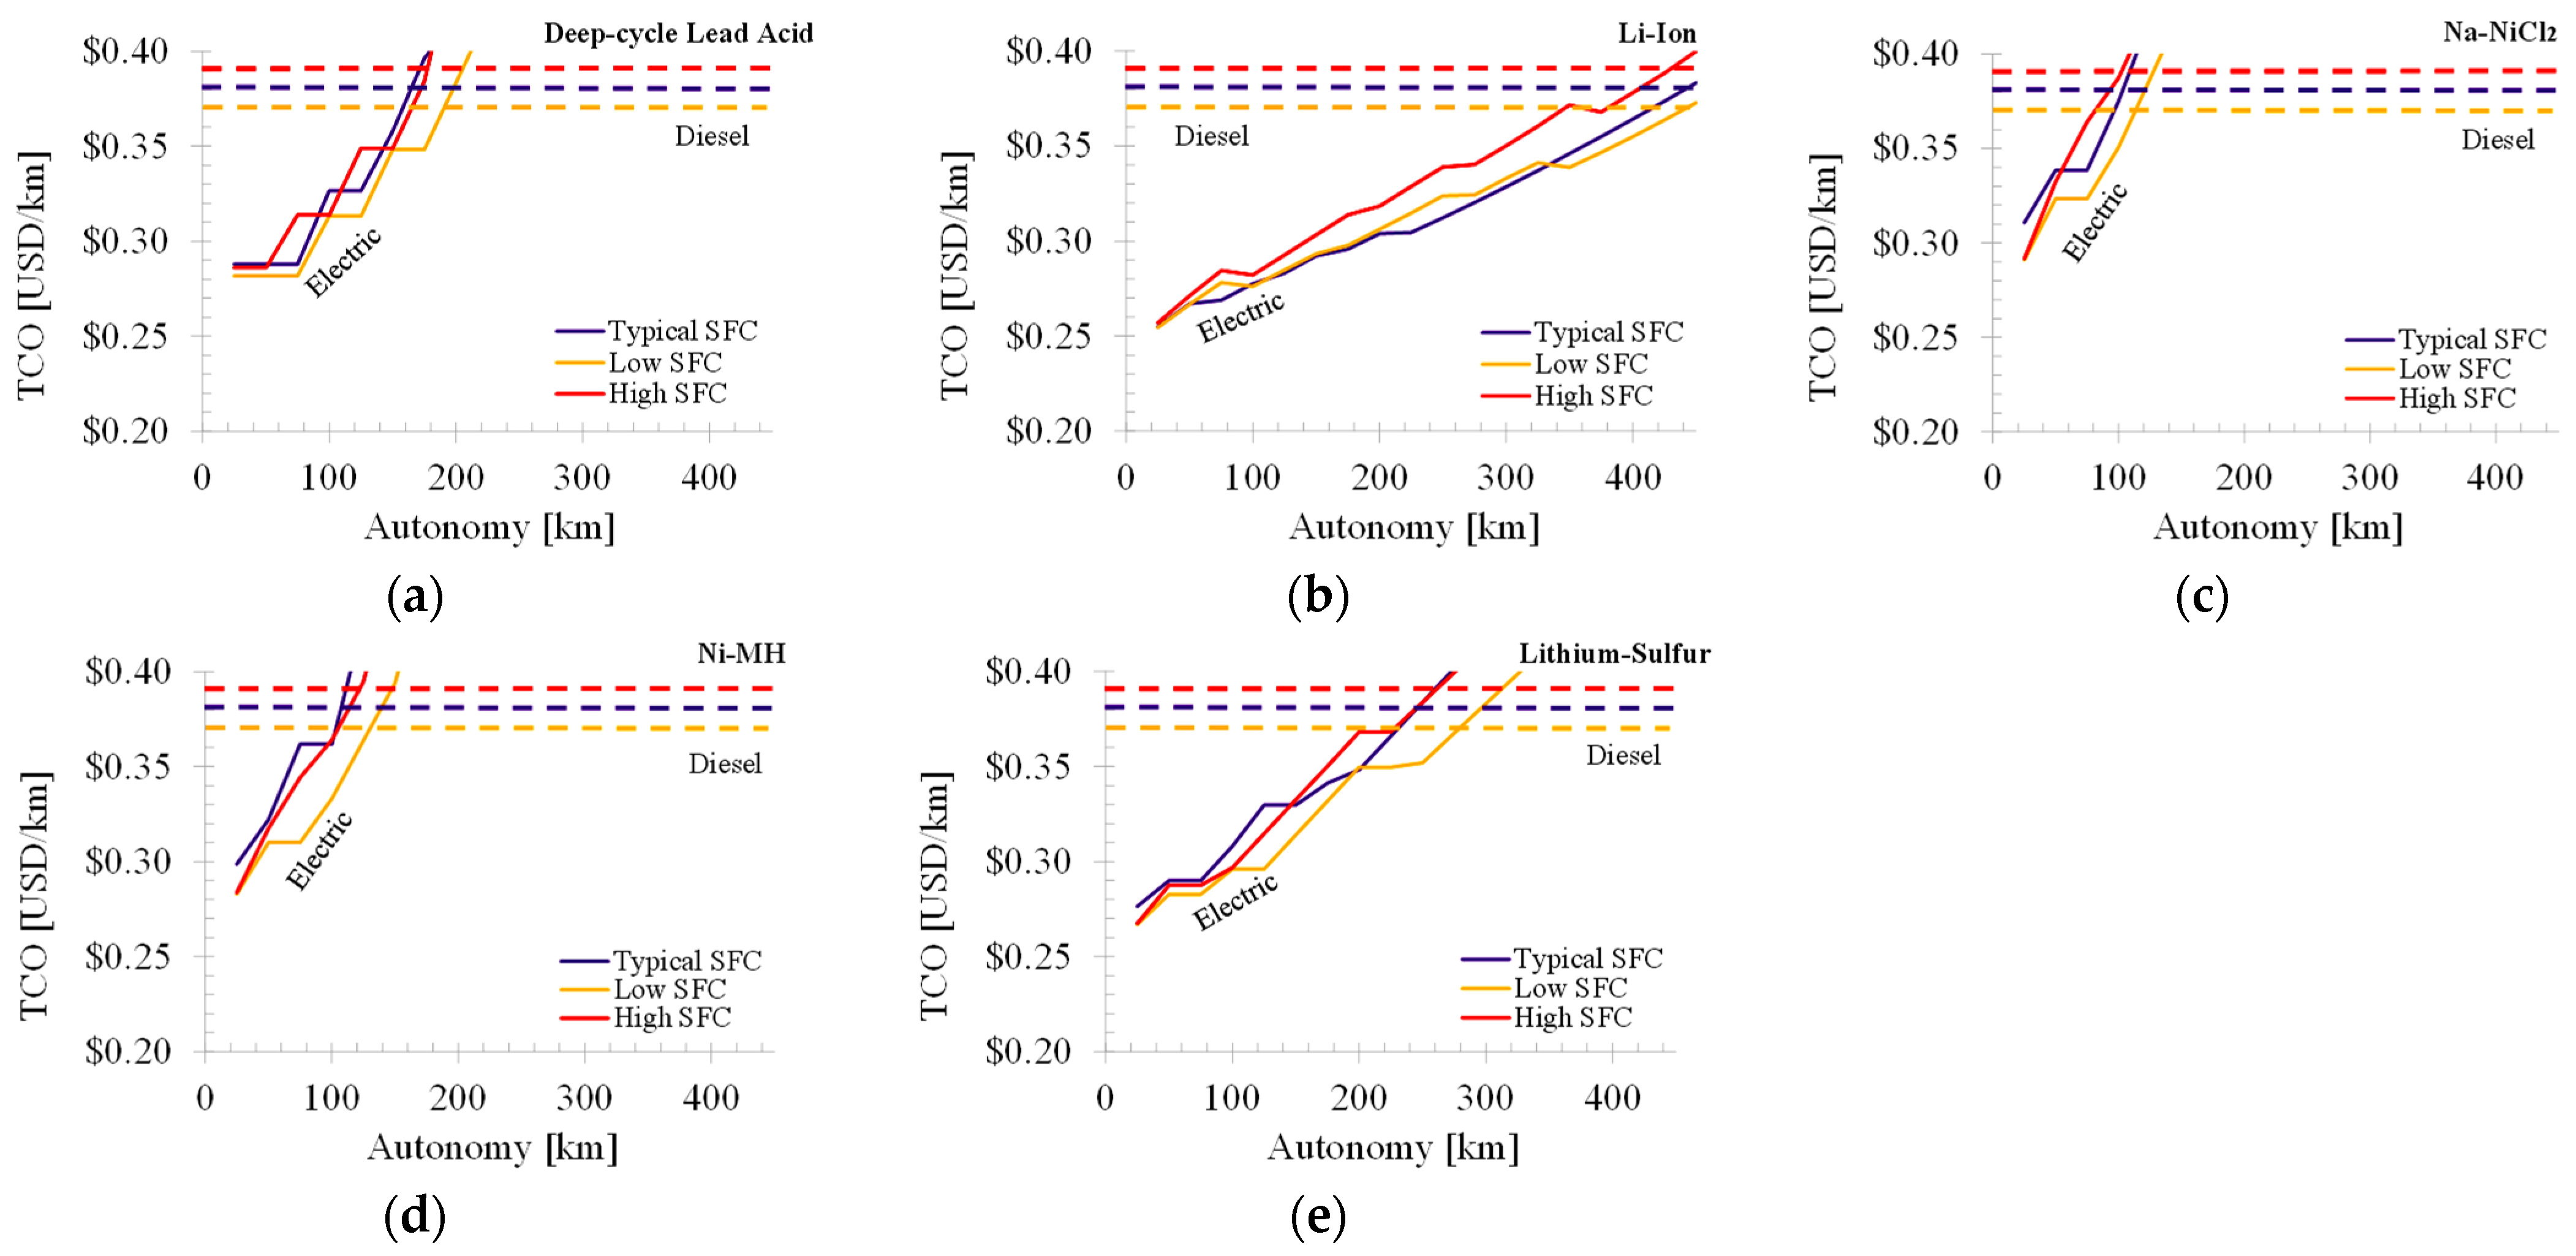
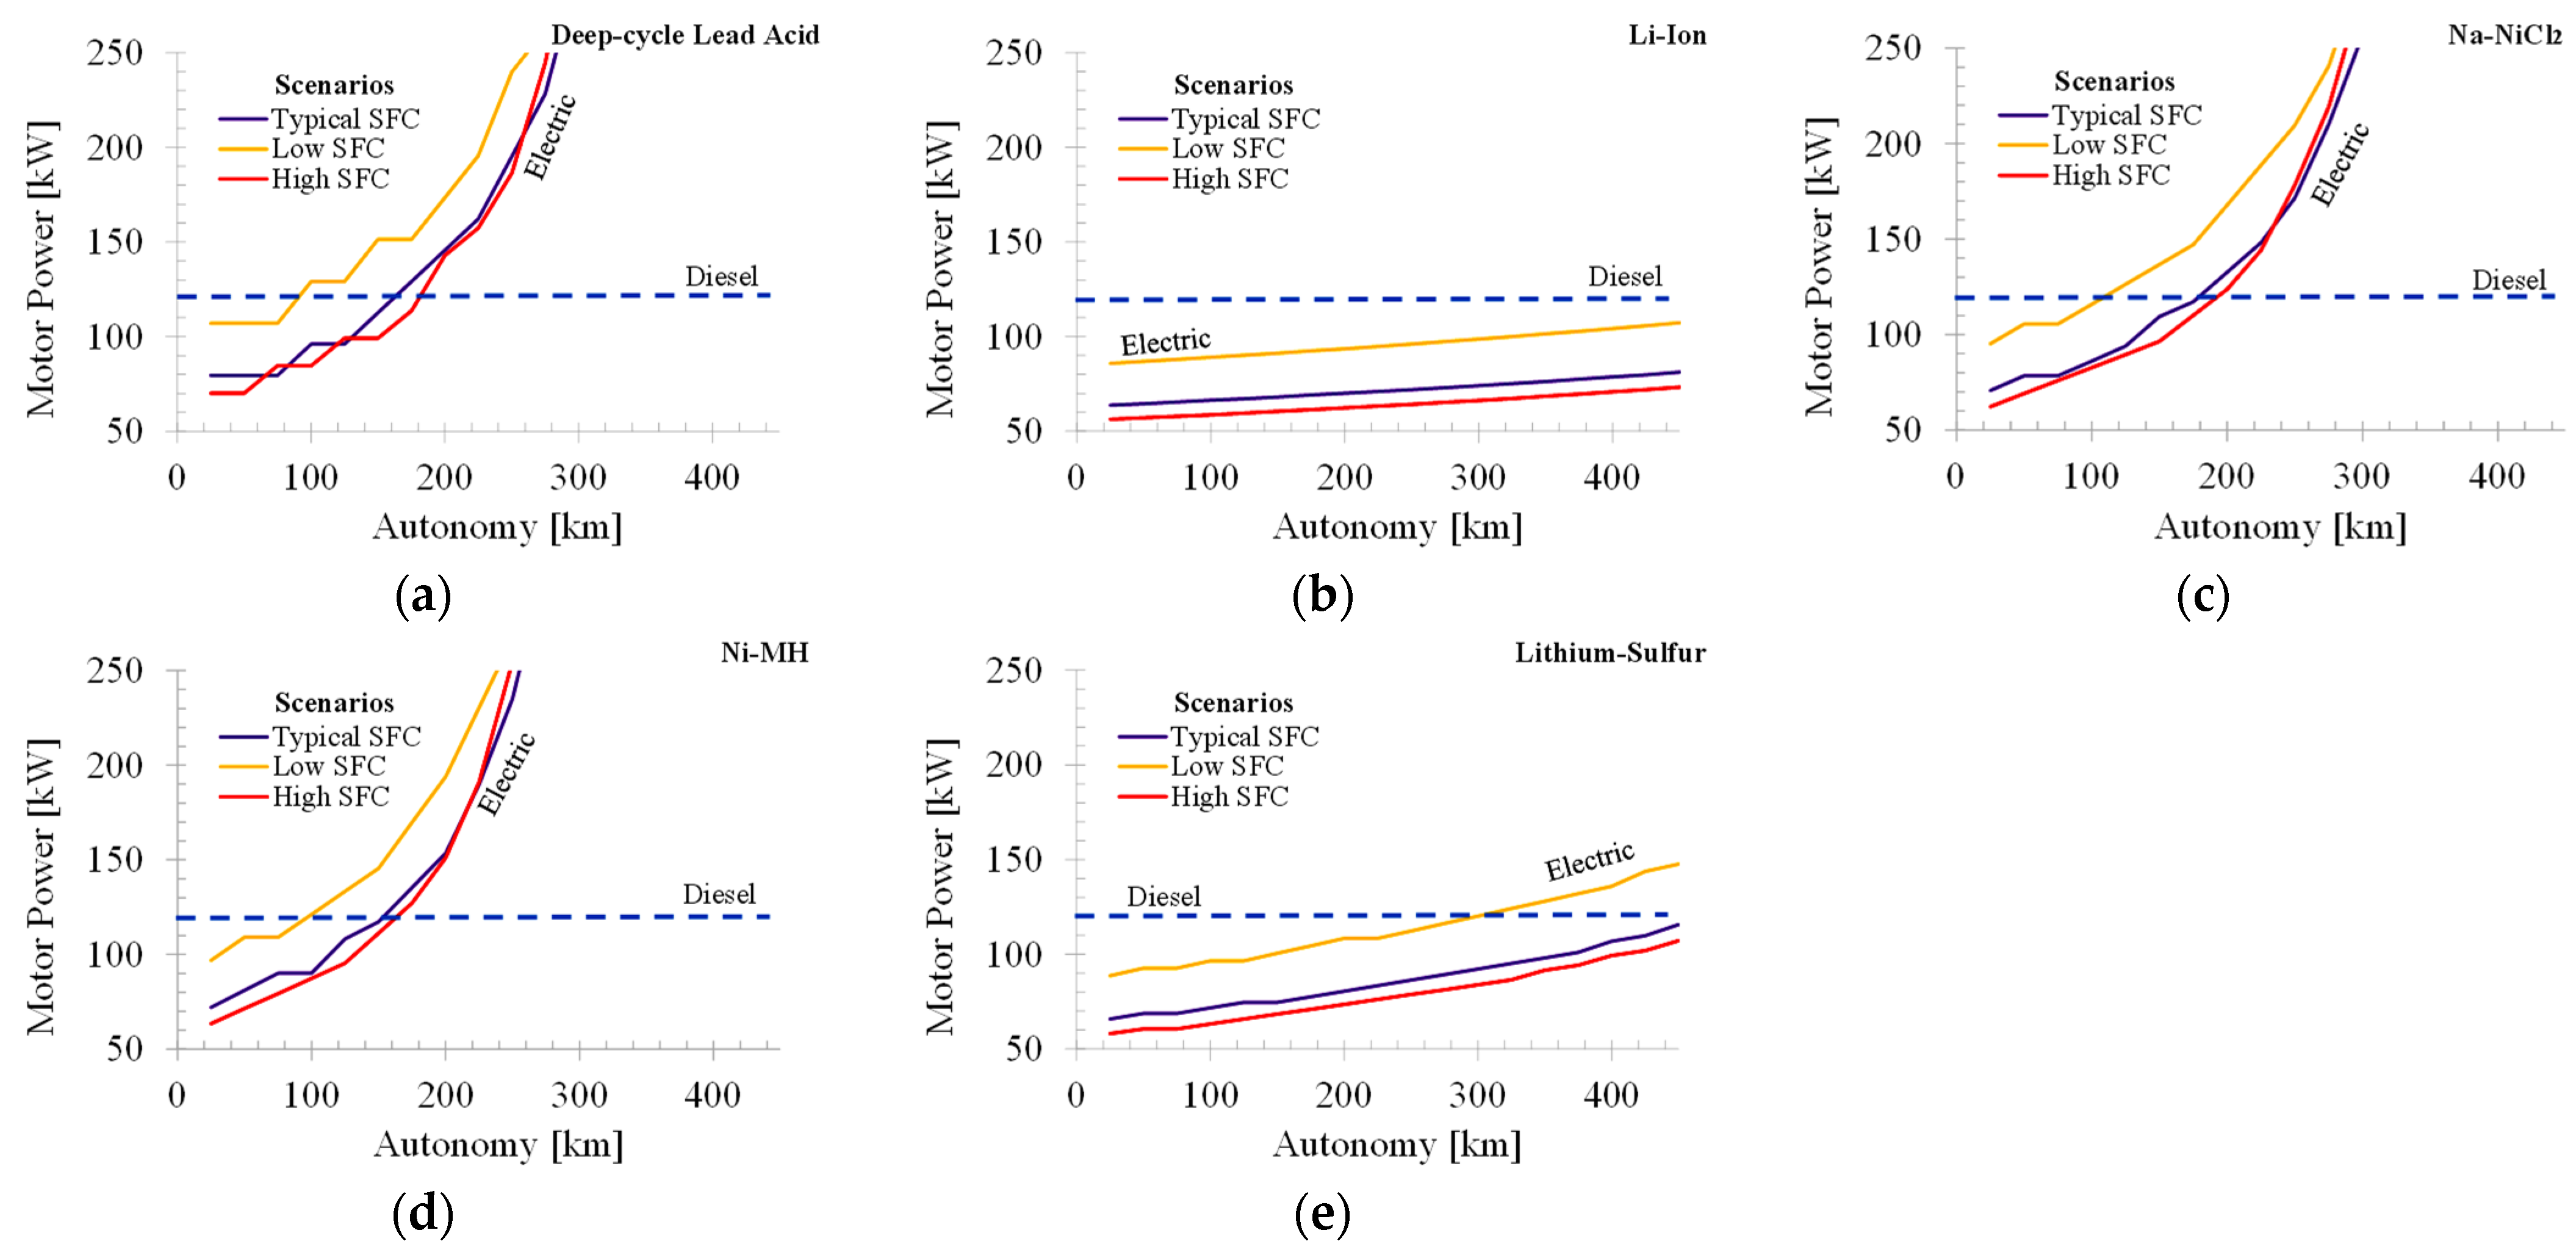
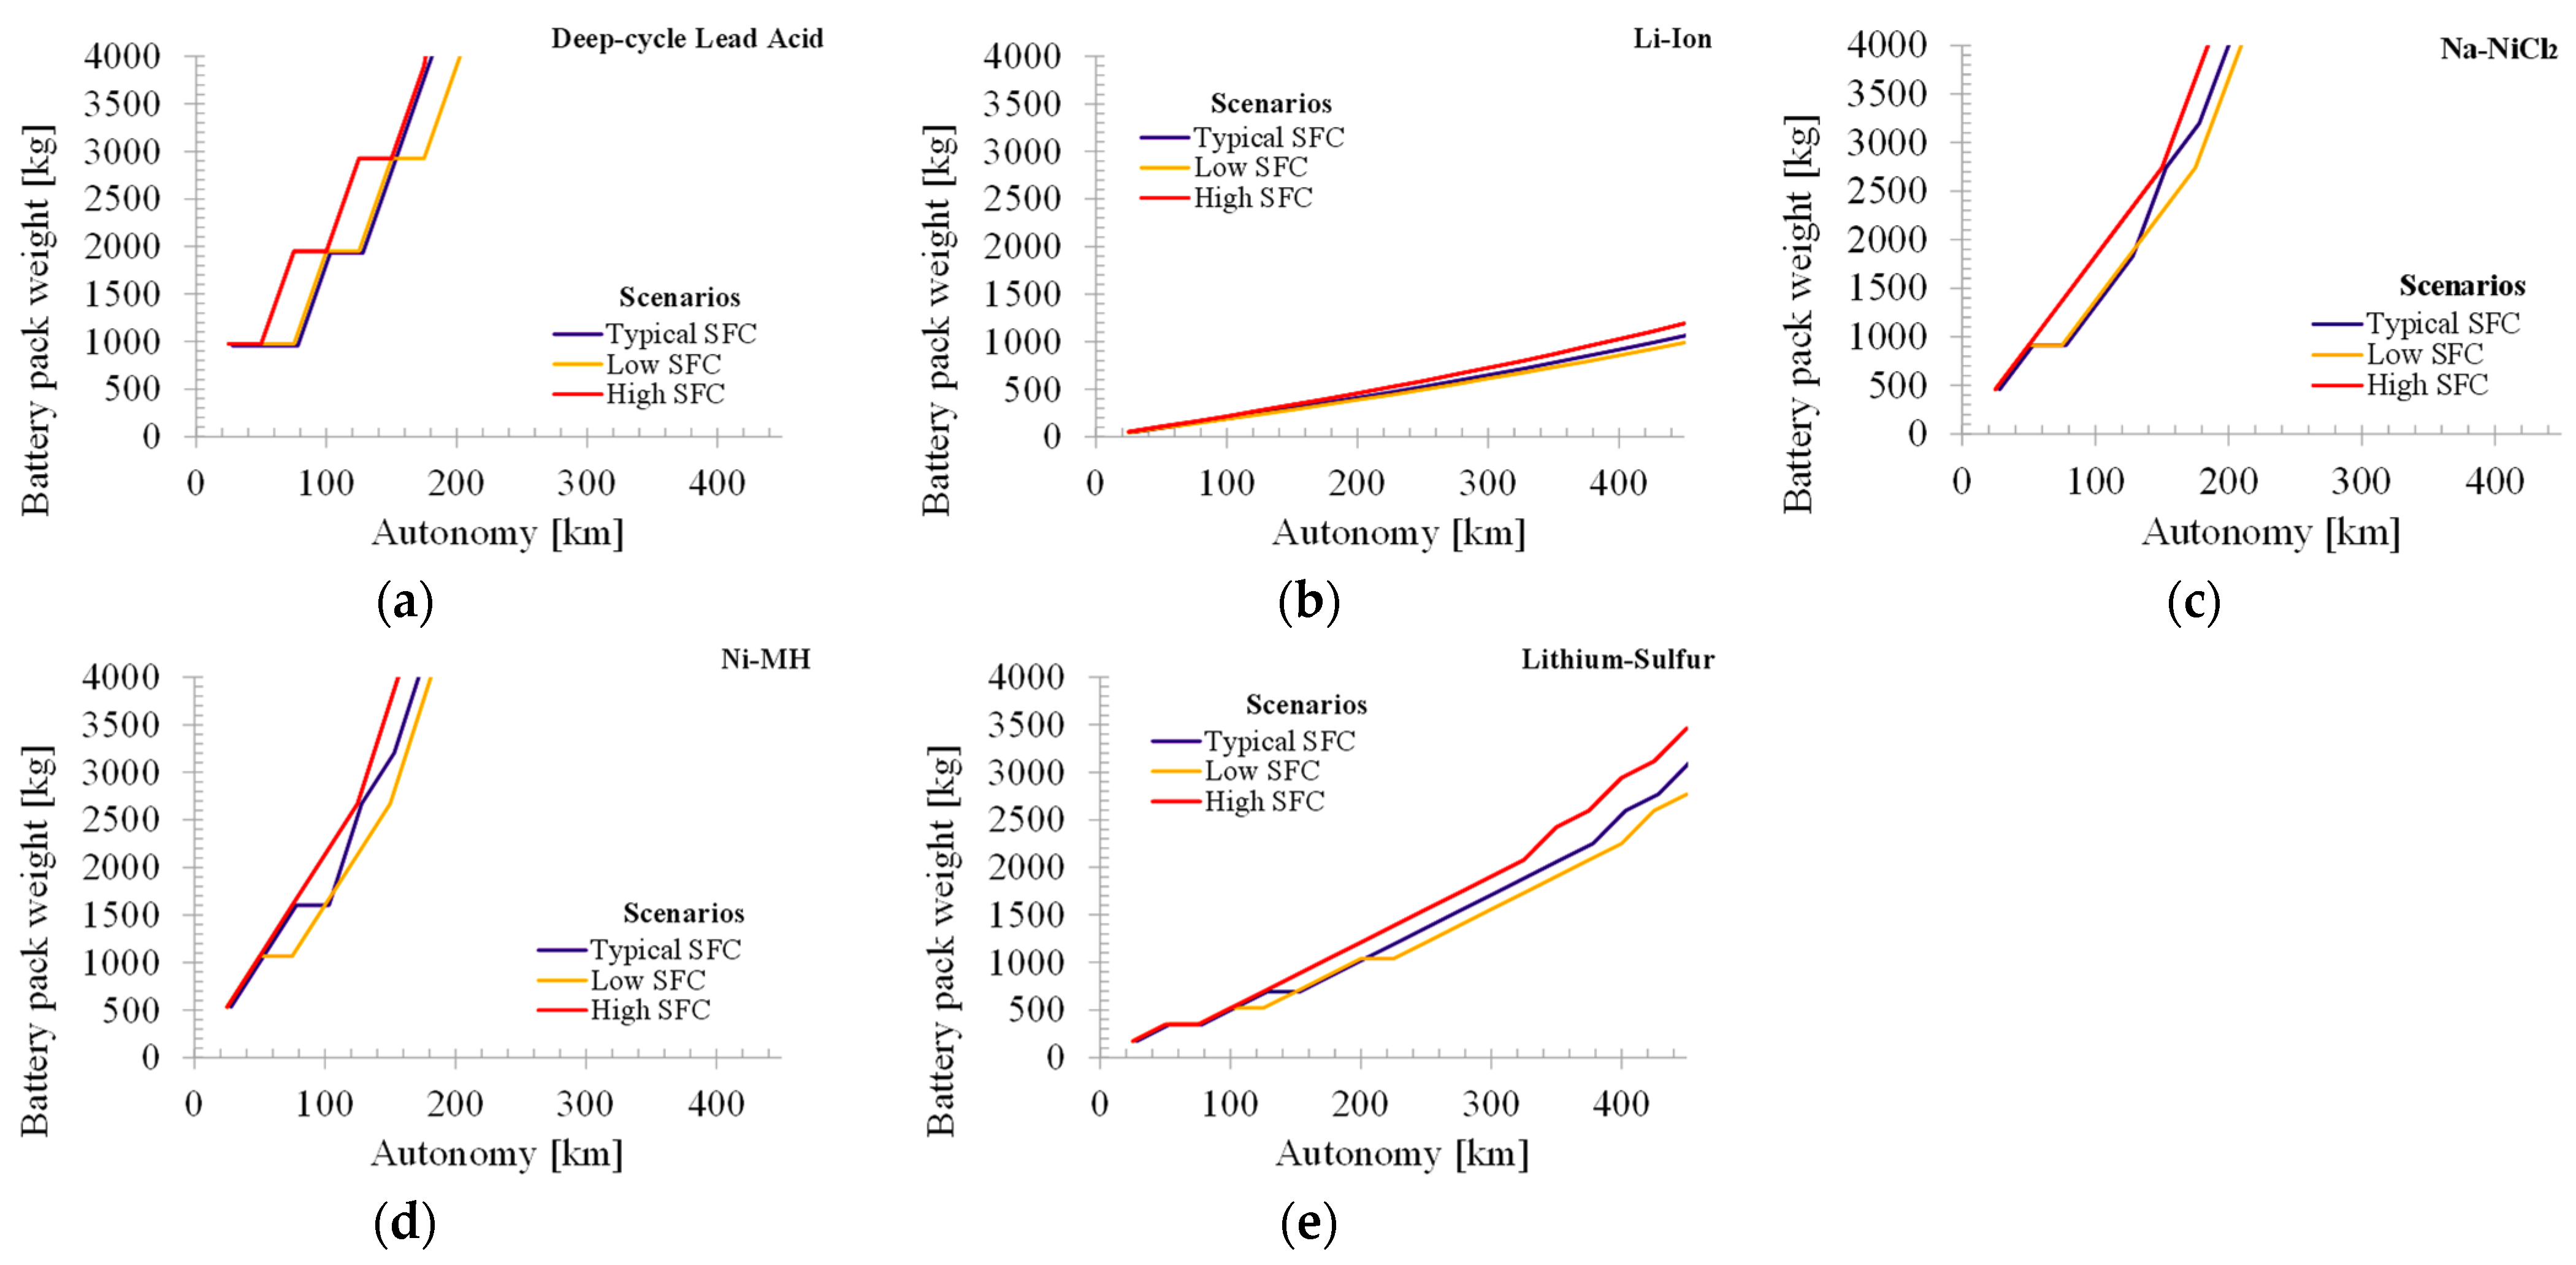
3.3. Multi-Objective Powertrain Optimization

Next, using the iterative energy-based approach previously described, the effect of varying the ratio between gears ( k ) on the vehicle performance metrics is shown in Figure 9 for the case of a 50 km autonomy. A compromise is evident between the power, acceleration capacity, maximum speed, and the energy consumed of the vehicle when varying the ratio between gears, with marked differences between every SFC scenario considered (Figure A1). The optimization made is based on the relevance of the weighted-sum approach of the variables described in Table 2 to minimize the power and energy consumed by the motor (and consequently its cost), while at the same time maximizing the acceleration capacity and maximum vehicle speed. The CO2 net emissions and the operating cost are defined by their specific energy consumption.
Based on the weighted factors of Table 2 and the results shown in Figure 9, the optimum k found for the low SFC, typical SFC, and high SFC scenarios are 0.53, 0.46, and 0.7, respectively. With this ratio between gears, and keeping in mind that the vehicle must work at the most energy-efficient speed range of the motor (between 10% and 50% of its maximum speed as shown in Figure 6), the gearbox ratios obtained are detailed in Table 6 for each SFC scenario. Under this transmission and gear shifting within the most energy-efficient speed range of the motor, the number of batteries required, acceleration capacity, CO2 net emissions, autonomy, and TCO were determined and are specified in Table 7.
Figure 10 shows the relative differences of each vehicle’s performance metric when compared to its diesel counterpart. In these figures, positive values indicate the parameter has improved, whereas negative values indicate it has worsened. For every case, the autonomy surpasses the previously defined minimum range of 50 km. This figure highlights the relevance of battery technology in vehicle performance. Lithium-ion batteries, despite their high cost, enable the largest savings in TCO along with the best performance of the vehicle in terms of acceleration capacity, top speed, and CO2 emissions.
Finally, Figure 11 shows TCO, required motor power, and the battery pack weight as a function of autonomy considering all five battery technologies and three SFC scenarios. This figure shows that for this vehicle, under the considerations specified above and with an optimized powertrain, the TCO can be even better under low autonomies in every battery technology and driving profile than its diesel counterpart. In both of the lithium-based batteries considered, the electric bus TCO can be even better than that of the diesel bus in autonomies up to 100 km. Figure 11 shows that by using high-density batteries (Figure 11b,e), the TCO becomes favorable (<TCO for diesel vehicles) for even long-range autonomies (~500 km). For CircuitoTec, each route has approximate distances of 25 km, and therefore a range of 50+ km is reasonable. Therefore, for this application, the operation of passenger transport with electric buses is not only feasible, but it is also a better choice with all the batteries considered. Results shown in Figure 11 demonstrate that the motor size increases drastically with autonomy, especially when the batteries used have low energy density. This is a secondary effect of the weight increase because of the batteries needed to increase the autonomy. These results highlight the need for batteries with high energy density for the operation of HDVs. Finally, Figure 11 also shows that tailoring the objective autonomy to a specific application is an excellent alternative to obtain reduced TCO. However, for low autonomies, the opportunity recharge energy management strategy is labor intensive. This implies that selecting the energy management strategy requires an evaluation that considers the conditions of each country.
Finally, and contrary to expectations, Figure A2, Figure A3 and Figure A4 show that the results obtained are not highly sensitive to the driving style. However, this result should be regarded carefully because our results for gentle, typical, and aggressive driving styles were taken from operators trained with eco-driving techniques and many years of experience driving the vehicles that we monitored. Therefore, they may not be a good example of the aggressive driving styles that may be encountered in other conditions.

4. Conclusions

Electrification of the road transport of passengers and goods by heavy-duty vehicles is a key strategy to reduce the high levels of air pollution found in large urban centers, especially in Latin American cities where most people move using buses. However, the high investment cost of commercially available electrified heavy-duty vehicles has limited its adoption. We hypothesized that there are applications or niches where the operation with electrified vehicles results in a lower total cost of ownership and a high reduction in air pollutants, with an even better performance in acceleration capacity and energy use. One of those niches is the urban transportation services carried out currently with diesel-fueled buses under fixed routes with short spans (<50 km). However, this would require a tailored configuration of the electrified vehicle powertrain for that specific application and an appropriate energy management strategy.
With the aim of confirming this hypothesis, in this work we designed the powertrain configuration (motor, battery, and gearbox) and energy management strategy that minimizes TCO, CO2 emissions while maximizing acceleration capacity and energy efficiency for electrified HDVs that operate under fixed routes with a relatively small length (<50 km). A step-by-step description of the methodology is presented, considering a university shuttle service as the case study.
Using classical vehicle dynamics and a double loop multi-objective optimization with a weighted-sum approach, the best electric powertrain configurations for the university shuttle service CircuitoTec were determined based on three driving style scenarios (aggressive, normal, and moderate). The results for the normal driving style show that the optimal powertrain includes an electric motor of 65 kW, 236 Nm, with 2158 Li-Ion batteries and a four-gear geometric transmission with a gear ratio of k = 0.46. This vehicle will weigh 2.3 t and accelerate from 0 to 70 km/h in 15 s, emit 474 gCO2/km when considering electricity produced through coal, and will exhibit a TCO = 0.27 USD/km with an autonomy of ~60 km. These values are a significant improvement over its diesel counterpart. It reduces the emission of greenhouse gases by 31% and TCO by 29%.
However, the results differ substantially depending on the battery technology considered. In this work, results were especially promising when using lithium-based batteries (Li-Ion and lithium-sulfur). With these batteries, the TCO of the electric alternative was a better option for autonomies under 400 km. However, this was not the case when considering the other battery technologies.

Author Contributions

Conceptualization, J.I.H., A.E.M. and J.P.J.; methodology, J.I.H., A.E.M. and J.P.J.; software, J.I.H., A.E.M. and J.P.J.; validation, J.I.H. and A.E.M.; formal analysis, J.I.H., A.E.M. and J.P.J.; investigation, J.I.H., A.E.M. and J.P.J.; resources, J.I.H.; data curation, A.E.M. and J.P.J.; writing—original draft preparation, A.E.M. and J.I.H.; writing—review and editing, J.I.H.; visualization, J.I.H., A.E.M. and J.P.J.; supervision, J.I.H.; project administration, J.I.H.; funding acquisition, J.I.H. All authors have read and agreed to the published version of the manuscript.

Funding

This research was funded by the United Nations Environment Programme (UNEP), Programa Iberoamericano de Ciencia y Tecnología para el Desarrollo (CYTED), Red Latinoamericana de Investigación en Energía y Vehiculos (RELIEVE), and by Consejo Nacional de Ciencia y Tecnología (CONACYT).

Conflicts of Interest

The authors declare no conflict of interest. The funders had no role in the design of the study; in the collection, analyses, or interpretation of data; in the writing of the manuscript, or in the decision to publish the results.

Appendix A

Figure A1. Effect of varying the ratio between gears ( k ) in the different SFC scenarios for (a) acceleration capacity, (b) maximum speed, (c) maximum power required for the motor, and (d) CO2 emissions.
Wevj 13 00029 g0a1
Figure A2. Impact of the desired minimum autonomy on the TCO considering (a) deep-cycle lead acid, (b) Li-Ion, (c) Na-NiCl2, (d) Ni-MH, and (e) lithium-sulfur batteries for low SFC, typical SFC, and high SFC scenarios. Note: Skipped lines correspond to the diesel configuration; Solid lines correspond to the electric configuration.
Wevj 13 00029 g0a2
Figure A3. Impact of the desired minimum autonomy on the minimum motor power required considering (a) deep-cycle lead acid, (b) Li-Ion, (c) Na-NiCl2, (d) Ni-MH, and (e) lithium-sulfur batteries for low SFC, typical SFC, and high SFC scenarios.
Wevj 13 00029 g0a3
Figure A4. Impact of the desired minimum autonomy on the battery pack weight required considering (a) deep-cycle Lead Acid, (b) Li-Ion, (c) Na-NiCl2, (d) Ni-MH, and (e) lithium-sulfur batteries for low SFC, typical SFC, and high SFC scenarios.
Wevj 13 00029 g0a4

References

  1. World Health Organization. Ambient (Outdoor) Air Pollution. In Key Facts; World Health Organization: Geneva, Switzerland, 2021; Available online: https://www.who.int/news-room/fact-sheets/detail/ambient-(outdoor)-air-quality-and-health (accessed on 5 December 2021).
  2. World Health Organization. New WHO Global Air Quality Guidelines aim to save millions of lives from air pollution. In Air Pollution is One of the Biggest Environmental Threats to Human Health, Alongside Climate Change; World Health Organization: Geneva, Switzerland, 2021; Available online: https://www.who.int/news/item/22-09-2021-new-who-global-air-quality-guidelines-aim-to-save-millions-of-lives-from-air-pollution (accessed on 5 December 2021).
  3. Ramírez-Moreno, M.A.; Keshtkar, S.; Padilla-Reyes, D.A.; Ramos-López, E.; García-Martínez, M.; Hernández-Luna, M.C.; Mogro, A.E.; Mahlknecht, J.; Huertas, J.I.; Peimbert-García, R.E. Sensors for sustainable smart cities: A review. Appl. Sci. 2021, 11, 8198. [Google Scholar] [CrossRef]
  4. The International Council on Clean Transportation. Update on Electric Vehicle Costs in the United States through 2030. 2019. Available online: https://theicct.org/sites/default/files/publications/EV_cost_2020_2030_20190401.pdf (accessed on 8 December 2021).
  5. IEA, C.E.M. Global EV Outlook 2020. Available online: https//www.iea.org/reports/global-ev-outlook-2020 (accessed on 8 December 2021).
  6. International Energy Agency. CO2 Emissions from Fuel Combustion-Overview 2017; International Energy Agency: Washington, DC, USA, 2017. [Google Scholar]
  7. Franckx, L. Total Cost of Ownership of Electric Cars Compared to Diesel and Gasoline Cars in Belgium; FPB: Brussels, Belgium, 2019. [Google Scholar]
  8. Catenacci, M.; Fiorese, G.; Verdolini, E.; Bosetti, V. Going electric: Expert survey on the future of battery technologies for electric vehicles. In Innovation under Uncertainty; Edward Elgar Publishing: Cheltenham, UK, 2015. [Google Scholar]
  9. Conti, M.; Kotter, R.; Putrus, G. Energy efficiency in electric and plug-in hybrid electric vehicles and its impact on total cost of ownership. In Electric Vehicle Business Models; Springer: Berlin, Germany, 2015; pp. 147–165. [Google Scholar]
  10. Iclodean, C.; Varga, B.; Burnete, N.; Cimerdean, D.; Jurchiş, B. Comparison of different battery types for electric vehicles. IOP Conf. Ser. Mater. Sci. Eng. 2017, 252, 12058. [Google Scholar] [CrossRef] [Green Version]
  11. Gao, Z.; Lin, Z.; LaClair, T.J.; Liu, C.; Li, J.-M.; Birky, A.K.; Ward, J. Battery capacity and recharging needs for electric buses in city transit service. Energy 2017, 122, 588–600. [Google Scholar] [CrossRef] [Green Version]
  12. MXylia, M.; Leduc, S.; Patrizio, P.; Kraxner, F.; Silveira, S. Locating charging infrastructure for electric buses in Stockholm. Transp. Res. Part C Emerg. Technol. 2017, 78, 183–200. [Google Scholar]
  13. Živanović, Z.; Nikolić, Z.; Nikolić, Z.; Živanović, Z. The application of electric drive technologies in city buses. In New Generation of Electric Vehicles; IntechOpen: London, UK, 2016; pp. 27–66. [Google Scholar]
  14. Tang, X.; Lin, X.; He, F. Robust scheduling strategies of electric buses under stochastic traffic conditions. Transp. Res. Part C Emerg. Technol. 2019, 105, 163–182. [Google Scholar] [CrossRef]
  15. Puma-Benavides, D.S.; Izquierdo-Reyes, J.; Calderon-Najera, J.D.; Ramirez-Mendoza, R.A. A Systematic Review of Technologies, Control Methods, and Optimization for Extended-Range Electric Vehicles. Appl. Sci. 2021, 11, 7095. [Google Scholar] [CrossRef]
  16. Hamza, K.; Laberteaux, K.P.; Willard, J.; Chu, K.-C. A Pareto Trade-Off Analysis of Cost Versus Greenhouse Gas Emissions for a Model of a Mid-Sized Vehicle with Various Powertrains. In Proceedings of the International Design Engineering Technical Conferences and Computers and Information in Engineering Conference, Quebec City, QC, Canada, 26–29 August 2018; Volume 51753, p. V02AT03A025. [Google Scholar]
  17. Ribau, J.P.; Silva, C.M.; Sousa, J.M.C. Efficiency, cost and life cycle CO2 optimization of fuel cell hybrid and plug-in hybrid urban buses. Appl. Energy 2014, 129, 320–335. [Google Scholar] [CrossRef]
  18. Yong, J.Y.; Ramachandaramurthy, V.K.; Tan, K.M.; Mithulananthan, N. A review on the state-of-the-art technologies of electric vehicle, its impacts and prospects. Renew. Sustain. Energy Rev. 2015, 49, 365–385. [Google Scholar] [CrossRef]
  19. Puma-Benavides, D.S.; Izquierdo-Reyes, J.; Galluzzi, R.; Calderon-Najera, J.D. Influence of the Final Ratio on the Consumption of an Electric Vehicle under Conditions of Standardized Driving Cycles. Appl. Sci. 2021, 11, 1474. [Google Scholar] [CrossRef]
  20. Hofstetter, M.; Lechleitner, D.; Hirz, M.; Gintzel, M.; Schmidhofer, A. Multi-objective gearbox design optimization for xEV-axle drives under consideration of package restrictions. Forsch. Im Ing. 2018, 82, 361–370. [Google Scholar] [CrossRef] [Green Version]
  21. Nicoletti, L.; Ostermann, F.; Heinrich, M.; Stauber, A.; Lin, X.; Lienkamp, M. Topology analysis of electric vehicles, with a focus on the traction battery. Forsch. Im Ing. 2021, 85, 457–467. [Google Scholar] [CrossRef]
  22. Chong, T.H.; Lee, J.-S. A Design Method of Gear Trains Using a Genetic Algorithm. Int. J. Precis. Eng. Manuf. 2000, 1, 62–70. [Google Scholar]
  23. Chandrasekaran, M.; Padmanabhan, S.; Raman, V.S. Single speed gearbox optimization using genetic algorithm. J. Eng. Appl. Sci. 2015, 10, 5506–5511. [Google Scholar]
  24. Deb, K.; Jain, S. Multi-speed gearbox design using multi-objective evolutionary algorithms. J. Mech. Des. 2003, 125, 609–619. [Google Scholar] [CrossRef] [Green Version]
  25. Schiffer, S.; Kain, A.; Wilde, P.; Haber, J.; Helbing, M.; Baeker, B. Influence of the final drive ratio on the consumption of passenger cars under real driving conditions. In Proceedings of the 2017 Twelfth International Conference on Ecological Vehicles and Renewable Energies (EVER), Monte Carlo, Monaco, 11–13 April 2017; pp. 1–11. [Google Scholar] [CrossRef]
  26. Brooker, A.; Gonder, J.; Wang, L.; Wood, E.; Lopp, S.; Ramroth, L. FASTSim: A Model to Estimate Vehicle Efficiency, Cost and Performance; SAE Technical Paper; SAE: Warrendale, PA, USA, 2015. [Google Scholar]
  27. Davis, K.; Hayes, J.G. Analysis of electric vehicle powertrain simulators for fuel consumption calculations. In Proceedings of the 2016 International Conference on Electrical Systems for Aircraft, Railway, Ship Propulsion and Road Ve-hicles & International Transportation Electrification Conference (ESARS-ITEC), Toulouse, France, 2–4 November 2016; pp. 1–6. [Google Scholar]
  28. Ng, C.W.; Yossapong, L. Comparison of Electric Bus Power Consumption Modelling and Simulation Using Basic Power Model, ADVISOR and FASTSim. In Proceedings of the 2020 2nd International Conference on Smart Power & Internet Energy Systems (SPIES), Bangkok, Thailand, 15–18 September 2020; pp. 414–419. [Google Scholar]
  29. Verbruggen, F.; Salazar, M.; Pavone, M.; Hofman, T. Joint Design and Control of Electric Vehicle Propulsion Systems. In Proceedings of the 2020 European Control Conference (ECC), St. Petersburg, Russia, 12–15 May 2020; pp. 1725–1731. [Google Scholar] [CrossRef]
  30. Mahmoud, M.; Garnett, R.; Ferguson, M.; Kanaroglou, P. Electric buses: A review of alternative powertrains. Renew. Sustain. Energy Rev. 2016, 62, 673–684. [Google Scholar] [CrossRef]
  31. Electric Vehicle Database. Energy Consumption of Full Electric Vehicles. In Fully Charged-Official Data Partner; EV Database: London, UK, 2022; Available online: https://ev-database.org/cheatsheet/energy-consumption-electric-car (accessed on 15 January 2022).
  32. Weiss, M.; Cloos, K.C.; Helmers, E. Energy efficiency tradeoffs in small to large electric vehicles. Environ. Sci. Eur. 2020, 32, 46. [Google Scholar] [CrossRef] [Green Version]
  33. Australian Bureau of Statistics. 2071.0.55.001-Census of Population and Housing: Commuting to Work-More Stories from the Census, 2016. 2018. Available online: https://www.abs.gov.au/ausstats/[email protected]/PrimaryMainFeatures/2071.0.55.001?OpenDocument (accessed on 10 January 2022).
  34. ABC News. A Look Under the Hood of a Nation on Wheels. 2005. Available online: https://abcnews.go.com/images/Politics/973a2Traffic.pdf (accessed on 10 January 2022).
  35. SME News. New Survey Reveals Large Regional Differences in Workers’ Commuting Experience; AI Global Media Ltd.: Staffordshire, UK, 2019; Available online: https://www.sme-news.co.uk/new-survey-reveals-large-regional-differences-in-workers-commuting-experience/ (accessed on 10 January 2021).
  36. SCT. Estadística Básica del Autotransporte Federal; SCT: Mexico City, Mexico, 2021. [Google Scholar]
  37. Tecnologico de Monterrey. Circuito Tec: Rutas y Horarios. Movilidad. 2017. Available online: https://movilidad.mty.itesm.mx/circuitotec/index.php (accessed on 11 January 2022).
  38. Quirama, L.F.; Giraldo, M.; Huertas, J.I.; Tibaquirá, J.E.; Cordero-Moreno, D. Main characteristic parameters to describe driving patterns and construct driving cycles. Transp. Res. Part D Transp. Environ. 2021, 97, 102959. [Google Scholar] [CrossRef]
  39. Barlow, T.J.; Latham, S.; McCrae, I.S.; Boulter, P.G. A Reference Book of Driving Cycles for Use in the Measurement of Road Vehicle Emissions; TRL: Berkshire, UK, 2009. [Google Scholar]
  40. Quirama, L.F.; Giraldo, M.; Huertas, J.I.; Jaller, M. Driving cycles that reproduce driving patterns, energy consumptions and tailpipe emissions. Transp. Res. Part D Transp. Environ. 2020, 82, 102294. [Google Scholar] [CrossRef]
  41. Johnson, R.; Kuby, P. Applied Example 2.15, The 85th Percentile Speed Limit: Going With 85% of the Flow. In Elementary Statistics, Enhanced Review Edition, 10th ed.; 2007 Cengage Learning, Ed.; LTU: Lincoln, NE, USA, 2007; p. 102. [Google Scholar]
  42. Louisiana State Police. Rational Speed Limits and the 85th Percentile Speed. 2018. Available online: https://web.archive.org/web/20180923093555/http://www.lsp.org/pdf/troopc85thSpeed.pdf (accessed on 11 January 2022).
  43. Gillespie, T.D. Fundamentals of Vehicle Dynamics; SAE Technical Paper; SAE: Warrendale, PA, USA, 1992. [Google Scholar]
  44. Guchen Industry. 20cc 320V Elecric Scroll Compressor. 2020. Available online: https://www.guchen-eac.com/what/high-voltage-electric-compressor/320v-electric-scroll-compressor.html (accessed on 11 January 2022).
  45. Mogro, A.E.; Huertas, J.I. Assessment of the effect of using air conditioning on the vehicle’s real fuel consumption. Int. J. Interact. Des. Manuf. 2021, 15, 271–285. [Google Scholar] [CrossRef]
  46. Evtimov, I.; Ivanov, R.; Sapundjiev, M. Energy consumption of auxiliary systems of electric cars. MATEC Web Conf. 2017, 133, 06002. [Google Scholar] [CrossRef]
  47. TROJAN Battery Company. MOTIVE T-1275 PLUS. In Deep-Cycle Flooded/Wet Lead-Acid Battery; Trojan Battery Company: Santa Fe Springs, CA, USA, 2019; Available online: http://www.trojanbattery.com/pdf/datasheets/T1275Plus_Trojan_Data_Sheets.pdf (accessed on 10 July 2021).
  48. Samsung SDI. Lithium-ion Rechargeable Cell MODEL Name: INR18650-35E. In Specification Of Product; Samsung SDI: Yongin, Korea, 2015; Available online: https://cdn.shopify.com/s/files/1/0481/9678/0183/files/samsung_35e_data_sheet.pdf?v=1605015771 (accessed on 10 July 2021).
  49. FCH JU. Urban Buses: Alternative Powertrains for Europe. In A Fact-Based Analysis of the Role of Diesel Hybrid, Hydrogen Fuel Cell, Trolley and Battery Electric Powertrains; McKinsey Company, Ed.; FCH JU—The Fuel Cells and Hydrogen Joint Undertaking: Brussels, Belgium, 2012. [Google Scholar]
  50. Miles, J.; Potter, S. Developing a viable electric bus service: The Milton Keynes demonstration project. Res. Transp. Econ. 2014, 48, 357–363. [Google Scholar] [CrossRef]
  51. Fotouhi, A.; Propp, K.; Auger, D.J. Electric vehicle battery model identification and state of charge estimation in real world driving cycles. In Proceedings of the 2015 7th Computer Science and Electronic Engineering Conference (CEEC), Colchester, UK, 24–25 September 2015; pp. 243–248. [Google Scholar]
  52. Yuksel, T.; Michalek, J.J. Effects of Regional Temperature on Electric Vehicle Efficiency, Range, and Emissions in the United States. Environ. Sci. Technol. 2015, 49, 3974–3980. [Google Scholar] [CrossRef] [PubMed]
  53. EV WEST. EV Conversion Kits. 2022. Available online: https://www.evwest.com/catalog/index.php?cPath=40 (accessed on 11 January 2022).
  54. ZVEI Die Elektroindustrie. Voltage Classes for Electric Mobility. 2013. Available online: https://www.zvei.org/fileadmin/user_upload/Presse_und_Medien/Publikationen/2014/april/Voltage_Classes_for_Electric_Mobility/Voltage_Classes_for_Electric_Mobility.pdf (accessed on 18 October 2021).
  55. Hi Performance Electric Vehicle Systems (HPEVS). Peak and continuous power graphs for AC motors. In HPEVS AC Standard Motors; HPEVS: Ontario, CA, USA, 2021; Available online: https://www.hpevs.com/hpevs-ac-electric-motors-power-graphs-ac-35.htm# (accessed on 9 July 2021).
  56. Battery Electric Vehicles (BEVs)–Not IF but WHEN? 2021. Available online: https://x-engineer.org/automotive-engineering/vehicle/electric-vehicles/battery-electric-vehicles-bev-automotive-industry/ (accessed on 9 July 2021).
  57. Prohaska, R.; Duran, A.; Ragatz, A.; Kelly, K. Statistical Characterization of Medium-Duty Electric Vehicle Drive Cycles; National Renewable Energy Lab. (NREL): Golden, CO, USA, 2015.
Figure 1. Region of study. Source: Google Maps.
Wevj 13 00029 g001
Figure 2. CircuitoTec shuttle service routes.
Wevj 13 00029 g002
Figure 3. Energy-Based Micro-Trip method used to construct representative driving cycles. Authors’ elaboration based on [40].
Wevj 13 00029 g003
Figure 4. BEV SM-SA topology illustration.
Wevj 13 00029 g004
Figure 5. Illustration of the multi-objective optimization process to obtain the best powertrain configuration for a given application and given autonomy.
Wevj 13 00029 g005
Figure 6. Typical AC electric motor (a) performance and (b) efficiency as a function of the motor rotating speed. Source: authors’ elaboration based on HPEVS AC motors [55,56].
Wevj 13 00029 g006
Figure 7. Dispersion of the relative differences (RD) of the CPs* obtained from the 1000 DCs constructed from the CPs of the driving pattern for (a) low SFC, (b) typical SFC, and (c) high SFC scenarios. * The building criterion considers the Specific Fuel Consumption (SFC), percentage in idling (% idling) and average speed (speed ave) parameters.
Wevj 13 00029 g007
Figure 8. CircuitoTec representative Driving Cycle for (a) low SFC, (b) typical SFC, and (c) high SFC scenarios.
Wevj 13 00029 g008
Figure 9. Effect of varying the ratio between gears ( k ) on the vehicle performance metrics for (a) low SFC, (b) typical SFC, and (c) high SFC scenarios for the case of 50 km autonomy. Note: Skipped lines represent the best k value obtained in each scenario.
Wevj 13 00029 g009
Figure 10. The relative difference between electrical and original configurations for (a) low SFC, (b) typical SFC, and (c) high SFC scenarios. Note: Values obtained with lithium-ion (Li-Ion) batteries are highlighted.
Wevj 13 00029 g010
Figure 11. Impact of the desired autonomy on the TCO due to changes in motor and battery pack requirements considering (a) deep-cycle lead acid, (b) Li-Ion, (c) Na-NiCl2, (d) Ni-MH, and (e) lithium-sulfur batteries for low SFC, typical SFC, and high SFC scenarios.
Wevj 13 00029 g011
Table 1. Shuttle service vehicle specifications.
VehicleMercedes-Benz Sprinter
DrivetrainRear Wheel Drive
Engine type and fuel4 cylinders inline, Intercooled Turbo Diesel EURO V
Gross vehicle weight (kg)4100
Engine displacement (cm³)2143
Engine rated power (kW)/(HP)120 (163) @ 3800 RPM
Rated torque (Nm)380 @ 2000 RPM
Transmission gearboxECO Gear 360 6-speed manual transmission
Table 2. Relevant performance metrics.
Acc.
Capacity
Spec. Energy
Consumption
CO2
Emissions
Motor Power NeededTCO
[s][kWh/km][gCO2/km][kW][USD/km]
Weight20%30%10%10%30%
Table 3. Batteries’ specifications.
Deep Cycle Lead Acid 1Li-Ion 1Na-NiCl2 2Ni-MH 2Lithium-Sulfur 2
Nominal Voltage [V]12.003.6289288305
Capacity [Ah]166.003.50848580
Weight [kg]39.000.045457534173
Volume [L]16.200.02---
Battery Energy [Wh]19921324,27624,48024,400
Specific Energy [Wh/kg]183.881008191.23165.03507.75
Price per unit [USD]499.002.4514,40311,6197238
Price per kWh [USD/kWh]250.50194.44593.33474.66296.66
Characteristics based on an individual battery 1 or the entire 300 V battery rack 2.
Table 4. TCO considerations for the case study.
Assumptions Included in the TCO Calculation
Because the electric bus is intended to run under the same operating conditions (driving cycle) of the current diesel buses, the distance driven by the vehicle per year and driver’s salary will remain equal to the diesel counterpart.
A ten-year lifetime expectancy was considered for both the diesel and electric bus.
Penalties for vehicles that produce on-road emissions were not considered.
No government incentives for purchasing an electric vehicle were considered.
Insurance of the diesel bus is considered to be 25% lower than the electric counterpart.
One charging station investment is considered, and its annual maintenance cost.
The battery pack is replaced depending on the lifespan of the battery. One thousand cycles were considered for the lifespan of the batteries. When replaced, a 20% expected increase in prices with a 4% price inflation rate per year was included. A salvage value of 80% for the used batteries is considered with this strategy.
The vehicle (diesel and electric) is depreciated by 20% of its current value every year, resulting in a 13% salvage value after 10 years of lifespan.
80% of the initial investment cost is financed through a 5-year loan.
The tax rate of 30%, cost of debt of 3.27%, risk-free rate of 4.5%, and Equity Risk Premium (ERP) of 5% are considered.
The Net Present Value (NPV) was estimated with a discount rate of 9.22% based on a weighted average cost of capital (WACC) approach.
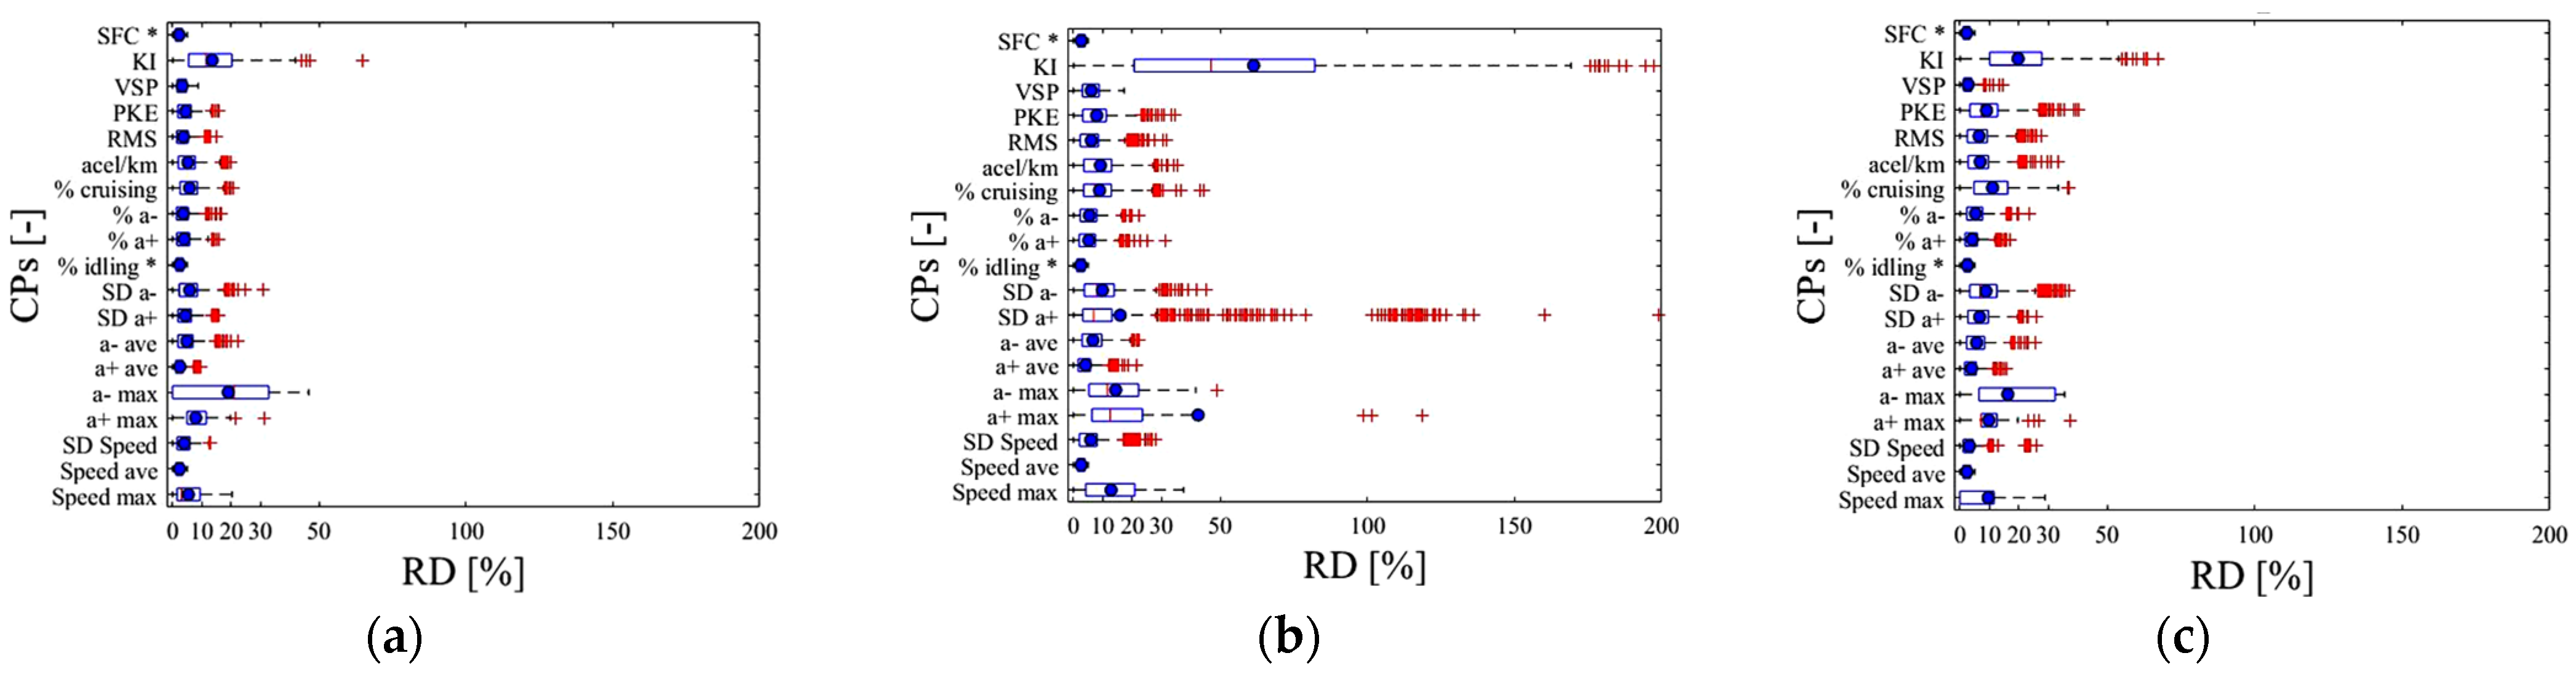
Table 5. Characteristic parameters that describe the aggressive, typical, and eco-friendly driving patterns exhibited by drivers serving the CircuitoTec route.
Parameter (Abbreviation)SFC ScenarioUnit
LowTypical High
Average Specific fuel consumption (SFC) 118.7522.7430.00L/100 km
Average Kinetic Intensity (KI)2.065.1513.69m−1
Average Vehicle Specific Power (VSP)1.180.680.51kW/ton
Number of accelerations per km (accel/km)15.8721.8722.741/km
Cruising percentage (% cruising)26.7623.5716.22%
Accelerating percentage (% a+)24.0625.8016.94%
Decelerating percentage (% a−)31.7721.2323.23%
Idle percentage (% idling) 117.4028.5044.51%
Average acceleration (a+ ave)0.430.420.43m/s2
Average deceleration (a− ave)0.590.580.59m/s2
Maximum acceleration (a+ max)1.411.481.30m/s2
Maximum deceleration (a− max)3.892.622.15m/s2
Average speed (Speed ave) 123.7214.7611.16km/h
Maximum speed (Speed max)64.0147.9951.98km/h
1 The highlighted parameters are used as the criterion to build the representative driving cycle.
Table 6. Geometrical gearbox ratios for CircuitoTec and an autonomy of 50 km.
CharacteristicGears 1
1 *234
NTD for low SFC scenario18.9310.035.322.82
NTD for typical SFC scenario18.938.714.011.84
NTD for high SFC scenario18.9313.259.286.49
1 Based on k = 0.46 and gear shifting range between 2200 and 2350 RPM; * Based on typical values for an electric vehicle 4-speed gearbox: 3.92 gear ratio for the differential and 4.83 ratio for the 1st gear (EATON MD EV 2, 4, and 6 gearbox models).
Table 7. Resulting vehicle performance metrics of the optimized gearbox for CircuitoTec considering the typical SFC scenario and an autonomy >50 km.
DieselDeep-Cycle Lead AcidLi-IonNa-NiCl2Ni-MHLithium-Sulfur
Powertrain specifications
Motor power req. [kW]897965788169
Motor torque req. [Nm]370335236331342290
Acceleration capacity (time to 70 km/h) [s]23.4315.5515.6015.5615.5515.59
Max. speed 1 [km/h]112156142156158145
Energy consumption 2 [Wh/km]2147.7653.2539.7645.2665.2571.9
Vehicle Curb weight [kg]257532422354318133352613
Batteries
Number of batteries in a rack-2583---
Number of battery racks-126222
Autonomy
Dist. Until 0% SoC [km]32711777120118128
Dist. until 20% SoC [km]26194619694102
CO2 net emissions
Well to Tank 3 [gCO2/km]139574474567585502
Tank to Wheel [gCO2/km]55300000
Well to Wheel [gCO2/km]692574474567585502
Costs
Vehicle cost [USD]$48,790$40,860$33,037$57,148$51,691$42,407
Battery pack cost [USD]-$12,475$5287$28,807$23,239$14,477
TCO [USD/km]$0.38$0.29$0.27$0.34$0.32$0.29
1 Diesel: @ 6th gear—4000 rpm; Electric: @ 4th gear—2350 rpm; 2 estimated with the vehicle’s curb weight with 20 passengers; 3 EFwt = 849 gCO2/kWh of electricity (Based on coal-fired power plants as a worst-case scenario) and 640 gCO2/L of diesel.
Publisher’s Note: MDPI stays neutral with regard to jurisdictional claims in published maps and institutional affiliations.

