Article

Effect of In Situ Bioremediation of Soil Contaminated with DDT and DDE by Stenotrophomonas sp. Strain DXZ9 and Ryegrass on Soil Microorganism

College of Resources and Environment, Shandong Agricultural University, Taian 271018, China
*
Authors to whom correspondence should be addressed.
These authors contributed equally to this work.
Submission received: 27 December 2021 / Revised: 12 January 2022 / Accepted: 25 January 2022 / Published: 28 January 2022

Abstract

:
In the present study, the changes in the microbial populations, enzyme activity and bacterial community structure in contaminated soils were investigated during the bioremediation of using Stenotrophomonas sp. strain DXZ9 and ryegrass. The results showed that the removal rates were 81% for DDT and 55% for DDE (69% for DDTs) with ryegrass-microbe. Microbial activity was remarkably improved, and the number of bacteria increased sharply from 7.32 × 10⁶ to 2.56 × 10⁸ cells/g in the 10 days due to successful colonization of the strains and effects of the ryegrass rhizosphere. There was significant difference in fungi number with ryegrass when comparing the 30th and 90th days with the 210th day: The actinomycete number in the soil with ryegrass was higher than without ryegrass, and it indicated that the number of microorganisms significantly increased under the action of ryegrass. The activities of polyphenol oxidase, dehydrogenase and catalase were significantly activated by the combination of ryegrass and microbe, and urease activity was less affected: It has influence on the diversity of bacterial community structure in the soil, but its influence gradually decreased by denaturing gradient gel electrophoresis with an extension in time. The activities represented promising tools for decontaminating and restoring the ecosystem in sustainable ways, and proposing new approaches and technological bottlenecks to promote DDT biodegradation is very significant.

1. Introduction

Organic chlorinated pesticide such as 2,2-bis(4-Chlorophenyl)-1,1,1-trichloroethane (DDTs) has been widely used in anti-malarial drugs, and it is one of the typical 12 persistent organic pollutants. Due to its physicochemical properties and its persistence related with a half-life up to 30 years, broad-spectrum toxicity and bioaccumulation, it was prohibited in many countries, and it was banned in China in 1983. However, due to its residues and its usage as antimalarial agents and raw materials for the production of dicofol, DDT has been detected widely in environment and biological samples [1,2]. 2,2-bis (4-chlorophenyl)-1,1,1-dichloroethylene (DDE) is the main aerobic metabolite of DDT in the environment, which has been detected in environmental samples [3,4]. The maximum residual concentrations of DDT and DDE in soil in China are 1.92 mg·kg−1 and 0.84 mg·kg−1, respectively [5,6]. Although the residue of DDT and DDE in soil is low, it still poses a risk to plants, animals and humans due to its bioaccumulation. In this study, the enhanced remediation of DDT and its metabolites in contaminated soil by microorganism and plant was proposed.
The environmental remediation of toxic pollutants that harm the structure and function of the ecosystem has been a point of controversy in the world. The plant–microbe combined remediation of soil has become a hot topic in the field of soil remediation. The technique has advantages of phytoremediation and microbial remediation to enhance the degradation of organic pollutants in the rhizosphere. Phyto-microbial joint remediation of organic pollutants contaminated soil was promising [7,8,9,10,11]. Inoculation of high-efficiency degrading bacteria can effectively improve bioremediation efficiency. In order to highlight the advantage of plants and microorganisms, it is necessary to explore the interactions of plant–microbe and microbe–microbe so that the remediation system can be effectively controlled. Therefore, it is of great significance to investigate the effects of plant-microbial remediation on soil microbiology.
Soil microbes are an important component of soil ecosystem. Studies have shown that the introduction of xenobiotic pollutants or exogenous microbes has an impact on soil microbial diversity and activity [12,13,14]. Fragoeiro reported that the activity of cellulose, dehydrogenase and laccase in inoculated soil significantly increased in the degradation of simazine and dieldrin by white rot fungi [15]. Tejada [16] studied that the application of chlorpyrifos inhibited dehydrogenase, urease, phosphatase and arylsulfatase activities in soil, and the inhibition of the dehydrogenase, phosphatase and arylsulfatase activities decreased in the bioremediation of municipal organic solid wastes and cattle manure. Megharaj et al. [17] investigated soils with long-term contaminations of DDT where viable counts of bacteria and algae declined with increasing DDT contamination; fungal counts, microbial biomass and dehydrogenase activities increased in 27 mg·kg−1 contaminated soil; and various indicators in soil microbiology were inhibited in 34 mg·kg−1 contaminated soil. Species composition of algae and cyanobacteria was altered, and sensitive species were eliminated in the contaminated soils: It is indicated that these organisms could be useful as bioindicators of pollution.
Although there are some studies on soil microbial diversity and activity, there are few reports on the impact of plant-microbial joint remediation on soil microorganisms, especially DDT and DDE contaminated soils. In the previous study, Stenotrophomonas strain DXZ9 successfully colonized in the soil, and the bioremediation of soil contaminated with DDT and DDE by means of specific bacteria combined with ryegrass is the best and most feasible. In the present study, the effects of plant–microbe joint remediation on soil microbial quantity, enzyme activity and diversity of bacterial community structure have been studied. These were represented as promising tools for decontaminating and restoring the ecosystem in a sustainable manner and without causing much harm to biodiversity. It is very significant to raise new approaches and technological bottlenecks to promote DDT bioremediation. The theoretical basis was established to evaluate the bioremediation of soil contaminated with organic pollutants.

2. Materials and Methods

2.1. Microorganism Strain DXZ9

The microorganisms were isolated from the sludge of the pesticide factory, which was contaminated by DDT with an enrichment culture technique; the culture was regularly transferred to a fresh medium at weekly intervals in a 500 mL Erlenmeyer flask. After many such transfers, the consortium was gradually acclimated to increasing concentrations of DDE from 50 to 100 mg·L−1, and the individual microbial strains in the acclimated consortium were isolated on solid media by appropriate plating. The strains were then grown with 50 mg·L−1 of DDE. Strain DXZ9 has been deposited in the China Center for Type Culture Collection, and its strain number is CCTCCM2013304. The enrichment culture and inoculation amount of bacterial strain DXZ9 in the soil were described in Reference [18]. The degradation rate of Stenotrophomonas sp. strain DXZ9 for DDT and DDE was 55.0% and 39.4%, respectively, in 5 d (the isolation procedure was performed according to Reference [19]).

2.2. Soil Sample

The soil is brunisolic soil, and it was sampled from the topsoil of an experimental plot in the Panhe campus of Shandong Agricultural University, Taian, China (36°09′58.1″N: 117°09′36.6″E). The soil contained 17.6 mg kg−1 organic matter, 31.9% sand, 57.7% silt and 10.4% clay, and the additional parameters of soil such as organic nitrogenous, available phosphorus, pH and CEC were 132.3 mg kg−1, 18.4 mg kg−1, 7.6 and 43.39 cmol kg−1, respectively. The background concentration of p,p′-DDE in the soil used in this experiment was 0.193 mg·kg−1, and p,p′-DDT was not detected in the soil.

2.3. Experimental Design

The experiment consisted of six treatments with 5 replicates each, namely S (Control), S + D (soil with DDT/DDE), S + D + B (soil with DDT/DDE and DXZ9 bacteria), S + G (soil with ryegrass), S + G + D (soil with DDT/DDE and ryegrass) and S + G + D + B (soil with DDT/DDE, ryegrass and DXZ9), respectively. DDT/DDE dissolved in acetone, the detailed experimental design and photo were showed in the Figure 1.

2.4. Collection of Soil Samples

The soil was collected with auger boring with length of 25 cm and 1.5 cm in diameter by five points sampling method, and soil was collected in each pot on 2 h, 5 d, 10 d, 30 d, 60 d, 90 d, 150 d and 210 d. Soil samples measuring 200 g were collected by the quarter sampling method. DDT and its metabolites in soil were analyzed after pretreatment of soil samples. The residual determination method can be found in Reference [18].

2.5. Microbial Enumeration and Community Structure and Enzymatic Activity of Tested Soil

The dilution plate counting method was used to detect changes in the number of soil microorganisms, and LB, PDA and Gause’s No.1 culture medium were used to culture bacteria, fungus and actinomycete [20], and the number is expressed as colony-forming units (CFU) g−1 dry soil.
The activity of polyphenol oxidase in soil was determined by using the pyrogallic acid colorimetric method; purpurigallin (PPG) was measured at 430 nm; and the activities are expressed as g PPG g−1 soil. The determination of urease activity in soil was determined by phenol sodium colorimetry [21]; catalase activity was measured by titrating residual H2O2 with KMnO4 [22]. The reacted amount of 0.02 mol·L−1 KMnO4, calculated per gram of dry soil, was used to show the activity of catalase (mL·g−1). Dehydrogenase activities in soil were determined by 2,3,5-triphenyltetrazolium chloride (TTC) [23], and it was determined by measuring the quantity of TF, which was the reduced product of TTC per gram of dry soil (mg·g−1).
The denaturing gradient gel electrophoresis (DGGE) method was used to study the effects on microbial community diversity in soil.

2.6. DGGE Analysis

DNA in the soil was extracted by using the Power Soil DNA Isolation Kit (MO BIO LAB). The isolated DNA was used as a template to amplify the 16S rDNA gene by polymerase chain reaction (PCR) using the primers, and then the variable V3 region of Stenotrophomonas was specifically amplified using primers [24]. A PCR-DGGE analysis was used to determine the bacterial community’s composition, and the samples of the V3 area PCR product for domain bacteria were evaluated by using the D-code mutation detection system (Bio-Rad Laboratories, Inc., Shanghai, China). The PCR-DGGE analysis was described in the previous study, and the number and brightness of bands in the DGGE map reflect the kinds of microorganisms and the number of certain types of microorganisms in polluted soil in a certain extent [24]. The diversity of bacterial community structure in soils was researched by denaturing gradient gel electrophoresis method; soil samples at four times were selected by plate counting method; and the four times were 0 d, 30 d, 90 d and 210 d.

2.7. Data Analysis and Statistical Methods

The mean values of all data were compared using SPSS software program (version 21.0 for Windows) by a multiple comparison test at the 5% probability level. The results were analyzed by variance (ANOVA test). Figures were produced using Sigmaplot 12.5. DGGE profiles and cluster analyses were calculated with arithmetic averages (UPGMA) by Quantity One software (Bio-Rad Laboratories, Inc., Shanghai, China).

3. Results

3.1. Combined Bioremediation of DDT and DDE with Ryegrass and Microorganisms in Soil

In the soil with S treatment, the concentrations of p,p′-DDE changed from 0.193 mg·kg−1 (background concentration) to 0.140 mg·kg−1, but in the soil with S + G, the concentration reduced from 0.193 to 0.029 mg·kg−1 under the action of ryegrass.
The initial concentration of p,p′-DDT and p,p′-DDE in the soil were 2.23 and 1.26 mg·kg−1. Table 1 shows the effects of ryegrass and microorganisms on the bioremediation of DDT and DDE in soil.
In the soil with S+D treatment, because there is no action of microorganism and ryegrass, degradation of p,p′-DDT and p,p′-DDE is very slow. The removal rate of p,p′-DDT and p,p′-DDE was 77.1% and 52.4% in the soil with S + D + B, and the concentration decreased faster in the first 90 days. In the soil with S + G + D, the concentration decreased faster in the first 10 days because ryegrass absorbed a lot of nutrients to ensure its germination and seedling growth at the early stage of growth, and it simultaneously absorbed p,p′-DDT and p,p′-DDE; this comment is described in the literature [25]. After 10 days, the concentration decreased slightly. In the soil with S + G + D + B treatment, p,p′-DDT, p, p′-DDE and DDTs decreased the most because ryegrass contributes to the survival and reproduction of strain DXZ9; microbial numbers and enzyme activity in soil confirmed this effect in the later studies [26]. Ryegrass and the strain DXZ9 had synergistic effect for bioremediation. The removal rates of p,p′-DDT and p,p′-DDE were 80.70% and 54.50%.

3.2. Effect of Bioremediation on Soil Microorganism Quantity

The populations and composition of microbes in soil are important indicators of ecological characteristics of soil microbiology. In the experiment, the effects of inoculation and planting ryegrass on the populations and composition of soil microbes were studied by the dilution plate method. Figure 2a shows the change in the populations of bacteria in soil. The population of bacteria has greatly changed during the combined remediation process of ryegrass and bacterium. On day 5 and day 10, there was a significant difference between S + D + B and S, and between S + G + D + B and S + G; the difference among other treatments was not significant. The populations of bacteria in S + D + B significantly increased to 3.14 × 10⁷ cells per gram on day 5. On day 10, the populations of bacteria in the soil increased sharply to 2.44 × 10⁸ cells per gram, which was 7.77 times that of the populations on day 5. The number of bacteria increased sharply, because strain DXZ9 successfully colonized in soil and rapidly reproduced; this trend continued until the 30th day, the populations were 8.53 × 10⁶ cells per gram and the bacterial populations followed the decrease. There was no significant difference between the 60th and 210th days. However, the bacteria population in the soil with DXZ9 was consistently higher than the control.
In the treatment with ryegrass, the change of the bacterial populations in S + G + D + B reflected the same trend as the treatment without ryegrass, but the increase in bacterial populations was greater than S + D + B. This may be due to the rhizosphere effect of ryegrass, which enhanced the increase in bacteria populations. The populations of bacteria significantly increased to 5.2 × 10⁷ cells per gram on day 5. On day 10, the populations of bacteria in the soil increased sharply to 2.56 × 10⁸ cells per gram, which was possibly due to rapid reproduction of the strain and rhizosphere effect of ryegrass. The number of bacteria began to decrease after a rapid increase in bacteria, and the populations were 3.09 × 10⁷ cells per gram on day 30. Between day 60 and day 210, the populations in the treatment with inoculated soil were significantly higher than that of the control, and the populations in S + G + D + B were remarkably higher than the other treatments; it was indicated that the ryegrass and inoculated bacterium played crucial roles in the process of bioremediation.
Figure 2b shows the change in the populations of fungi in soil. In the combined remediation of ryegrass and strain, the variation in the number of fungi was different. There were no significant differences in the populations of fungi in the first 10 days. On day 30, the three treatments with ryegrass were significantly different from each other, and the fugus populations in S + G + D significantly increased, possibly due to the adsorption of DDT and DDE by ryegrass so that the concentration of DDT and DDE decreased without the production of other metabolites, and fungi rapidly reproduced due to the rhizosphere effect. There was a significant difference in the treatments with or without ryegrass on day 60. On day 90, there was a significant difference between the inoculated treatment and other treatments. In the treatments without ryegrass, there was significant difference between the treatments with and without inoculated on day 90 and 150. While in the treatment of planting ryegrass, there was significant difference between the treatments with and without strain DXZ9 on days 30, 90 and 210.
Figure 2c shows changes in the populations of actinomycetes. In the treatments without ryegrass, the populations of actinomycetes in S + D was higher than the control during the first 30 days. There was a significant difference between the 10th and 30th days. In S + D + B, the populations of actinomycetes were significantly less than the control on day 5, because the introduction of exogenous microbes inhibited the reproduction and growth of actinomycetes. On day 60, the populations of actinomycetes in the treatments with pesticides were less than the control, which may be due to an inhibition of actinomycetes growth by DDE and other metabolites from the degradation of DDT, although the concentration of DDT decreased. On day 90 and day 150, the populations of actinomycetes in S + D were lower than the control, and DDT and DDE inhibited actinomycetes growth. While the populations of actinomycetes in S + D + B were higher than the control, low concentrations of DDT and DDE were beneficial to actinomycete growth, and the populations of actinomycetes in the treatments with pesticides were higher than the control on day 210.
In planting ryegrass, the change trend of actinomycetes is the same as without ryegrass, and the populations of actinomycetes in treatments with ryegrass were higher than without ryegrass during the 90~210th day, because ryegrass significantly improved the number of microorganisms in contaminated soil, and the highest degradation efficiency was found in S + G + D + B.

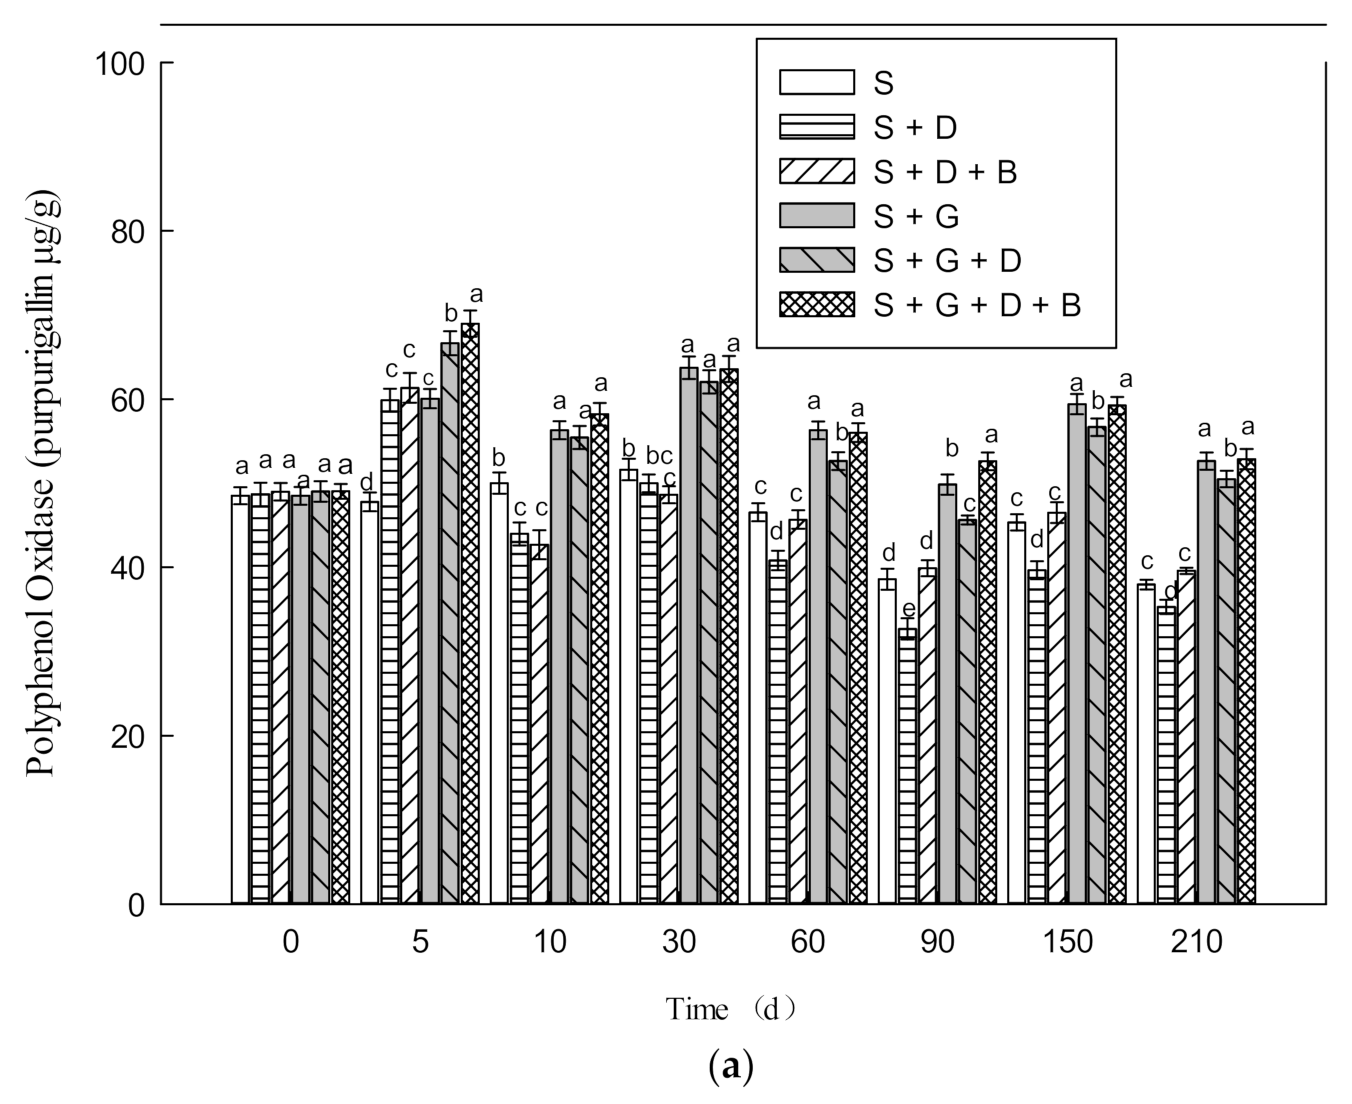
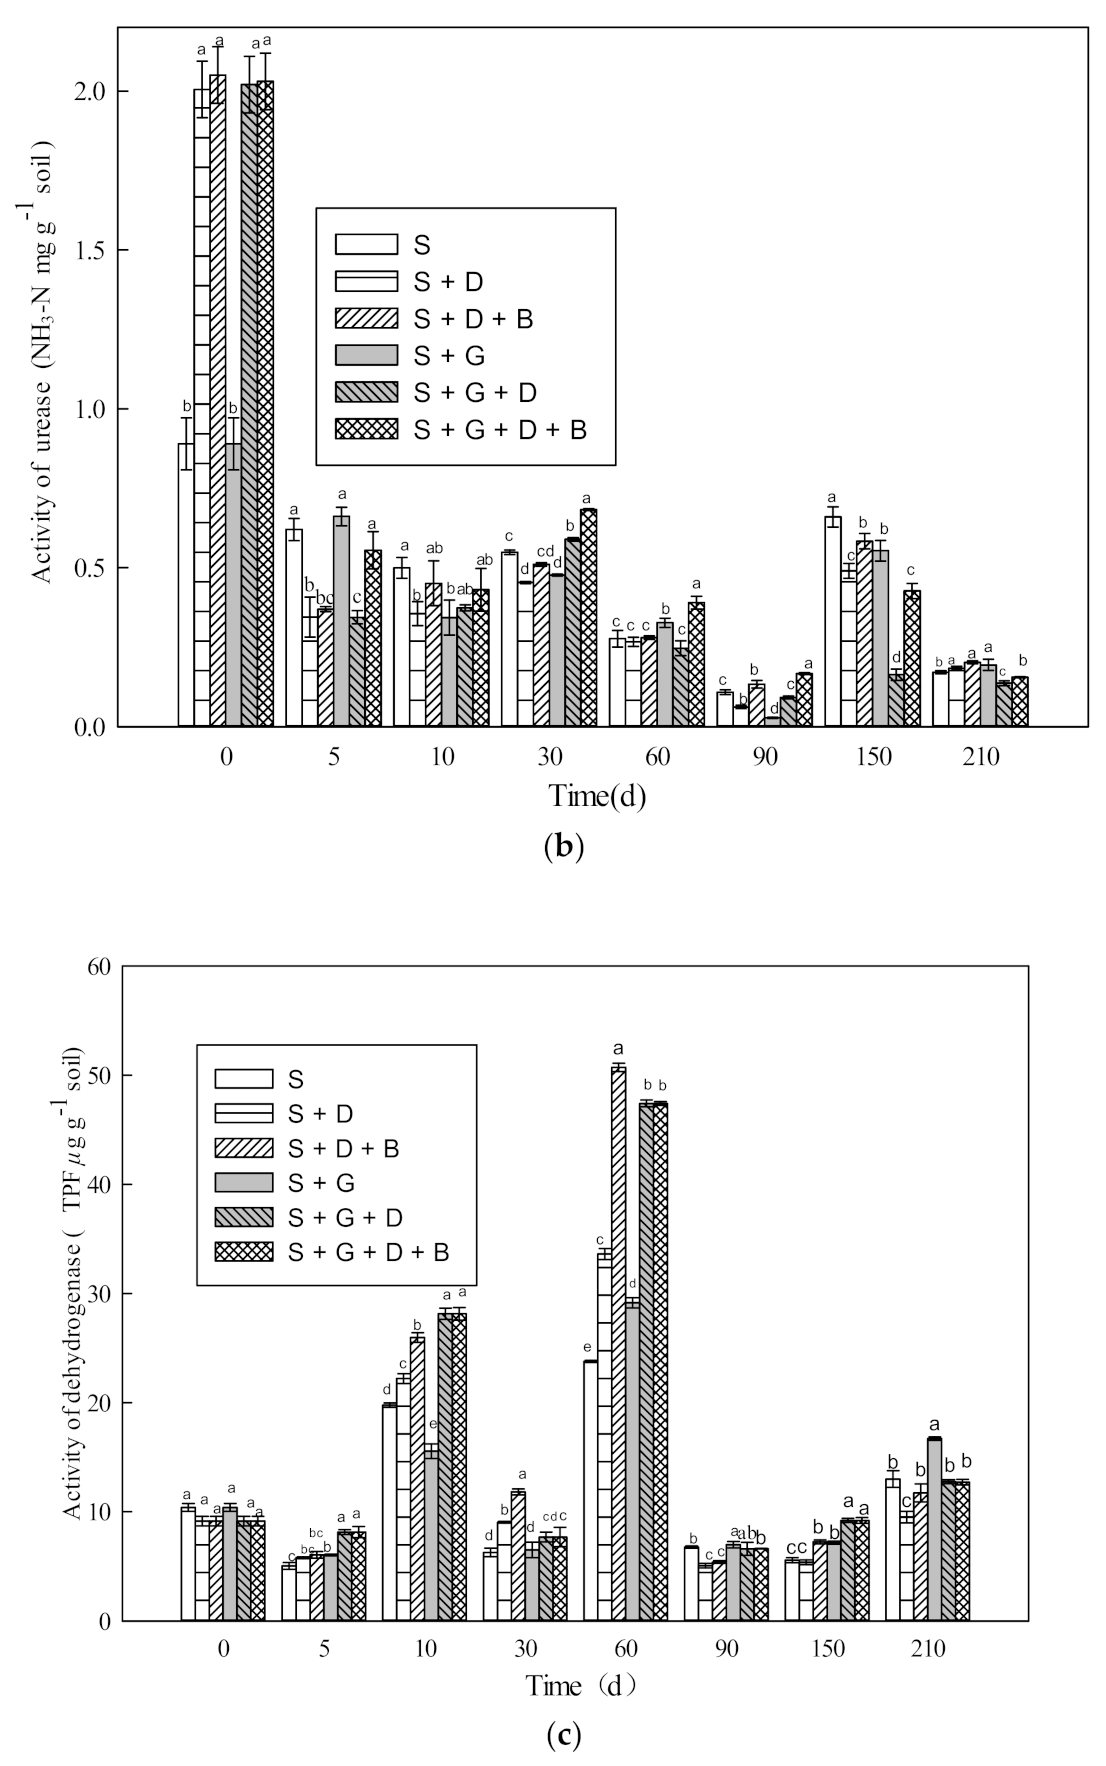
3.3. Effect of Bioremediation on the Activity of Soil Enzyme

Soil enzyme activity is affected by soil physical, chemical and biological factors, and it is sensitive to environmental factors such that it reflects soil microbial activity. Polyphenol oxidase is an oxidoreductase, which is involved in the degradation and conversion of aromatic pollutants, and its activity reflects the level of soil contaminated by aromatic compounds. The change of polyphenol oxidase activity in soil was shown in Figure 3a.
During the bioremediation process, the activity of polyphenol oxidase in the treatment with ryegrass was significantly higher than treatments without ryegrass. The activity of polyphenol oxidase was significantly different in the first 30 days, and the degradation capability was strong. On day 5, the activity of polyphenol oxidase in the treatments with ryegrass was 26.75%, 11.32% and 12.42% higher than S, S + B and S + D + B, respectively. On day 30, it was 23.43%, 24.05% and 30.69% higher, respectively. The degradation rate of pollutants was significantly higher than S + D, planting ryegrass significantly improved the activity of polyphenol oxidase and promoted the degradation of pollutants.
Urease activity in the soil reflects the soil nitrogen status. The change of urease activity in the combined ryegrass and strain remediation system was shown in Figure 3b. Urease activity in the soil increased rapidly 2 h after the pesticide addition, which was 1.25 times of that in the control, and there was significant difference between application treatment and the control. Urease activity in treatments without ryegrass was consistently lower than the control after day 5, and the trend continued until the end of the experiment. However, there was no significant difference between the treatments with and without strain inoculation, and, on day 210, there was no significant difference in the treatments with and without xenobiotic pollutants. In the treatment with ryegrass, there was a temporal inhibitory effect on day 5, and then urease activity increased significantly during 10~90 day, and an inhibition effect followed after day 150. However, with the exception of day 10 and day 210, there were significant differences between treatments with and without exogenous microbes, and ryegrass had a certain effect on urease activity. The variation of urease activity may be correlated to concentrations of DDT and its metabolites. In conclusion, the combined remediation of ryegrass and strain had little effects on soil urease activity.
The change of dehydrogenase activity in soil was shown in Figure 3c. During the bioremediation process, dehydrogenase activity increased gradually as time went by, and dehydrogenase activity reached the maximum on day 60, and then it gradually decreased. During the first 60 days, a similar trend was observed for dehydrogenase activity in treatments with and without ryegrass, and dehydrogenase activity of soil treated with pesticides was greater than the control; it was indicating that the addition of xenobiotic pollutants could activate dehydrogenase activity. In the treatments without ryegrass, the activity in S + D + B was significantly higher than S + D. While in the treatments with ryegrass, there was no significant difference between S + G + D + B and S + G + D; it was indicated that ryegrass had great influence on dehydrogenase activity in soil. After 90 days, the dehydrogenase activities in the soil with ryegrass were greater than those without ryegrass, which verified that ryegrass had great effects on the dehydrogenase activities in the soil.
Catalase activity is related to respiration intensity and life activity of soil microorganisms, and catalase activity reflects the intensity of soil microbial processes to a certain extent. The change of catalase activity in soil was shown in Figure 3d. During the combined ryegrass and strain remediation process, the comprehensive effect of various factors had little effects on catalase activity in the soil. At the initial stage of the experiment, due to the stimulation of added xenobiotic pollutants, catalase activity slightly increased, but the difference was not significant. From the 10th day, compared with the control, the catalase activity of the treatment added with pesticides decreased slightly, and it was possible that DDT could activate catalase activity, while DDE could inhibit catalase activity at the beginning of the experiment, DDT was dominant and it had great impacts on catalase activity. With the degradation of DDT into DDE and other metabolites, the advantage gradually weakened, and on the 90th day, there were significant differences among the six treatments. At the end of the experiment, there was a significant difference among the three treatments without ryegrass, and there was no significant difference between S + G + D and S + G, but there was significant difference between S + G + D + B and S + G + D, which showed that planting ryegrass and inoculating strains increased catalase activity.

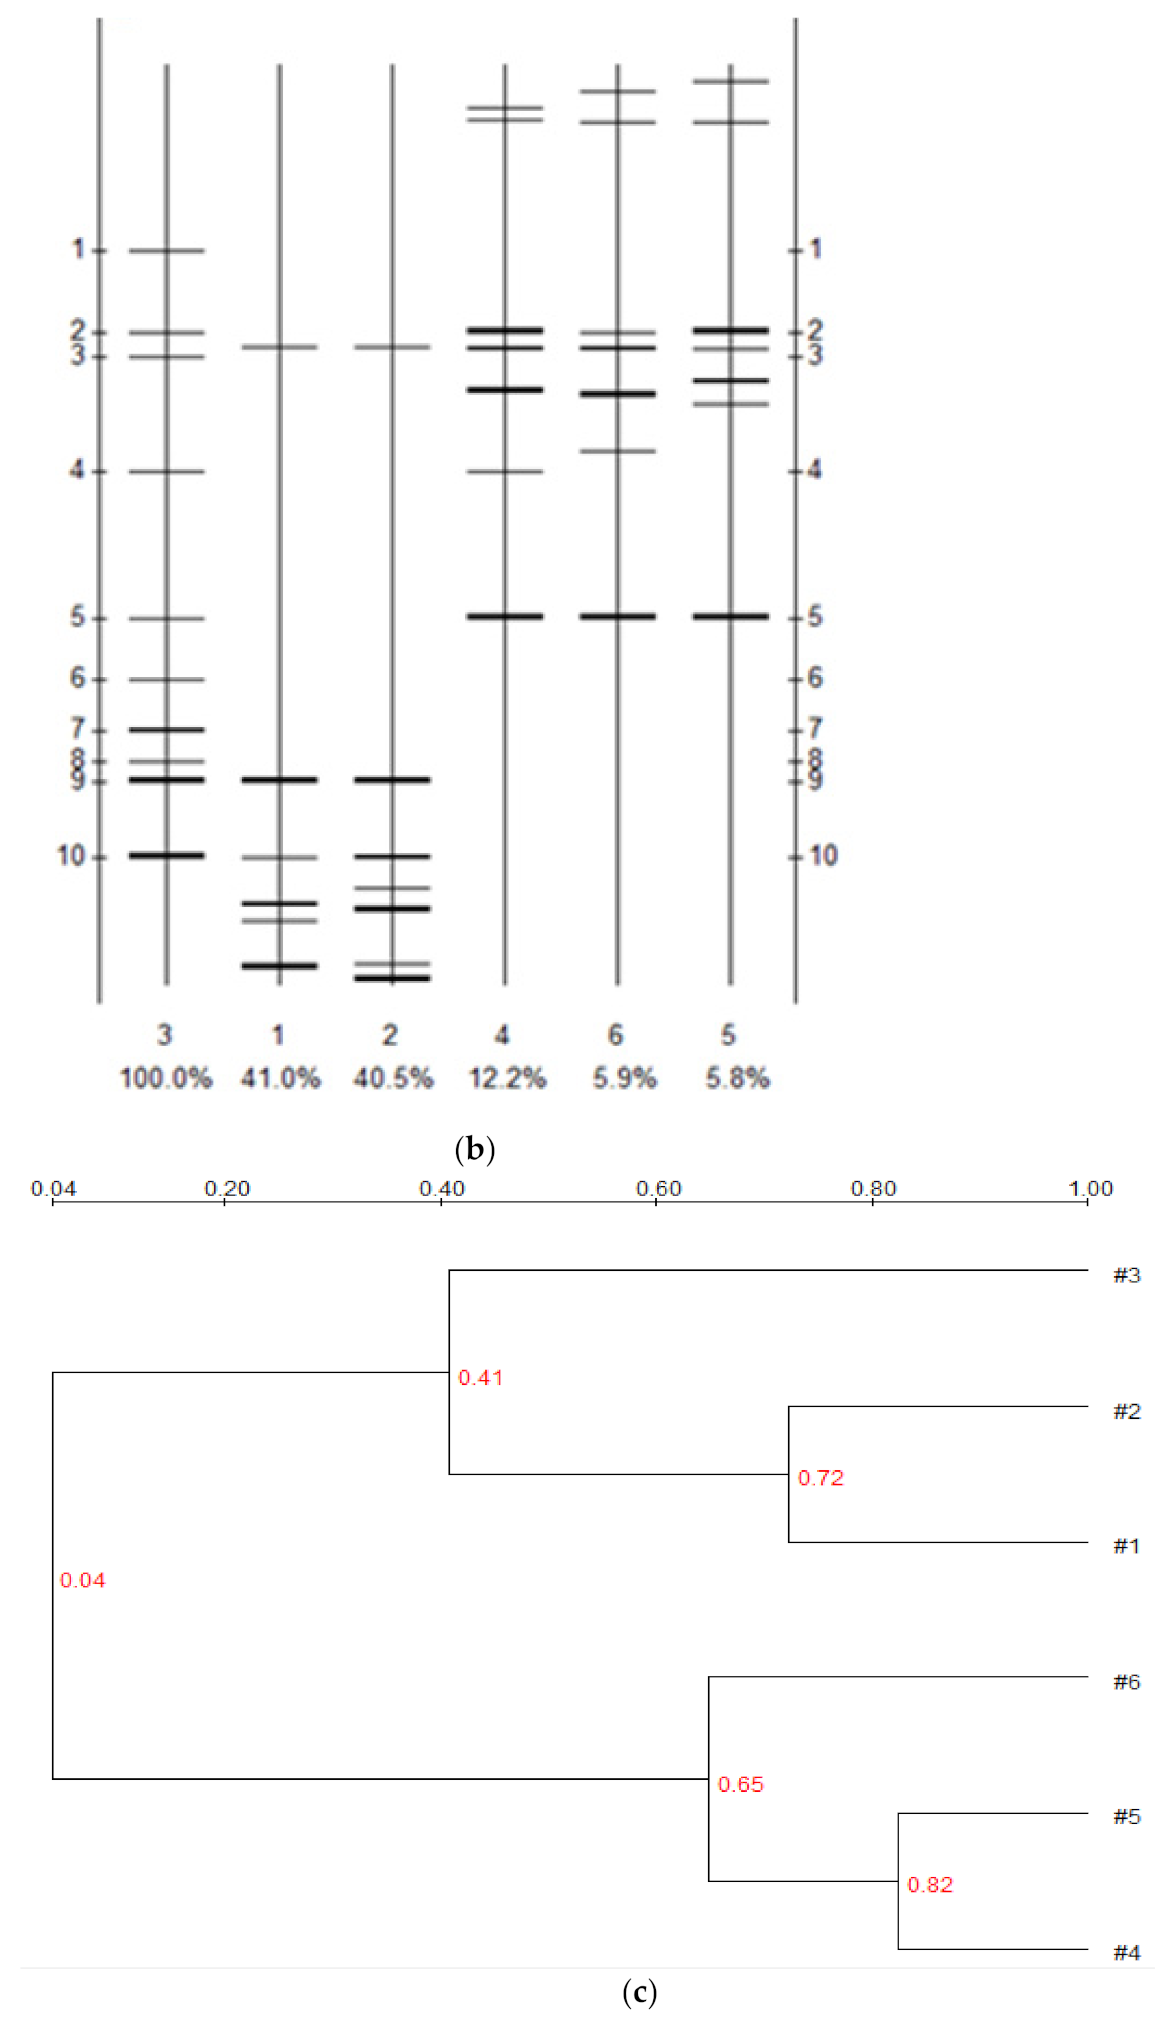
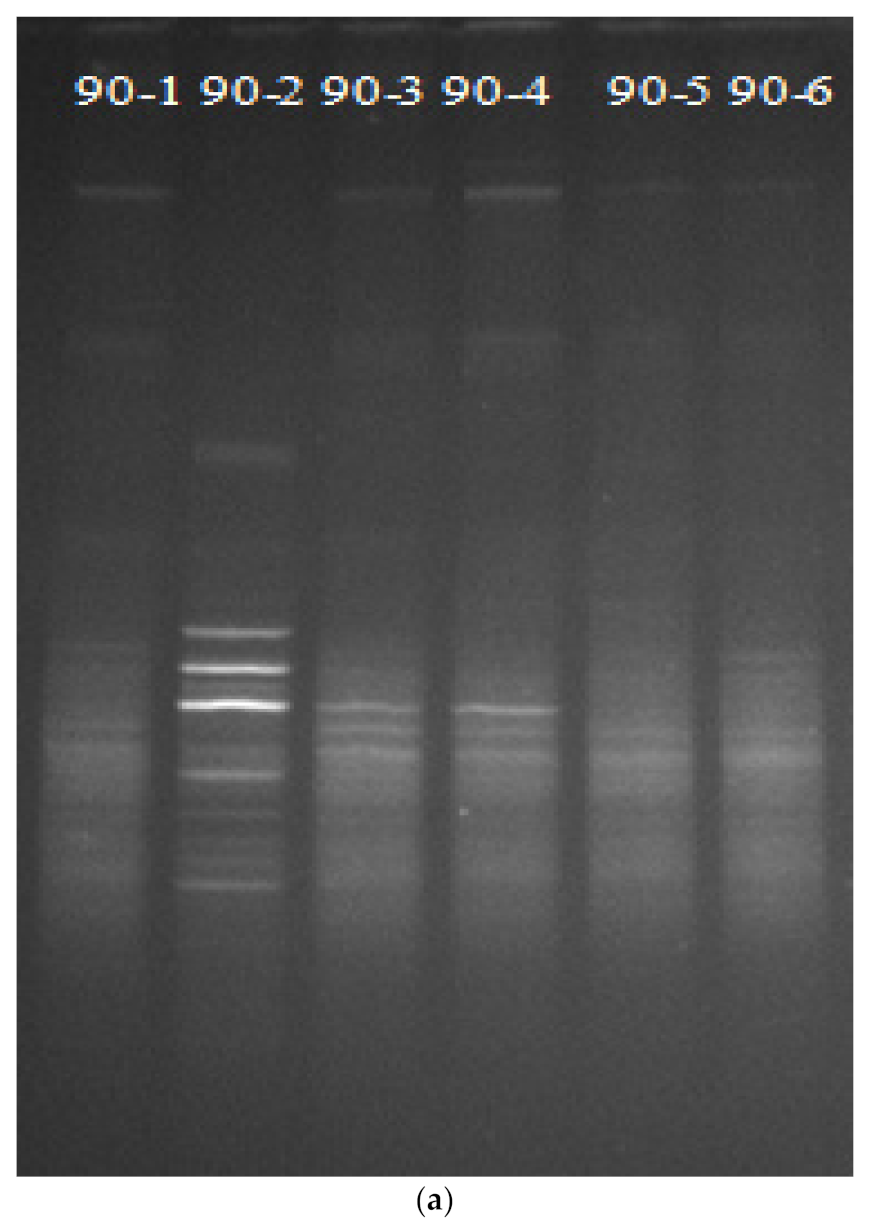
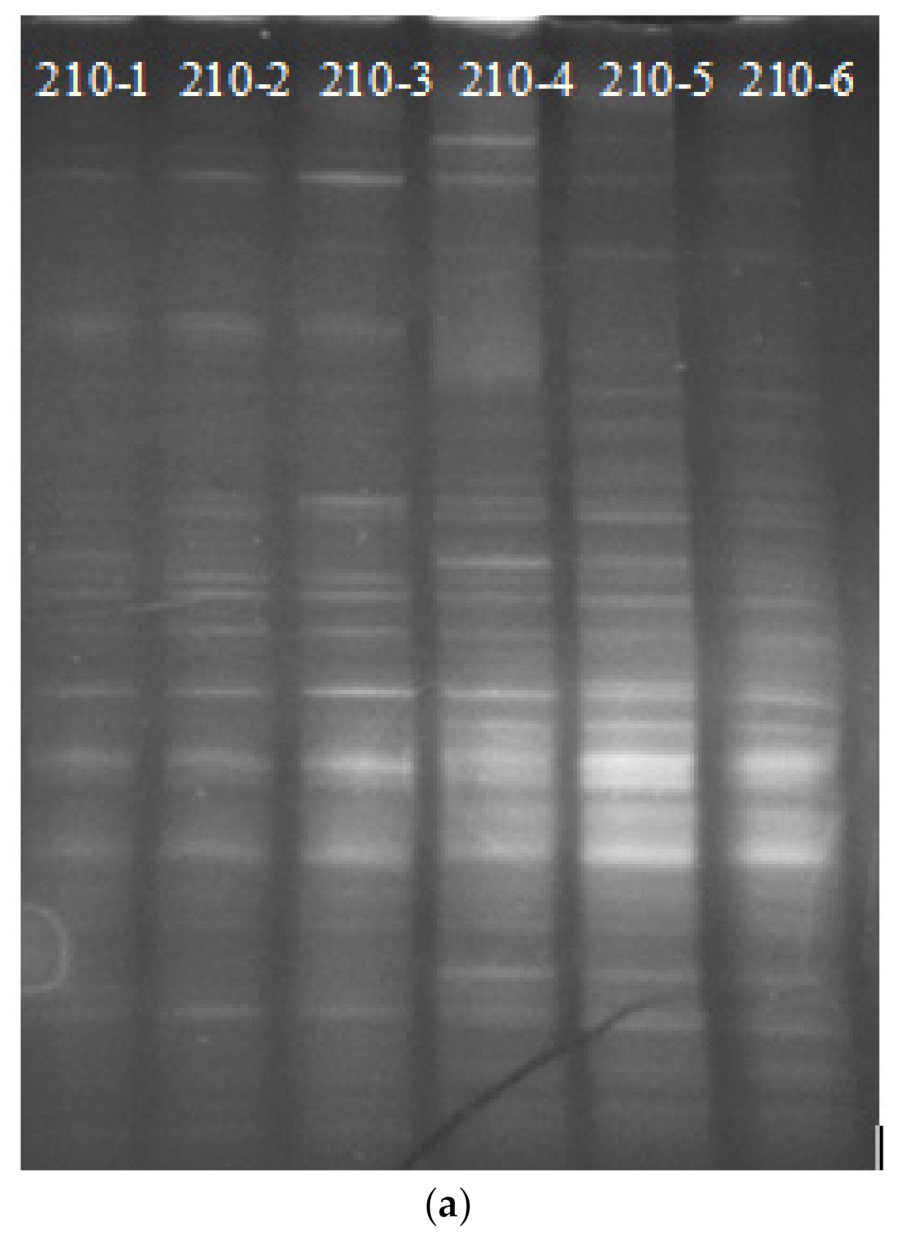
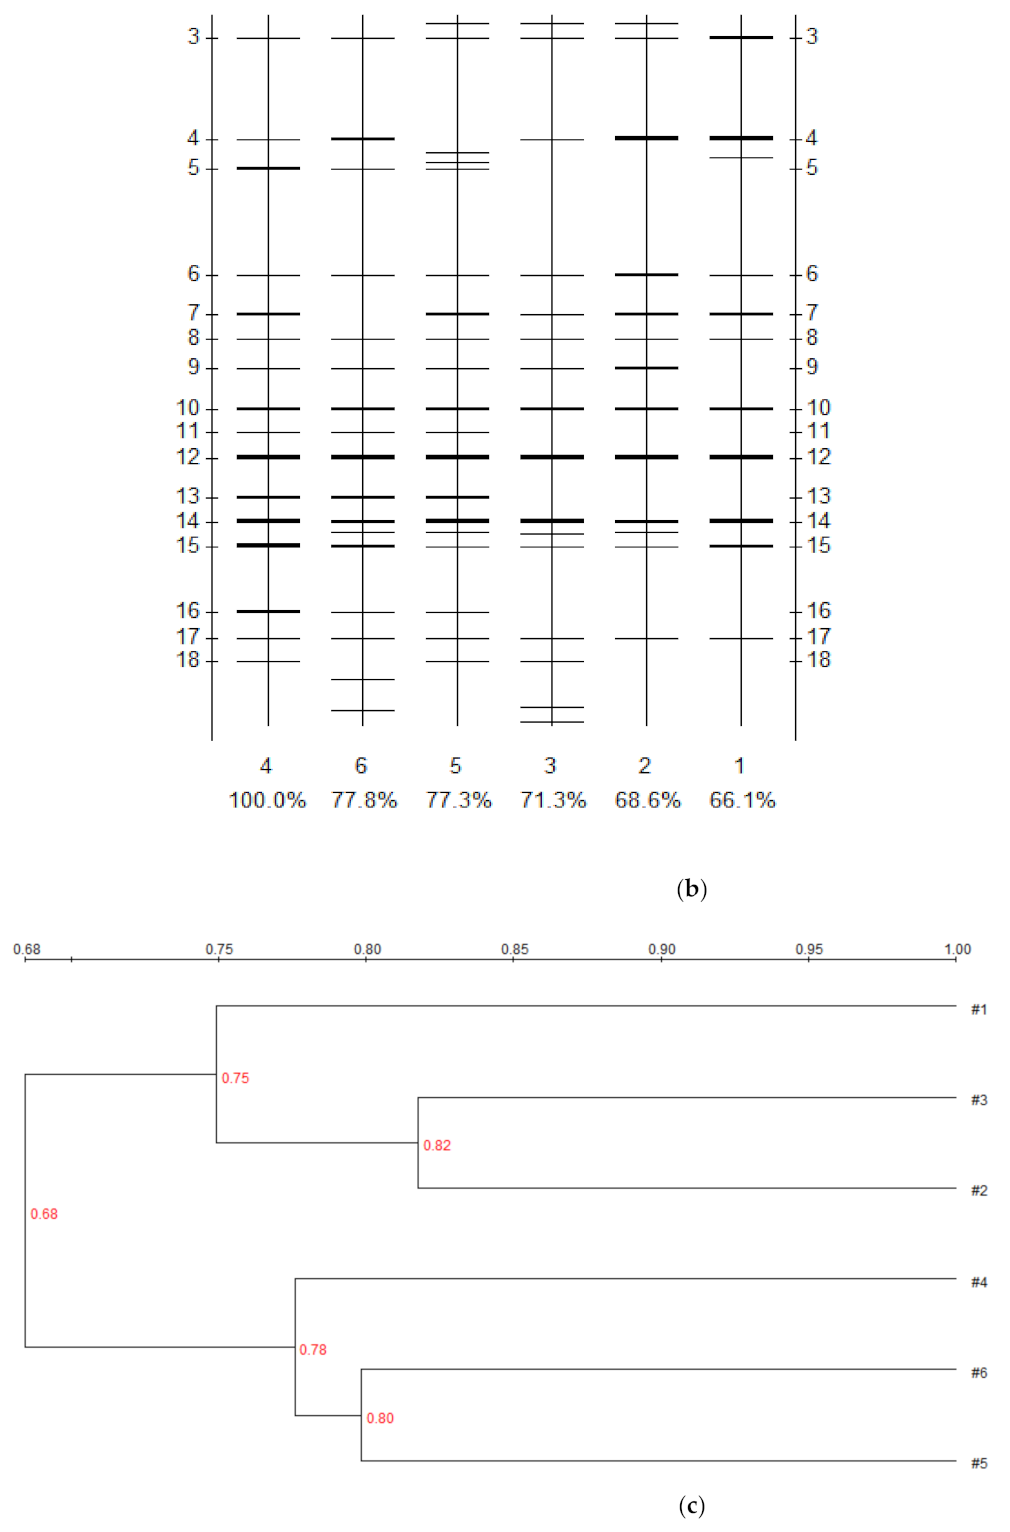
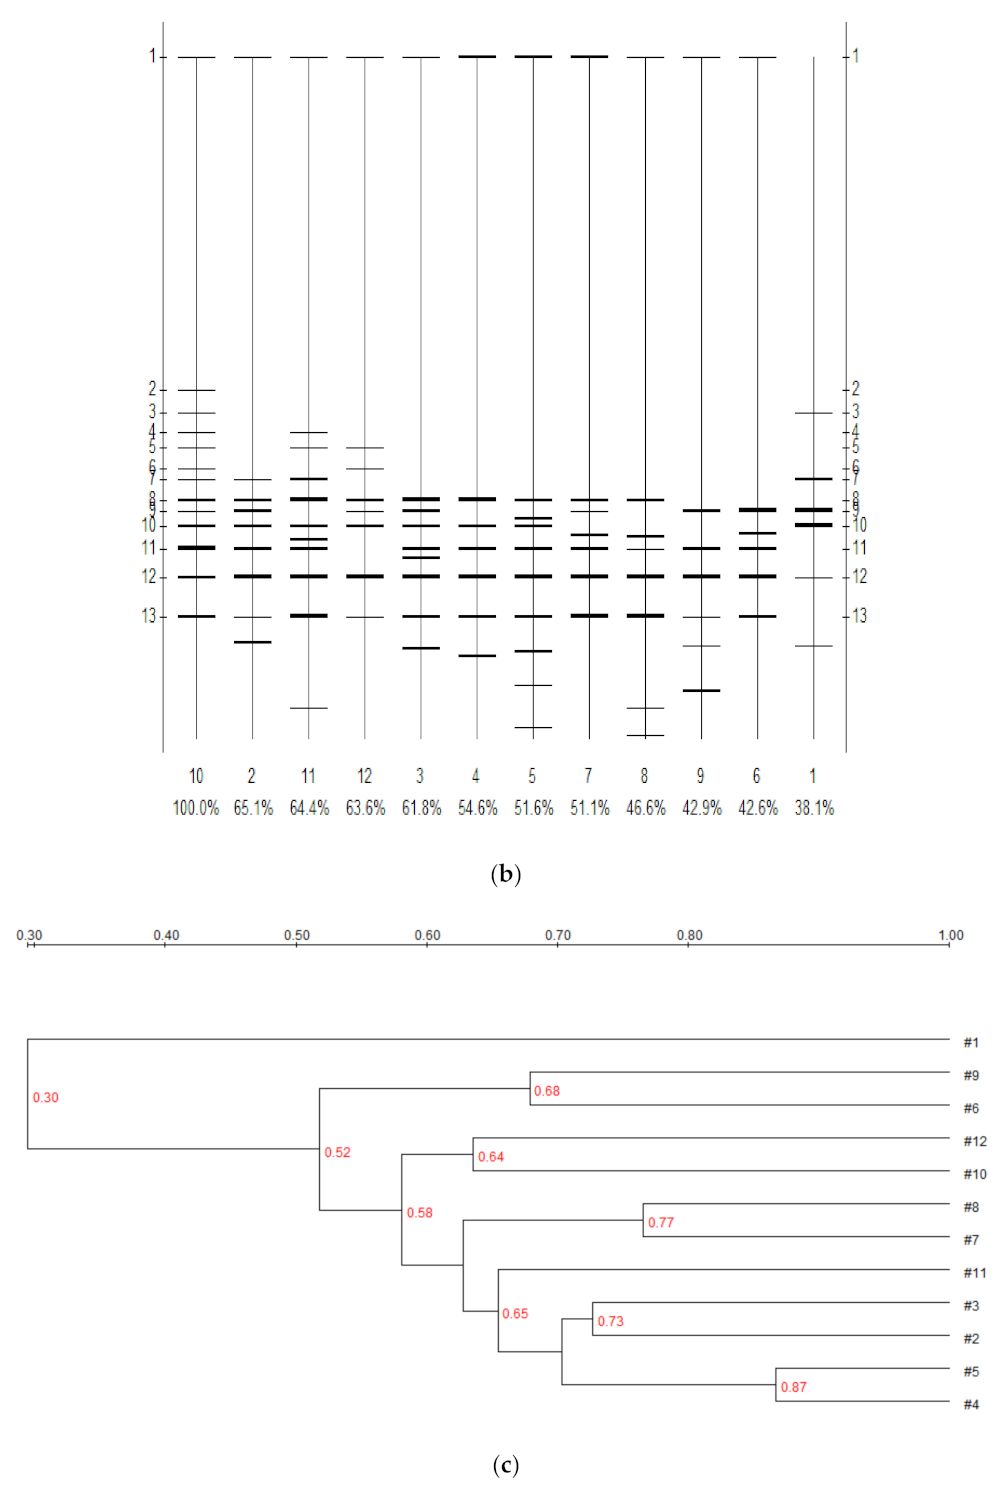
3.4. Effect of Bioremediation on Soil Bacterial Community Structure Diversity

A PCR fragment of 16S rDNA V3 region in the soil bacteria was carried out by denaturing gradient gel electrophoresis (DGGE), and the number and brightness of bands in the DGGE map reflect the types of microorganisms and the number of certain types of microorganisms in polluted soil in a certain extent. Bacterial DGGE mapping and result analysis of 10 days soil with six treatments are shown in Figure 4; the similarity matrix analysis results are shown in Table 2. Compared with the control, the numbers and position of the band of the treatment with added pesticide and strain DXZ9 changed on day 10, and it showed that strain DXZ9 and added pesticides had an impact on the bacterial community structure of the soil microorganism.
From Table 2, the similarities of the bacterial community structure were 40.5% and 41% when comparing S + G + D and S + G + D + B with S + G, and the similarities were 59.7% and 70.1% when comparing S + D and S + D + B with the control; this indicated that the bacterial community structure in soil was greatly affected by the addition of pesticides and not the inoculation of DXZ9. The similarity of the bacterial community structure was only for 1.4% between treatments S + G + D + B and S + D + B, and the similarity was merely 2.5% between treatments S + G + D and S + D; it showed more diversity, and it was fully explained that planting ryegrass at early stages had great influences on soil bacterial community structure. The bands represent the genetic similarities and differences in each lane, which indicates the diversity of soil microorganisms and their relationship (Figure 4c). The results also showed that planting ryegrass and adding pesticides had greater effects on soil bacterial community structure by UPGAMA cluster analysis of each treatment.
From Figure 5, on day 90, the bacterial community structure in soil was greatly affected by pesticide and inoculation with the DXZ9 strain. From Table 2, the similarity of the bacterial community structure was 35% and 54.8% comparing S + G + D and S + G + D + B with S + G, respectively, and the similarity was 38.1% and 76.9% comparing S + D and S + D + B with the control, respectively. The bacterial community structure in soil was greatly affected by the pesticide. The similarity was 78.2% between S + G + D + B and S + D + B, and the similarity was merely 31.9% between S + G + D and S + D; the results showed that ryegrass had little effects on bacterial community structure in the treatment with the DXZ9 strain, but it had great effects in the treatment without DXZ9. By UPGAMA cluster analysis of S + G + D + B and the control, planting ryegrass and pesticide had little effects on bacterial community structure.
From Figure 6, on day 210, comparisons with the control, pesticide and strain DXZ9 had little effects on the bacterial community structure in soil, and the similarity was more than 74.4%. The similarities were 66.1% and 71.2%, respectively, between S + G + D + B and S + D + B, and between S + G + D and S + D. Planting ryegrass had little effect on the bacterial community structure. By UPGAMA cluster analysis, it was further proved that planting ryegrass had little effects on soil bacterial community structure.
Variations of bacterial community structure in soil with the same treatments at different time are shown in Figure 7, and similarity matrix analysis results are shown in Table 3. In the S + D soil, the bacterial community structure had changed in the test period, and the similarity of the bacterial community structure was 20.7%, 16.4% and 38.1%, respectively, comparing the 30th, 90th and 210th days with the 10th day, it showed that pesticides had the greatest impact on the bacterial community structure on the ninetieth day, with minimal impacts on the 210 days. In S + D + B soil, bacterial community structure had changed less in the test period, and the similarities were 71.2%, 51.0% and 63.0%, respectively. For S + G + D + B, the similarities were 53.9%, 56.1% and 57.9%, respectively. With the extension of time, the difference with the tenth days becomes smaller. By UPGAMA cluster analysis, there are different genetic relationship between microbial diversity in the treatment of soil samples during the experiment period. By the combined remediation with plants and microorganisms, it has some effects on bacterial community structure diversity, but the influence weakened with an extension in time.

4. Discussion

Plant species and varieties are crucial in phytoremediation. The most commonly used plants are ryegrass and alfalfa, and ryegrass is more effective. There are different species in ryegrass, including Perennial ryegrass (Lolium perenne), Annual ryegrass (Lolium rigidum) and Italian ryegrass (Lolium multiflorum). Italian ryegrass is more resistant to oil pollution, and higher numbers of culturable, alkane-degrading bacteria were associated with Italian ryegrass; they were also characterized by higher diversities, particularly in the plant interior [25]. It was reported that there was good correlation between the removal rate of total hydrocarbons and alkanes and the number and activity of microbes in soil in the bioremediation of petroleum [27]. Phytoremediation (tall fescue and perennial ryegrass) assisted by Pseudomonas can effectively remove DDTs, because plants may enhance the rhizosphere environment for microorganisms and promote the bioremediation of pollutants [28]. This study was consistent with these results, which was shown that the degradation rates of DDT and DDE had good correlation with the populations and microbial activity in soil. Results showed that the removal rate of pollutants in the soil was relatively high during day 5 to day 10, and the number of bacteria increased the fastest during this period. This study fully reflected that there was an obvious positive correlation between the degradation rate of pollutants and the population of bacteria in soil. Siciliano [29] demonstrated that, in addition to the type and number of plants, the enrichment of hydrocarbon-degrading bacteria in petroleum was mainly dependent on plant species. In this study, perennial ryegrass was used, and the result showed that it could improve soil microbial activity.
The rhizosphere microorganisms of ryegrass could effectively promote the degradation of BDE-209 in soil [30]. Xie [31] investigated the effect of root interval of ryegrass on pyrene degradation: The rhizosphere of ryegrass was closer; biomass carbon and the activity of polyphenol oxidase and dehydrogenase the soil were higher; and the pyrene degradation rate was higher. It also illustrated the effect of root exudates on pyrene degradation; the root exudates caused changes of soil microbial characteristics in rhizosphere, such as microbial composition, soil microbial activity and enzyme activity in soil. Root secretion is the most important factor in the occurrence of microbial changes in rhizosphere [32,33]. Ryegrass was used to bioremediate chlorpyrifos in soil by pot experiment [34], and the density, diversity and metabolic activities of microbes increased due to the plant root exudates and root lysates (enzymes, amino acids, carbohydrates, carboxylic acids with a low molecular weight, flavonoids and phenolic substances) in the rhizosphere of ryegrass [35]. Ryegrass and a variety of microbes were used to bioremediate contaminated soil with petroleum: The activity of polyphenol oxidase increased, and dehydrogenase activity decreased in the bioremediation process [36]. Ryegrass could enhance phenanthrene degradation via phytoremediation in PAH-contaminated sites, total bacterial populations was increased and the composition of the active phenanthrene-degrader community has been shaped [6], which was consistent with this study. Ryegrass had a beneficial effect on the production of soil polyphenol oxidase [37]. The ecological environment of rhizosphere and soil quality improved the metabolic activities of microbial community in the rhizosphere such that plant roots and microbes released more polyphenol oxidase to promote the degradation of PAHs. Joint applications of alfalfa and exogenous microorganisms significantly enhanced the accumulation for pyrene; microbial community diversity was improved; and the activities of dehydrogenase and polyphenoloxidase in soil increased [38]. During the first 30 days of the experiment, there was no significant difference between the treatments with and without inoculated exogenous microbes; however, after day 30, a significant difference in these treatments was found. The activity of polyphenol oxidase was significantly higher than that in treatments without inoculated bacterium; this indicates that the activity of polyphenol oxidase in the soil has been improved under the action of exogenous microbes. Bioaugmentation significantly improved catalase activity, and the microbial community of petroleum biodegrading bacterium in soil increased [27,39] compared with bio-stimulating, whereas the bio-stimulating technique could not increase microbial diversity. In the bioremediation of petroleum-contaminated soil, there was a good positive correlation between microbial community and degradation characteristics in soil. Bioaugmentation includes inoculation of bacterium and implantation of ryegrass: it could promote microorganism numbers, improve enzyme activity and enrich the biological community in soil.

5. Conclusions

In the soil of inoculating efficient degrading strains of DXZ9 and planted ryegrass, the removal rates of DDT and DDE reached the maximum, bacteria populations in the soil increased sharply and microbial activity was remarkably improved in bioremediation. Ryegrass significantly increased the microbial population and diversity, and phytoremediation influenced more on the composition and abundance of microbial species. Bioremediation represents a promising technology for decontaminating and restoring the ecosystem in a sustainable manner, the characteristics of microbial community can directly display the ecological functions of environmental systems; it could be used to evaluate the effects of bioremediation on soil microorganisms.

Author Contributions

Conceptualization, H.X. and Y.X.; methodology, H.X.; software, X.L.; validation, R.L. and X.L.; formal analysis, Y.M. and Y.W.; investigation, F.S.; resources, H.X.; data curation, H.X.; writing—original draft preparation, H.X.; writing—review and editing, R.L.; visualization, Y.M. and Y.W.; supervision, Y.X.; project administration, F.S.; funding acquisition, H.X. All authors have read and agreed to the published version of the manuscript.

Funding

This research was funded by the National Natural Science Foundation of China, grant number 41671321.

Institutional Review Board Statement

Not applicable.

Informed Consent Statement

Informed consent was obtained from all subjects involved in the study.

Data Availability Statement

Data, associated metadata and calculation tools are available from the corresponding author ([email protected]).

Conflicts of Interest

The authors declare that they have no known competing financial interest or personal relationships that could have appeared to influence the work reported in this paper.

References

  1. Umulisa, V.; Kalisa, D.; Skutlarek, D.; Reichert, B. First evaluation of DDT (dichlorodiphenyltrichloroethane) residues and other Persistence Organic Pollutants in soils of Rwanda: Nyabarongo urban versus rural wetlands. Ecotoxicol. Environ. Saf. 2020, 197, 110574. [Google Scholar] [CrossRef] [PubMed]
  2. Zhao, C.C.; Xie, H.J.; Zhang, J.; Xu, J.T.; Liang, S. Spatial distribution of organochlorine pesticides (OCPs) and effect of soil characters: A case study of a pesticide producing factory. Chemosphere 2013, 90, 2381–2387. [Google Scholar] [CrossRef]
  3. Koureas, M.; Rousou, X.; Haftiki, H.; Mouchtouri, V.A.; Rachiotis, G.; Rakitski, V.; Tsakalof, A.; Hadjichristodoulou, C. Spatial and temporal distribution of p,p′-DDE (1-dichloro-2,2bis-(pchlorophenyl) ethylene) blood levels across the globe. A systematic review and meta-analysis. Sci. Total Environ. 2019, 686, 440–451. [Google Scholar] [CrossRef] [PubMed]
  4. Łozowicka, B.; Kaczyński, P.; Wolejko, E.; Piekutin, J.; Sagitov, A.; Toleubayev, K.; Isenova, G.; Abzeitova, E. Evaluation of organochlorine pesticide residues in soil and plants from East Europe and Central Asia. Desalinat. Water Treat. 2015, 57, 1310–1321. [Google Scholar] [CrossRef]
  5. Hu, W.Y.; Lu, Y.L.; Wang, T.Y.; Luo, W.; Shi, Y.J.; Giesy, J.P.; Geng, J.; Jiao, W.T.; Wang, G.; Chen, C.L. Spatial variability and temporal trends of HCH and DDT in soils around Beijing Guanting Reservoir, China. Environ. Geochem. Health 2010, 32, 441–449. [Google Scholar] [CrossRef] [PubMed] [Green Version]
  6. Lv, J.G.; Shi, R.G.; Cai, Y.M.; Liu, Y.; Wang, Z.H.; Feng, J.M.; Zhao, M. Assessment of 20 Organochlorine Pesticides (OCPs) Pollution in Suburban Soil in Tianjin, China. Bull. Environ. Contam. Toxicol. 2010, 85, 137–141. [Google Scholar] [CrossRef] [PubMed]
  7. Liu, H.N.; Hu, W.L.; Li, X.; Hu, F.W.; Liu, Y.F.; Xie, T.H.; Liu, B.; Xi, Y.N.; Su, Z.; Zhang, C. Effects of perfluoroalkyl substances on root and rhizosphere bacteria: Phytotoxicity, phyto-microbial remediation, risk assessment. Chemosphere 2021, 289, 133137. [Google Scholar] [CrossRef]
  8. Miao, R.H.; Guo, M.X.; Zhao, X.Y.; Gong, Z.Q.; Jia, C.Y.; Li, X.J.; Zhuang, J. Response of soil bacterial communities to polycyclic aromatic hydrocarbons during the phyto-microbial remediation of a contaminated soil. Chemosphere 2020, 261, 127779. [Google Scholar] [CrossRef]
  9. Ni, G.; Shi, G.Y.; Hu, C.X.; Wang, X.; Nie, M.; Cai, M.M.; Cheng, Q.; Zhao, X.H. Selenium improved the combined remediation efficiency of Pseudomonas aeruginosa and ryegrass on cadmium-nonylphenol co-contaminated soil. Environ. Pollut. 2021, 287, 117552. [Google Scholar] [CrossRef]
  10. Zhang, X.L.; Li, R.X.; Song, J.T.; Ren, Y.Y.; Luo, X.; Li, Y.; Li, X.J.; Li, T.; Wang, X.; Zhou, Q.X. Combined phyto-microbial-electrochemical system enhanced the removal of petroleum hydrocarbons from soil: A profundity remediation strategy. J. Hazard. Mater. 2021, 420, 126592. [Google Scholar] [CrossRef]
  11. Zhu, Z.-Q.; Yang, X.-E.; Wang, K.; Huang, H.-G.; Zhang, X.; Fang, H.; Li, T.-Q.; Alva, A.; He, Z.-L. Bioremediation of Cd-DDT co-contaminated soil using the Cd-hyperaccumulator Sedum alfredii and DDT-degrading microbes. J. Hazard. Mater. 2012, 235–236, 144–151. [Google Scholar] [CrossRef] [PubMed]
  12. Koner, S.; Chen, J.S.; Hsu, B.M.; Rathod, J.; Huang, S.W.; Chien, H.Y.; Hussain, B.; Chan, M.W.Y. Depth-resolved microbial diversity and functional profiles of trichloroethylene-contaminated soils for Biolog EcoPlate-based biostimulation strategy. J. Hazard. Mater. 2022, 424, 127266. [Google Scholar] [CrossRef] [PubMed]
  13. Muñoz-Leoz, B.; Garbisu, C.; Charcosset, J.-Y.; Sánchez-Pérez, J.M.; Antigüedad, I.; Ruiz-Romera, E. Non-target effects of three formulated pesticides on microbially-mediated processes in a clay-loam soil. Sci. Total. Environ. 2013, 449, 345–354. [Google Scholar] [CrossRef] [PubMed] [Green Version]
  14. Samarajeewa, A.D.; Velicogna, J.R.; Princz, J.I.; Subasinghe, R.M.; Scroggins, R.P.; Beaudette, L.A. Effect of silver nano-particles on soil microbial growth, activity and community diversity in a sandy loam soil. Environ. Pollut. 2017, 220, 504–513. [Google Scholar] [CrossRef]
  15. Fragoeiro, S.; Magan, N. Impact of Trametes versicolor and Phanerochaete chrysosporium on differential breakdown of pesticide mixtures in soil microcosms at two water potentials and associated respiration and enzyme activity. Int. Biodeterior. Biodegrad. 2008, 62, 376–383. [Google Scholar] [CrossRef] [Green Version]
  16. Tejada, M.; Go´mez, I.; Toro, M.D. Use of organic amendments as a bioremediation strategy to reduce the bioavailability of chlorpyrifos insecticide in soils. Effects on soil biology. Ecotox. Environ. Safe. 2011, 74, 2075–2081. [Google Scholar] [CrossRef]
  17. Megharaj, M.; Kantachote, D.; Singleton, I.; Naidu, R. Effects of long-term contamination of DDT on soil microform with special reference to soil algae and algal transformation of DDT. Environ. Pollut. 2000, 109, 35–42. [Google Scholar] [CrossRef]
  18. Xie, H.; Zhu, L.S.; Wang, J. Combined treatment of contaminated soil with a bacterial Stenotrophomonas strain DXZ9 and ryegrass (Lolium perenne) enhances DDT and DDE remediation. Environ. Sci. Pollut. Res. 2018, 25, 31895–31905. [Google Scholar] [CrossRef]
  19. Xie, H.; Zhu, L.; Xu, Q.; Wang, J.; Liu, W.; Jiang, J.; Meng, Y. Isolation and degradation ability of the DDT-degrading bacterial strain KK. Environ. Earth Sci. 2010, 62, 93–99. [Google Scholar] [CrossRef]
  20. Guo, P.P.; Zhu, L.S.; Wang, J.H.; Wang, J.; Xie, H.; Lv, D.D. Enzymatic activities and microbial biomass in black soil as affected by azoxystrobin. Environ. Earth. Sci. 2015, 74, 1353–1361. [Google Scholar] [CrossRef]
  21. Wei, J.; Zhang, X.Y.; Liu, X.Y.; Liang, X.; Chen, X.P. Influence of root components of celery on pyrene bioaccessibility, soil enzymes and microbial communities in pyrene and pyrene-diesel spiked soils. Sci. Total. Environ. 2017, 599–600, 50–57. [Google Scholar] [CrossRef] [PubMed] [Green Version]
  22. Stpniewska, Z.; Wolińska, A.; Ziomek, J. Response of soil catalase activity to chromium contamination. J. Environ. Sci. 2009, 21, 1142–1147. [Google Scholar] [CrossRef]
  23. Chen, T.R.; Liu, X.Y.; Zhang, X.Y.; Chen, X.; Tao, K.Y.; Hu, X.X. Effect of alkyl polyglucoside and nitrilotriacetic acid combined application on lead/pyrene bioavailability and dehydrogenase activity in co-contaminated soils. Chemosphere 2016, 154, 515–520. [Google Scholar] [CrossRef] [PubMed]
  24. Zhang, Q.M.; Zhu, L.S.; Wang, J.; Xie, H.; Wang, J.H.; Wang, F.H.; Sun, F.X. Effects of fomesafen on soil enzyme activity, microbial population, and bacterial community composition. Environ. Monit. Assess. 2014, 186, 2801–2812. [Google Scholar] [CrossRef] [PubMed]
  25. Yousaf, S.; Andria, V.; Reichenauer, T.G.; Smalla, K.; Sessitsch, A. Phylogenetic and functional diversity of alkane degrading bacteria associated with Italian ryegrass (Lolium multiflorum) and Birdsfoot trefoil (Lotus corniculatus) in a petroleum oil-contaminated environment. J. Hazard. Mater. 2010, 184, 523–532. [Google Scholar] [CrossRef] [PubMed]
  26. Gao, M.L.; Dong, Y.M.; Zhang, Z.; Song, Z.G. Effect of dibutyl phthalate on microbial function diversity and enzyme activity in wheat rhizosphere and non-rhizosphere soils. Environ. Pollut. 2020, 265, 114800. [Google Scholar] [CrossRef] [PubMed]
  27. Wu, M.; Li, W.; Dick, W.A.; Ye, X.; Chen, K.; Kost, D.; Chen, L. Bioremediation of hydrocarbon degradation in a petroleum-contaminated soil and microbial population and activity determination. Chemosphere 2017, 169, 124–130. [Google Scholar] [CrossRef]
  28. Wang, B.B.; Wang, Q.L.; Liu, W.X.; Liu, X.Y.; Hou, J.Y.; Teng, Y.; Luo, Y.M.; Christie, P. Biosurfactant-producing microorganism Pseudomonas sp. SB assists the phytoremediation of DDT-contaminated soil by two grass species. Chemosphere 2017, 182, 137–142. [Google Scholar] [CrossRef]
  29. Siciliano, S.D.; Fortin, N.; Mihoc, A.; Wisse, G.; Labelle, S.; Beaumier, D.; Ouellette, D.; Roy, R.; Whyte, L.G.; Banks, M.K.; et al. Selection of Specific Endophytic Bacterial Genotypes by Plants in Response to Soil Contamination. Appl. Environ. Microbiol. 2001, 67, 2469–2475. [Google Scholar] [CrossRef] [Green Version]
  30. Wang, S.; Zhang, S.; Huang, H.; Christie, P. Behavior of decabromodiphenyl ether (BDE-209) in soil: Effects of rhizosphere and mycorrhizal colonization of ryegrass roots. Environ. Pollut. 2011, 159, 749–753. [Google Scholar] [CrossRef] [Green Version]
  31. Xie, X.; Liao, M.; Fang, S.; Peng, Y.; Yang, J.; Chai, J. Spacial characteristics of pyrene degradation and soil microbial activity with the distance from the ryegrass (Lolium perenne L.) root surface in a multi-interlayer rhizobox. J. Hazard. Mater. 2012, 213–214, 156–160. [Google Scholar] [CrossRef] [PubMed]
  32. Anderson, T.A.; Guthrie, E.A.; Walton, B.T. Bioremediation in the rhizosphere. Environ. Sci. Technol. 1993, 27, 2630–2636. [Google Scholar] [CrossRef]
  33. Rentz, J.A.; Alvarez, P.J.J.; Schnoor, J.L. Benzo[a]pyrene co-metabolism in the presence of plant root extracts and exudates: Implications for phytoremediation. Environ. Pollut. 2005, 136, 477–484. [Google Scholar] [CrossRef]
  34. Korade, D.L.; Fulekar, M. Rhizosphere remediation of chlorpyrifos in mycor rhizospheric soil using ryegrass. J. Hazard. Mater. 2009, 172, 1344–1350. [Google Scholar] [CrossRef]
  35. Kidd, P.S.; Prieto-Fernandez, A.; Monterroso, C.; Acea, M.J. Rhizosphere microbial community and hexachlorocyclohexane degradative potential in contrasting plant species. Plant Soil 2007, 302, 233–247. [Google Scholar] [CrossRef]
  36. Tang, J.C.; Wang, R.G.; Niu, X.W.; Zhou, Q.X. Enhancement of soil petroleum remediation by using a combination of ryegrass (Lolium perenne) and different microorganisms. Soil Tillage Res. 2010, 110, 87–93. [Google Scholar] [CrossRef]
  37. Wang, J.J.; Hu, S.B.; Wei, L.Q.; Chai, Q.Q.; Liu, J.B.; Wang, J.Y.; Yang, W.X. Phytoremediation of polycyclic aromatic hydrocarbons (PAHs)-contaminated soil by intercropped beet-grasses. J. Agro-Environ. Sci. 2016, 35, 1090–1096. (In Chinese) [Google Scholar]
  38. Ye, J.; Yin, H.; Peng, H.; Bai, J.; Li, Y. Pyrene removal and transformation by joint application of alfalfa and exogenous microorganisms and their influence on soil microbial community. Ecotoxicol. Environ. Saf. 2014, 110, 129–135. [Google Scholar] [CrossRef]
  39. Wu, M.L.; Dick, W.A.; Li, W.; Wang, Q.Y.X.; Yang, Q.; Wang, T.T.; Xu, L.M.; Zhang, M.H.; Chen, L.M. Bioaugmentation and biostimulation of hydrocarbon degradation and the microbial community in a petroleum-contaminated soil. Int. Biodeterior. Biodegrad. 2016, 107, 158–164. [Google Scholar] [CrossRef]
Figure 1. Experimental design and photos of the experiment on day 10th.
Microbiolres 13 00005 g001
Figure 2. Change of microbial quantity in the soil during the bioremediation process. The error bar indicates standard deviation; the letters (a, b and c) in columns indicate significant differences at p < 0.05 level among 6 treatments at the same times. (a) bacteria; (b) fungi; (c) actinomycetes.
Microbiolres 13 00005 g002aMicrobiolres 13 00005 g002b
Figure 3. Change of enzyme activity in the soil during the bioremediation process. The error bar indicates the standard deviation; the letters (a, b, c and d) in columns indicate significant differences at p < 0.05 level among 6 treatments at the same times. (a) polyphenol oxidase. (b) urease activity. (c) dehydrogenase. (d) catalase activity.
Microbiolres 13 00005 g003aMicrobiolres 13 00005 g003bMicrobiolres 13 00005 g003c
Figure 4. Fingerprint of DGGE and analyzed result in the bacterial from the soil with six treatments on the 10th day. (a) DNA electrophoresis fingerprint of DGGE; (b) diagram of compared lane images; (c) UPGAMA of phylogenetic tree. 10-1~10-6: S + G + D + B, S + G + D-10, S + G-10, S + D + B-10, S + D-10, S-10.
Microbiolres 13 00005 g004aMicrobiolres 13 00005 g004b
Figure 5. Fingerprint of DGGE and analyzed result in the soil with six treatments on the 90th day. (a) DNA electrophoresis fingerprint of DGGE; (b) diagram of compare lane images; (c) UPGAMA of phylogenetic tree. 90-1~90-6: S + G + D + B-90, S + G + D-90, S + G-90, S + D + B-90, S + D-90, S-90.
Microbiolres 13 00005 g005aMicrobiolres 13 00005 g005b
Figure 6. Fingerprint of DGGE and analyzed result in the soil with different treatments on the 210th day. (a) DNA electrophoresis fingerprint of DGGE; (b) diagram of compare lane images; (c) UPGAMA of phylogenetic tree. 210-1~210-6: S + G + D + B-210, S + G + D-210, S + G-210, S + D + B-210, S + D-210, S-210.
Microbiolres 13 00005 g006aMicrobiolres 13 00005 g006b
Figure 7. Fingerprint of DGGE in the soil with the same treatments and different times. (a) DNA electrophoresis fingerprint of DGGE; (b) diagram of compare lane images; (c) UPGAMA of phylogenetic tree. 10-1~10-3: S + D-10, S + D + B-10, S + G + D + B-10; 30-1~30-3: S + D-30, S + D + B-30, S + G + D + B-30; 90-1~90-3: S + D-90, S + D + B-90, S + G + D + B-90; 210-1~210-3: S + D-210, S + D + B-210, S + G + D + B-210.
Microbiolres 13 00005 g007aMicrobiolres 13 00005 g007b
Table 1. The residual concentration of p,p′-DDT and p,p′-DDE in different treated soils on different days.
Time (Day)TreatmentMean Concentration (mg·kg−1)
p,p′-DDEp,p′-DDDp,p′-DDTTotal Concentration
0 1.26 ± 0.180.16 ± 0.062.23 ± 0.253.65
5S + G + D + B0.75 ± 0.12 c0.14 ± 0.04 a1.51 ± 0.07 c2.4
S + D + B0.79 ± 0.09 c0.14 ± 0.02 a1.58 ± 0.05 c2.51
S + G + D0.87 ± 0.05 b0.16 ± 0.03 a1.70 ± 0.08 b2.73
S + D1.15 ± 0.07 a0.16 ± 0.02 a2.11 ± 0.11 a3.42
10S + G + D + B0.69 ± 0.03 c0.13 ± 0.01 a1.32 ± 0.10 c2.14
S + D + B0.74 ± 0.04 c0.13 ± 0.01 a1.41 ± 0.12 c2.28
S + G + D0.84 ± 0.08 b0.16 ± 0.03 a1.53 ± 0.15 b2.53
S + D1.06 ± 0.09 a0.16 ± 0.02 a2.08 ± 0.17 a3.30
30S + G + D + B0.70 ± 0.03 c0.13 ± 0.03 a1.27 ± 0.11 c2.10
S + D + B0.70 ± 0.02 c0.13 ± 0.02 a1.31 ± 0.10 c2.14
S + G + D0.83 ± 0.05 b0.15 ± 0.01 a1.45 ± 0.13 b2.43
S + D0.99 ± 0.07 a0.15 ± 0.02 a1.85 ± 0.17 a2.99
60S + G + D + B0.71 ± 0.02 b0.12 ± 0.03 a1.06 ± 0.09 c1.89
S + D + B0.75 ± 0.04 b0.13 ± 0.02 a1.11 ± 0.08 b,c1.99
S + G + D0.79 ± 0.03 b0.15 ± 0.02 a1.16 ± 0.07 b2.1
S + D0.95 ± 0.07 a0.15 ± 0.04 a1.72 ± 0.10 a2.82
90S + G + D + B0.69 ± 0.02 b0.12 ± 0.03 a0.85 ± 0.061.66
S + D + B0.73 ± 0.01 b0.12 ± 0.02 a0.90 ± 0.031.70
S + G + D0.75 ± 0.03 b0.13 ± 0.04 a0.99 ± 0.051.87
S + D0.92 ± 0.04 a0.13 ± 0.01 a1.66 ± 0.092.71
150S + G + D + B0.68 ± 0.02 b0.17 ± 0.03 a0.75 ± 0.08 b1.60
S + D + B0.69 ± 0.04 b0.16 ± 0.01 a0.78 ± 0.06 b1.63
S + G + D0.70 ± 0.06 b0.15 ± 0.02 a0.80 ± 0.05 b1.65
S + D0.90 ± 0.03 a0.14 ± 0.01 a1.60 ± 0.12 a2.64
210S + G + D + B0.56 ± 0.01 c0.14 ± 0.02 a0.43 ± 0.01 d1.13
S + D + B0.60 ± 0.02b c0.15 ± 0.01 a0.51 ± 0.03 c1.26
S + G + D0.65 ± 0.02 b0.16 ± 0.03 a0.62 ± 0.06 b1.43
S + D0.87 ± 0.03 a0.17 ± 0.02 a1.56 ± 0.09 a2.60
Note: mean is expressed as X ± SD; comparison between different treatments at the same time; different letters (a, b, c and d) mean significant differences (p < 0.05); on the contrary, having no significant differences (p > 0.05).
Table 2. Calculation method dice coefficient of similarity matrix on 10 d, 90 d and 210 d (%).
Time
(Day)
Lane123456
10110072.2411.41.61.7
2 10040.52.22.52.5
3 10012.25.85.9
4
5 10059.7
90110038.254.878.233.279.1
2 10035.035.031.927.3
3 10052.535.253.9
4 10040.876.9
5 10038.1
210110075.574.466.161.662.6
2 10081.868.671.270.6
3 10071.373.171.0
4 10077.377.8
5 79.8
Note: lane 1~6: S + G + D + B, S + G + D-10, S + G-10, S + D + B-10, S + D-10, S-10. If the value is greater, it means that the similarity was greater and the impact was lower.
Table 3. Calculation method dice coefficient of similarity matrix with the same treatments and different times (%).
Lane123456789101112
110043.537.920.724.534.116.410.036.338.132.830.2
2 10072.772.571.257.066.551.065.265.163.066.0
3 10070.866.853.961.155.556.161.865.957.9
4 10086.750.871.859.050.854.666.064.3
5 10052.771.662.653.651.666.960.9
6 10067.957.267.942.643.145.9
7 10076.554.651.166.461.9
8 10046.246.662.550.3
9 10042.938.853.8
10 10064.463.6
11 10056.9
Note: lane 1~12: S + D-10, S + D + B-10, S + G + D + B-10; S + D-30, S + D + B-30, S + G + D + B-30; S + D-90, S + D + B-90, S + G + D + B-90; S + D-210, S + D + B-210, S + G + D + B-210.
Publisher’s Note: MDPI stays neutral with regard to jurisdictional claims in published maps and institutional affiliations.

