
Assessing Chemical Intolerance in Parents Predicts the Risk of Autism and ADHD in Their Children
Abstract
:
1. Introduction
1.1. Autism
1.2. Attention Deficit Hyperactivity Disorder (ADHD)
1.3. Autism, ADHD, and Chemical Intolerance (CI)
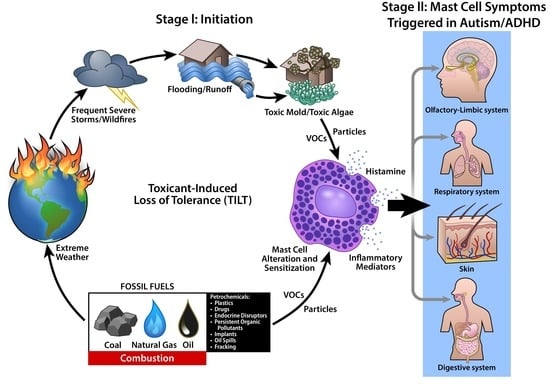
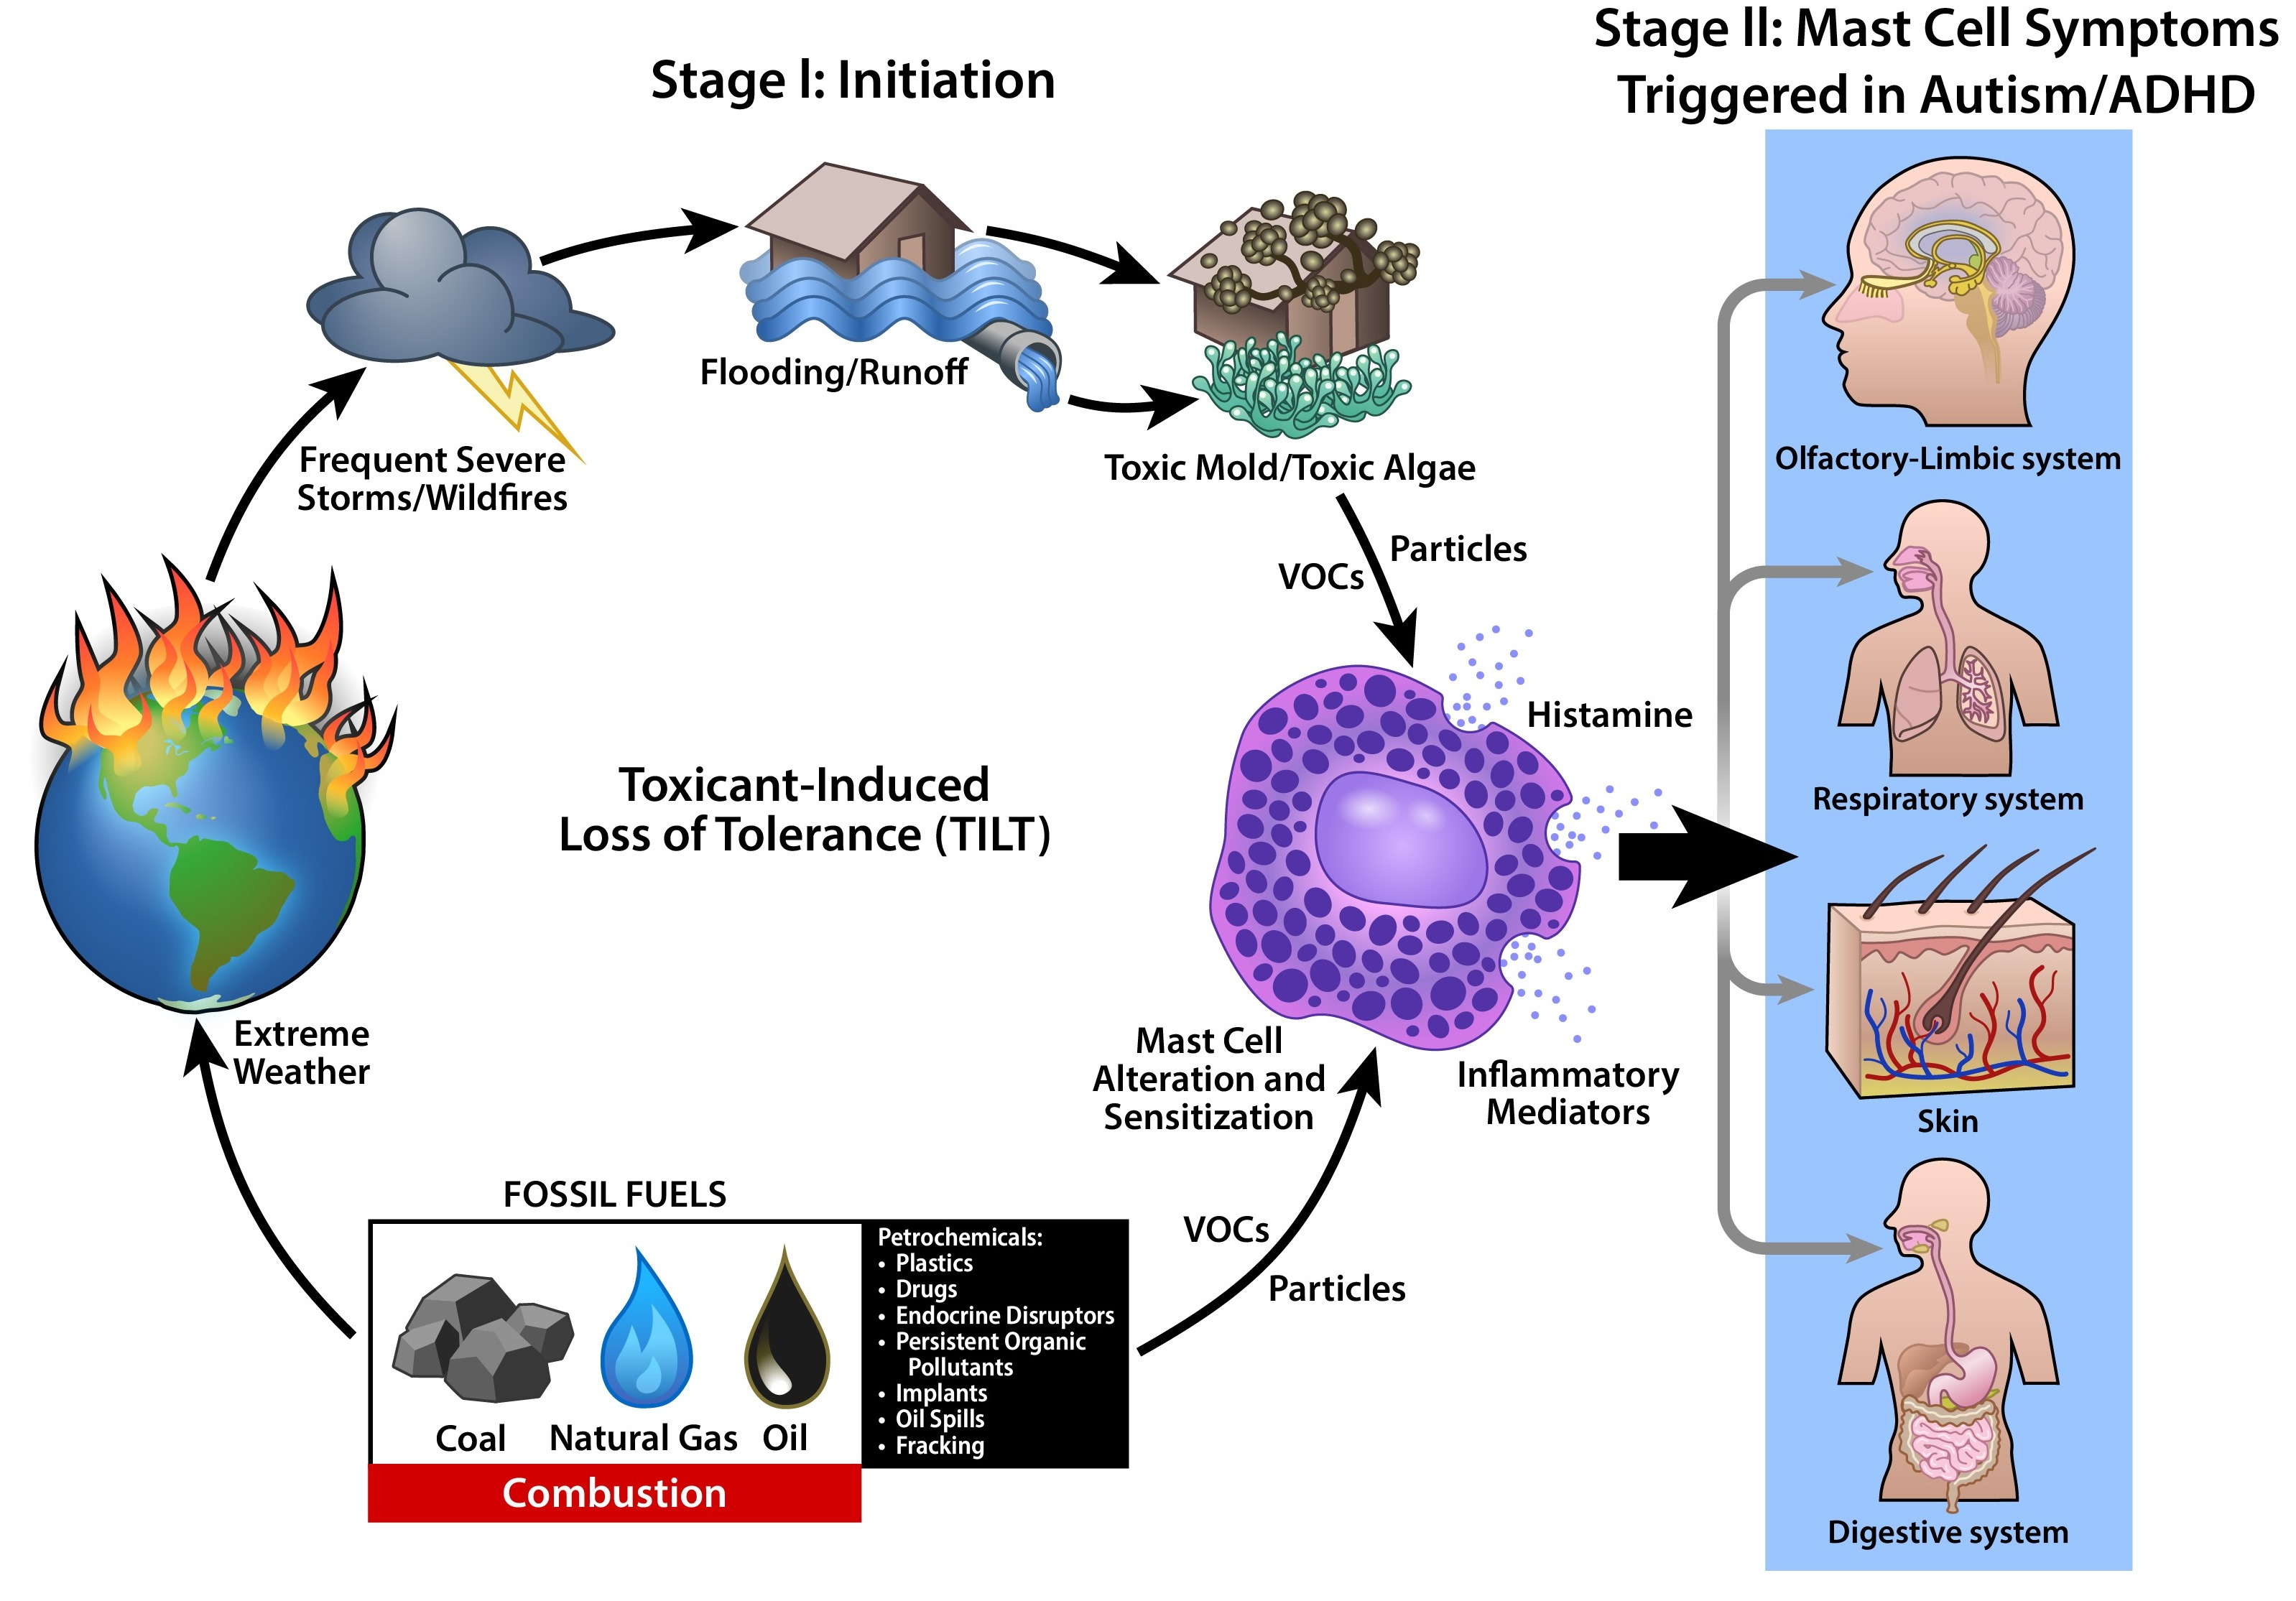
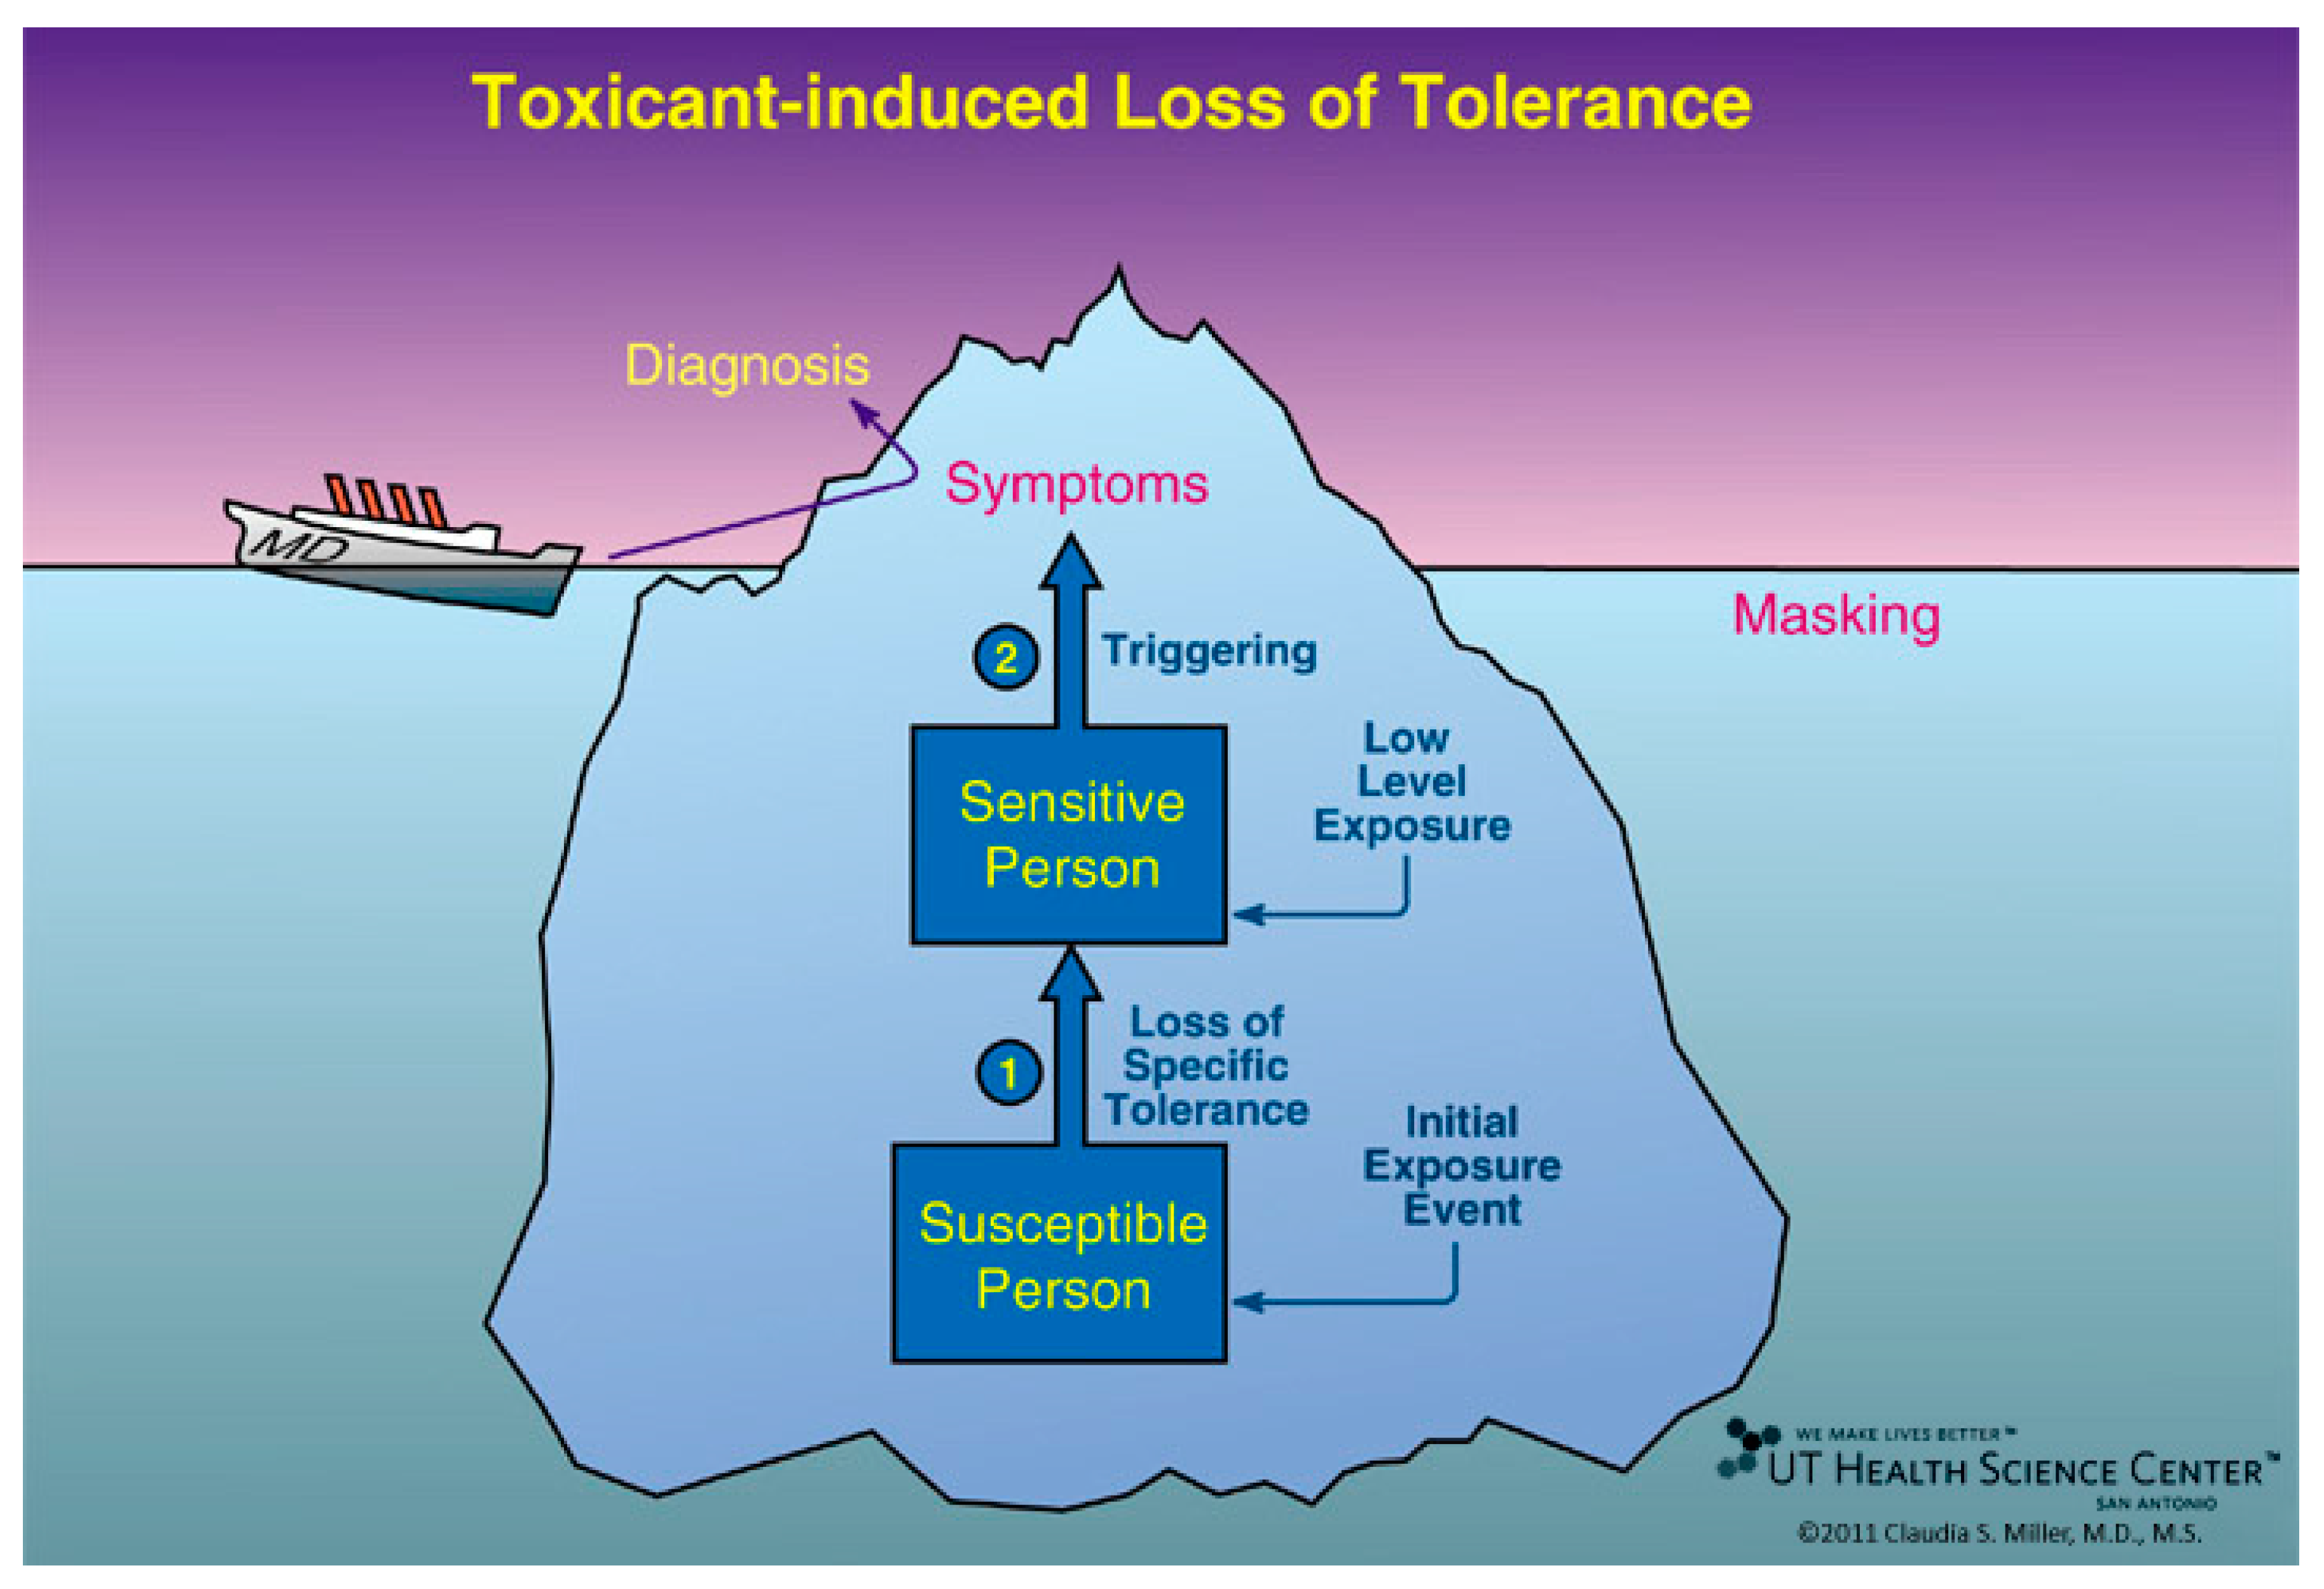
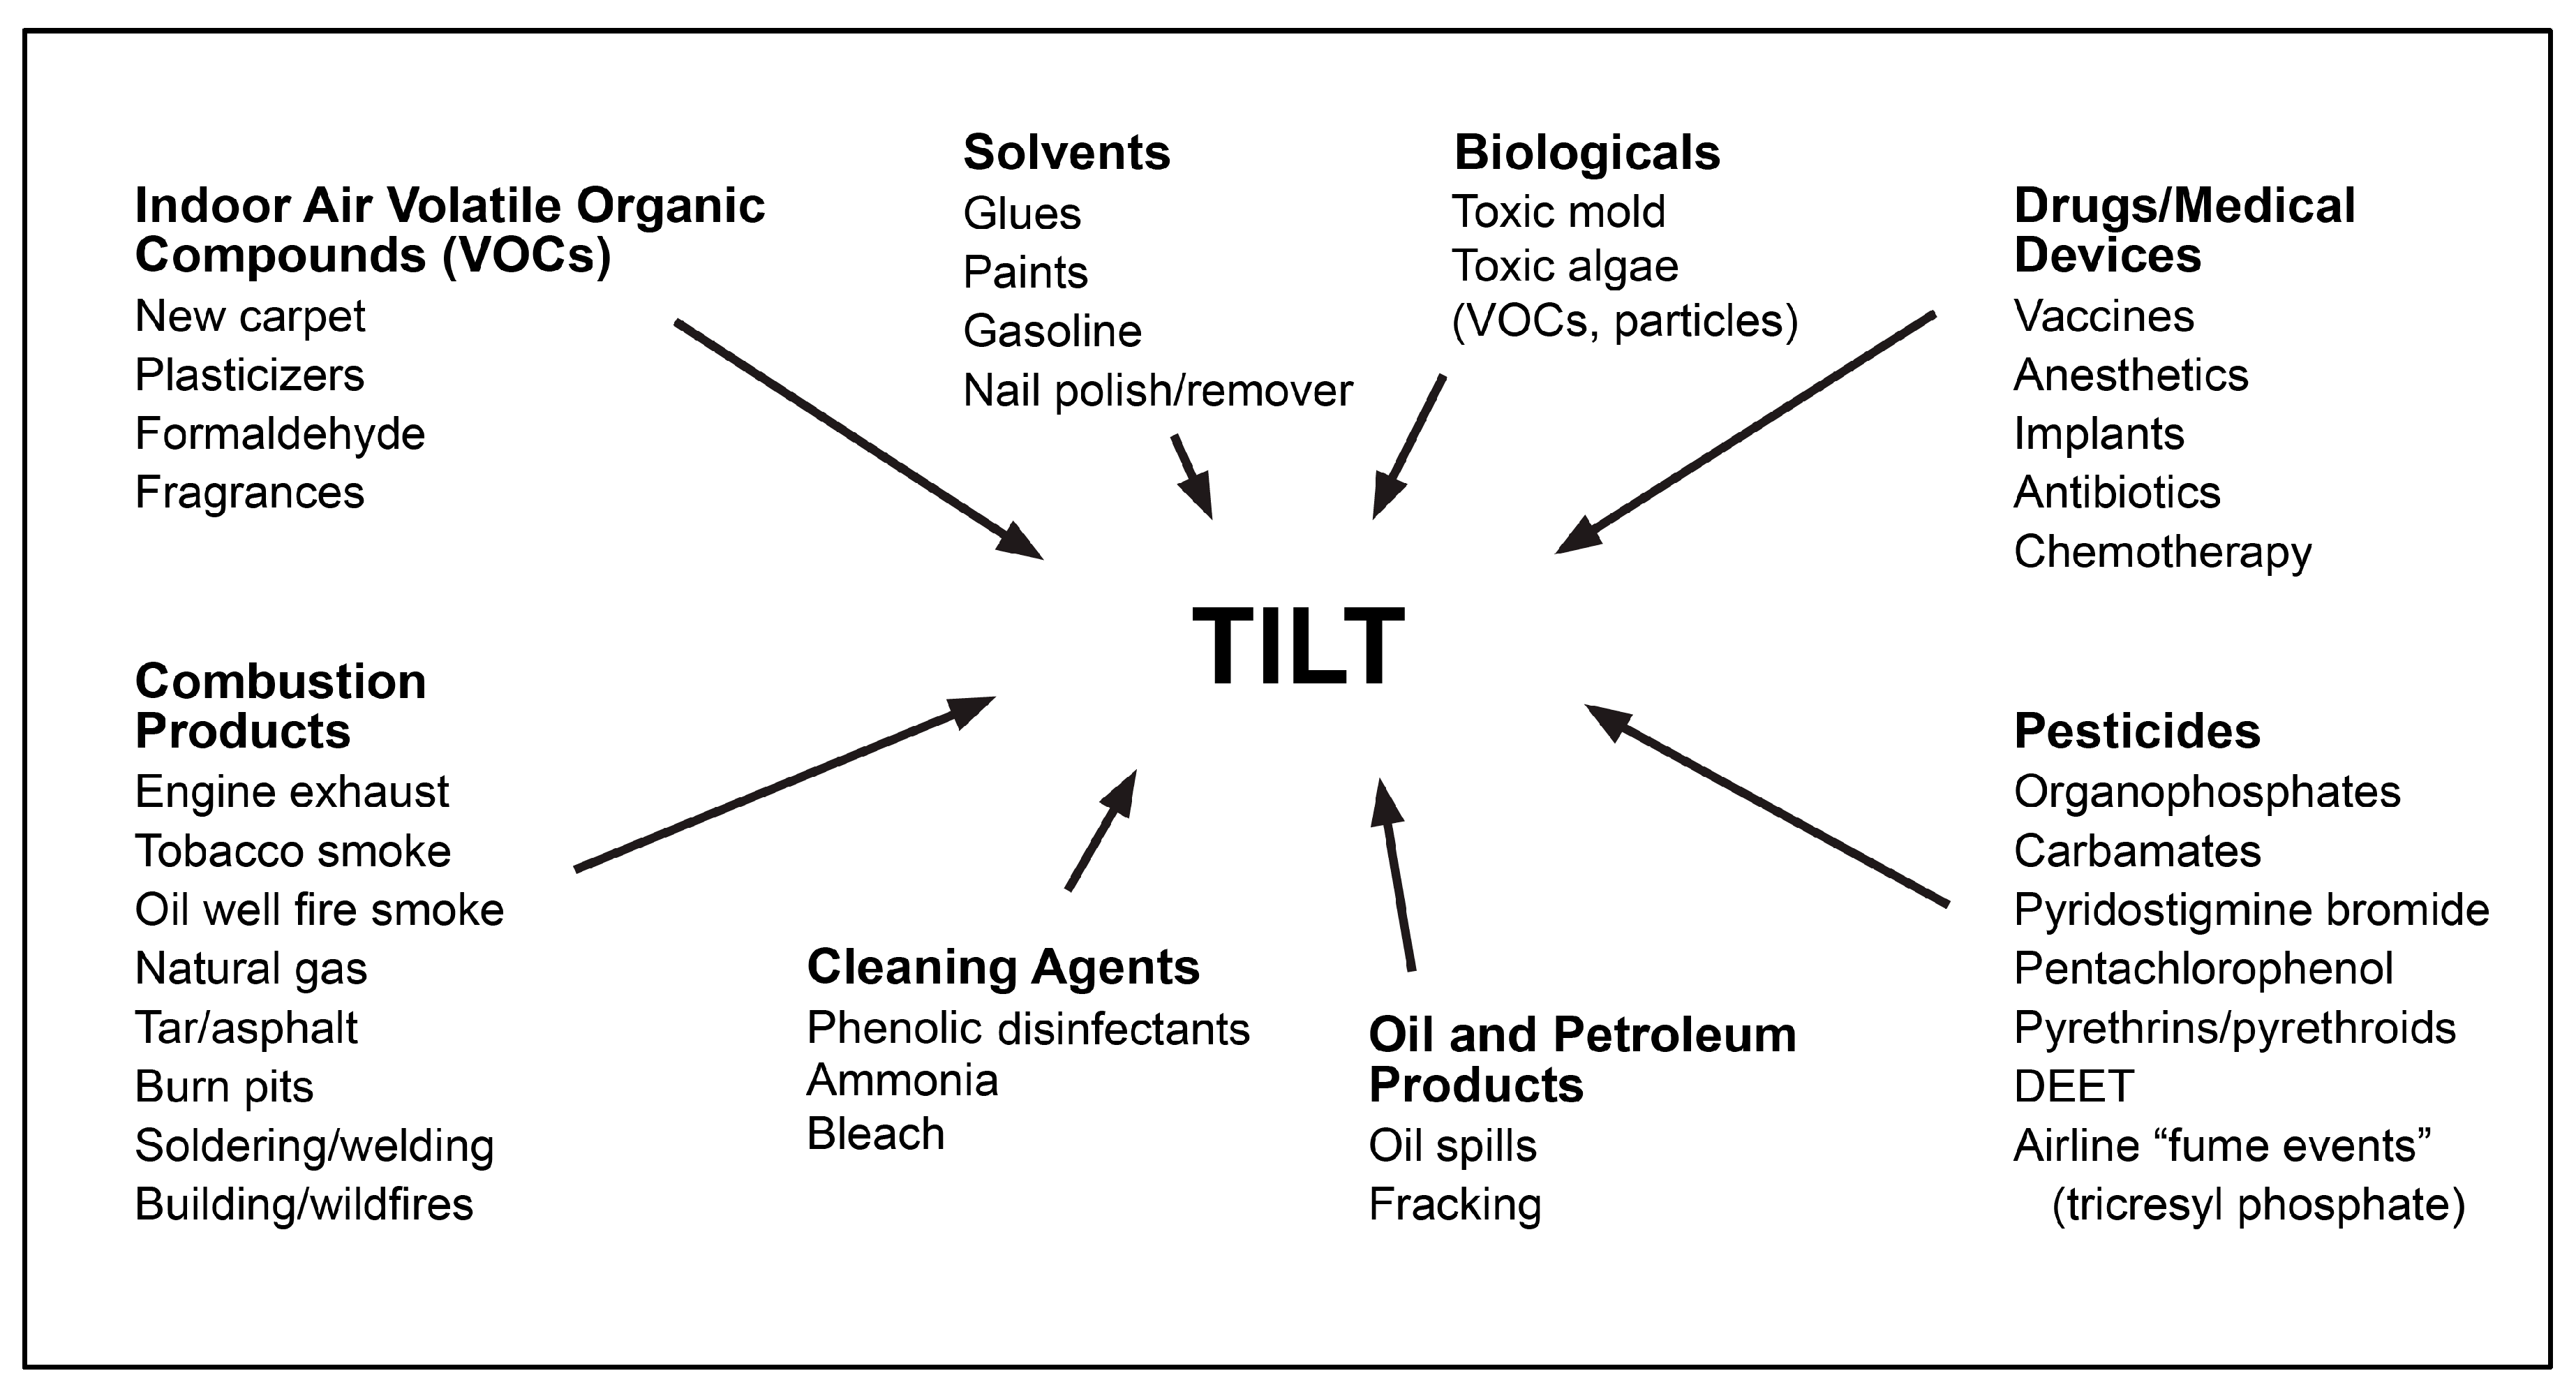
1.4. Toxicant-Induced Loss of Tolerance (TILT)
2. Materials and Methods
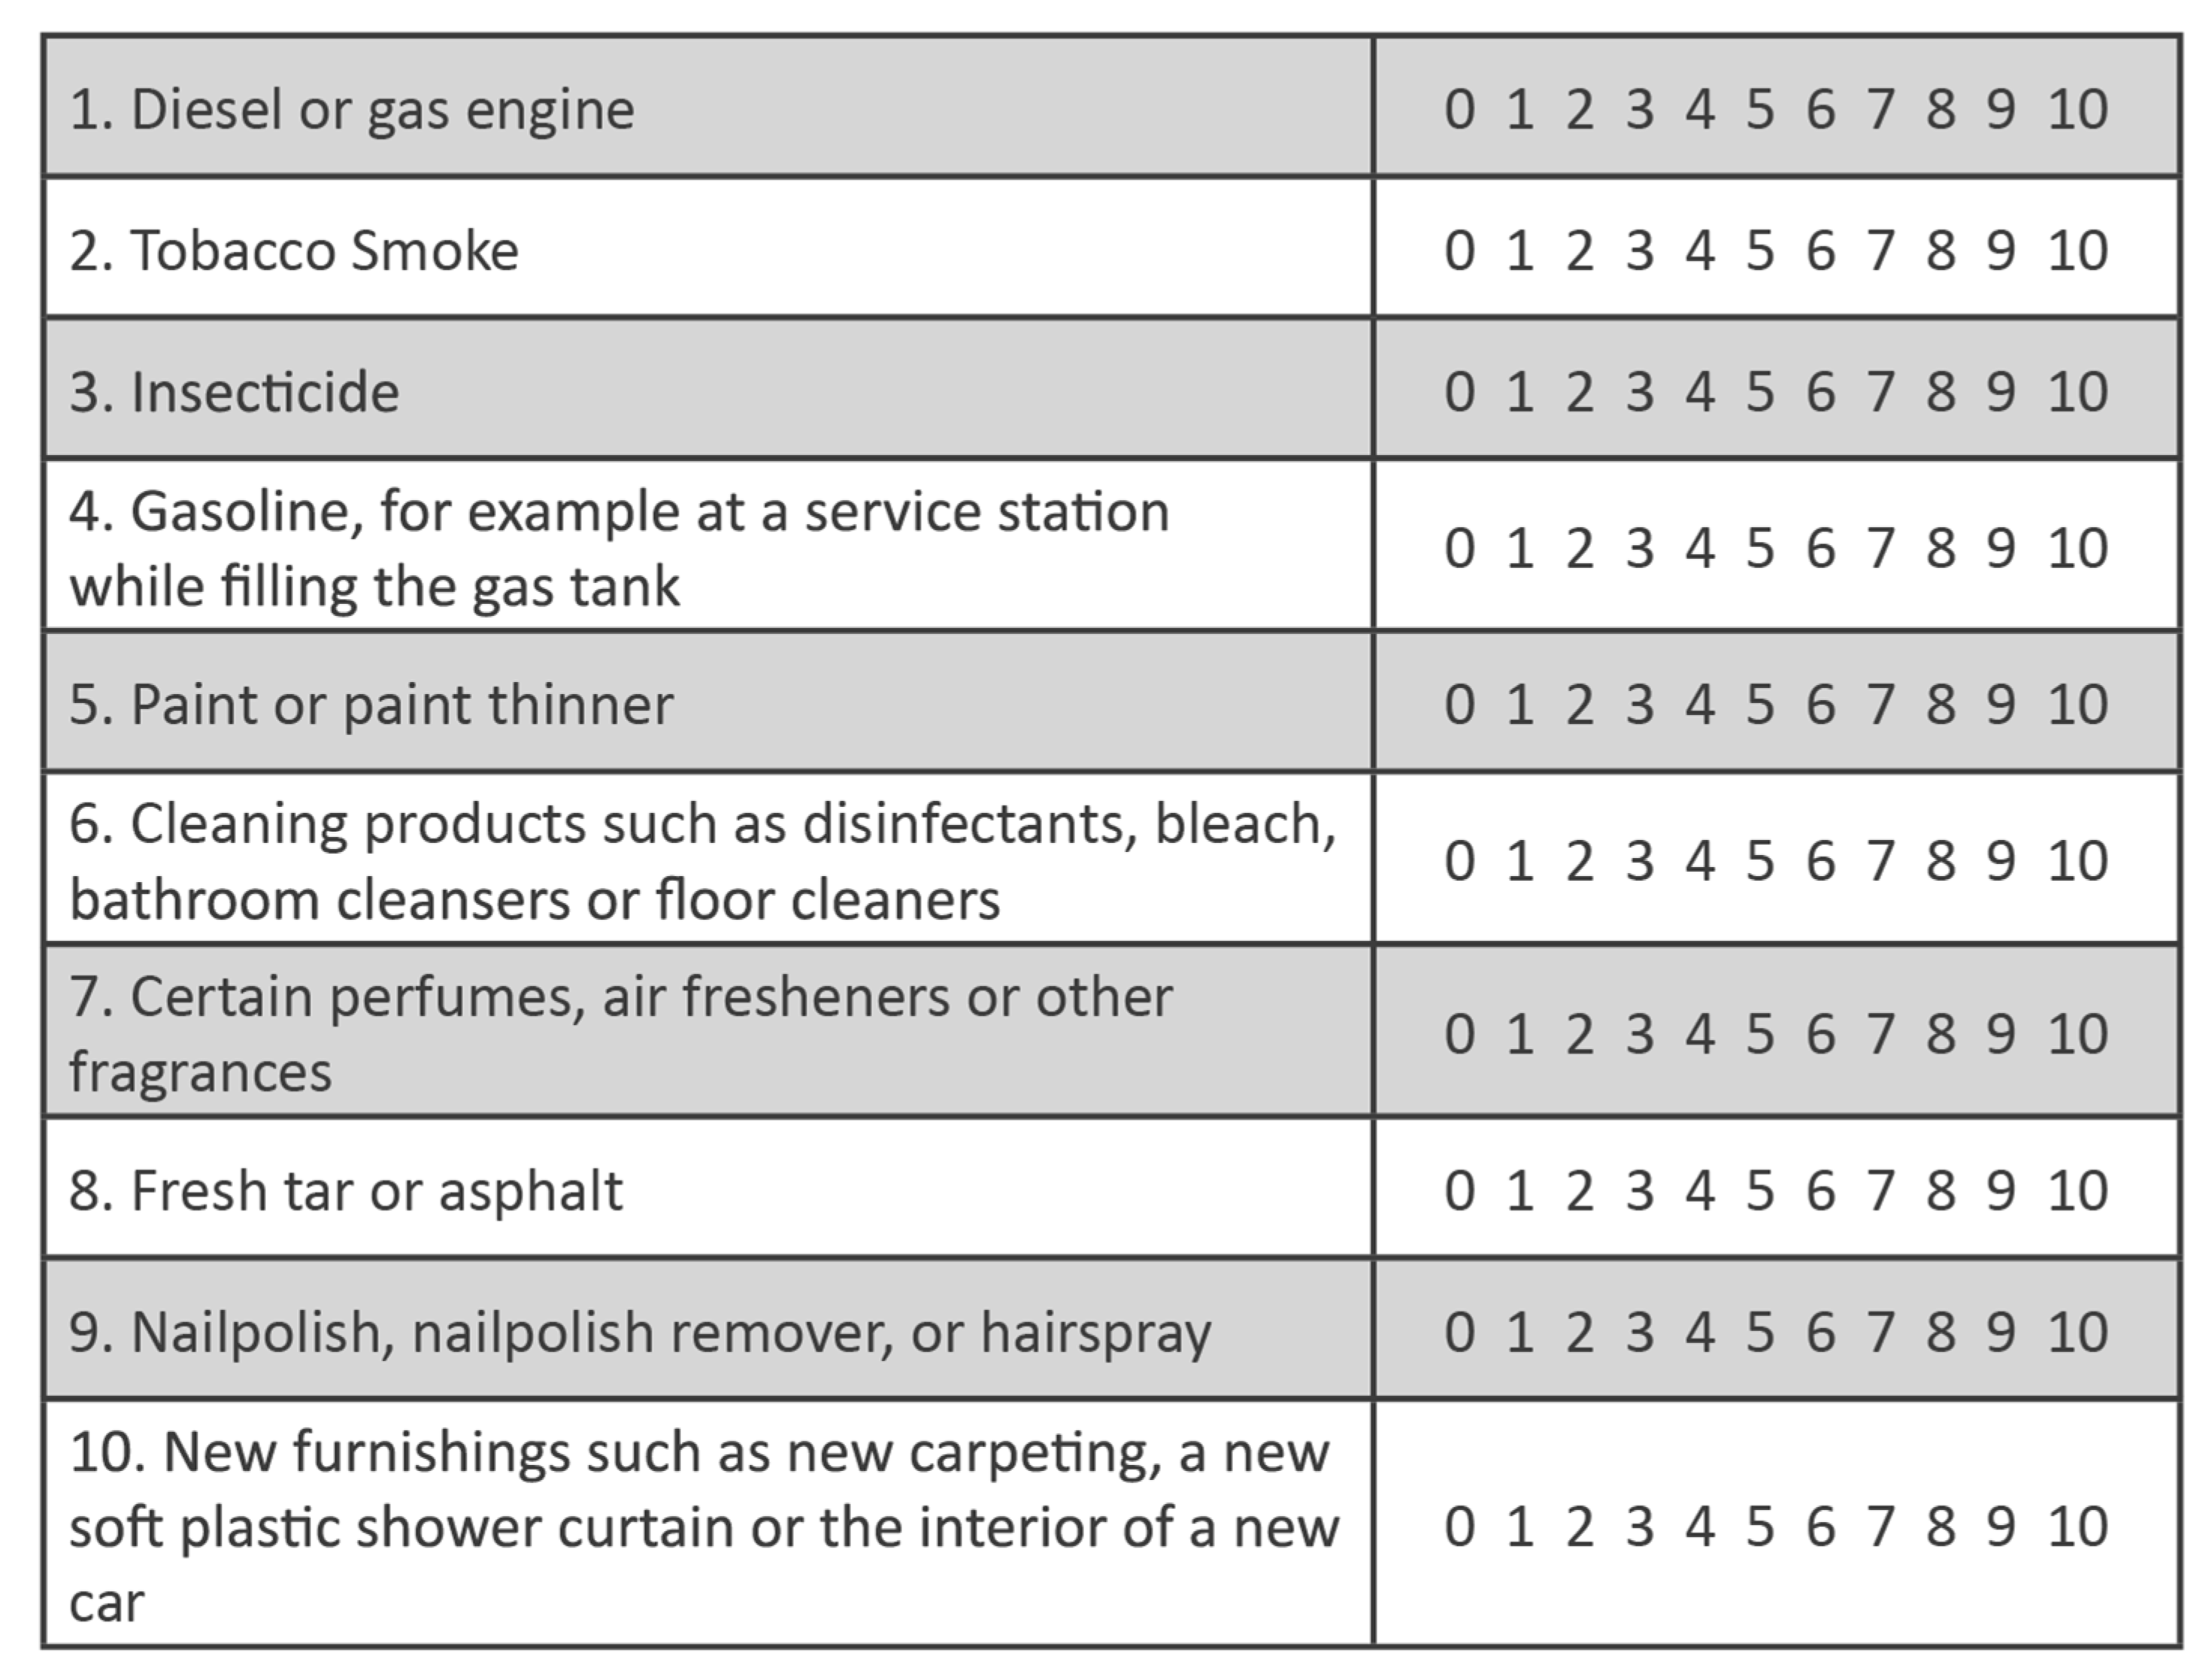
2.1. Survey
2.2. QEESI Scoring
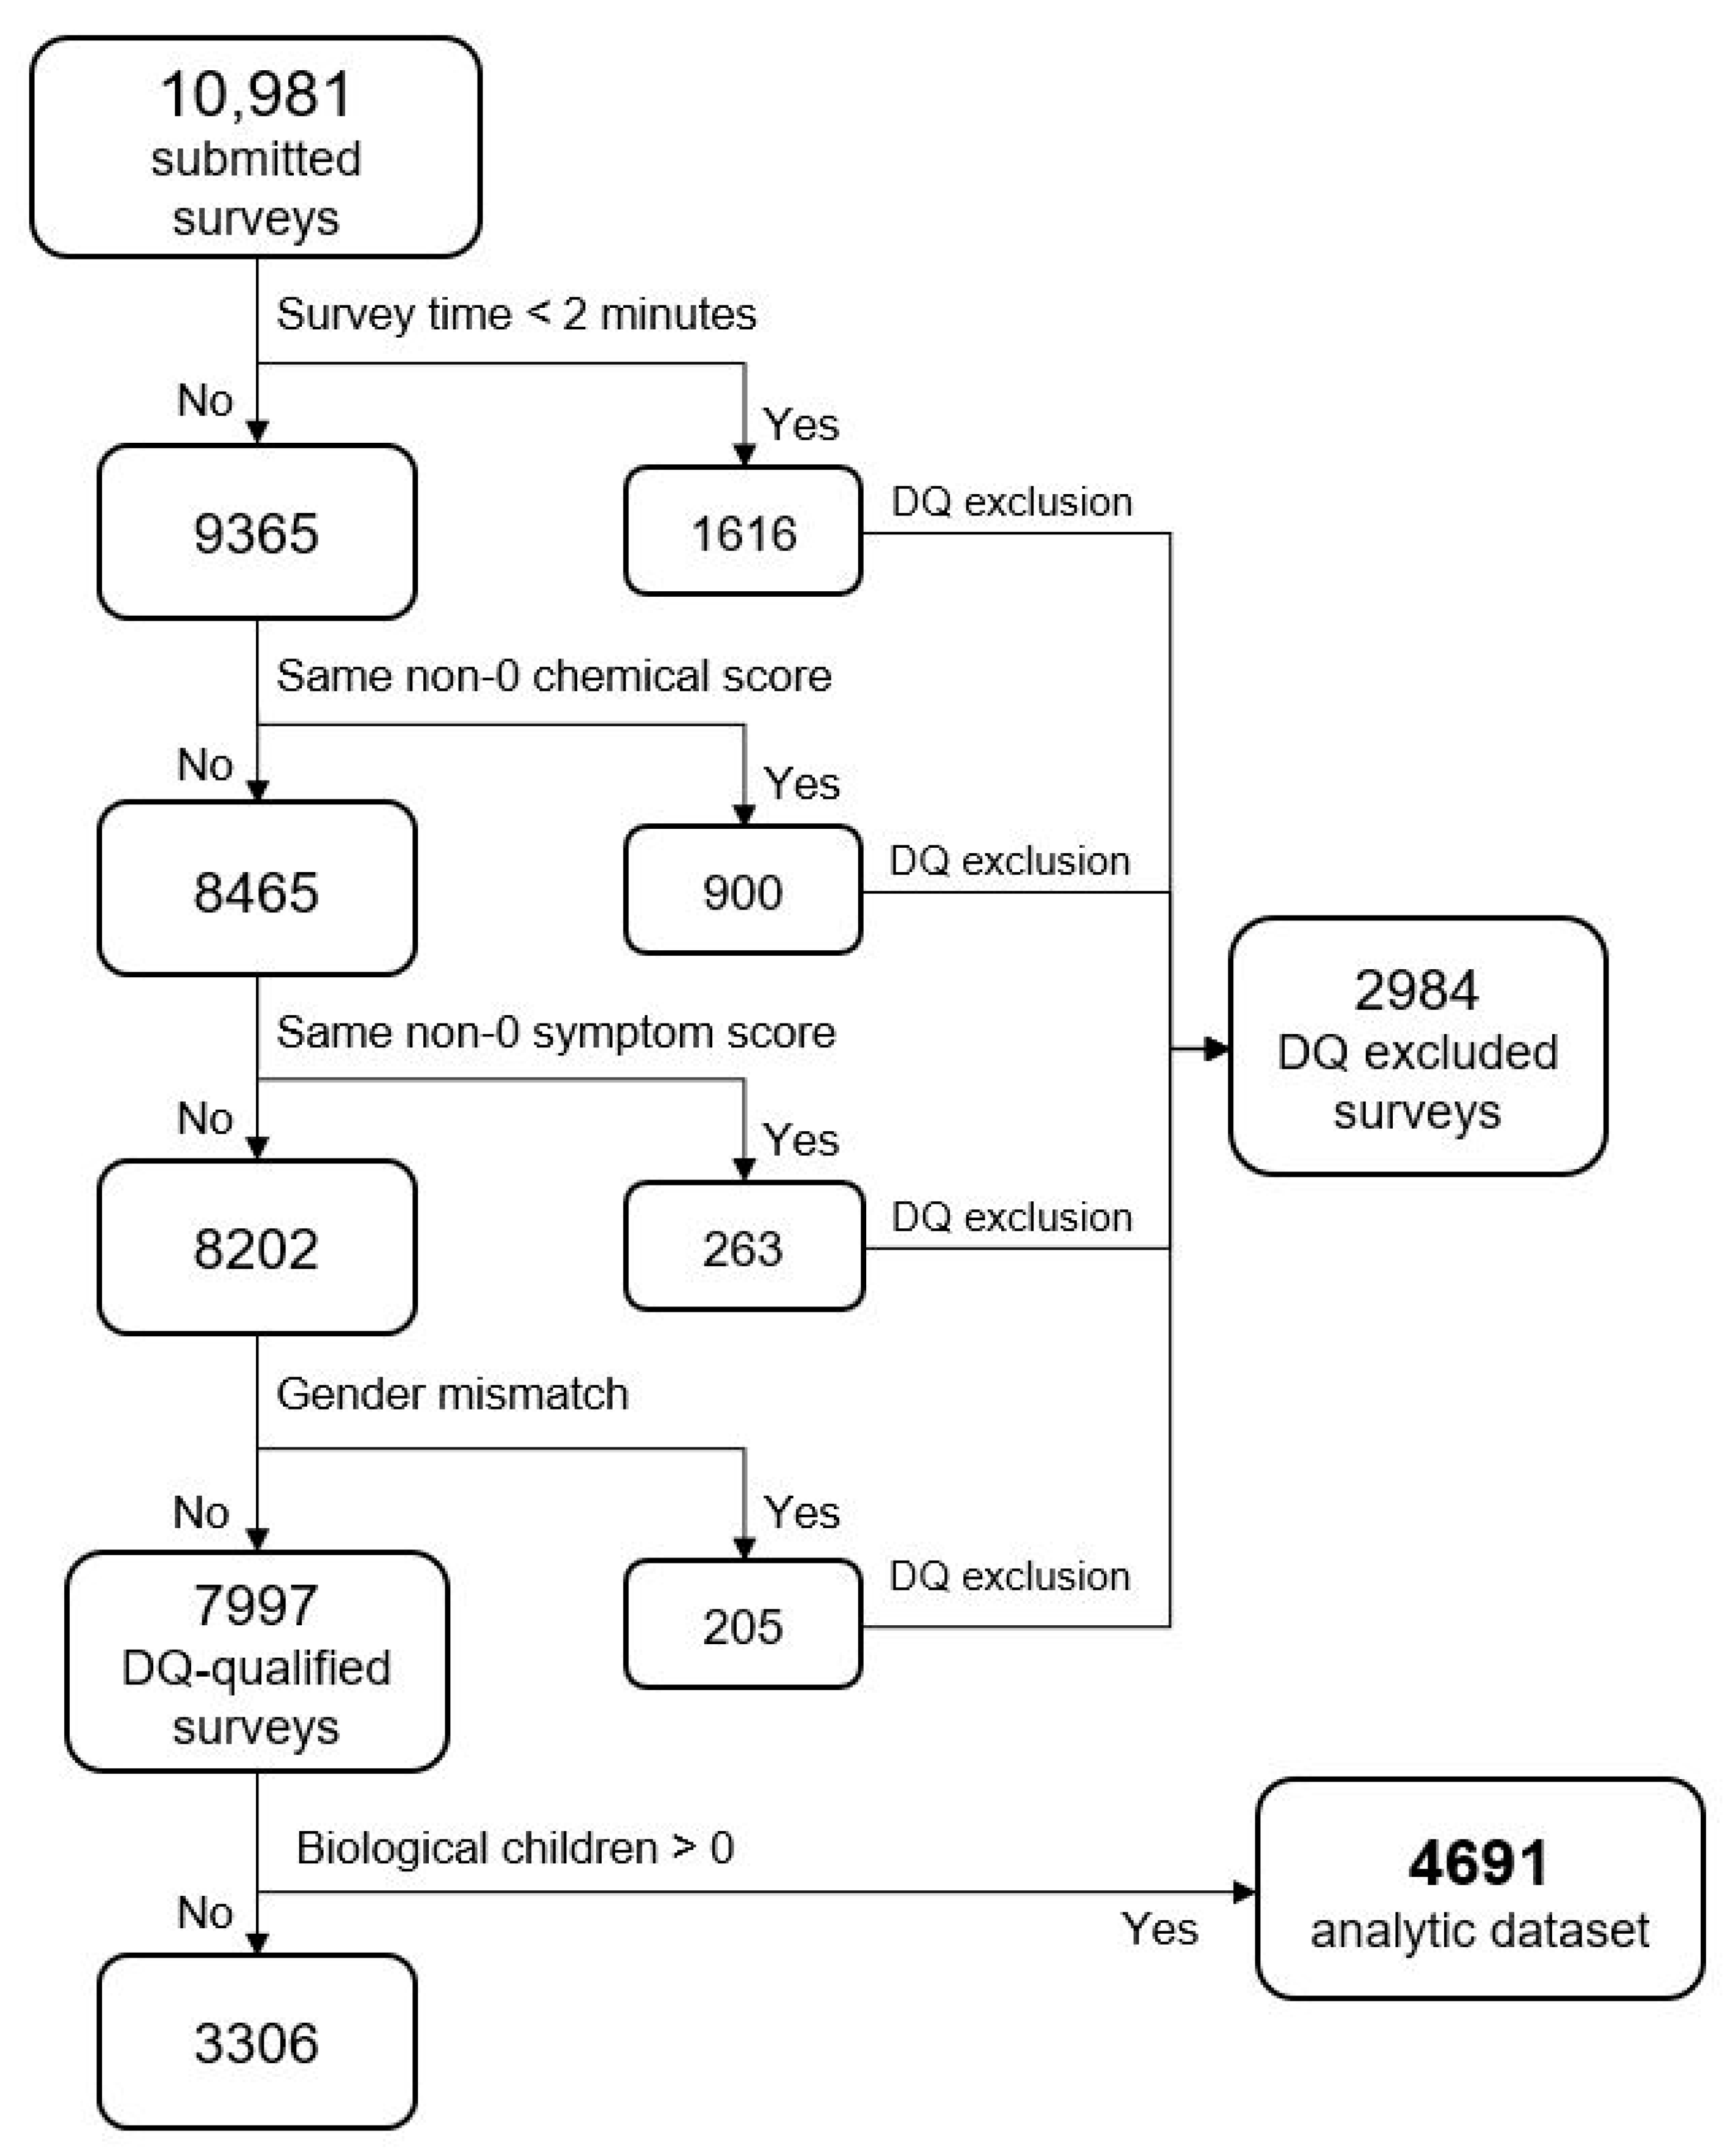
2.3. Data Quality Control Checks
2.4. Statistical Modeling
3. Results
4. Discussion
4.1. Indoor vs. Outdoor Air
4.2. Toxicant-Induced Epigenetic Changes Could Explain CI and the Heritability of Autism and ADHD
4.3. TILT and Mast Cells as a Plausible Biomechanism for Autism and ADHD
4.4. Autism Intervention and Support
4.5. Prevention
4.6. Study Limitations
4.6.1. Survey Methodology
4.6.2. Missing Information
4.6.3. Autism/ADHD Definition
5. Conclusions
- Increase awareness of autism/ADHD prevention by assessing CI using the QEESI.
- Conduct population-based surveys to determine the prevalence of CI in other populations, countries, and regions.
- Fund research to improve prevention, and environmental and medical interventions related to CI, TILT, mast cells, and autism/ADHD.
Supplementary Materials
Author Contributions
Funding
Institutional Review Board Statement
Informed Consent Statement
Data Availability Statement
Conflicts of Interest
References
- American Psychiatric Association. Diagnostic and Statistical Manual of Mental Disorders, 5th ed.; American Psychiatric Association: Arlington, VA, USA, 2013. [Google Scholar]
- Maenner, M.J.; Warren, Z.; Williams, A.R.; Amoakohene, E.; Bakian, A.V.; Bilder, D.A.; Durkin, M.S.; Fitzgerald, R.T.; Furnier, S.M.; Hughes, M.M.; et al. Prevalence and Characteristics of Autism Spectrum Disorder Among Children Aged 8 Years—Autism and Developmental Disabilities Monitoring Network, 11 Sites, United States, 2020. MMWR Surveill. Summ. 2023, 72, 1–14. [Google Scholar] [CrossRef] [PubMed]
- Li, Q.; Li, Y.; Liu, B.; Chen, Q.; Xing, X.; Xu, G.; Yang, W. Prevalence of Autism Spectrum Disorder Among Children and Adolescents in the United States from 2019 to 2020. JAMA Pediatr. 2022, 176, 943–945. [Google Scholar] [CrossRef] [PubMed]
- Zeidan, J.; Fombonne, E.; Scorah, J.; Ibrahim, A.; Durkin, M.S.; Saxena, S.; Yusuf, A.; Shih, A.; Elsabbagh, M. Global prevalence of autism: A systematic review update. Autism Res. 2022, 15, 778–790. [Google Scholar] [CrossRef]
- Hertz-Picciotto, I.; Delwiche, L. The rise in autism and the role of age at diagnosis. Epidemiology 2009, 20, 84–90. [Google Scholar] [CrossRef]
- Bhandari, R.; Paliwal, J.K.; Kuhad, A. Neuropsychopathology of Autism Spectrum Disorder: Complex Interplay of Genetic, Epigenetic, and Environmental Factors. Adv. Neurobiol. 2020, 24, 97–141. [Google Scholar] [CrossRef]
- Keil-Stietz, K.; Lein, P.J. Gene× environment interactions in autism spectrum disorders. Curr. Top. Dev. Biol. 2023, 152, 221–284. [Google Scholar]
- Lipkin, W.I.; Bresnahan, M.; Susser, E. Cohort-guided insights into gene–environment interactions in autism spectrum disorders. Nat. Rev. Neurol. 2023, 19, 118–125. [Google Scholar] [CrossRef] [PubMed]
- Carter, C.J.; Blizard, R.A. Autism genes are selectively targeted by environmental pollutants including pesticides, heavy metals, bisphenol A, phthalates and many others in food, cosmetics or household products. Neurochem. Int. 2016, 101, 83–109. [Google Scholar] [CrossRef]
- Willcutt, E.G. The prevalence of DSM-IV attention-deficit/hyperactivity disorder: A meta-analytic review. Neurotherapeutics 2012, 9, 490–499. [Google Scholar] [CrossRef]
- Lecavalier, L.; McCracken, C.E.; Aman, M.G.; McDougle, C.J.; McCracken, J.T.; Tierney, E.; Smith, T.; Johnson, C.; King, B.; Handen, B.; et al. An exploration of concomitant psychiatric disorders in children with autism spectrum disorder. Compr. Psychiatry 2019, 88, 57–64. [Google Scholar] [CrossRef]
- Hanć, T. ADHD as a risk factor for obesity. Current state of research. Psychiatr. Pol. 2018, 52, 309–322. [Google Scholar] [CrossRef]
- Tistarelli, N.; Fagnani, C.; Troianiello, M.; Stazi, M.A.; Adriani, W. The nature and nurture of ADHD and its comorbidities: A narrative review on twin studies. Neurosci. Biobehav. Rev. 2020, 109, 63–77. [Google Scholar] [CrossRef]
- Ronan, V.; Yeasin, R.; Claud, E.C. Childhood Development and the Microbiome-The Intestinal Microbiota in Maintenance of Health and Development of Disease During Childhood Development. Gastroenterology 2021, 160, 495–506. [Google Scholar] [CrossRef]
- Zeng, Y.; Tang, Y.; Yue, Y.; Li, W.; Qiu, X.; Hu, P.; Tang, J.; Wang, H.; Yang, X.; Qu, Y.; et al. Cumulative evidence for association of parental diabetes mellitus and attention-deficit/hyperactivity disorder. Neurosci. Biobehav. Rev. 2020, 117, 129–139. [Google Scholar] [CrossRef]
- Han, V.X.; Patel, S.; Jones, H.F.; Dale, R.C. Maternal immune activation and neuroinflammation in human neurodevelopmental disorders. Nat. Rev. Neurol. 2021, 17, 564–579. [Google Scholar] [CrossRef] [PubMed]
- Katzman, M.A.; Bilkey, T.S.; Chokka, P.R.; Fallu, A.; Klassen, L.J. Adult ADHD and comorbid disorders: Clinical implications of a dimensional approach. BMC Psychiatry 2017, 17, 302. [Google Scholar] [CrossRef] [PubMed]
- Faraone, S.V.; Banaschewski, T.; Coghill, D.; Zheng, Y.; Biederman, J.; Bellgrove, M.A.; Newcorn, J.H.; Gignac, M.; Al Saud, N.M.; Manor, I.; et al. The World Federation of ADHD International Consensus Statement: 208 Evidence-based conclusions about the disorder. Neurosci. Biobehav. Rev. 2021, 128, 789–818. [Google Scholar] [CrossRef] [PubMed]
- Faraone, S.V.; Asherson, P.; Banaschewski, T.; Biederman, J.; Buitelaar, J.K.; Ramos-Quiroga, J.A.; Rohde, L.A.; Sonuga-Barke, E.J.; Tannock, R.; Franke, B. Attention-deficit/hyperactivity disorder. Nat. Rev. Dis. Primers 2015, 1, 15020. [Google Scholar] [CrossRef] [PubMed]
- Nilsen, F.M.; Tulve, N.S. A systematic review and meta-analysis examining the interrelationships between chemical and non-chemical stressors and inherent characteristics in children with ADHD. Environ. Res. 2020, 180, 108884. [Google Scholar] [CrossRef] [PubMed]
- Rosi, E.; Crippa, A.; Pozzi, M.; De Francesco, S.; Fioravanti, M.; Mauri, M.; Molteni, M.; Morello, L.; Tosti, L.; Metruccio, F.; et al. Exposure to environmental pollutants and attention-deficit/hyperactivity disorder: An overview of systematic reviews and meta-analyses. Environ. Sci. Pollut. Res. 2023, 30, 111676–111692. [Google Scholar] [CrossRef] [PubMed]
- Engel, S.M.; Villanger, G.D.; Nethery, R.C.; Thomsen, C.; Sakhi, A.K.; Drover, S.S.M.; Hoppin, J.A.; Zeiner, P.; Knudsen, G.P.; Reichborn-Kjennerud, T.; et al. Prenatal Phthalates, Maternal Thyroid Function, and Risk of Attention-Deficit Hyperactivity Disorder in the Norwegian Mother and Child Cohort. Environ. Health Perspect. 2018, 126, 057004. [Google Scholar] [CrossRef] [PubMed]
- Bouchard, M.F.; Bellinger, D.C.; Wright, R.O.; Weisskopf, M.G. Attention-deficit/hyperactivity disorder and urinary metabolites of organophosphate pesticides. Pediatrics 2010, 125, e1270–e1277. [Google Scholar] [CrossRef] [PubMed]
- Schab, D.W.; Trinh, N. Do Artificial Food Colors Promote Hyperactivity in Children with Hyperactive Syndromes? A Meta-Analysis of Double-Blind Placebo-Controlled Trials. J. Dev. Behav. Pediatr. 2004, 25, 423–434. [Google Scholar] [CrossRef]
- Hawkey, E.; Nigg, J.T. Omega−3 fatty acid and ADHD: Blood level analysis and meta-analytic extension of supplementation trials. Clin. Psychol. Rev. 2014, 34, 496–505. [Google Scholar] [CrossRef] [PubMed]
- Sucksdorff, M.; Brown, A.S.; Chudal, R.; Surcel, H.M.; Hinkka-Yli-Salomaki, S.; Cheslack-Postava, K.; Gyllenberg, D.; Sourander, A. Maternal Vitamin D Levels and the Risk of Offspring Attention-Deficit/Hyperactivity Disorder. J. Am. Acad. Child Adolesc. Psychiatry 2021, 60, 142–151. [Google Scholar] [CrossRef] [PubMed]
- Sourander, A.; Upadhyaya, S.; Surcel, H.M.; Hinkka-Yli-Salomäki, S.; Cheslack-Postava, K.; Silwal, S.; Sucksdorff, M.; McKeague, I.; Brown, A.S. Maternal Vitamin D Levels during Pregnancy and Offspring Autism Spectrum Disorder. Biol. Psychiatry 2021, 90, 790–797. [Google Scholar] [CrossRef]
- Hoogman, M.; van Rooij, D.; Klein, M.; Boedhoe, P.; Ilioska, I.; Li, T.; Patel, Y.; Postema, M.C.; Zhang-James, Y.; Anagnostou, E.; et al. Consortium neuroscience of attention deficit/hyperactivity disorder and autism spectrum disorder: The ENIGMA adventure. Hum. Brain Mapp. 2022, 43, 37–55. [Google Scholar] [CrossRef]
- Ilzarbe, D.; Lukito, S.; Moessnang, C.; O’Daly, O.G.; Lythgoe, D.J.; Murphy, C.M.; Ashwood, K.; Stoencheva, V.; Rubia, K.; Simonoff, E. Neural Correlates of Theory of Mind in Autism Spectrum Disorder, Attention-Deficit/Hyperactivity Disorder, and the Comorbid Condition. Front. Psychiatry 2020, 11, 544482. [Google Scholar] [CrossRef]
- Dougnon, G.; Matsui, H. Modelling Autism Spectrum Disorder (AUTISM) and Attention-Deficit/Hyperactivity Disorder (ADHD) Using Mice and Zebrafish. Int. J. Mol. Sci. 2022, 23, 7550. [Google Scholar] [CrossRef]
- Heilbrun, L.P.; Palmer, R.F.; Jaen, C.R.; Svoboda, M.; Perkins, J.; Miller, C.S. Maternal Chemical and Drug Intolerances: Potential Risk Factors for Autism and Attention Deficit Hyperactivity Disorder (ADHD). J. Am. Board Fam. Med. 2015, 28, 461–470. [Google Scholar] [CrossRef]
- Miller, C.S. Chemical sensitivity: Symptom, syndrome or mechanism for disease? Toxicology 1996, 111, 69–86. [Google Scholar] [CrossRef]
- Miller, C.S. Toxicant-induced loss of tolerance—An emerging theory of disease? Environ. Health Perspect. 1997, 105 (Suppl. S2), 445–453. [Google Scholar]
- Ashford, N.; Miller, C. Chemical Exposures: Low Levels and High Stakes; Von Nostrand Reinhold: New York, NY, USA, 1998. [Google Scholar]
- Silins, I.; Högberg, J. Combined Toxic Exposures and Human Health: Biomarkers of Exposure and Effect. Int. J. Environ. Res. Public Health 2011, 8, 629–647. [Google Scholar] [CrossRef] [PubMed]
- Agency for Toxic Substances and Disease Registry. Environmental Health and Medicine Education. Which Organ Systems Are Affected by Toxic Exposure(s)? Available online: https://www.atsdr.cdc.gov/csem/exposure-history/Organ-Systems-Are-Affected.html (accessed on 19 December 2023).
- Azuma, K.; Uchiyama, I.; Katoh, T.; Ogata, H.; Arashidani, K.; Kunugita, N. Prevalence and characteristics of chemical intolerance: A Japanese population-based study. Arch. Environ. Occup. Health 2015, 70, 341–353. [Google Scholar] [CrossRef] [PubMed]
- Caress, S.M.; Steinemann, A.C. A national population study of the prevalence of multiple chemical sensitivity. Arch. Environ. Health 2004, 59, 300–305. [Google Scholar] [CrossRef] [PubMed]
- Lu, X.; Hojo, S.; Mizukoshi, A.; Katoh, T. Prevalence and correlation of multiple chemical sensitivity and electromagnetic hypersensitivity with age, sex, and depression in the Japanese population: A retrospective study. BMC Public Health 2023, 23, 1205. [Google Scholar] [CrossRef] [PubMed]
- Dantoft, T.M.; Nordin, S.; Andersson, L.; Petersen, M.W.; Skovbjerg, S.; Jørgensen, T. Multiple chemical sensitivity described in the Danish general population: Cohort characteristics and the importance of screening for functional somatic syndrome comorbidity-The DanFunD study. PLoS ONE 2021, 16, e0246461. [Google Scholar] [CrossRef] [PubMed]
- Pigatto, P.D.; Guzzi, G. Prevalence and risk factors for multiple chemical sensitivity in Australia. Prev. Med. Rep. 2019, 14, 100856. [Google Scholar] [CrossRef]
- Hojo, S.; Mizukoshi, A.; Azuma, K.; Okumura, J.; Ishikawa, S.; Miyata, M.; Mizuki, M.; Ogura, H.; Sakabe, K. Survey on changes in subjective symptoms, onset/trigger factors, allergic diseases, and chemical exposures in the past decade of Japanese patients with multiple chemical sensitivity. Int. J. Hyg. Environ. Health 2018, 221, 1085–1096. [Google Scholar] [CrossRef]
- Steinemann, A. National Prevalence and Effects of Multiple Chemical Sensitivities. J. Occup. Environ. Med. 2018, 60, e152–e156. [Google Scholar] [CrossRef]
- Bell, I.R.; Markley, E.J.; King, D.S.; Asher, S.; Marby, D.; Kayne, H.; Greenwald, M.; Ogar, D.A.; Margen, S. Polysymptomatic syndromes and autonomic reactivity to nonfood stressors in individuals with self-reported adverse food reactions. J. Am. Coll. Nutr. 1993, 12, 227–238. [Google Scholar] [CrossRef]
- Rossi, S.; Pitidis, A. Multiple Chemical Sensitivity Review of the State of the Art in Epidemiology, Diagnosis, and Future Perspectives. J. Occup. Environ. Med. JOEM 2018, 60, 138–146. [Google Scholar]
- Hojo, S.; Kumano, H.; Yoshino, H.; Kakuta, K.; Ishikawa, S. Application of Quick Environment Exposure Sensitivity Inventory (QEESI©) for Japanese population: Study of reliability and validity of the questionnaire. Toxicol. Ind. Health 2003, 19, 41–49. [Google Scholar] [CrossRef]
- Miller, C.S.; Prihoda, T.J. The Environmental Exposure and Sensitivity Inventory (EESI): A standardized approach for measuring chemical intolerances for research and clinical applications. Toxicol. Ind. Health 1999, 15, 370–385. [Google Scholar] [CrossRef]
- Miller, C.S.; Prihoda, T.J. A controlled comparison of symptoms and chemical intolerances reported by Gulf War veterans, implant recipients and persons with multiple chemical sensitivity. Toxicol. Ind. Health 1999, 15, 386–397. [Google Scholar] [CrossRef] [PubMed]
- Miller, C.S.; Mitzel, H.C. Chemical sensitivity attributed to pesticide exposure versus remodeling. Arch. Environ. Health 1997, 50, 119–129. [Google Scholar] [CrossRef] [PubMed]
- Miller, C.S.; Palmer, R.F.; Dempsey, T.T.; Ashford, N.A.; Afrin, L.B. Mast cell activation may explain many cases of chemical intolerance. Environ. Sci. Eur. 2021, 33, 129. [Google Scholar] [CrossRef]
- Palmer, R.F.; Dempsey, T.T.; Afrin, L.B. Chemical Intolerance and Mast Cell Activation: A Suspicious Synchronicity. J. Xenobiot. 2023, 13, 704–718. [Google Scholar] [CrossRef] [PubMed]
- Genuis, S.J. Sensitivity-related illness: The escalating pandemic of allergy, food intolerance and chemical sensitivity. Sci. Total Environ. 2010, 408, 6047–6061. [Google Scholar] [CrossRef] [PubMed]
- Masri, S.; Miller, C.S.; Palmer, R.F.; Ashford, N. Toxicant-induced loss of tolerance for chemicals, foods, and drugs: Assessing patterns of exposure behind a global phenomenon. Environ. Sci. Eur. 2021, 33, 65. [Google Scholar] [CrossRef]
- Proctor, S.P. Chemical sensitivity and Gulf War veterans’ illnesses. Occup. Med. 2000, 15, 587–599. [Google Scholar]
- Couper, M. Web surveys: A review of issues and approaches. Public Opin. Q. 2000, 64, 464–494. [Google Scholar] [CrossRef]
- Biffignandi, S.; Bethlehem, J. Handbook of Web Surveys; John Wiley & Sons, Inc.: Hoboken, NJ, USA, 2021. [Google Scholar]
- SAS Institute Inc. SAS/STAT® 15.3 User’s Guide; SAS Institute Inc.: Cary, NC, USA, 2023; Available online: https://documentation.sas.com/api/collections/pgmsascdc/9.4_3.5/docsets/statug/content/intro.pdf?locale=en (accessed on 17 February 2024).
- JMP® Pro, Version 15.0.0 1989–2019; SAS Institute Inc.: Cary, NC, USA, 2019. Available online: https://www.scirp.org/reference/referencespapers?referenceid=2843737(accessed on 17 February 2024).
- Miller, C.S.; Palmer, R.F.; Kattari, D.; Masri, S.; Ashford, N.; Rincon, R.; Perales, R.; Grimes, C.; Sundblad, D. What initiates chemical intolerance? Findings from a large population-based survey of U.S. adults. Environ. Sci. Eur. 2023, 35, 65. [Google Scholar] [CrossRef]
- Muir, T.; Michalek, J.E.; Palmer, R.F. Determination of safe levels of persistent organic pollutants in toxicology and epidemiology. Rev. Environ. Health 2022, 38, 401–408. [Google Scholar] [CrossRef]
- Gant, T.W.; Auerbach, S.S.; Von Bergen, M.; Bouhifd, M.; Botham, P.A.; Caiment, F.; Currie, R.A.; Harrill, J.; Johnson, K.; Li, D.; et al. Applying genomics in regulatory toxicology: A report of the ECETOC workshop on omics threshold on non-adversity. Arch. Toxicol. 2023, 97, 2291–2302. [Google Scholar] [CrossRef] [PubMed]
- Mei, X.; Zhang, B.; Zhao, M.; Lu, Q. An update on epigenetic regulation in autoimmune diseases. J. Transl. Autoimmun. 2022, 5, 100176. [Google Scholar] [CrossRef] [PubMed]
- Wu, Y.L.; Lin, Z.J.; Li, C.C.; Lin, X.; Shan, S.K.; Guo, B.; Zheng, M.H.; Li, F.; Yuan, L.Q.; Li, Z.H. Epigenetic regulation in metabolic diseases: Mechanisms and advances in clinical study. Signal Transduct. Target. Ther. 2023, 8, 98. [Google Scholar] [CrossRef]
- Chaste, P.; Leboyer, M. Autism risk factors: Genes, environment, and gene-environment interactions. Dialogues Clin. Neurosci. 2012, 14, 281–292. [Google Scholar] [CrossRef]
- Torres, G.; Mourad, M.; Iqbal, S.; Moses-Fynn, E.; Pandita, A.; Siddhartha, S.S.; Sood, R.A.; Srinivasan, K.; Subbaiah, R.T.; Tiwari, A.; et al. Conceptualizing Epigenetics and the Environmental Landscape of Autism Spectrum Disorders. Genes 2023, 14, 1734. [Google Scholar] [CrossRef]
- Casanova, M.F.; Casanova, E.L.; Frye, R.; Baeza-Velasco, C.; LaSalle, J.M.; Hagermanm, R.J.; Scherer, S.W.; Natowicz, M.R. Editorial: Secondary vs. Idiopathic Autism. Front. Psychiatry 2020, 11, 297. [Google Scholar] [CrossRef] [PubMed]
- Ashwood, P.; Krakowiak, P.; Hertz-Picciotto, I.; Hansen, R.; Pessah, I.; Van de Water, J. Elevated plasma cytokines in autism spectrum disorders provide evidence of immune dysfunction and are associated with impaired behavioral outcome. Brain Behav. Immun. 2011, 25, 40–45. [Google Scholar] [CrossRef]
- Gevezova, M.; Sarafian, V.; Anderson, G.; Maes, M. Inflammation and Mitochondrial Dysfunction in Autism Spectrum Disorder. CNS Neurol. Disord. Drug Targets 2020, 19, 320–333. [Google Scholar] [CrossRef] [PubMed]
- Kwon, H.K.; Choi, G.B.; Huh, J.R. Maternal inflammation and its ramifications on fetal neurodevelopment. Trends Immunol. 2022, 43, 230–244. [Google Scholar] [CrossRef] [PubMed]
- Crivellato, E.; Ribatti, D. The mast cell: An evolutionary perspective. Biol. Rev. Camb. Philos. Soc. 2010, 85, 347–360. [Google Scholar] [CrossRef] [PubMed]
- Theoharides, T.C. Neuroendocrinology of mast cells: Challenges and controversies. Exp. Dermatol. 2017, 26, 751–759. [Google Scholar] [CrossRef] [PubMed]
- Molderings, G.J.; Afrin, L.B. A survey of the currently known mast cell mediators with potential relevance for therapy of mast cell-induced symptoms. Naunyn-Schmiedeberg’s Arch. Pharmacol. 2023, 396, 2881–2891. [Google Scholar] [CrossRef] [PubMed]
- Czarnetzki, B.M.; Grabbe, J.; Kolde, G.; Krüger-Krasagakes, S.; Welker, P.; Zuberbier, T. Mast cells in the cytokine network: The what, where from and what for. Exp. Dermatol. 1995, 4 Pt 2, 221–226. [Google Scholar] [CrossRef]
- Chu, M.T.; Chang, W.C.; Pao, S.C.; Hung, S.I. Delayed Drug Hypersensitivity Reactions: Molecular Recognition, Genetic Susceptibility, and Immune Mediators. Biomedicines 2023, 11, 177. [Google Scholar] [CrossRef]
- Theoharides, T.C.; Kavalioti, M.; Tsilioni, I. Mast Cells, Stress, Fear and Autism Spectrum Disorder. Int. J. Mol. Sci. 2019, 20, 3611. [Google Scholar] [CrossRef]
- Theoharides, T.C.; Stewart, J.M.; Panagiotidou, S.; Melamed, I. Mast cells, brain inflammation and autism. Eur. J. Pharmacol. 2016, 778, 96–102. [Google Scholar] [CrossRef]
- Cerasuolo, M.; Simeoli, R.; Nappo, R.; Gallucci, M.; Iovino, L.; Frolli, A.; Rega, A. Examining Predictors of Different ABA Treatments: A Systematic Review. Behav. Sci. 2022, 12, 267. [Google Scholar] [CrossRef] [PubMed]
- Wang, L.; Wang, B.; Wu, C.; Wang, J.; Sun, M. Autism Spectrum Disorder: Neurodevelopmental Risk Factors, Biological Mechanism, and Precision Therapy. Int. J. Mol. Sci. 2023, 24, 1819. [Google Scholar] [CrossRef] [PubMed]
- Klein, N.; Kemper, K.J. Integrative Approaches to Caring for Children with Autism. Curr. Probl. Pediatr. Adolesc. Health Care 2016, 46, 195–201. [Google Scholar] [CrossRef] [PubMed]
- Flannery, K.A.; Wisner-Carlson, R. Autism and Education. Child Adolesc. Psychiatr. Clin. N. Am. 2020, 29, 319–343. [Google Scholar] [CrossRef]
- Goel, R.; Hong, J.S.; Findling, R.L.; Ji, N.Y. An update on pharmacotherapy of autism spectrum disorder in children and adolescents. Int. Rev. Psychiatry 2018, 30, 78–95. [Google Scholar] [CrossRef] [PubMed]
- Molderings, G.; Brettner, S.; Homann, J.; Afrin, L.B. Mast cell activation disease: A concise practical guide for diagnostic workup and therapeutic options. J. Hematol. Oncol. 2011, 4, 10. [Google Scholar] [CrossRef]
- Molderings, G.; Haenisch, B.; Brettner, S.; Homann, J.; Menzen, M.; Dumoulin, F.L.; Panse, J.; Butterfield, J.; Afrin, L.B. Pharmacological treatment options for mast cell activation disease. Naunyn-Schmiedeberg’s Arch. Pharmacol. 2016, 389, 671–694. [Google Scholar] [CrossRef]
- Fowler, S.P.; Gimeno Ruiz de Porras, D.; Swartz, M.D.; Stigler Granados, P.; Heilbrun, L.P.; Palmer, R.F. Daily Early-Life Exposures to Diet Soda and Aspartame Are Associated with Autism in Males: A Case-Control Study. Nutrients 2023, 15, 3772. [Google Scholar] [CrossRef]
- Lee, H.; Marvin, A.R.; Watson, T.; Piggot, J.; Law, J.K.; Law, P.A. Accuracy of phenotyping of autistic children based on internet implemented parent report. Am. J. Med. Genet. B Neuropsychiatr. Genet. 2010, 153B, 1119–1126. [Google Scholar] [CrossRef]
- Daniels, A.M.; Rosenberg, R.E.; Anderson, C.; Law, J.K.; Marvin, A.R.; Law, P.A. Verification of parent-report of child autism spectrum disorder diagnosis to a web-based autism registry. J. Autism Dev. Disord. 2012, 42, 257–265. [Google Scholar] [CrossRef] [PubMed]


| Percent | ||
|---|---|---|
| Age | 1: 18 to 29 years | 10.2 |
| 2: 30 to 44 | 23.1 | |
| 3: 45 to 60 | 39.1 | |
| 4: 61+ | 27.7 | |
| Sex | Male | 40.5 |
| Female | 59.5 | |
| Household Income | 1: USD 0–9999 | 3.9 |
| 2: USD 10,000–24,999 | 9.5 | |
| 3: USD 25,000–49,999 | 18.8 | |
| 4: USD 50,000–74,999 | 20.1 | |
| 5: USD 75,000–99,999 | 14.0 | |
| 6: USD 100,000–124,999 | 9.8 | |
| 7: USD 125,000–149,999 | 5.9 | |
| 8: USD 150,000–174,999 | 3.1 | |
| 9: USD 175,000–199,999 | 2.0 | |
| 10: USD 200,000+ | 4.4 | |
| Prefer not to answer (Missing) | 8.5 | |
| Number of Children | 1 | 28.3 |
| 2 | 39.2 | |
| 3 | 18.4 | |
| 4 | 6.3 | |
| 5 | 2.1 | |
| 6 | 1.7 | |
| Missing | 4.1 | |
| High Chemical Intolerance Classification | 22.6 | |
| Families reporting autism | 13.0 | |
| Families reporting ADHD | 28.6 |
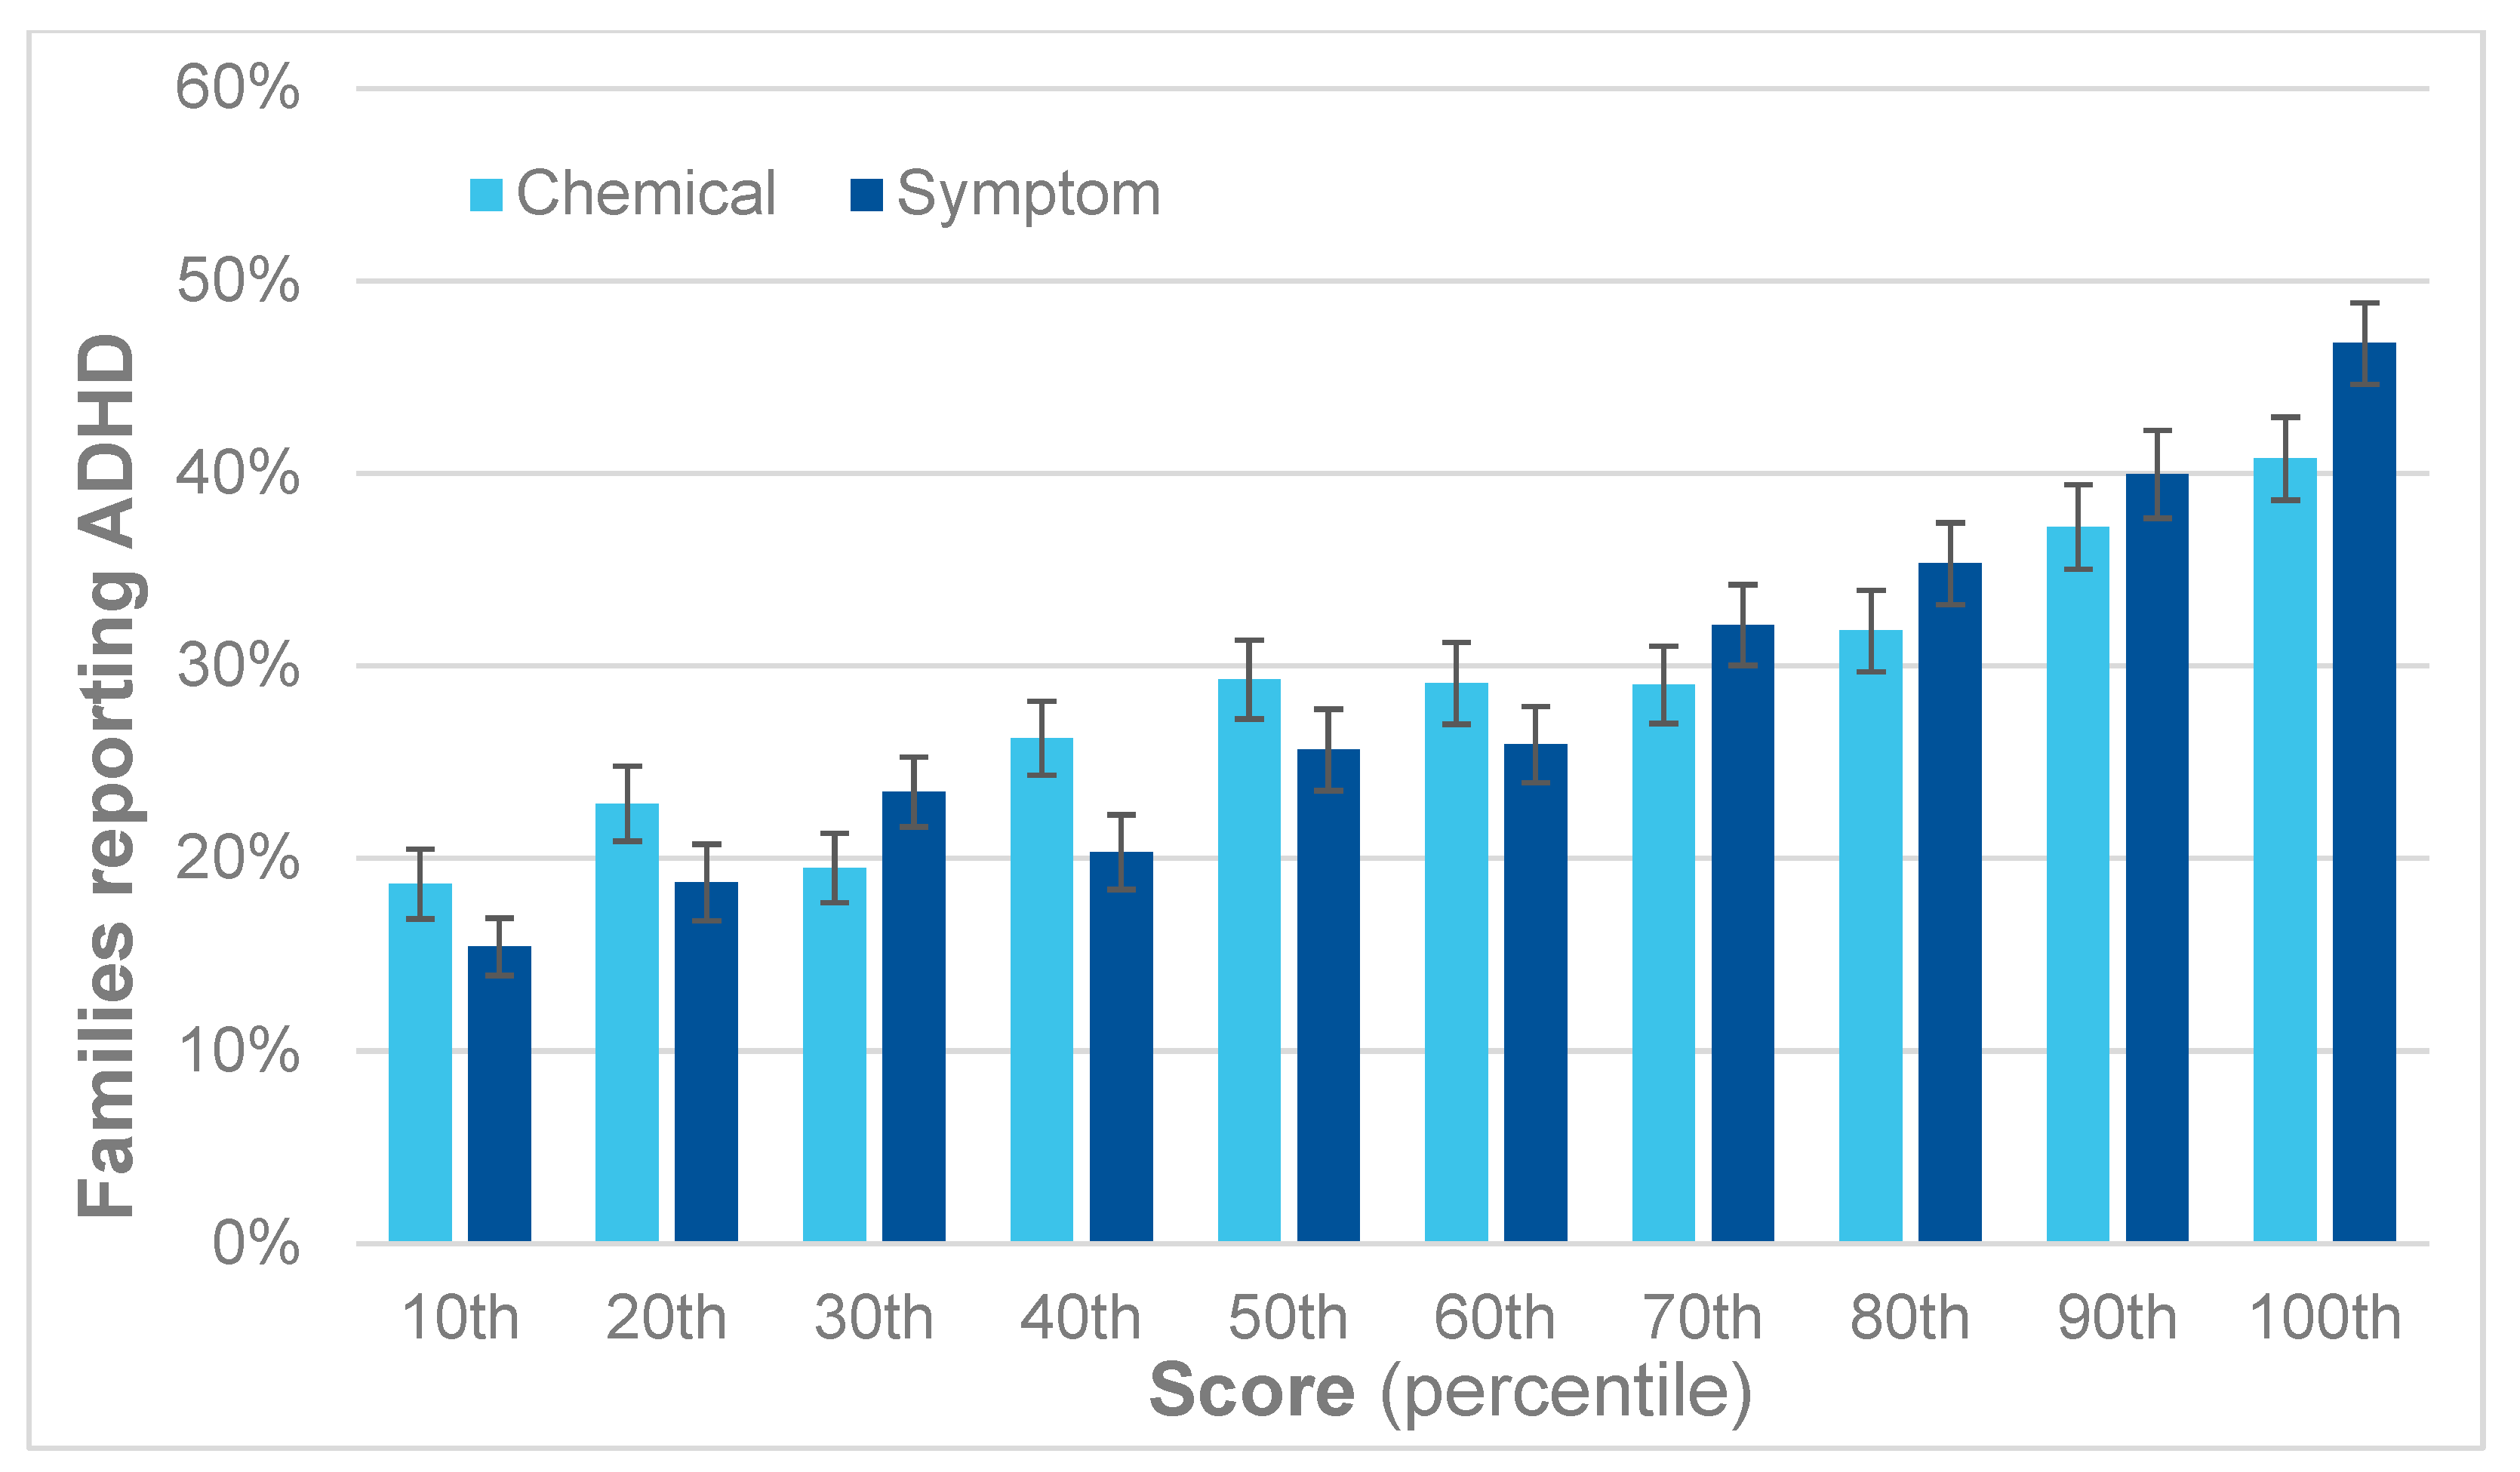
| Percentile | Chemical Intolerance Score (0–100) | Any Reported Autism | Any Reported ADHD | ||
|---|---|---|---|---|---|
| Risk Ratio (Compared to the 10th) | 95% Confidence Interval | Risk Ratio (Compared to the 10th) | 95% Confidence Interval | ||
| 100th | >63 | 5.7 *** | [3.57, 9.08] | 2.1 *** | [1.70, 2.63] |
| 90th | 53 to 63 | 4.1 *** | [2.55, 6.69] | 1.9 *** | [1.53, 2.40] |
| 80th | 45 to 52 | 3.7 *** | [2.30, 6.09] | 1.7 *** | [1.33, 2.13] |
| 70th | 38 to 44 | 3.0 *** | [1.83, 4.96] | 1.5 *** | [1.20, 1.93] |
| 60th | 31 to 37 | 2.8 *** | [1.71, 4.72] | 1.5 *** | [1.18, 1.91] |
| 50th | 25 to 30 | 2.8 *** | [1.72, 4.69] | 1.6 *** | [1.24, 1.98] |
| 40th | 18 to 24 | 2.1 ** | [1.25, 3.54] | 1.4 ** | [1.08, 1.75] |
| 30th | 12 to 17 | 1.7 | [0.99, 2.95] | 1.0 | [0.79, 1.34] |
| 20th | 6 to 11 | 1.7 | [0.96, 2.89] | 1.2 | [0.92, 1.53] |
| 10th | <6 | 1.0 | [0.54, 1.81] | 1.0 | [0.76, 1.31] |
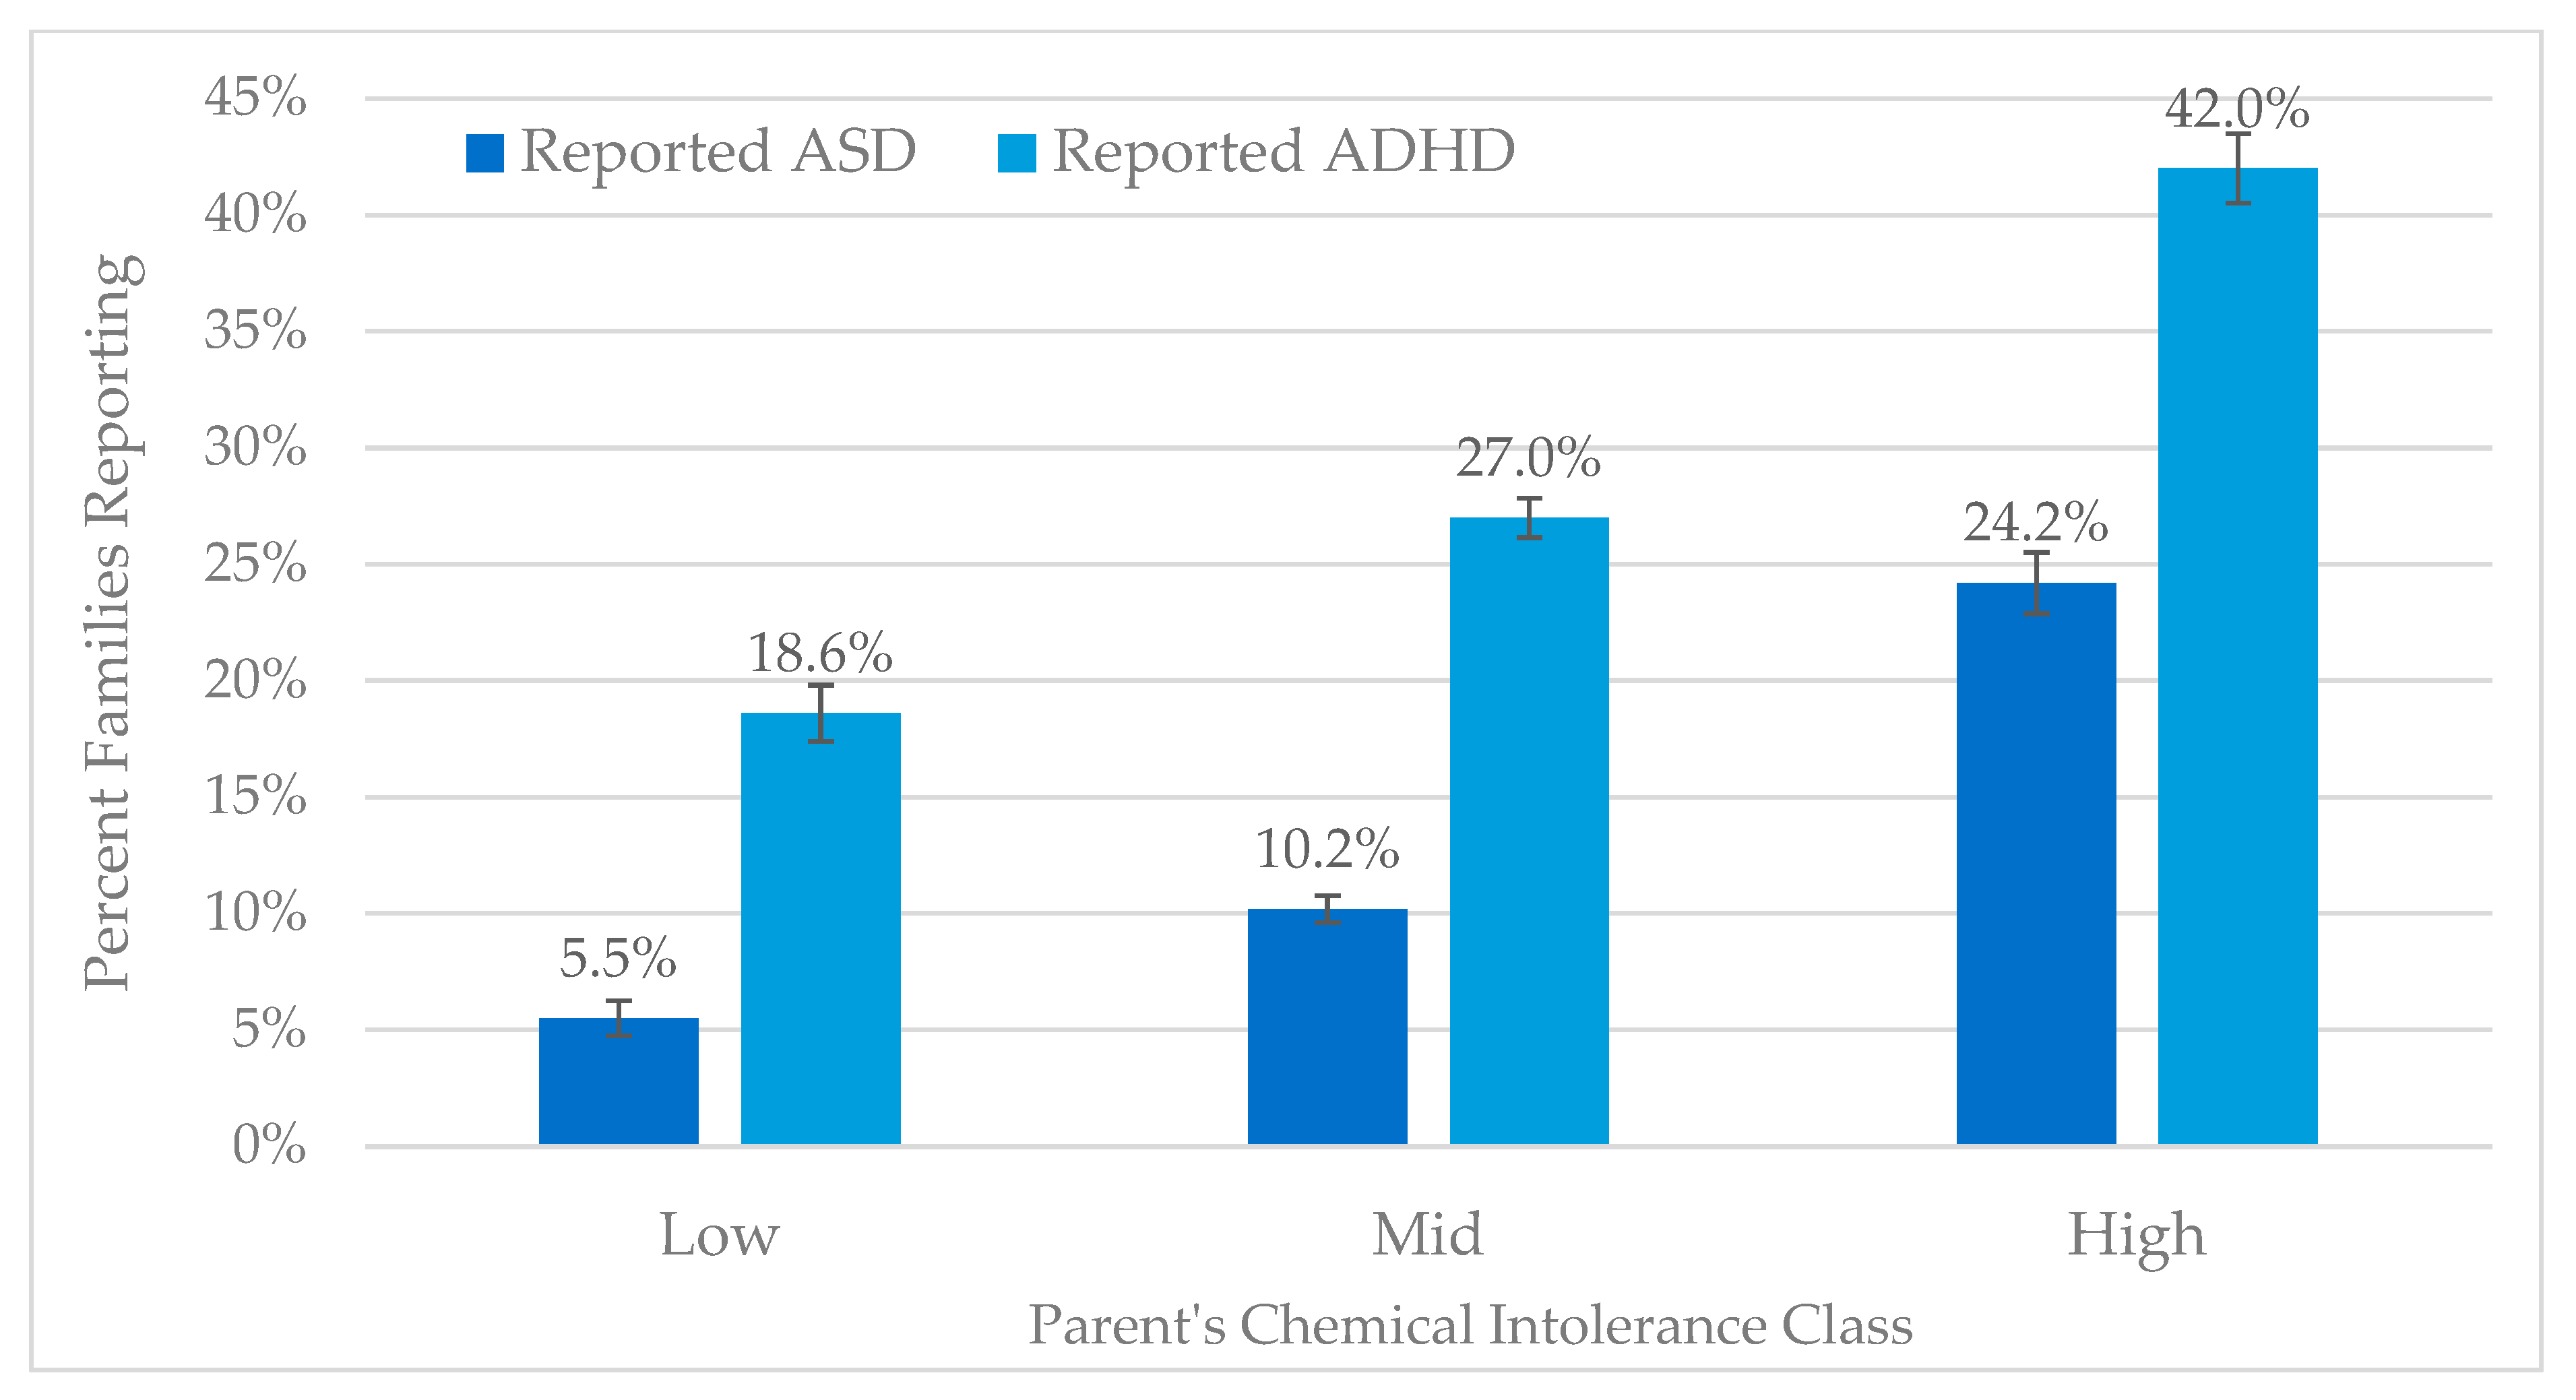
| Chemical Intolerance Class | Autism | ADHD | ||||||
|---|---|---|---|---|---|---|---|---|
| Families Not Reporting Autism | Families Reporting Autism | All | % | Families Not Reporting ADHD | Families Reporting ADHD | All | % | |
| N | N | N | N | N | N | |||
| Low | 948 | 55 | 1003 | 5.5% | 816 | 187 | 1003 | 18.6% |
| Mid | 2378 | 271 | 2649 | 10.2% | 1934 | 715 | 2649 | 27.0% |
| High | 788 | 251 | 1039 | 24.2% | 608 | 431 | 1039 | 41.5% |
Disclaimer/Publisher’s Note: The statements, opinions and data contained in all publications are solely those of the individual author(s) and contributor(s) and not of MDPI and/or the editor(s). MDPI and/or the editor(s) disclaim responsibility for any injury to people or property resulting from any ideas, methods, instructions or products referred to in the content. |
© 2024 by the authors. Licensee MDPI, Basel, Switzerland. This article is an open access article distributed under the terms and conditions of the Creative Commons Attribution (CC BY) license (https://creativecommons.org/licenses/by/4.0/).
Share and Cite
Palmer, R.F.; Kattari, D.; Rincon, R.; Miller, C.S. Assessing Chemical Intolerance in Parents Predicts the Risk of Autism and ADHD in Their Children. J. Xenobiot. 2024, 14, 350-367. https://0-doi-org.brum.beds.ac.uk/10.3390/jox14010022
Palmer RF, Kattari D, Rincon R, Miller CS. Assessing Chemical Intolerance in Parents Predicts the Risk of Autism and ADHD in Their Children. Journal of Xenobiotics. 2024; 14(1):350-367. https://0-doi-org.brum.beds.ac.uk/10.3390/jox14010022
Chicago/Turabian StylePalmer, Raymond F., David Kattari, Rodolfo Rincon, and Claudia S. Miller. 2024. "Assessing Chemical Intolerance in Parents Predicts the Risk of Autism and ADHD in Their Children" Journal of Xenobiotics 14, no. 1: 350-367. https://0-doi-org.brum.beds.ac.uk/10.3390/jox14010022