Identifying Sustainable Wood Sources for the Construction Industry: A Case Study


1
School of Civil Engineering, Shenzhen University, Shenzhen 518060, China
2
School of Architecture and Built Environment, The University of Adelaide, Adelaide 5005, Australia
*
Author to whom correspondence should be addressed.
Sustainability 2018, 10(1), 139; https://0-doi-org.brum.beds.ac.uk/10.3390/su10010139
Submission received: 25 November 2017
/
Revised: 17 December 2017
/
Accepted: 3 January 2018
/
Published: 9 January 2018
Abstract
:Wood is generally considered as a sustainable construction material. However, there are not sufficient wood resources in many countries or regions, especially those short of land resources. These countries and regions have to import wood from overseas. Therefore, it is imperative to determine how to choose sustainable importing sources in order to improve the sustainability performance of using wood in construction. This study compares the sustainability performance of wood imported from different regions by considering wood harvesting, manufacture, and transportation. A framework accounting energy consumption and CO2 emissions is developed for sustainability assessment. The results show that importing wood from Canada, Australia, and New Zealand to Taiwan demands a relatively lower amount of energy than from other regions. Specifically, importing wood from Canada (West) demands the lowest amount of energy (2095 MJ/m3), while importing wood form Brazil consumes the highest amount of energy (5356 MJ/m3). In addition, findings showed that the CO2 emissions generated from importing wood from Sweden are significant lower than those from other regions, although the energy consumed during the importing process is relatively high. The study also revealed that the wood manufacturing process and marine transportation contribute to the most energy consumption and CO2 emissions among all importing processes analysed from most of studied regions.
1. Introduction
Sustainability in terms of the environment implies a natural resource balance [1]. The core principle of “sustainability” is described as a “meeting the needs of the current generation without compromising the ability of future generation to meet their needs”, indicating a precautionary approach to those activities that effect the environment to prevent irreparable damage [2]. However, construction is not an environmentally friendly process by nature, and it has become one essential part of sustainable issues. Resource utilization, the material manufacturing process, material transportation, and disposal of waste materials can potentially cause environmental problems. Greenhouse gas emissions, energy consumption, and depletion of resources are important factors that influence our built-environment. Sustainable construction must meet the goals for reducing energy consumption and greenhouse gas emissions, and using more renewable materials [3].
Since the 1990s, the issues of sustainable buildings and sustainable building materials have been paid much attention to by scholars and governments around the world [4,5,6,7]. Several green policies for green buildings and green materials have been proposed to address these issues. Within these policies, wood building structures are highly encouraged to be applied as a green building structures [8,9,10], as wood is regarded as an ecological green material, and it requires minimum treatment as well as minimum consumption of energy during the life cycle from the production to final disposal [11,12]. There are several benefits of using wood material, one of which is carbon storage. Wood material contains 50% carbon during its growth, absorbing carbon dioxide in the air. Therefore, the more wood materials are used, the more carbon is stored, thus reducing the global warming effect [13]. In addition, the effect of wood biomass substitution can decrease greenhouse gas emissions. It had been suggested that “exchanging coal for biomass wastes and residues is one of the lowest-cost, nearest-term options for reducing fossil CO2 emissions at existing power plants” [14]. Research into fuel substitution in Sweden found that “the highest cross-price elastic ties can be found between wood fuel and non-gaseous fossil fuels (oil and coal), reflecting a relatively large substitution possibility” [15]. In consequence, the use of wood material has a great advantage for reducing environmental problems.
However, wood resources are not sufficient in many land-limited countries or regions like Japan, South Korea, Taiwan, and so on. The domestic raw materials and products of wood can hardly meet the local demands from the construction industry, which requires a massive volume of wood materials. Therefore, the building construction industry in these countries or regions seeks to import wood from overseas. For instance, it is reported that approximately eight million to ten million cubic meters of wood are consumed in Taiwan every year, while the domestic supply amount of wood in Taiwan is only around fifty thousand cubic meters [16]. The degree of self-sufficiency of wood in Taiwan is less than 1%, and almost 99% of wood used in the construction industry in Taiwan is imported from foreign regions, such as USA, Canada, Sweden, New Zealand, Australia, Brazil, Mainland China, and Malaysia [17]. Hence, the identification of sustainable wood importing sources for these counties or regions plays a critical role in pursuing the sustainability of wood used in building construction.
Significant research has been conducted to identify sustainable building material resources in the construction industry worldwide. For example, Koch (1992) analysed national data from the 1970s that stated that the environmental impact of wood structures was lower due to the use of wood in the USA [18]; in New Zealand, Buchanan and Honey (1994) indicated that the energy use and CO2 emissions of wood structures are both lower than concrete structures [19]. Borjesson and Gustavsson (2000) reported similar findings in Sweden by evaluating the effects of land use and end of life changes of materials [20]. Upton et al. (2008) further suggested that greenhouse gas emissions associated with wood-based houses were 20–50% lower than those associated with comparable houses employing steel-based building systems [21]. Peterson and Solberg (2002) indicated the sustainability of wood used in construction depends on how material waste has been managed and how forest carbon flows have been considered [22]. Architects of Guardigli, Monari, and Bragadin (2011) developed a design model of mid-size green buildings of wood and concrete structures, finding that with European LCA database, wood design is much more environmentally friendly [23]. Besides, wood is traditionally regarded for low-rise building construction, but as for recent research related to wood construction, Skullestad, Bohne, and Lohne (2016) investigated greenhouse gas emissions of high-rise timber buildings from 3 to 21 storeys compared with reinforced concrete structures. The results showed that CO2 emissions reduction obtained by substituting a RC structure with a timber structure per m2 varies from different storeys [24].
In Taiwan, sustainability assessment of wood and wood products also attracted research efforts [25,26,27]. Li and Xie (2013) investigated building professionals’ attitudes towards the use of wood in building design in Taiwan and found professionals including architects, engineers, and interior designers had positive viewpoints of wood construction in Taiwan. They considered wood-framed buildings would be the future trend of sustainable construction in low-rise buildings [28]. As for study of environmental impacts of wood structures, Tu (2007) examined 57 reference houses of wooden platform constructions in Taiwan and estimated the average amounts of materials in the buildings. He found that CO2 released in reinforced concrete structures and steel structures is 4.2 times and 3.6 times more than in wood structures, respectively [25]. Previous studies mainly focus on the sustainability assessment of wood structures or wood used in construction by comparing them with other structure forms or materials such as concrete and steel. However, these studies overlooked the significance of the sources of imported wood in their sustainability assessment. The sustainability performance of wood imported from different sources would vary dramatically due to the differences in the wood production process, energy structure, and transportation distance among these imported wood sources.
This being the case, the influence of imported wood from different regions should be taken into consideration when conducting sustainability assessment for wood used in construction in import-dominated cases. As wood importation is a cross-regional mobility issue of materials, it involves various energy supply systems, equipment, manufacturing processes, transportation systems, and different types of efficient operations. A specialized assessment process is needed to address this issue by conducting a literature review, an actual investigation, and forming proper assumptions. Taiwan, a typical region where the wood used in the construction industry largely relies on the import market, is chosen as the case study. The structure of this paper is as follows: Firstly, this paper develops a sustainability assessment framework accounting for energy consumption and CO2 emissions of wood materials used in construction by considering wood harvesting, manufacture, and transportation. Secondly, this paper compares the sustainability performance of wood imported from different regions. Finally, we provide suggestive information to the government and construction industry in Taiwan about the sustainability of using wood and selecting more sustainable wood resources.
2. Methods
2.1. Scope of Study
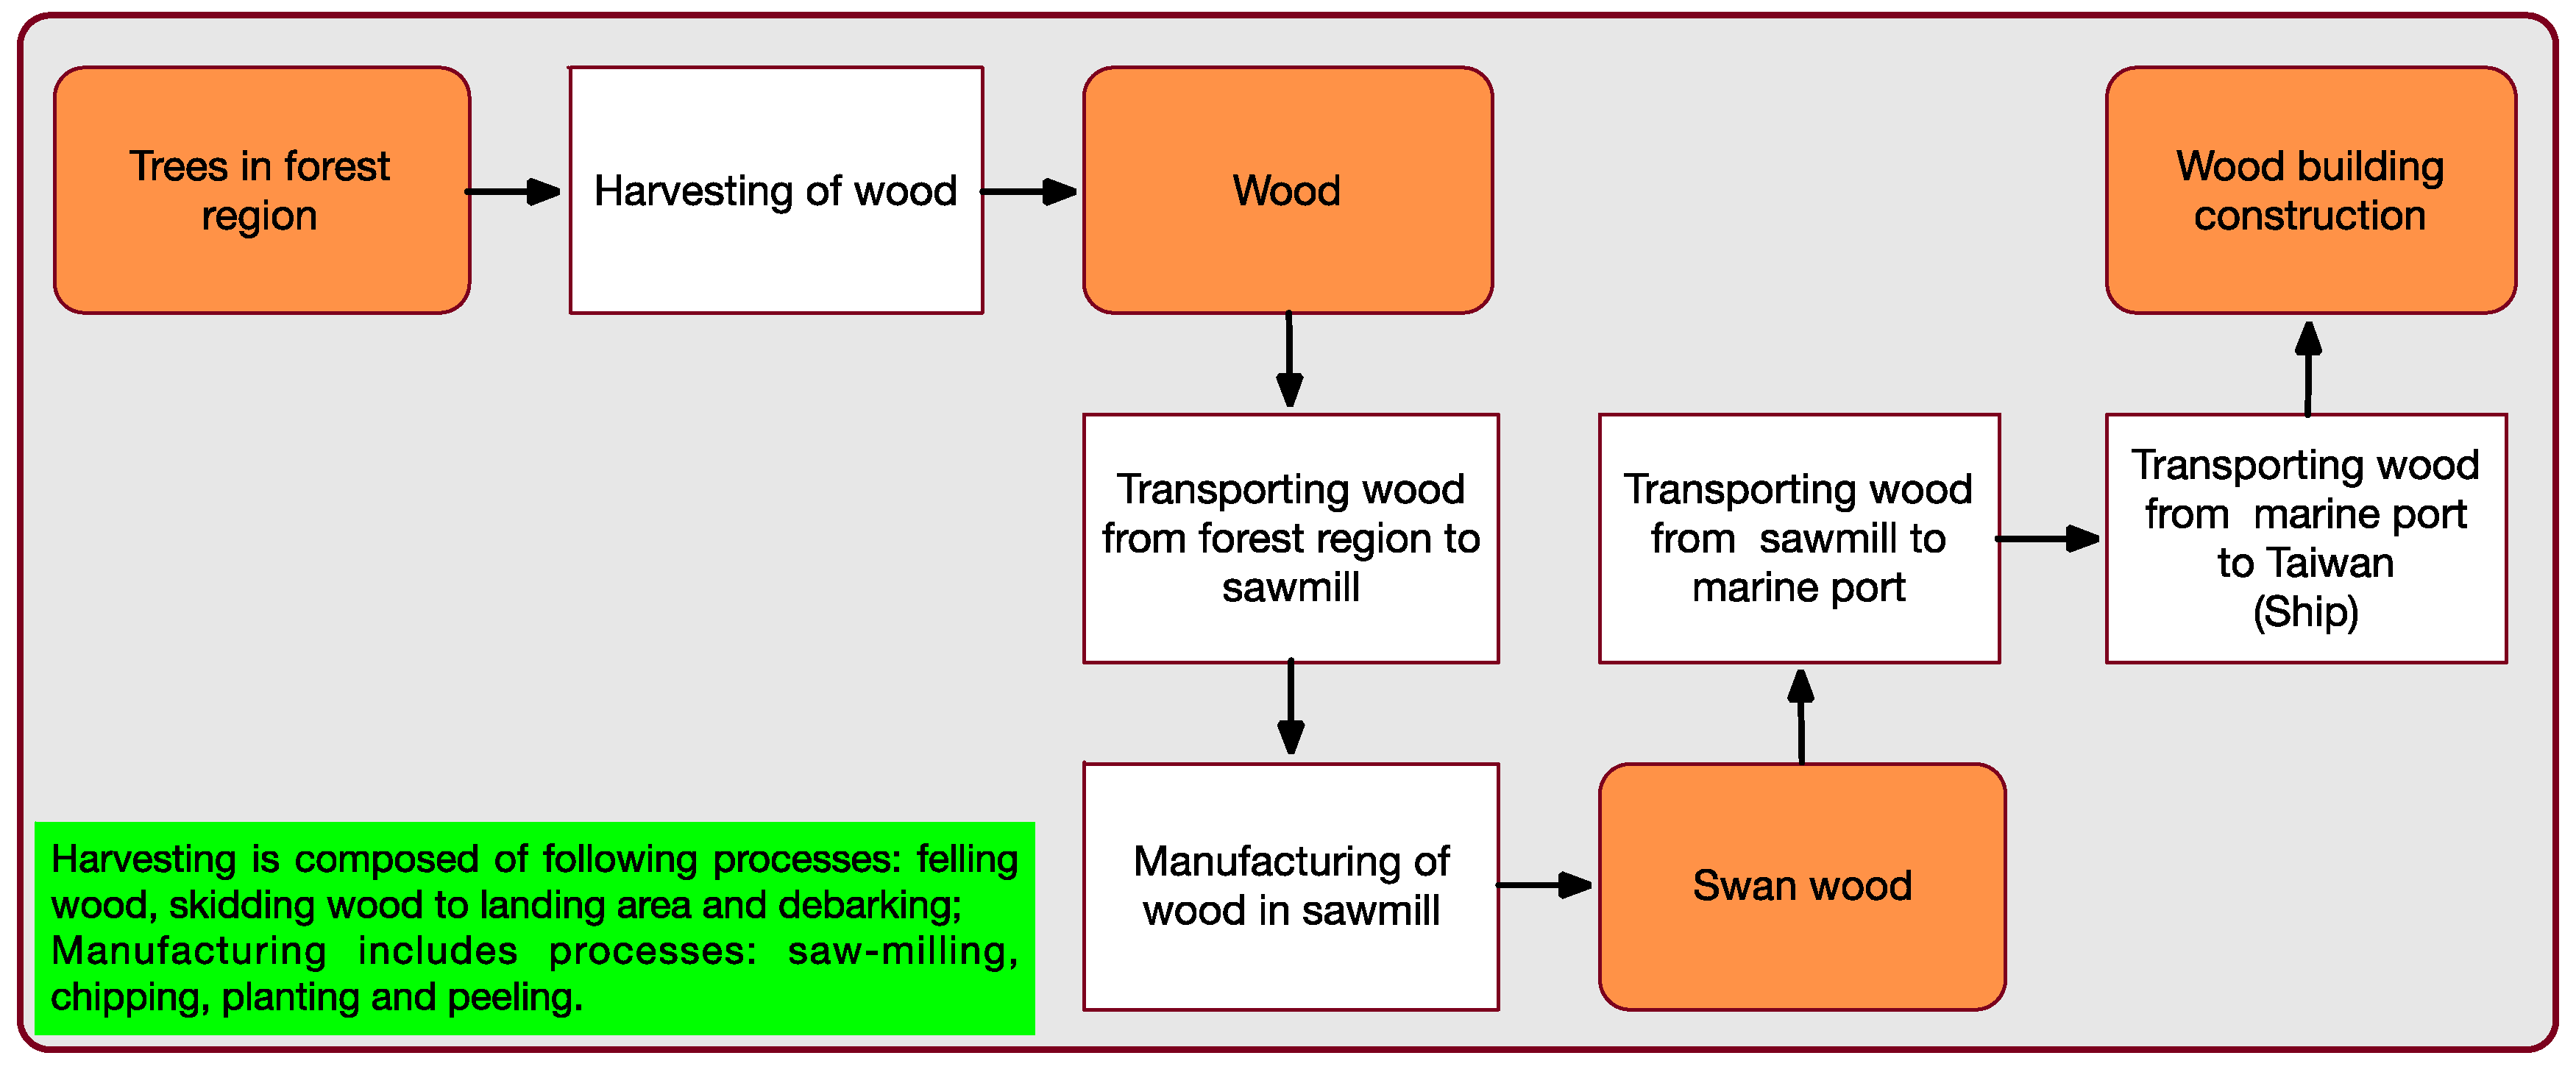
In this study, wood consumed in construction in Taiwan is manufactured overseas and then transported to Taiwan. The imported wood regions include the USA (Pacific Northwest, Southeast, Inland Northwest, and Northeast), Canada (West and East), Mainland China (Northeast and Southwest), Malaysia, Sweden, Russia, Brazil, Australia, and New Zealand. Five main lifecycle stages of wood are considered in the assessment (Figure 1):
- Wood harvesting. The first step in the wood industry is wood harvesting. This step is generally called pre-processed and includes the following processes: felling wood, skidding wood to the landing area, and debarking. Only a small amount of energy consumption is needed, because wood harvesting (logging) requires simple mechanical tools such as electric saw.
- Transporting wood from forest region to sawmill. The harvested wood is transported from forest region to sawmill. In order to reduce the capital in transportation related to costs, most sawmills are built to avoid long distance from forest logging area. However, different regions have their own conditions, and, therefore, assumptions will be made according to the case in the following analysis.
- Manufacturing of wood in sawmill. This step indicates how the wood material is manufactured and processed in sawmill. As for energy use, the predominant use of electricity reflects a proportionally larger use of mechanical processes, such as sawmilling, chipping, planting, and peeling over processes, which need heat for processes such as drying, gluing, and pressing, in which fuel oil is used as the major source of thermal energy.
- Transporting wood from sawmill to marine port. Road transportation is the most common way to move processed wood from sawmill to marine port. Normally, transportation from local sawmill or factory to an international port may be long distance. There is also insufficient information in different local regions, and environmental impact of this stage is difficult to estimate. Some necessary assumptions related to road transportation will be made for further analysis.
- Transporting wood form marine port to Taiwan. In Taiwan, marine transportation is an important part of its economy due to its running business with other countries. Wood material is always transported by cargo ship from foreign regions to Taiwan’s international port. The environmental impact of marine transportation is complicated and difficult to analyse because of the complexity of collecting data in Taiwan. Researchers from other countries have developed a database of international marine environmental impacts, which could be used to calculate the energy consumption and CO2 emissions during long ship journeys when the vessel is loaded with goods.
2.2. Inventory Data
2.2.1. Harvesting and Manufacturing of Wood
As analysed before, wood harvesting requires simple mechanical tools such as the electric saw, which consumes small amount of energy. Electric power and fuel oil are two major energies for the mechanical forest industry. Investigations have shown that electricity accounts for 40–50% of the industry’s energy needs in a series of mechanical process of sawmilling, chipping, planting, and peeling [29]. Heat is also needed for processes such as drying, gluing, and pressing, in which fuel oil is used as the major source of thermal energy.
The manufacturing process of wood from overseas is very different, especially in various regions, and thus the evaluation of environmental impact of this process is very complex. It is necessary to adopt some possible measures to estimate the environmental impact of wood. Energy consumption of wood manufacture is strongly related to its regional conditions. So, local data for each region is the most essential information required for the evaluation. In this study, data of energy consumption and CO2 emissions during wood harvesting and manufacturing is collected by literatures from countries such as the USA, Canada, Sweden, Austria, and New Zealand shown in Table 1. Since related data is not available in Mainland China, Malaysia, Russia, and Brazil, estimative values from the FAO (Food and Agricultural Organization) report are applied in the evaluation [29].
Table 1 shows the information of energy consumption during wood harvesting and manufacturing process. Carbon coefficient (kg of carbon released as carbon dioxide for each MJ of fossil fuel energy consumed) is an essential factor for calculating the amount of carbon released into the air from burning fossil fuels. This data is obtained by investigating the primary energy distribution in related countries. The CO2 emission factors of fuel that are provided by the IPCC (International Panel on Climate Change) [34], and the information of the primary energy distribution in Mainland China, Malaysia, Brazil, and Russia is obtained from EIA (Energy Information Administration) [35]. This data is shown in Table 2.
2.2.2. Inland Transportation
Inland road transportation includes two parts: transporting wood from forest region to sawmill and transporting wood from sawmill to marine port. Inland transportation is an important factor that contributes to energy consumption and CO2 emissions during the life cycle of wood. There is no global average estimative data concerning the environmental impacts of road transportation, and the data of each region differs. Information from the Transport Canada Database (UTMC 2008) is taken as estimative values in the study [36]. Based on the author’s interviews with truck companies, heavy duty vehicle (HDV, 33,000 lbs) is identified as the main vehicle transporting wood inland. Vehicles lighter than 33,000 lbs are not suitable to carry wood due to their large size and the heavy weight of wood.
In order to reduce transportation costs, most sawmills are built to avoid long distance movement from the forest logging area. Sawmill location is based on information from the Sawmill Database [37], which provides details about the latest and most major sawmills around the world. The distance from sawmills to marine ports differs greatly, and the average distance from sawmill to port is taken as an estimative value in road transportation. Table 3 shows the information of sawmills and the distance from sawmills to marine port.
2.2.3. Marine Transportation
Environmental impact of marine transportation cannot be ignored in the assessment. In order to estimate the energy consumption and CO2 emissions of marine transport, the methods used by the Network for Transport & Environment (NTM) are adopted in this study. NTM is a non-profit organization initiated in 1993 that aims to establish a common base of values on how to calculate environmental performance for various modes of transport. As is known, all ships are individual with different characteristics. The data provided by NTM is not exact for any given ship but comprises values measured and calculated over a great number of ships and engines [38].
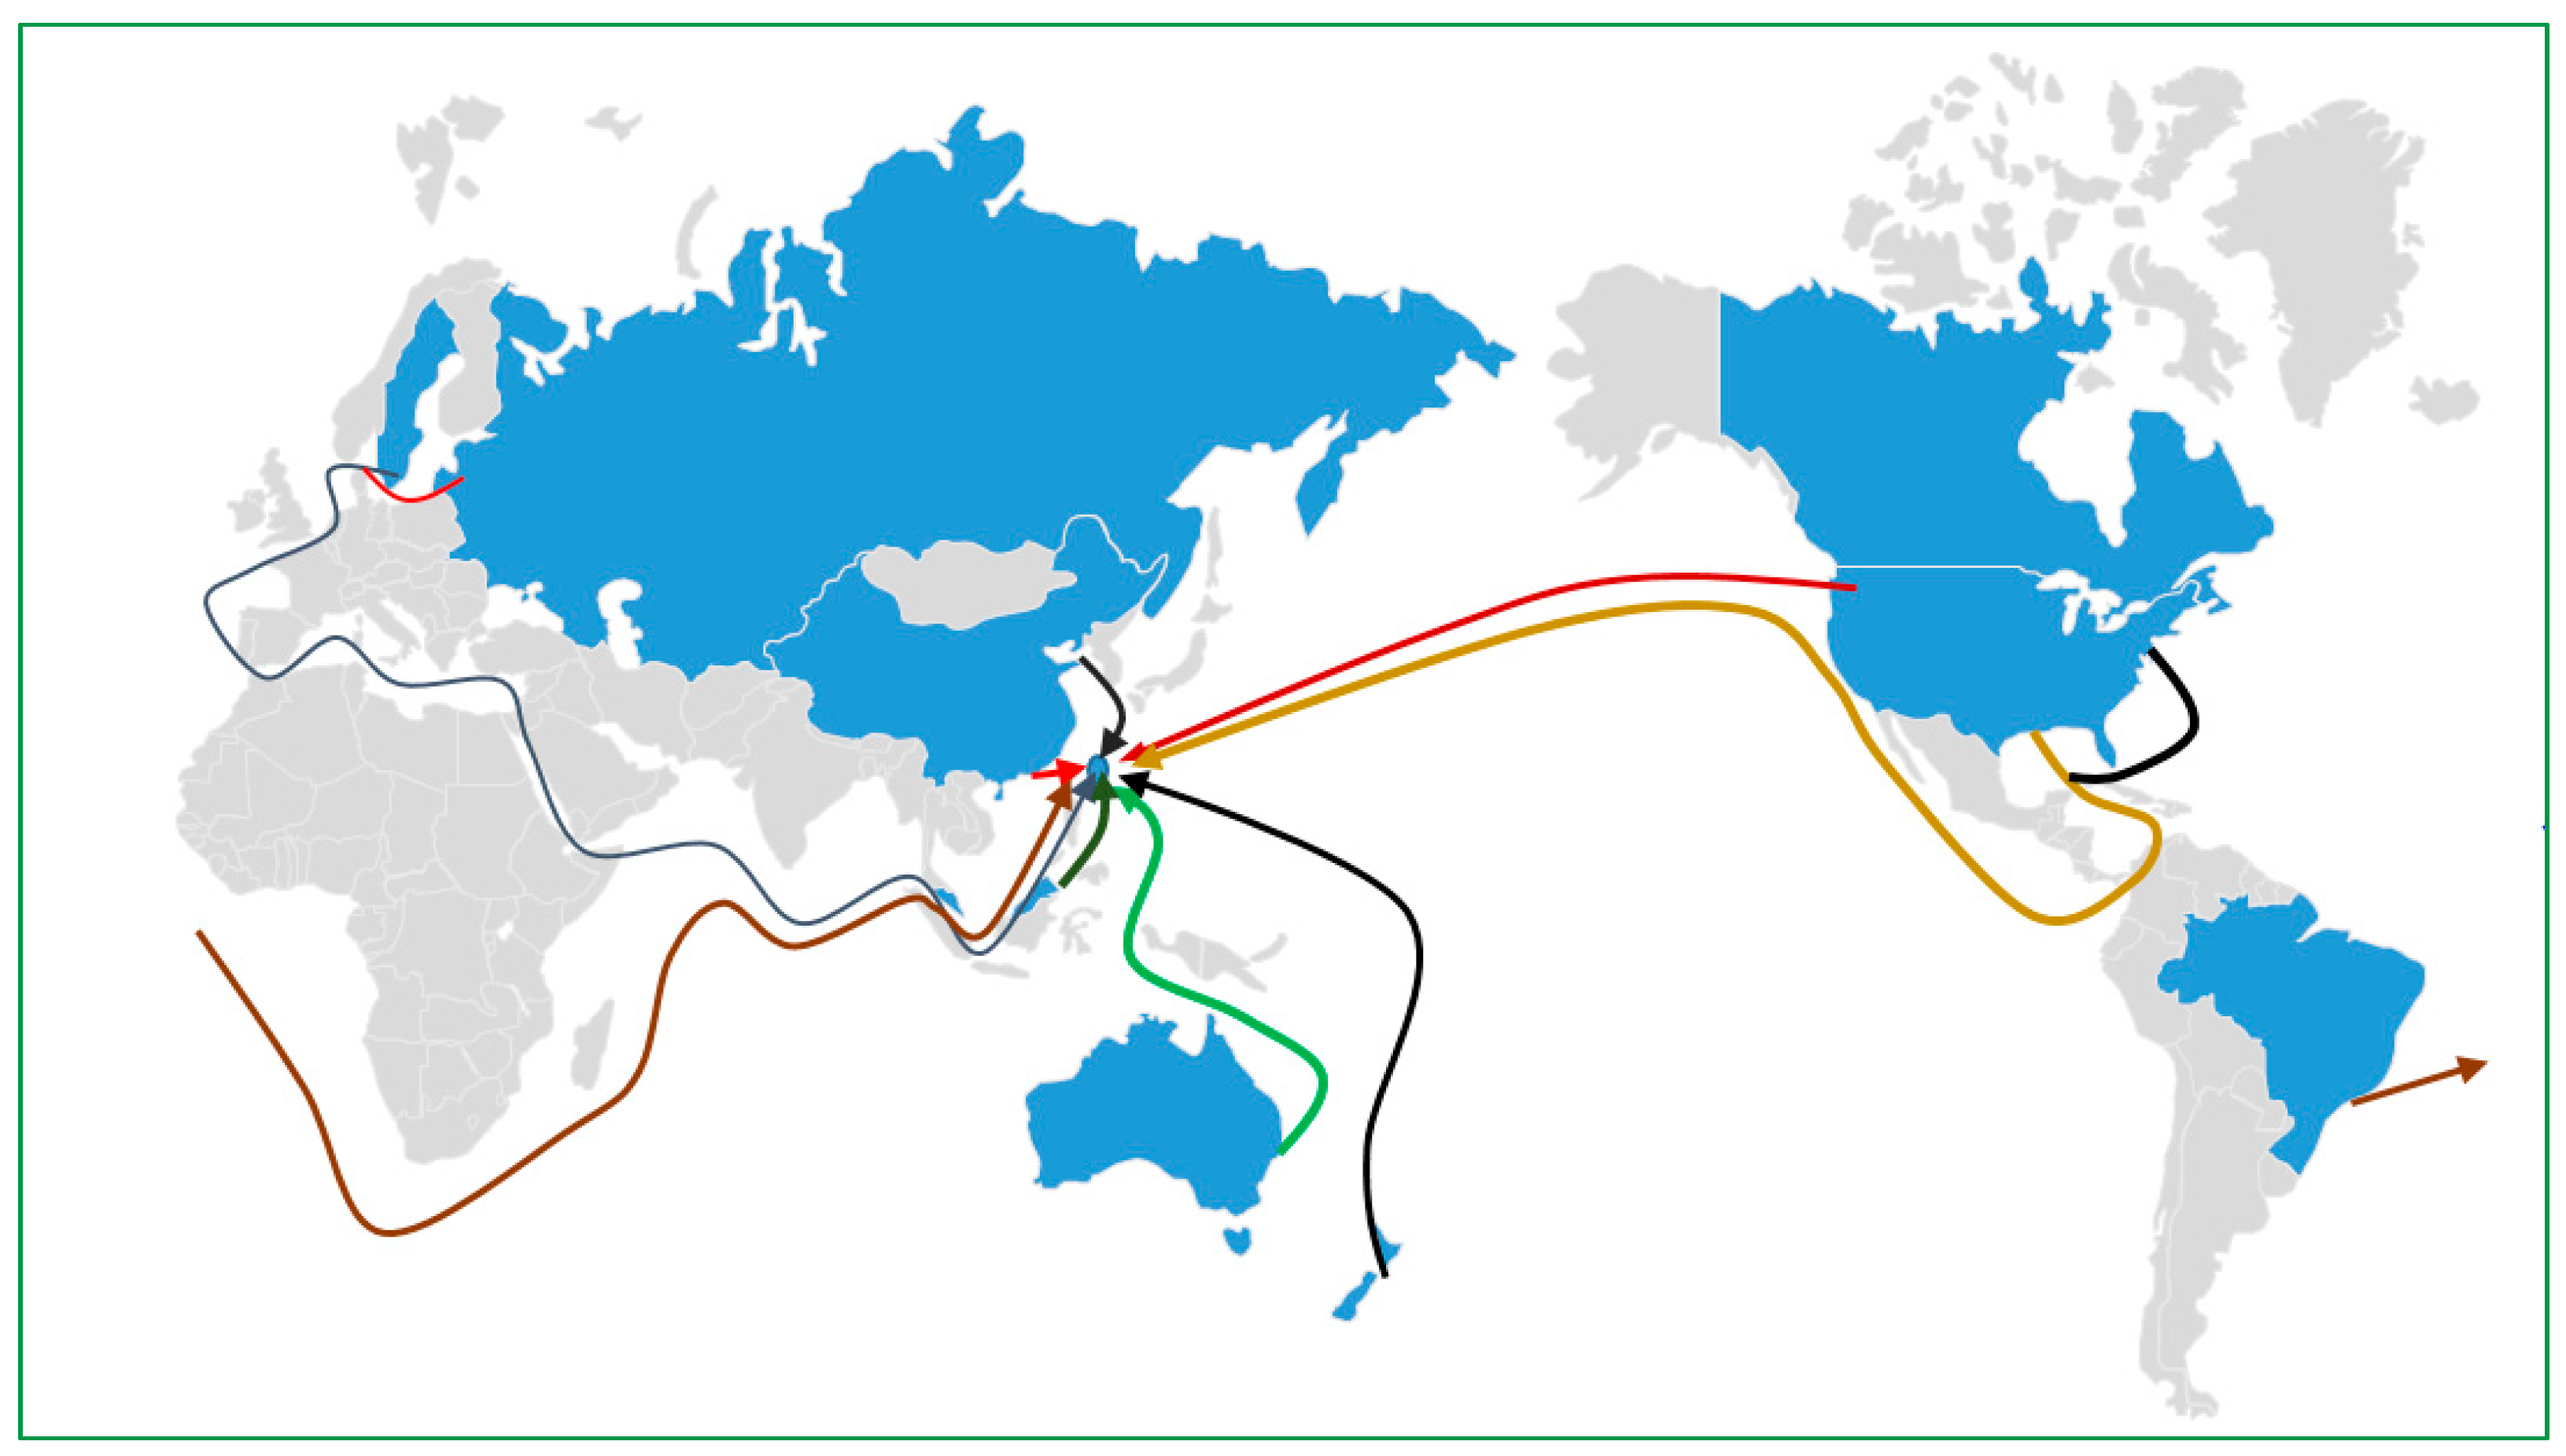
The boundary of marine transport routes limits only from port to port. The destination of marine transportation of wood is the port of Kaohsiung, which is the largest international port in Taiwan, as shown in Figure 2. There are thousands of vessel companies sailing from foreign countries to Taiwan, and the exact data of vessels is difficult to obtain. In the following calculation, one of the largest vessel companies Evergreen Marine Corp. (EMC), which deals with cargo container ships, provides marine information for analysis. Besides, the information of marine routes and transportation distances can be estimated from Marine Traffic [39].
Table 4 shows vessel conditions from different regions that export wood to Taiwan. Information about the vessel’s condition can be classified into three groups based on the NTM calculation database. The energy consumption and CO2 emission factor of the marine transportation of each group is classified based on the size of the cargo ship.
2.3. Calculation Model
2.3.1. Total Embodied Environmental Impacts
Equation (1) indicates the total embodied environmental impacts EBTotal (energy consumption and CO2 emissions) through a process of wood harvesting EBHarvesting, inland transportation (a) EBTransportation(a) (from forest region to sawmill), manufacturing process EBManufacturing, inland transportation (b) EBTransportation(b) (from sawmill to port), and marine transportation EBTransportation(c). The functional unit is MJ/m3 or kg/m3.
EBTotal = ΣiEBi = EBHarvesting + EBTransportation(a) + EBManufacturing + EBTransportation(b) + EBTransportation(c)
2.3.2. Inland Transportation
Equation (2) is the formula for calculating energy consumption EC (MJ/m3) during truck transportation. FE indicates fuel efficiency of vehicle (L fuel/100 km), and 30.89 L/100 km is taken as estimative value for this kind of vehicle. d indicates the transportation distance (km). Heating value Hv of diesel oil is taken as 38.65 MJ/L fuel. The volume of cargo container is estimated around 40 cubic meters in the Heavy Duty Vehicle (33,000 lbs), and it is assumed 75% of carrying capacity is used. Thus, the carrying capacity CC (m3) of wood is assumed to be 27.3 m3 in the truck in the calculation.
Equation (3) is the formula for calculating CO2 emissions ECO2 (kg/m3) during truck transportation. 2.6 kg CO2 emissions per litre fuel combustion is taken as value for emission factor EF [29]. Fuel efficiency and carrying capacity are the same as mentioned above.
2.3.3. Marine Transportation
The following models are the equations used in calculating the energy consumption and CO2 emission for marine transportation. The models are developed by NTM. Equation (4) is the formula for calculating energy consumption during marine transportation per cubic meter of goods (wood). Fc represents fuel consumption at cruise speed (tonne/km). Cargo capacity (CC) indicates how many cargos the vessel can carry in the unit of TEU. Cargo utilization (CU) is assumed 80% by NTM and each of standard 20 foot cargo has the volume V of 33 m3, generally because each cargo is not 100% loaded. It is assumed only 25 m3 of that volume is loaded with goods. Heating value of residual oil Hv is 41 MJ/kg fuel.
EC = 1000 ∗ FC ∗ d ∗ Hv/(CC ∗ V ∗ CU)
Equation (5) is the formula for calculating CO2 emissions ECO2 (kg/m3) during marine transportation. The emission factor EFGHG (kg/tonne fuel) is the term indicating emissions of CO2 due to fossil fuel operation.
3. Results
3.1. Sustainability Performance of Importing Wood from Difference Sources to Taiwan
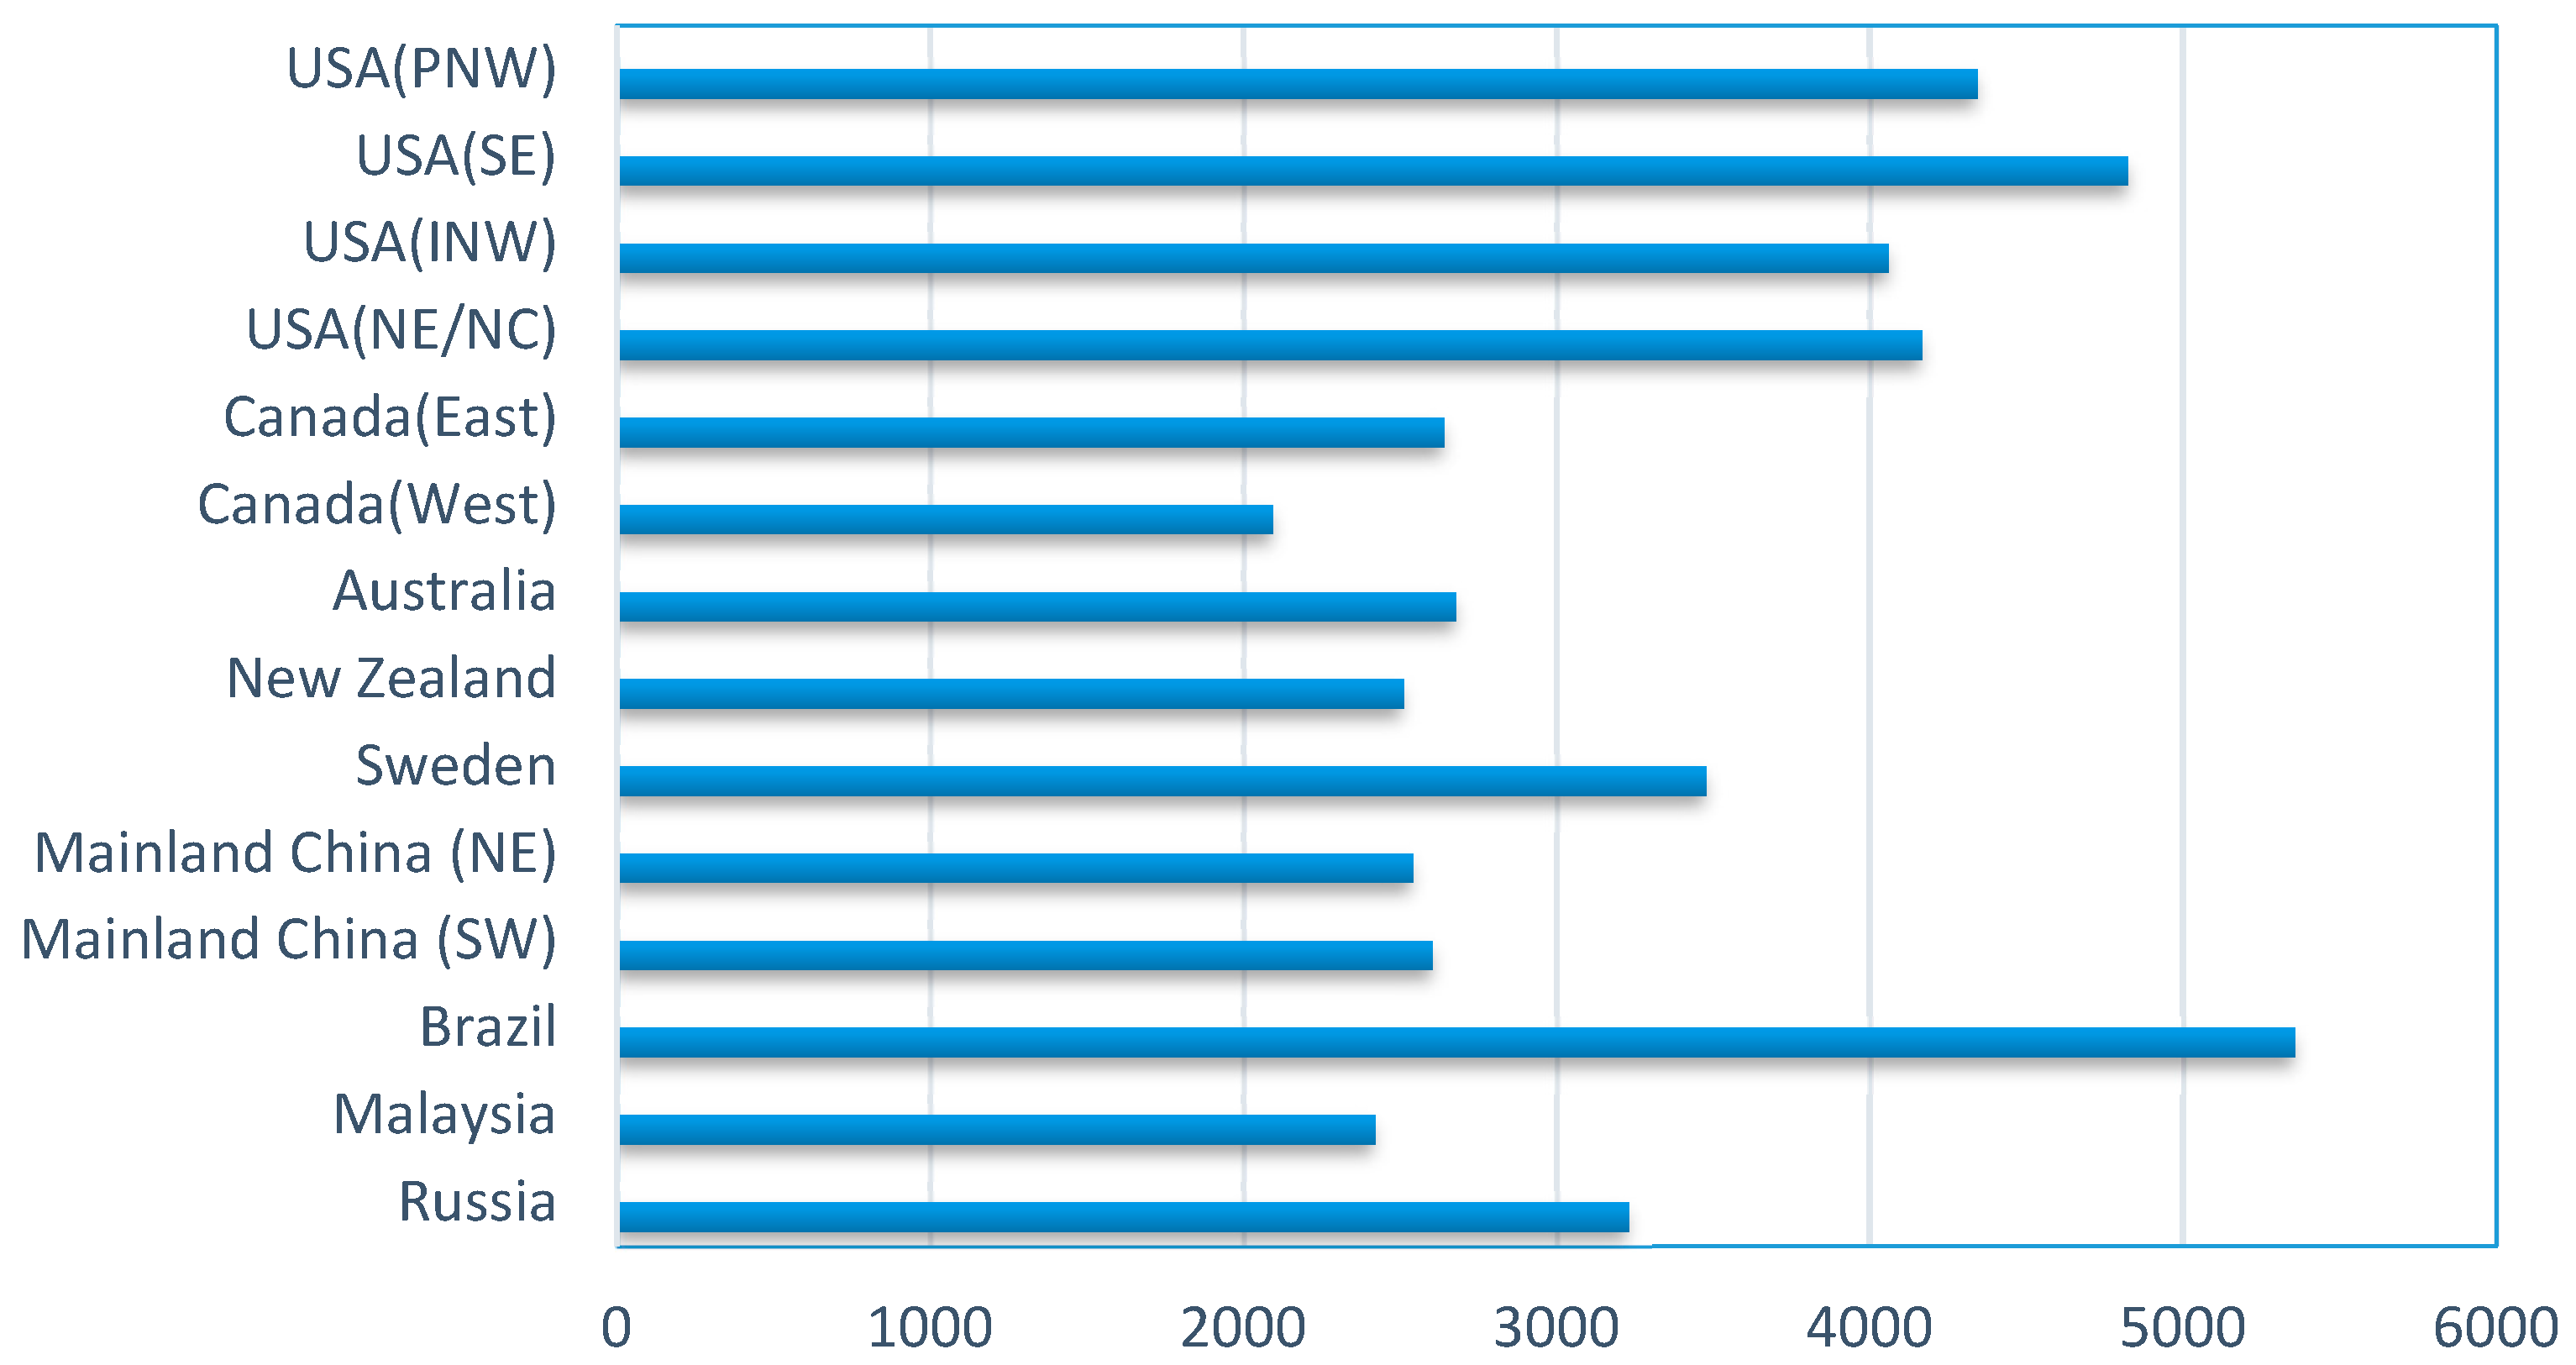
As shown in Figure 3, importing wood from Canada, Australia, and New Zealand to Taiwan demands relatively lower amount of energy than it does from other regions. Specifically, importing wood from Canada (West) demands the lowest amount of energy (2095 MJ/m3), while importing wood form Brazil consumes the highest amount of energy (5356 MJ/m3), because the wood that comes from Brazil involves longer routes by road and marine transportation when compared with other wood resources. Compared with wood from Canada, the wood that comes from USA has relatively higher energy consumption, such as wood from Southeast region (4824 MJ/m3) and from Pacific Northwest region (4343 MJ/m3). This is because energy consumption in manufacturing wood in USA is much higher than that in Canada. On the other hand, it can be also found that there is no great difference of embodied energy when wood is imported from Sweden, Mainland China (Northeast and Southwest), and Malaysia, presenting at around 3500 MJ/m3. Therefore, Canada, Australia, and New Zealand are the most sustainable importing sources for wood used in Taiwan’s construction sector according to energy consumption.
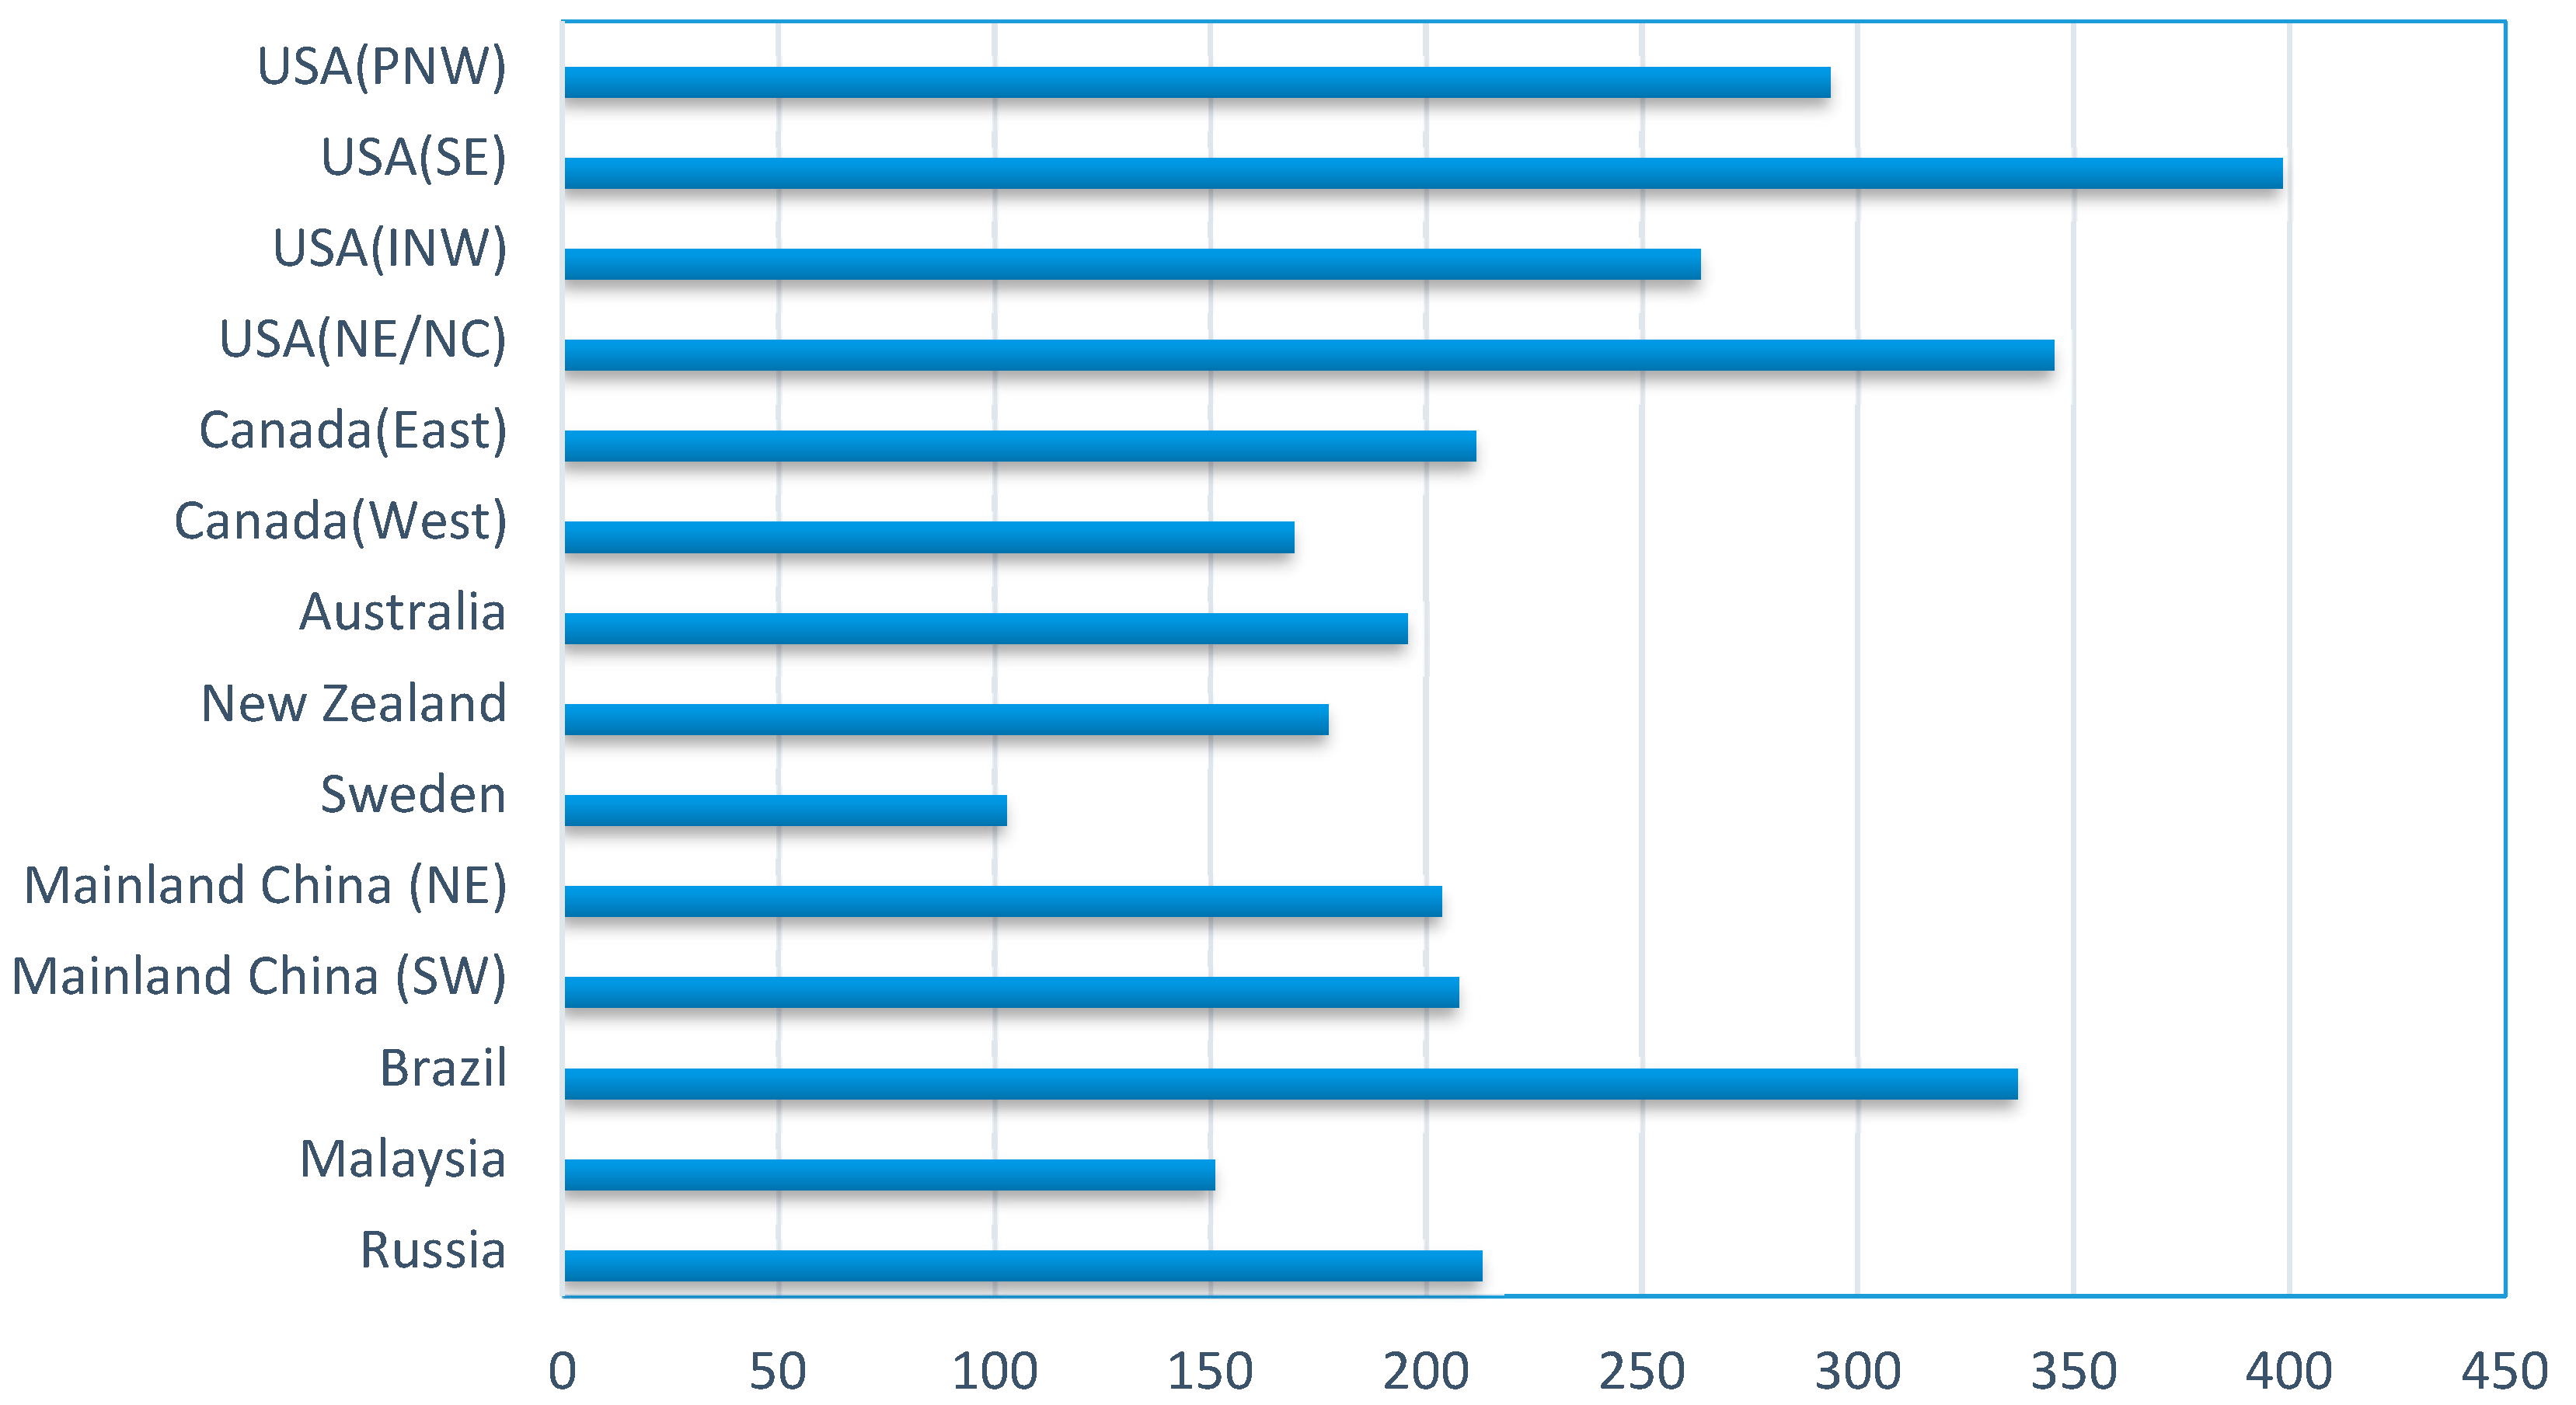
Figure 4 shows the CO2 emissions generated by importing wood from different regions to Taiwan. It is interesting to note that the CO2 emissions generated from importing wood from Sweden are significantly lower than those from other regions, although the energy consumed during the importing process is relatively high. This is because more renewable energy is applied in electricity production in Sweden, thus mitigating carbon emissions in industrial manufacturing process. Wood from the USA (Southeast) contributes to the highest amount of CO2 emissions (396 kg/m3), followed by wood from Brazil (337 kg/m3). The carbon emissions of imported wood from the USA to Taiwan vary from different regions, ranging from 260 kg/m3 to 396 kg/m3. The CO2 emissions of importing wood are quite similar across regions such as Canada, Australia, and New Zealand due to similar energy consumptions. In Asian regions, wood from mainland China contributes to higher CO2 emissions than wood from Malaysia, because the portion of fossil fuel accounts for the major part in electricity production, thus leading to higher CO2 emissions. If construction sector in Taiwan seeks to import wood from overseas with lower CO2, Sweden, Canada, Australia, and New Zealand would be most sustainable importing sources based on above analysis.
3.2. Relative Distributions of Sustainability Performances of Importing Wood from Difference Sources to Taiwan
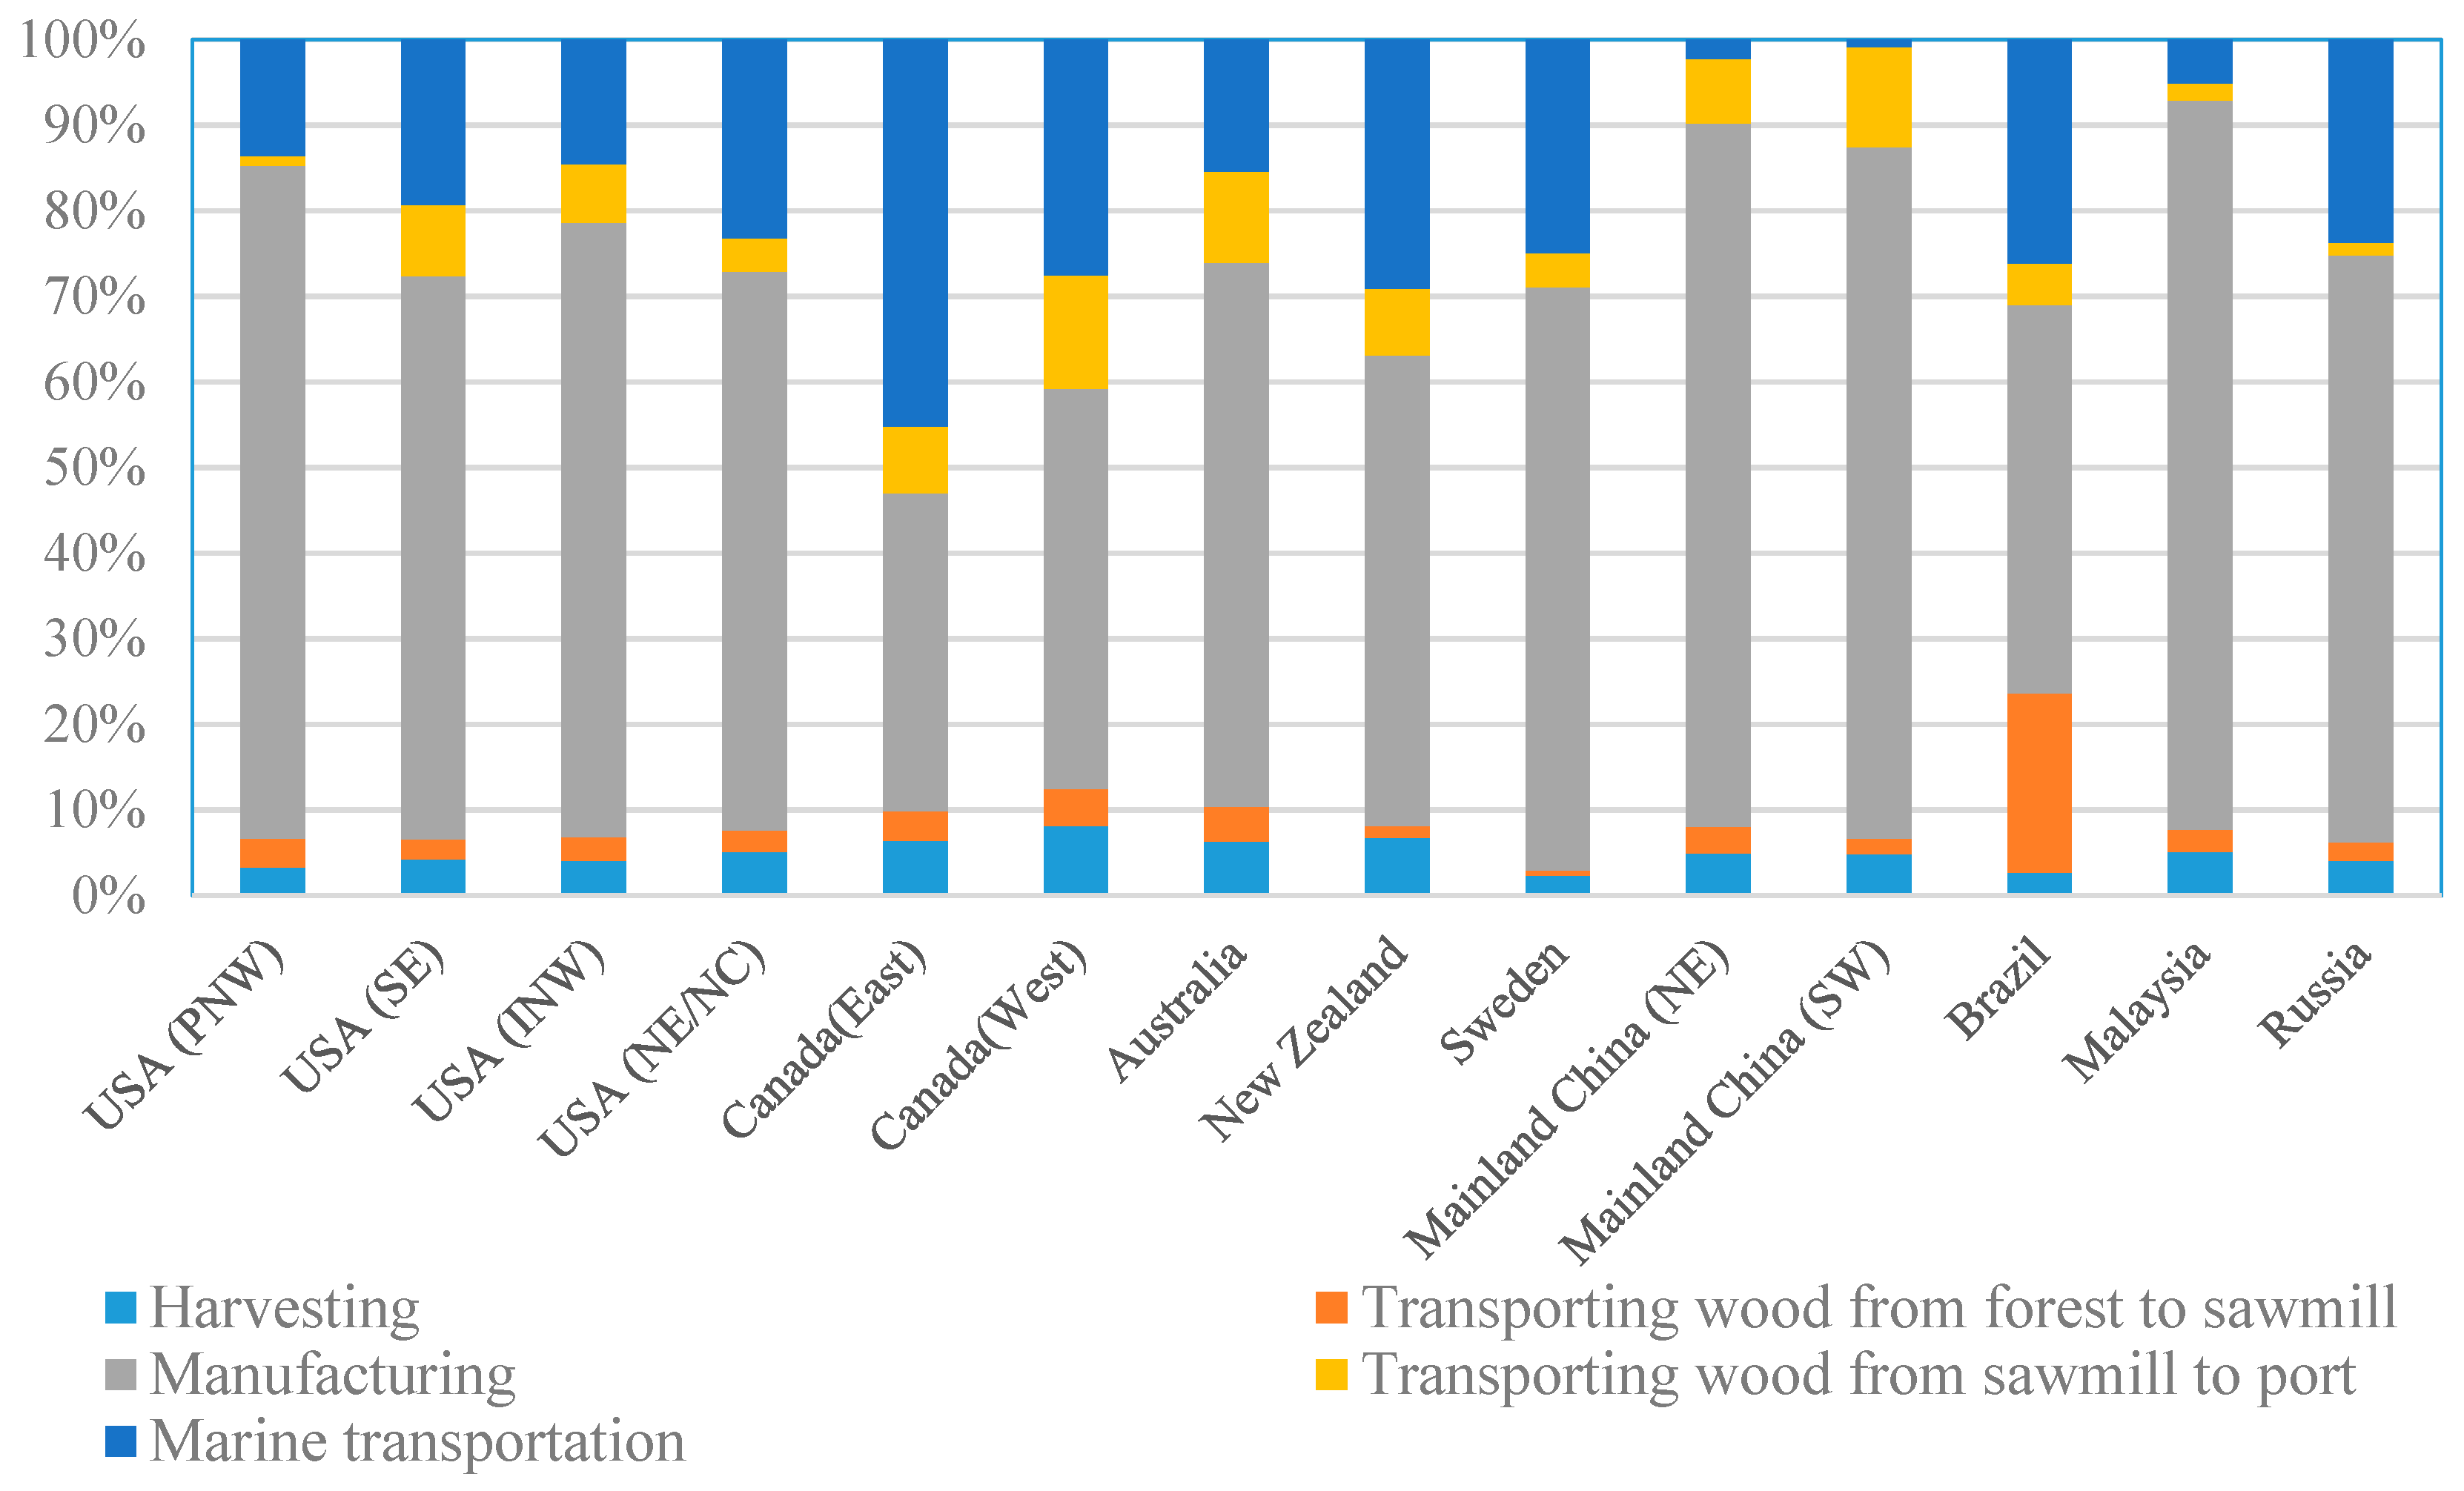
Figure 5 and Figure 6 illustrate the relative distributions of performances of embodied energy consumption and CO2 emissions of imported wood. As for energy consumption shown in Figure 5, wood harvesting and inland transportation from forest to sawmill show less contribution to most of the regions except Brazil, where the inland transportation from forest region to sawmill contributes to 21% of total energy use due to very long trip (around 700 km). In most of regions (USA, Australia, New Zealand, Sweden, Mainland China, Malaysia, and Russia), wood manufacturing process accounts for the major energy consumption (from 57% up to 82%).
Besides, a long trip of marine transportation also significantly contributes to energy consumption. When wood is imported from USA to Taiwan, energy used in marine transportation from four American regions (PSW, SE, INW, and NE/NC) vary from 14% to 23%. However, if the wood is transported from Canada, the portion of energy consumption is much higher than that in USA. This is because manufacturing process in Canada consumes relatively less energy, while the marine transportation is quite similar to its competitor. For example, in the case of wood from the east of Canada, marine transportation reaches 45% of total energy consumption. Comparatively, the portions of energy consumed in marine transportation are less significant when importing from nearby Asian regions such as Malaysia and Mainland China, accounting for less than 10%.
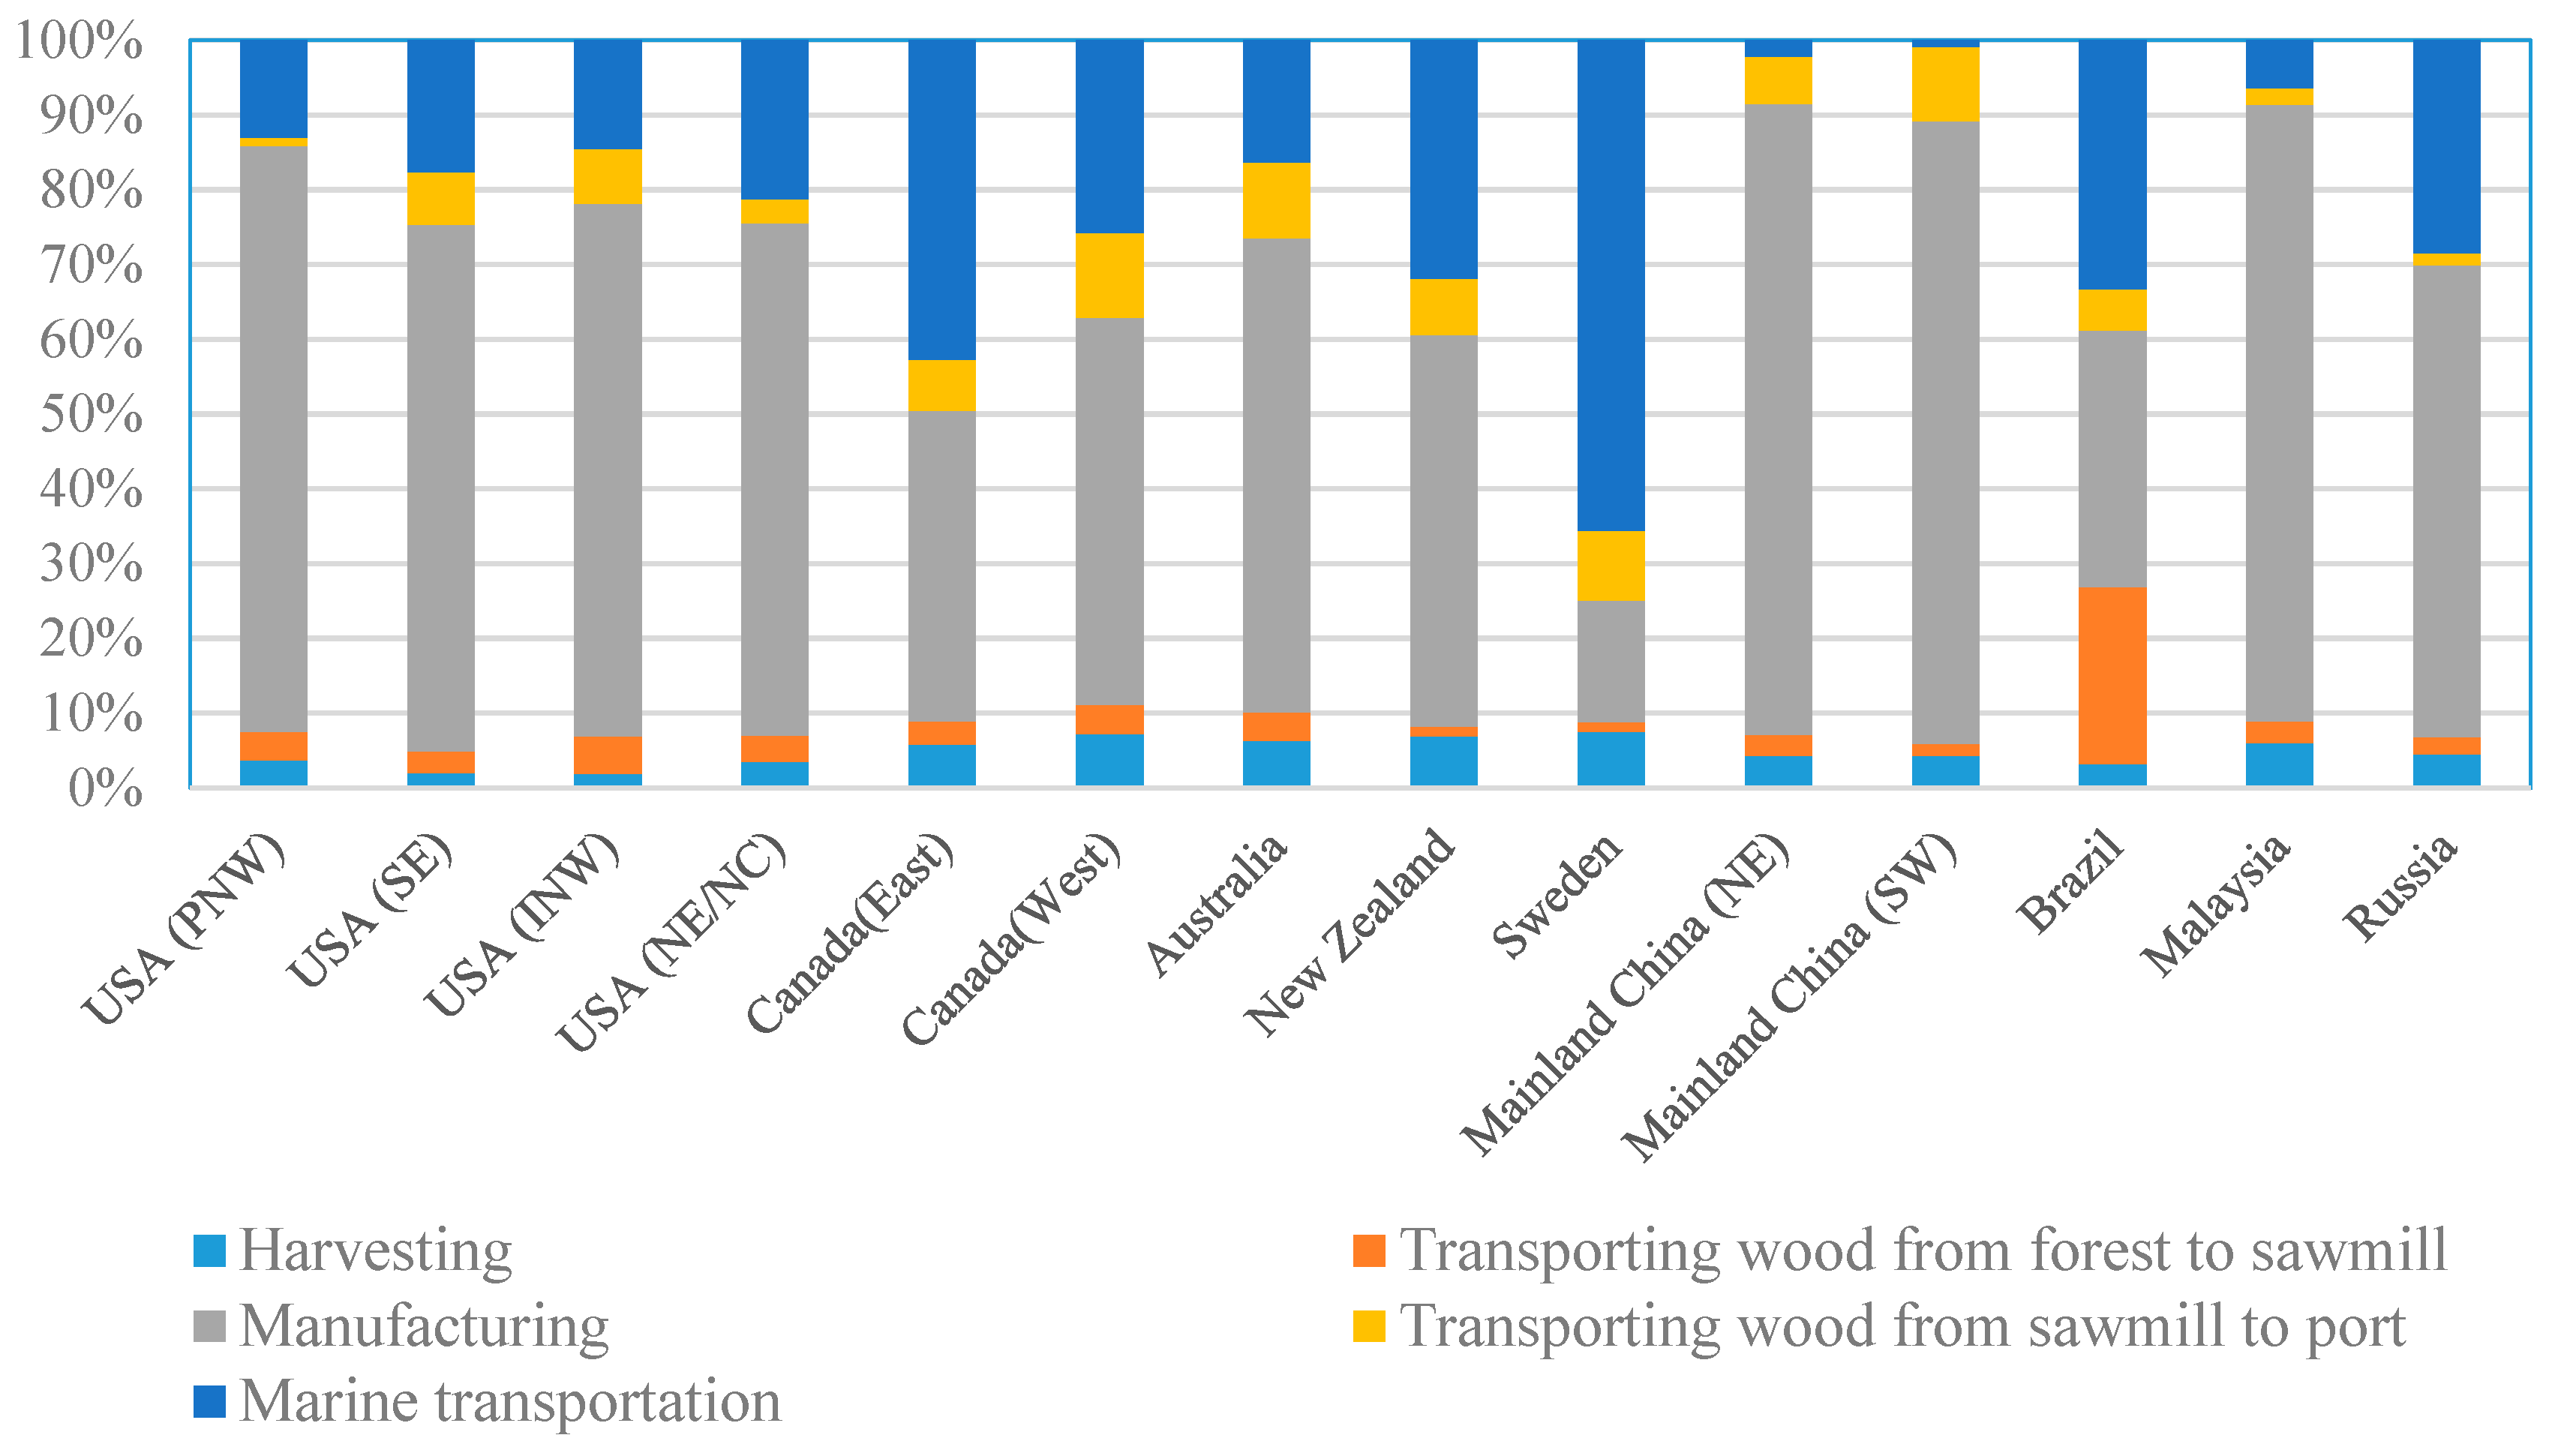
In terms of CO2 emissions, manufacturing process releases the greatest amount of emissions in most of the regions studied except Sweden, where CO2 emissions in manufacturing process account for only 16%, as conventional fossil fuel in primary energy distribution in Sweden in 2014 accounts for 9%, releasing only small portions of CO2 emissions. When wood is imported from Sweden, marine transportation accounts for 66% of total emissions due to very long transportation distance (20,804 km) and the lower emission level during manufacturing. Wood harvesting and road transportation from forest source to sawmill make a smaller contribution to CO2 emissions (less than 11%) in most of the regions in this study. This finding does not translate to Brazil, as it requires long distance for road transportation. Marine transportation is another major factor that contributes to the CO2 emissions as well. For example, Marine transportation of wood from North America (the USA and Canada) contributes to 14% to 45% of total CO2 emissions. By contrast, the CO2 emissions of marine transportation of wood from Asian regions (Malaysia and Mainland China) are relatively less significant.
3.3. Crucial Factors of Sustainability Performance of Wood Imported from Overseas
Based on previous analysis, the most crucial factors of sustainability performance of importing wood to Taiwan have been be identified. Although many efforts have been made to collect data in this study, the uncertainties of data could not be avoided due to the changing reality. Therefore, the author would suggest that among five factors, only a relative percentage of more than 10% is to be considered essential in the analysis. This means that if wood is imported to Taiwan for use, the collection of these crucial data becomes necessary for analysing the environmental impact. Table 5 shows the crucial factors of sustainability performance of wood used in Taiwan’s construction sector for each region. Manufacture is a critical factor for all regions, while harvesting is not significant for all. Marine transport is a crucial factor for the most of regions except Mainland China and Malaysia.
4. Discussion
Embodied energy consumption and CO2 emissions are two important indicators for assessing sustainable performance. The analysis of sustainability performance of imported wood from different regions can provide scientific information and results for building construction professionals in many wood limited countries or regions such as Japan, South Korea, and Taiwan that enable them to select more sustainable wood resources. The sustainability performance of importing wood from different sources could be influenced by multiple factors. For energy consumption, importing wood form Brazil consumes the highest amount of energy, because the wood that comes from Brazil is involved in longer routes by road and marine transportation when compared to other wood resources. However, when compared with wood from Canada, the wood that comes from USA has relatively higher energy consumption, although the distance between Canada and Taiwan is longer than that between USA and Taiwan. This could be explained by the reason that the energy consumption in manufacturing wood in USA is much higher than that in Canada. For the CO2 emission performance, the energy distribution of wood importing source could have a significant influence on sustainable performance. From the results, it is found that the CO2 emissions generated by importing wood from Sweden are significantly lower than those from other neighborhood regions like Mainland China and Malaysia. This is because more renewable energy is applied in electricity production in Sweden, while the portion of fossil fuel accounts for the major part of electricity production in these Asian regions. Therefore, it is necessary to systematically consider multiple factors when conducting sustainable performance studies.
Although the final results of sustainable performance are quite complex, generally, environmental impacts of wood used in construction sector could be minimized by selecting appropriate import regions with shorter transportation distance, as marine transportation contribute a large part of environmental impacts on the lifecycle of wood. These results could determine whether it is possible to use some wood resources locally for these regions to avoid environmental impacts generated from long distance transportation. This implication could have multiple benefits. Firstly, environmental impacts due to long journeys can obviously be avoided if the local wood is harvested and used in construction. Secondly, this solution can meet the requirements of sustainability of resource utilization in a self-sufficient environment, and, in turn, reduce the consumption of wood in other regions, if wood used in construction is available locally. Finally, it could be helpful to increase the domestic supply of wood if possibility of reusing and recycling wood products in a dominant market could be also taken into consideration. In consequence, the possibility of using local wood resources in a sustainable manner should be reconsidered by the authority in regions with less sufficient wood resources.
Although this study has considered embodied energy consumption and CO2 emissions in the sustainability assessment, more indicators could be developed to assess the sustainable wood management in construction industry in future studies. These include the extent of forest resource, biological diversity, forest health and activity, productive functions for forest resources, protective functions of forest resources, and social-economical functions. These may help to identify whether wood used in construction sector could fulfil the goal of sustainable construction.
5. Conclusions
This study contributes to understanding how to identify sustainable wood sources for the construction industry, and it provides information to enable building construction professionals to select more sustainable wood resources. To be specific, in terms of energy consumption, importing wood from Canada, the Asia region, and the Oceania region has an advantage when compared to importing wood from USA and Brazil. Wood manufacture dominates most of the energy consumption among the importing processes analysed. Marine transportations of wood from North America, South America, and the European and Oceania regions also contribute to large portions of energy consumption. Wood harvesting and inland transportation from forest to sawmill made a small contribution to energy consumption at all stages. So far, as CO2 emissions are concerned, American and Brazilian wood releases a greater amount of CO2 emissions due to long distance transportation. If the construction sector in Taiwan seeks to import wood from overseas with lower CO2, Sweden, Canada, Australia, and New Zealand would be the most sustainable importing sources. Marine transportation is an essential factor for wood-embodied CO2 emissions, except for wood imported from Asian regions (Mainland China and Malaysia). Wood manufacture is also the biggest contributor to CO2 emissions in most of the regions. These findings could be significantly valuable information for authorities looking to select sustainable wood resources in the construction sector.
This study found that the sustainability performance of importing wood from different sources could be influenced by multiple factors. Hence, it is necessary to systematically consider multiple factors when conducting sustainable performance studies. Embodied energy consumption and CO2 emissions are two important indicators for assessing sustainable performance. Meanwhile, the processes and energy distribution involved in the sustainable assessment should not be overlooked in the sustainability performance assessment. As marine transportation contributes a large part of the environmental impact on the lifecycle of wood, selecting appropriate import regions with shorter transportation distances could certainly minimise the environmental impact of wood used in the construction sector. Regarding broader implications, the analysis of sustainability performance of imported wood from different regions can provide scientific-based information and results for building construction professionals in many wood-limited countries or regions such as Japan, South Korea, and Taiwan to select wood resources in a sustainable manner.
Acknowledgments
This study was supported by National Natural Science Foundation of China (NSFC: 51478267).
Author Contributions
Shenghan Li and Huanyu Wu conceived and designed the study; Zhikun Ding contributed analysis tools; Shenghan Li and Huanyu Wu wrote the paper.
Conflicts of Interest
The authors declare no conflict of interest.
References
- Chung, S.S.; Lo, W.H.C. Evaluating sustainability in waste management: The case of construction and demolition, chemical and clinical wastes in Hong Kong. J. Resour. Conserv. Recycl. 2003, 37, 119–145. [Google Scholar] [CrossRef]
- Basiago, A.D. Methods of defining ‘Sustainability’. Sustain. Dev. 1995, 3, 109–1195. [Google Scholar] [CrossRef]
- Akadiri, P.O. Understanding barriers affecting the selection of sustainable materials in building projects. J. Build. Eng. 2015, 4, 86–93. [Google Scholar] [CrossRef]
- Zuo, J.; Zhao, Z.Y. Green building research–current status and future agenda: A review. Renew. Sustain. Energy Rev. 2014, 30, 271–281. [Google Scholar] [CrossRef]
- Zuo, J.; Xia, B.; Chen, Q.; Pullen, S.; Skitmor, M. Green building rating for office buildings-lessons learned. J. Green Build. 2016, 11, 131–146. [Google Scholar] [CrossRef]
- Wu, H.; Wang, J.; Duan, H.; Ouyang, L.; Huang, W.; Zuo, J. An innovative approach to managing demolition waste via GIS (geographic information system): A case study in Shenzhen city, China. J. Clean. Prod. 2016, 112, 494–503. [Google Scholar] [CrossRef]
- Wang, J.; Wu, H.; Duan, H.; Zillante, G.; Zuo, J.; Yuan, H. Combining Life Cycle Assessment and Building Information Modelling to account for carbon emission of building demolition waste: A case study. J. Clean. Prod. 2017. [Google Scholar] [CrossRef]
- Huang, C.Y.; Lin, C.R.; Ho, M.C. Report on the State of Sustainable Building in Taiwan, 2008. Available online: http://www.iisbe.org/sbconferences/Taiwan_SB_Report_SB08.pdf (accessed on 15 August 2017).
- Huo, X.; Yu, T.A. Analytical review of green building development studies. J. Green Build. 2017, 12, 130–148. [Google Scholar] [CrossRef]
- Wang, L.; Toppinen, A.; Juslin, H. Use of wood in green building: A study of expert perspectives from the UK. J. Clean. Prod. 2014, 65, 350–361. [Google Scholar] [CrossRef]
- Zuo, J.; Pullen, S.; Rameezdeen, R. Green building evaluation from a life-cycle perspective in Australia: A critical review. Renew. Sustain. Energy Rev. 2017, 70, 358–368. [Google Scholar] [CrossRef]
- Xia, B.; O’Neill, T.; Zuo, J.; Skitmore, M.; Chen, Q. Perceived obstacles to multi-storey timber-frame construction: An Australian study. Archit. Sci. Rev. 2014, 57, 169–176. [Google Scholar] [CrossRef] [Green Version]
- Sathre, R.; Gustavsson, L. Using wood products to mitigate climate change: External costs and structural change. Appl. Energy 2009, 86, 251–257. [Google Scholar] [CrossRef]
- Hughes, E.; Benemann, J.R. Biological fossil CO2 mitigation. Energy Conserv. Manag. 1997, 38, 467–473. [Google Scholar] [CrossRef]
- Brännlund, R.; Lundgren, T. A dynamic analysis of interfuel substitution for Swedish heating plants. Energy Econ. 2004, 26, 961–976. [Google Scholar] [CrossRef]
- Chen, A.X. The Prospects of Wood Planting in Taiwan. Master’s Thesis, National Taiwan University, Taipei, Taiwan, 2002. (In Chinese). [Google Scholar]
- Li, P.F. Database of Natural Resources and Ecology in Taiwan; Taiwan Forestry Bureau: Taipei, Taiwan, 2006. (In Chinese) [Google Scholar]
- Koch, P. Wood versus non-wood materials in US residential construction: Some energy-related global implications. For. Prod. J. 1992, 42, 31–42. [Google Scholar]
- Buchanan, A.H.; Honey, B.G. Energy and carbon dioxide implications of building construction. Energy Build. 1994, 20, 205–217. [Google Scholar] [CrossRef]
- Borjesson, P.; Gustavsson, L. Greenhouse gas balances in building construction: Wood versus concrete from lifecycle and forest land use perspectives. Energy Policy 2000, 28, 575–588. [Google Scholar] [CrossRef]
- Upton, B.; Miner, R.; Spinney, M.; Heathd, L.S. The greenhouse gas and energy impacts of using wood instead of alternatives in residential construction in the United States. Biomass Bioenergy 2008, 32, 1–10. [Google Scholar] [CrossRef]
- Peterson, A.K.; Solberg, B. Greenhouse gas emissions, life-cycle inventory and cost-efficiency of using laminated wood instead of steel construction, Case: Beams at Gardermoen airport. Environ. Sci. Policy 2002, 5, 169–182. [Google Scholar] [CrossRef]
- Tu, S.H. Contribution of Carbon Sequestration and Carbon Dioxide Reduction by Wood Construction Buildings in Taiwan. Ph.D. Thesis, National Taiwan University, Taipei, Taiwan, 2007. (In Chinese). [Google Scholar]
- Tsai, C.F. Studies on the Energy Consumption and Carbon Dioxide Release of Sawmill Industry. Master’s Thesis, National Taiwan University, Taipei, Taiwan, 2001. (In Chinese). [Google Scholar]
- Lin, Z.L.; Wang, S.Y.; Lin, F.C. The assessment of carbon dioxide emissions and carbon sink of plywood manufacturing process in Taiwan. Rep. For. Exp. Natl. Taiwan Univ. 2001, 15, 9–13. (In Chinese) [Google Scholar]
- Li, S.H.; Xie, H. Building professionals’ attitudes towards the use of wood in building design and construction in Taiwan. Eur. J. Wood Wood Prod. 2013, 71, 497–505. [Google Scholar] [CrossRef]
- Food and Agricultural Organisation of U.N. (FAO). Energy Conservation in the Mechanical Forest Industries; Unipub Publisher: New York, NY, USA, 1990; ISBN 10:9251029121. [Google Scholar]
- Puettmann, M.E.; Wilson, J.B. Life-cycle analysis of wood products: Cradle-to-gate LCI of residential wood building materials. Wood Fiber Sci. 2005, 37, 18–29. [Google Scholar]
- Puettmann, M.E.; Bergman, R.; Hubbard, S.; Johnson, L.; Lippke, B. Cradle-to-gate life-cycle inventory of US wood products production: Corrim Phase 1 and Phase 2 Products. Wood Fiber Sci. 2010, 42, 15–28. [Google Scholar]
- Athena Sustainable Materials Institute (ASMI). A Cradle-to-Gate Life Cycle Assessment of Canadian Oriented Strand Board, Particleboard, Softwood Lumber, Medium Density Fibreboard; Athena Institute Public Report 2008; Athena Sustainable Materials Institute: Ottawa, ON, Canada, 2008; Available online: http://www.athenasmi.org/resources/publications/ (accessed on 15 July 2017).
- Competence Centre for Environmental Assessment of Product and Material Systems (CPM). LCA Database, 2017. Available online: http://www.cpm.chalmers.se (accessed on 4 March 2016).
- Alcorn, A. Embodied Energy and CO2 Coefficients for New Zealand Building Materials; Centre for Building Performance Research Report; Centre for Building Performance Research Victoria University: Wellington, New Zealand, 2003; ISBN 0-475-11099-4. [Google Scholar]
- Lawson, B. Building Materials Energy and the Environment. Towards Ecologically Sustainable Development; The Royal Australian Institute of Architecture: Victoria, BC, Canada, 1996; pp. 1–5. [Google Scholar]
- International Panel on Climate Chang (IPCC). Guidelines for National Greenhouse Gas Inventories; Institute for Global Environmental Strategies: Kanagawa Prefecture, Japan, 2006; ISBN 4-88788-032-4. [Google Scholar]
- Energy Information Administration (EIA). Independent and Statistics & Analysis, 2017; Energy Information Administration: Washington, DC, USA, 2017. Available online: http://www.eia.gov (accessed on 15 October 2017).
- User Guide for Urban Transportation Emissions Calculator (UTEC). Transport Canada, 2008. Available online: http://www.gtkp.com/assets/uploads/20091124-131438-4013-UTEC-CETU-E.pdf (accessed on 4 October 2017).
- Sawmill Database. 2017. Available online: http://www.sawmilldatabase.com/index.php (accessed on 23 October 2017).
- Network for Transport & Environment (NTM). Environmental Data for International Cargo Sea Transport, Calculation Methods, Emission Factors, Mode-Specific Issues, 2017. Available online: http://www.transportmeasures.org (accessed on 12 November 2017).
- Marine Traffic. 2017. Available online: https://www.marinetraffic.com (accessed on 4 November 2017).
Figure 1.
System boundary of the study.

Figure 2.
Wood materials sources and transportation routes.

Figure 3.
Total embodied energy consumption of imported wood to Taiwan (MJ/m3).

Figure 4.
Total embodied CO2 emissions of imported wood to Taiwan (kg/m3).

Figure 5.
Relative performance of embodied energy of imported wood to Taiwan.

Figure 6.
Relative performance of embodied CO2 emissions of imported wood to Taiwan.


Table 1.
Data source of energy consumption of wood harvesting and manufacturing.
| Region | Wood Harvesting (MJ/m3) | Wood Manufacturing (MJ/m3) | Data Source | |
|---|---|---|---|---|
| USA | Pacific Northwest | 143 | 3415 | [30,31] |
| Inland Northwest | 164 | 2911 | ||
| Northeast | 211 | 2721 | ||
| Southeast | 203 | 3175 | ||
| Canada | West | 169 | 978 | [32] |
| East | 150 | 924 | ||
| Sweden | 82 | 2683 | [33] | |
| New Zealand | 113 | 1380 | [34] | |
| Australia | 160 | 1700 | [35] | |
| Mainland China | Northeast | 170 | 2850 | [29] |
| Southwest | 170 | 2850 | ||
| Malaysia | 170 | 2850 | [29] | |
| Brazil | 170 | 2850 | [29] | |
| Russia | 170 | 2850 | [29] | |
Table 2.
CO2 emission factors of fuels and local primary energy distribution.
| CO2 Concerned Emission Factors | ||||
| Fossil fuel | CO2 emissions (kg/MJ) | |||
| Coal | 0.0946 | |||
| Natural gas | 0.0561 | |||
| Crude oil | 0.0733 | |||
| Gasoline | 0.07 | |||
| Diesel oil | 0.0741 | |||
| Local Primary Energy Distribution | ||||
| Mainland China | Malaysia | Brazil | Russia | |
| Oil | 19% | 2% | 50% | 19% |
| Hydrology | 6% | 12.7% | 34% | 6% |
| Natural gas | 3% | 45.5% | 8% | 54% |
| Coal | 71% | 34.6% | 5% | 16% |
| Nuclear | 0.8% | 0% | 1% | 5% |
| Renewable energy | 0.2% | 5.2% | 2% | 0% |
| Carbon Coefficient (kg) | 0.0831 | 0.0597 | 0.0458 | 0.0593 |
Table 3.
Information of sawmill and the distance to marine port.
| Region | Sawmill Location | Port | Average Distance (km) |
|---|---|---|---|
| USA | Pacific Northwest (Oregon, Washington) | Tacoma | 110 |
| Inland Northwest (Montana, Idaho) | Tacoma | 639 | |
| Northeast (Ohio, Vermont, New York, New Hampshire, Maine) | New York | 367 | |
| Southeast (Texas, Mississippi, Tennessee, Georgia) | Houston | 919 | |
| Canada | West (British Columbia, Albert) | Vancouver | 634 |
| East (Ontario, Quebec, New Brunswick) | Quebec | 476 | |
| Sweden | Gällö Såg, Hissmofors, Kastets Sågverk, Moelven Dala | Stockholm | 318 |
| New Zealand | South Island (Alexandra, Temuka, Wanaka, Kaipai) | Nelson | 445 |
| Australia | East (New South Wales, Queensland, Victoria) | Sydney | 658 |
| Mainland China | Northeast (Heilongjiang, Jilin, Liaoning) | Dalian | 592 |
| Southwest (Yunnan, Guanxi, Sichuan) | Guangzhou | 938 | |
| Malaysia | Sarawak (Betong, Sibu, Kapit, Miri) | Bintulu | 170 |
| Brazil | Rio grand do Sul, Santa Catarina, Parana, Sao Paulo) | Santos | 700 |
| Russia | West (Efimovskiy, Pestovo, Shenksna, Tikhvin, Puzla Norvik) | St. Petersburg | 450 |
Table 4.
Vessel conditions and information.
| Group | Import Countries (Departing Port) | DWT (tonne) | TEU | Distance (km) | Fuel Consumption (tonne/km) | Emission Factor (kg/tonne Fuel) |
|---|---|---|---|---|---|---|
| Group 1 | USA (NW, Tacoma) | 75,000 | 7000 | 10,606 | 0.163 | 3110 |
| USA (SE, Houston) | 75,000 | 7000 | 19,503 | |||
| USA (NE, New York) | 75,000 | 7000 | 20,309 | |||
| CAN (Vancouver) | 60,000 | 6000 | 10,376 | |||
| CAN (Quebec) | 60,000 | 6000 | 21,422 | |||
| Sweden (Helsinki) | 75,000 | 8000 | 20,804 | |||
| Russia (Saint Petersburg) | 75,000 | 7000 | 20,641 | |||
| Group 2 | Australia (Sydney) | 50,000 | 4000 | 7400 | 0.109 | 3179 |
| New Zealand (Auckland) | 40,000 | 2700 | 8841 | |||
| Brazil (Santos) | 40,000 | 2700 | 19,859 | |||
| Group 3 | Mainland China (Dalian) | 15,000 | 1600 | 1905 | 0.033 | 3179 |
| Mainland China (Guangzhou) | 15,000 | 1600 | 787 | |||
| Russia (Vladivostok) | 14,000 | 1715 | 2616 | |||
| Malaysia (Bin Tulu) | 19,000 | 1600 | 4061 |
Note: DWT (Dead Weight Tonnes): a measure of how much weight a ship is carrying or can safely carry; TEU (Twenty Equivalent Foot): a measure used for capacity in container transportation.
Table 5.
Crucial factors of environment impact of wood imported from overseas.
| Imported Regions | Harvesting | Transporting Wood from Forest to Sawmill | Manufacture | Transporting Wood from Sawmill to Port | Marine Transport |
|---|---|---|---|---|---|
| USA (PNW) | ● | ● | |||
| USA (INW) | ● | ● | |||
| USA(SE) | ● | ● | |||
| USA (NE/NC) | ● | ● | |||
| Canada (West) | ● | ● | ● | ||
| Canada (East) | ● | ● | |||
| Australia | ● | ● | ● | ||
| New Zealand | ● | ● | |||
| Sweden | ● | ● | |||
| Brazil | ● | ● | ● | ||
| Mainland China (NE) | ● | ||||
| Mainland China (SW) | ● | ● | |||
| Malaysia | ● | ||||
| Russia | ● | ● |
© 2018 by the authors. Licensee MDPI, Basel, Switzerland. This article is an open access article distributed under the terms and conditions of the Creative Commons Attribution (CC BY) license (http://creativecommons.org/licenses/by/4.0/).
Share and Cite
MDPI and ACS Style
Li, S.; Wu, H.; Ding, Z. Identifying Sustainable Wood Sources for the Construction Industry: A Case Study. Sustainability 2018, 10, 139. https://0-doi-org.brum.beds.ac.uk/10.3390/su10010139
AMA Style
Li S, Wu H, Ding Z. Identifying Sustainable Wood Sources for the Construction Industry: A Case Study. Sustainability. 2018; 10(1):139. https://0-doi-org.brum.beds.ac.uk/10.3390/su10010139
Chicago/Turabian StyleLi, Shenghan, Huanyu Wu, and Zhikun Ding. 2018. "Identifying Sustainable Wood Sources for the Construction Industry: A Case Study" Sustainability 10, no. 1: 139. https://0-doi-org.brum.beds.ac.uk/10.3390/su10010139
Note that from the first issue of 2016, this journal uses article numbers instead of page numbers. See further details here.