Non-Market Food Provision and Sharing in Japan’s Socio-Ecological Production Landscapes


1
United Nations University Institute for the Advanced Study of Sustainability, Tokyo 150-8925, Japan
2
Graduate School of Agriculture and Life Sciences, The University of Tokyo, Tokyo 113-8657, Japan
*
Author to whom correspondence should be addressed.
Sustainability 2018, 10(1), 213; https://0-doi-org.brum.beds.ac.uk/10.3390/su10010213
Submission received: 29 December 2017
/
Revised: 11 January 2018
/
Accepted: 14 January 2018
/
Published: 16 January 2018
(This article belongs to the Special Issue Defining and Assessing Landscape and Urban Sustainability: Linking Spatial Patterns, Ecosystems Services, and Human Wellbeing)
Abstract
:Socio-ecological production landscapes and seascapes (SEPLS) are characterized by a dynamic mosaic of different ecosystem types that maintain relatively high biodiversity and produce a bundle of ecosystem services. One unique characteristic of SEPLS is the sharing of provisioning services within and beyond communities, such as forests, agricultural and marine products. Conventional ecosystem assessments based on statistical data often ignore the benefits of these non-market provisioning services. This short communication quantifies the contribution of the sharing of food provisioning services in Japan in terms of their amount and variety, and it analyzes the relationship between such sharing practices and landscape types. Using an online web survey, we investigated the benefits of sharing goods and services provided from SEPLS. In both mountainous and flat agricultural areas, 16% of the total food amount came from non-market sources, compared to 10% in urbanized areas. Farmland and forests had significant positive correlations with most non-market food items in terms of amount. Greater amounts of built-up area in the landscape were associated with a lesser amount of non-market food provision. Food sharing culture can contribute to enhancing resilience against socio-economic changes and natural disasters. This study provides baseline information for monitoring the hidden flow of food provision and its multiple functions.
1. Introduction
Satoyama-satoumi is a Japanese term for socio-ecological production landscapes and seascapes (SEPLS), which are characterized by a dynamic mosaic of different ecosystem types that maintain high biodiversity and produce a bundle of ecosystem services [1]. SELPS with mosaics of paddies, upland fields, forests, water systems, and human settlements is a typical agricultural landscape not only in Japan but also in other area in the world. These socio-ecological systems are also often integral to people’s livelihood, customs, traditions, spirituality, and social relations [2]. One of the unique characteristics of SEPLS is the sharing of food provisioning services within and beyond rural communities [3,4,5]. It has been widely observed that forest, agricultural, and fishery products are frequently shared or given without a financial transaction between members of a society, and these actions are often associated with reciprocal relationships [6,7]. In almost all societies, the process of giving and receiving food reinforces social relations and group memberships [8]. In general, such sharing practices are common in rural areas, but limited scientific evidence is available on their contribution to people’s food consumption. Quandt et al. (2001) [9] investigated the social and nutritional meaning of food sharing among older rural adults in two rural counties in central North Carolina, and they revealed that receiving food gifts functions as way to maintain social relations and to create a feeling of community membership.
While agricultural and economic statistics are effective means to capture yield, sales and household expenditure to understand the contribution of food provisioning services to the society (e.g., Hashimoto et al. 2015 [10]), it often fails to capture the contribution of non-market food provision and sharing to human well-being. Despite the growing attention paid to the sharing economy and household food production, the non-market and non-monetized sharing of home-grown food has largely escaped scholars’ attention [11]. There are several studies which revealed the multidimensional roles of non-market food provision through home-gardens and community gardens in developed countries [12,13,14,15,16]. However, the existing literature has not examined the relationship between such sharing practices and landscape characteristics. When it comes to rural area, rurality can be conceptualized and expressed by various criteria [17]. In contrast with rich research accumulation in European countries, study on rurality is limited in Japan except of a few examples such as Tani et al. (2016) [18]. The objective of this short article is to quantify the contribution of the sharing of food provisioning services in Japan in terms of amount and food variety, and to analyze how such sharing practices vary across different landscapes by using landscape elements and their composition as a proxy of rurality.
2. Materials and Methods
A national web-based survey was conducted from 8 to 13 January 2015 in Japan, collecting information from 1525 respondents (827 (54%) males and 698 (46%) females) over 20 years old. The respondents were pre-screened to avoid bias in terms of gender, occupation, and region across Japan. The respondents at the age of 20 s account for 11%, 30 s for 24%, 40 s for 29%, 50 s for 23%, and over 60 s for 13%. Comparing with the national demographic statistics in 2015 [19], our samples contain almost twice larger proportion of 30 s–50 s respondents, and less proportion of over 60 s respondents. This is because the respondents are all online monitors who were pre-registered by the online survey company (Macromill, Tokyo, Japan). The company did not have a larger pool of monitors in age of over 60 s. We acknowledge this bias of respondents’ age composition as one of the limitations of this study. The respondents’ occupation includes company employees (38%), company owners and self-owned business (10%), government employees (6%), full-time homemakers (16%), part-time workers (11%), no jobs (e.g., retired) (10%) and others (e.g., students and freelance) (9%).
The agricultural area classification (AAC) system developed by Japan’s Ministry of Agriculture, Forestry and Fisheries (MAFF, Tokyo, Japan) was considered during the pre-screening process to reflect the actual distribution of respondents among these categories of agricultural land. The AAC system divides all municipal land in Japan into four categories—mountainous agricultural area, semi-mountainous agricultural area, flat agricultural area, and urbanized area—based on the criteria shown in Table 1. These criteria have been simplified from MAFF’s original criteria, due to the mismatch of some agricultural statistics after the major consolidation of municipalities that occurred from 1999 to 2006. We compared the AAC using both the simplified and the original criteria and found that the rate of matching was 84% [3]. According to MAFF (2013) [20], 79% of the entire population in Japan live in urbanized area while population in mountainous agricultural area, semi-mountainous agricultural area, and flat agricultural area accounts for 3%, 8%, and 10% respectively. This study tried to collect equal size of samples from four types of ACC, and as a result, we collect 396 (26%), 393 (26%), 330 (22%), 406 (27%) samples respectively from mountainous agricultural area, semi-mountainous agricultural area, flat agricultural area, and urbanized area.
The web-based questionnaire survey contained items on the current status of non-market food provision (amount and number of food varieties), social relations, and basic attributes of respondents. In this study, non-market food provision includes not only food that people produce and harvest by themselves (self-produce), but also items received from others without a market transaction (received from others). The survey asked respondents about the variety and relative quantities or proportions of each food category (rice and cereal, vegetables, fruits, meat, mushrooms, edible wild plants, fish products, and eggs and dairy products) acquired through non-market transactions each year, by production at home, gathering, and/or sharing. Specifically, for each category, we asked respondents about the proportion of their food (a) grown at home or gathered themselves from nearby forests or waters; (b) received from neighbors, relatives, or friends through sharing, gifts, and/or exchange; and (c) purchased from markets (e.g., groceries and supermarkets). Even though (b) food received from others is also self-produced by them, we accounted its amount and variety separately from those of (a) food grown at home or gathered by respondents themselves. According to MAFF (2017) [21], over 80% of local municipalities agreed with the policy need to improve food access due to aging population and closure of local glossary stores. In order to understand food access condition at different rural characteristics, this study also asked where the respondents purchased their food, considering both conventional (i.e., local store) and modern (i.e., e-commerce) food distribution systems.
All respondents were asked to specify their residential location by selecting a 1 km grid cell on the map shown on the web survey screen. Land-use composition data on 1 km grid cells from the National Land Numerical Information (Ministry of Land and Transportation, Tokyo, Japan) were also provided to match the grid cell of each respondent. The National Land Numerical Information divides land-use types into 12 categories: paddy fields, dry fields and orchards, forests, open areas, buildings, roads, railway transportation, golf courses, other land for human use, lakes and rivers, seashores, and seas. We aggregated these 12 types into five groups: (1) farmland (paddy fields, dry fields and orchards); (2) forests; (3) other green space (golf courses and open areas); (4) waters (lakes and rivers, seashores, and seas); and (5) built-up land (buildings, roads, railway transportation, and other land for human use). We used these five land-use types to examine the relationship with non-market food provision (percentage and food variety) by calculating Pearson’s correlation coefficient between non-market food provision and land-use types.
3. Results
3.1. Amount and Variety of Non-Market Food Provision
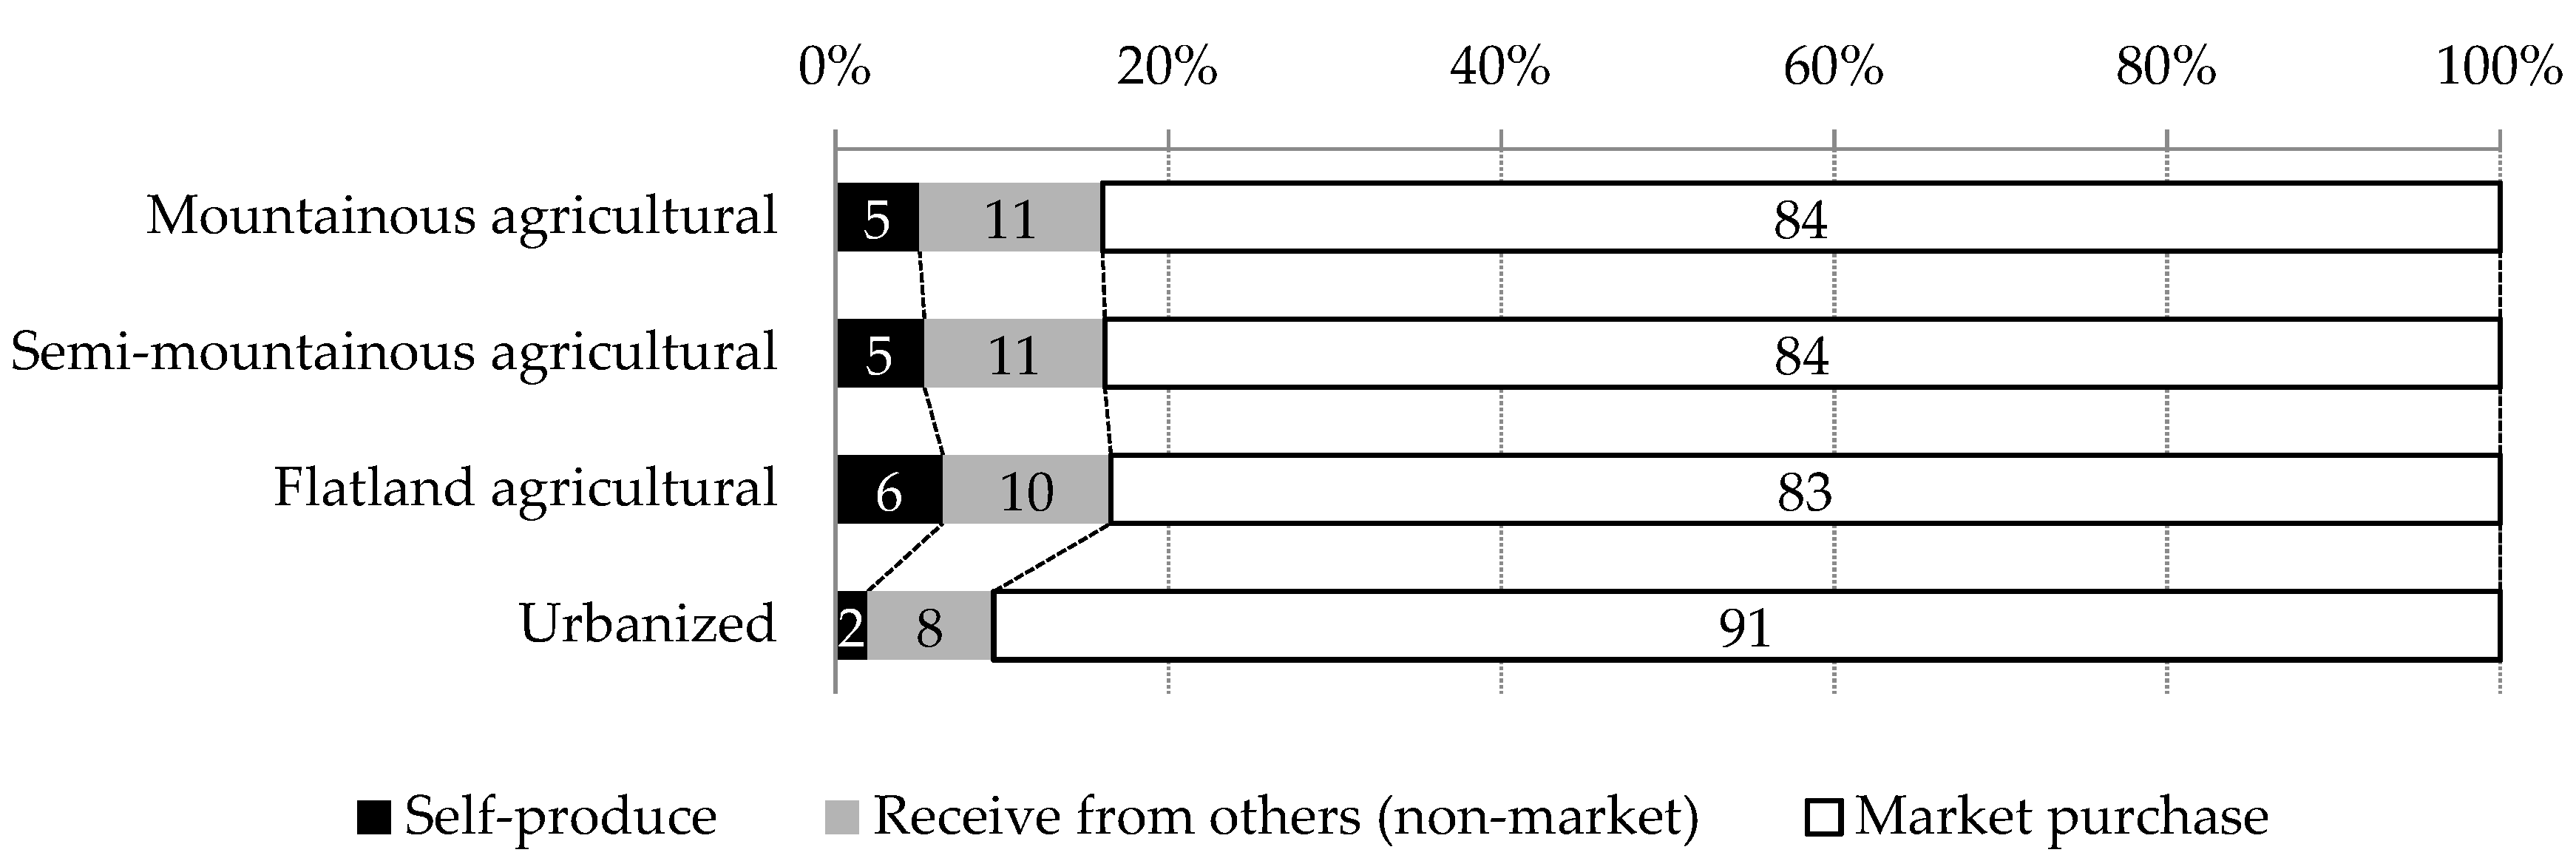
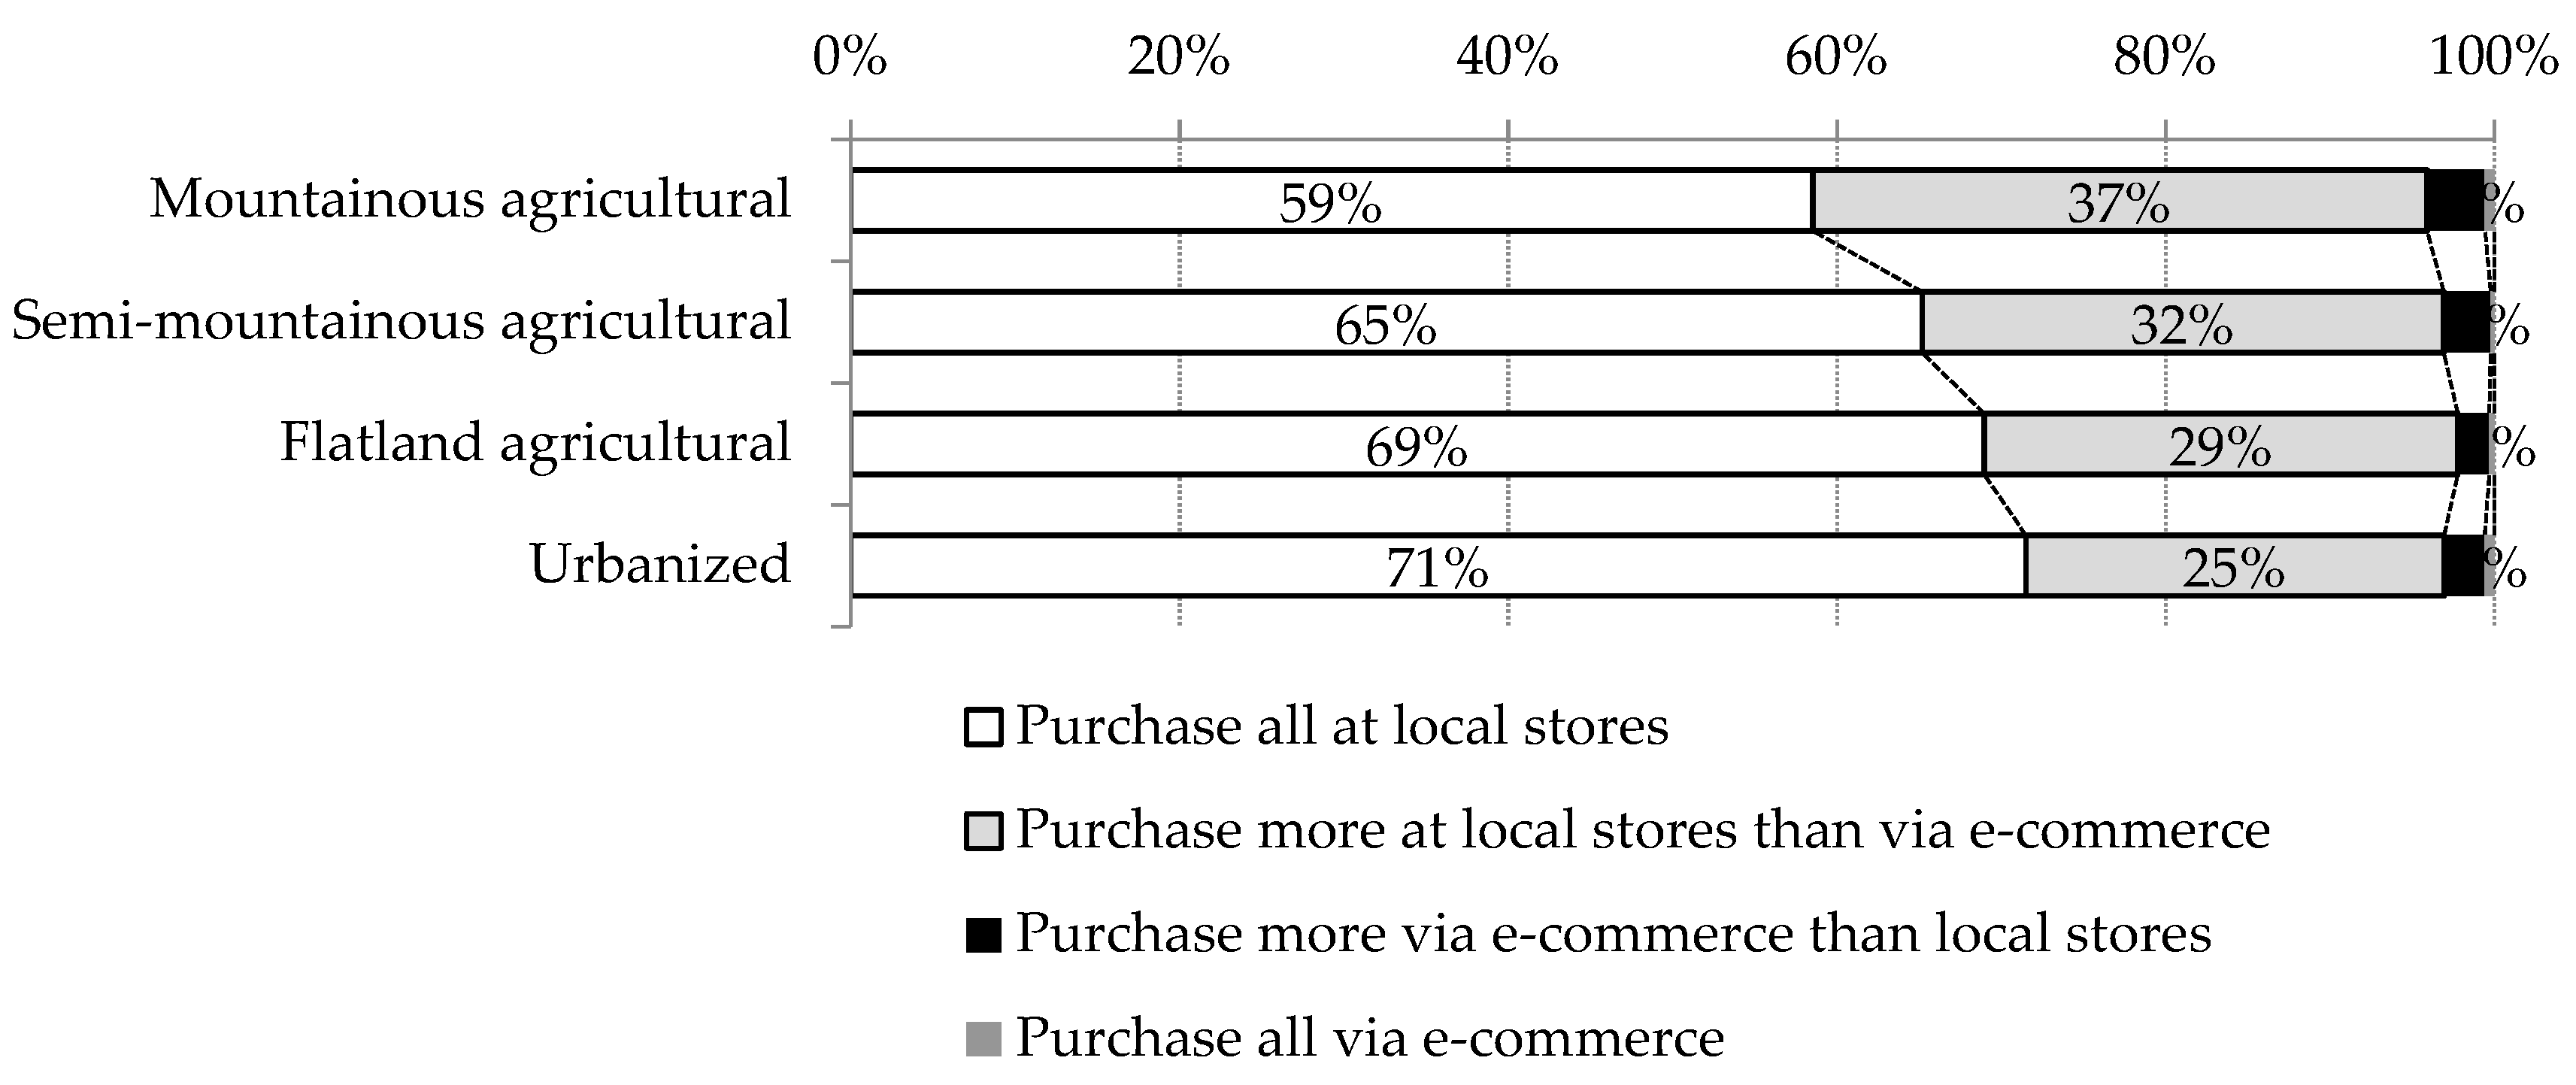
The survey found that 16% of food in mountainous and flat agricultural areas came from non-market sources, whereas 10% of food had non-market origins in urbanized areas (Figure 1). We found no significant difference between the three types of agricultural areas. This suggests that non-market food provision makes a non-negligible contribution to people’s food consumption in agricultural landscapes [3]. In terms of where the respondents purchased their food, the percentage of respondents saying that they purchased all of it at local stores was the highest in urbanized areas (71%) and the lowest in the mountainous agricultural areas (59%) (Figure 2). The households in more isolated rural areas tend to purchase food via e-commerce more than those in flat agricultural areas and urbanized areas, even though the amount purchased by e-commerce is still less than that obtained from local stores.
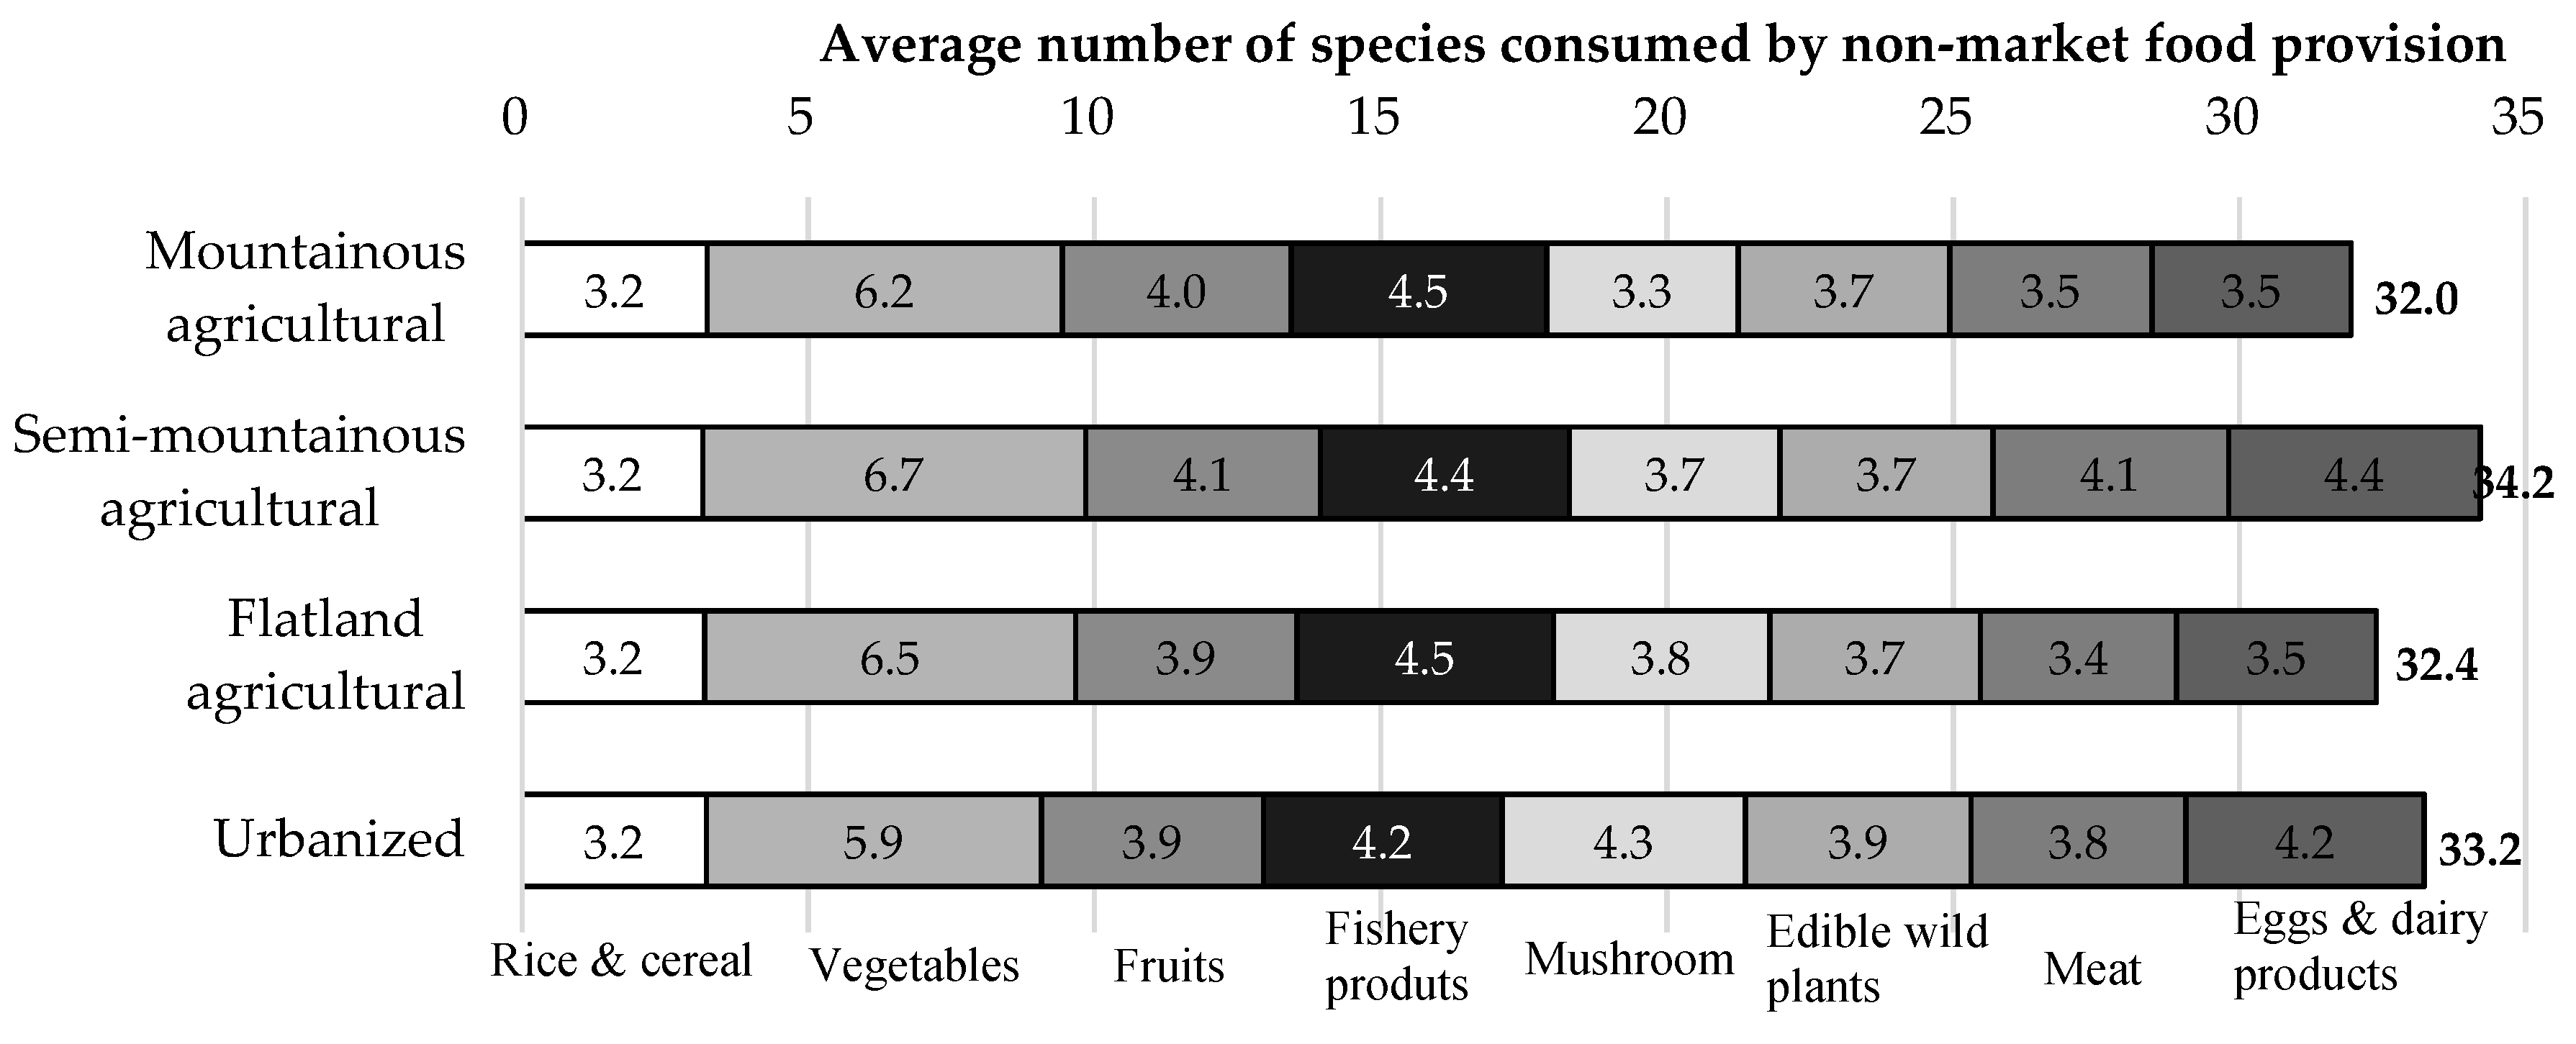
The average number of food varieties supplied by non-market provision ranged from 32.0 to 34.2 for the various land types, with no significant difference among the types of agricultural areas including urbanized area with small agricultural land (Figure 3). The family income and expenditure survey conducted by Japan’s central government (Statistics Bureau, Ministry of Internal Affairs and Communications) lists 190 food items (excluding beverages and eating at restaurants). Our results thus suggest that non-market food provision accounts for about 17% of all food varieties consumed at the household level. Vegetables constituted a relatively large number of such items (Figure 3), indicating that vegetables are common items among non-market food provision in Japan.
3.2. Relationship between Non-Market Food Provision and Land-Use Types
Pearson’s correlation coefficient was calculated to examine the relationship between non-market food provision percentages by food category and land-use type (Table 2). Significant positive correlations were observed between some non-market food provision items. The correlation between meat and eggs or dairy products had the highest coefficient (R = 0.660), followed by the correlation between mushrooms and edible wild plants (R = 0.624). Land-use types had both significant positive and negative correlations with non-market food provision. Farmland and forest areas had significant positive correlations with most non-market food items, with the exception of fish products, meat, and eggs and dairy products. Waters, not surprisingly, had a significant positive correlation with fish products. Built-up areas showed significant negative correlations with all non-market food items, suggesting that more heavily developed areas had less non-market food provision.
As for relationships between non-market food variety and land-use types, farmland had a significant positive correlation with vegetables and a significant negative correlation with mushrooms and edible wild plants (Table 3). Forests had a positive correlation with edible wild plants. Waters did not show a significant positive correlation with fish products but did have a significant negative correlation with mushrooms. Unlike the relationship with non-market food provision (Table 2), built-up areas did not have a negative correlation with non-market food variety, with the exception of vegetables (Table 3). This suggests that even in landscapes that are more heavily built up, some variety of food types can be sustained through non-market food sharing and exchange.
4. Discussion
This study quantified the contribution of non-market food provisioning to daily livelihoods in Japanese SEPLS. It found that 16% of all food was obtained from non-market sources in mountainous or flat agricultural areas, as compared to 10% in urbanized areas. The average number of food varieties provided by non-market sources ranged from 32 to 34.
The study also revealed that the households in deeper rural areas tend to purchase food via e-commerce more than those in flat agricultural areas and urbanized areas. This reflects the fact that people in the most isolated rural areas have the least access to local stores. In many rural areas in Japan, small local stores have been forced to close because of development of large-scale stores in suburban areas [22]. This situation, often described as a “food desert” problem, could have increasingly serious consequences because of the aging and shrinking population and the closing of local supermarkets in rural areas [22,23,24].
Based on correlation analysis between land-use types and non-market food provision (in both amount and variety), the study found that farmlands and forests had significant positive correlations with most non-market food items in terms of amount, but farmlands and forests did not show a strong correlation with many non-market food types. In addition, the study found that the larger the built-up area in the landscape, the lower the amount of non-market food provision, yet again this negative correlation was not detected in terms of non-market food variety other than with regard to vegetables.
Place-based or ‘‘alternative’’ food networks are understood as emerging networks of producers, consumers, and other actors that embody alternatives to the conventional industrial mode of food supply system [25,26]. Place-based food networks include practices such as local branding, short food supply chains, farmers’ markets, local quality labeling initiatives, geographic origin labels, hobby farming, food citizenship, non-market food sharing and exchange, and education programs [25]. The recent comparative study between Europe and Japan by Plieninger et al. (2018) [25] identified non-market exchange (e.g., through bartering or sharing) of food is as one of the prominent characteristics of place-based food networks in Japan.
Due to Japan’s aging and shrinking population, such practices of non-market food provision have been decreasing in the country relative to 20 or 30 years ago [3]. It seems that in recent decades, urbanization and globalization have weakened community connections and sharing mechanisms, especially in urban settings with large amounts of built-up space. Meanwhile, new forms of market-based sharing such as car and bike sharing, room and space sharing (e.g., Airbnb), and information sharing have been expanding significantly especially in urban areas not only in Japan but also many countries [27]. One of the future studies include exploring how the emerging sharing economy can sustain non-market sharing practices and landscape conservation with support from new forms of sharing such as sharing information, experiences, and skills for food production and processing at household and community scales.
In rural Japan, sharing various provisioning services still significantly contributes to human well-being, and such sharing networks often play a central role in maintaining cultural landscapes [28]. It is also reported that non-market food provisioning has played multiple functions in both daily life and in emergency situations (such as natural disasters) in Japan’s remote islands and rural peninsulas [4,29]. A food sharing culture in SEPLS can contribute to enhancing resilience against future socio-economic changes and natural disasters. Therefore, it is crucial to measure and monitor the current status of and changes in such sharing practices in different landscapes. This study has provided baseline information for such monitoring of the hidden flow of food provision and its multiple functions.
Acknowledgments
This study was supported by the Environment Research and Technology Development Fund (1–1303&S-15-1, Japan’s Ministry of the Environment) and Grants-in-Aid for Scientific Research (KAKENHI, Japan Society for the Promotion of Science).
Author Contributions
Osamu Saito, Chiho Kamiyama and Shizuka Hashimoto jointly designed the web-questionnaire. Chiho Kamiyama and Osamu Saito analyzed the collected questionnaire data, and all three authors wrote the paper.
Conflicts of Interest
The authors declare no conflict of interest.
References
- Duraiappah, A.K.; Nakamura, K.; Takeuchi, K.; Watanabe, M.; Nishi, M. (Eds.) Satoyama-Satoumi Ecosystems and Human Well-Being; United Nations University Press: Tokyo, Japan, 2012; p. 480. [Google Scholar]
- Saito, O.; Ichikawa, K. Socio-ecological systems in paddy-dominated landscapes in Asian Monsoon. In Social-Ecological Restoration in Paddy-Dominated Landscapes; Nishikawa, U., Miyashita, T., Eds.; Springer: Tokyo, Japan, 2014; pp. 17–37. [Google Scholar]
- Kamiyama, C.; Nakazawa, N.; Saito, O. Non-market food provisioning services through self-production and social networks in Japan: Comparison between Noto Peninsula and other regions. J. Jpn. Soc. Civ. Eng. Ser. G Environ. Res. 2014, 70, 361–369. [Google Scholar] [CrossRef]
- Kamiyama, C.; Hashimoto, S.; Kohsaka, R.; Saito, O. Non-market food provisioning services via homegardens and communal sharing in satoyama socio-ecological production landscapes on Japan’s Noto peninsula. Ecosyst. Serv. 2016, 17, 185–196. [Google Scholar] [CrossRef]
- Boafo, Y.A.; Saito, O.; Jasaw, G.S.; Otsuki, K.; Takeuchi, K. Provisioning ecosystem services-sharing as a coping and adaptation strategy among rural communities in Ghana′s semi-arid ecosystem. Ecosyst. Serv. 2016, 19, 92–102. [Google Scholar] [CrossRef]
- Morton, L.W.; Bitto, E.A.; Oakland, M.J.; Sand, M. Accessing food resources: Rural and urban patterns of giving and getting food. Agric. Hum. Values 2008, 25, 107–119. [Google Scholar] [CrossRef]
- Davis, G.; Whelan, S.; Foley, A.; Walsh, M. Gifts and gifting. Int. J. Manag. Rev. 2010, 12, 413–434. [Google Scholar] [CrossRef]
- Counihan, C.; Van Esterik, P. Food and Culture: A Reader, 3rd ed.; Routledge: New York, NY, USA; p. 648.
- Quandt, S.A.; Arcury, T.A.; Bell, R.A.; McDonald, J.; Vitolins, M.Z. The social and nutritional meaning of food sharing among older rural adults. J. Aging Stud. 2001, 15, 145–162. [Google Scholar] [CrossRef]
- Hashimoto, S.; Nakamura, S.; Saito, O.; Kohsaka, R.; Kamiyama, C.; Tomiyoshi, M.; Kishioka, T. Mapping and characterizing ecosystem services of social-ecological production landscapes: Case study of Noto, Japan. Sustain. Sci. 2015, 10, 257–273. [Google Scholar] [CrossRef]
- Jehlička, P.; Daněk, P. Rendering the Actually Existing Sharing Economy Visible: Home-Grown Food and the Pleasure of Sharing. Sociol. Rural 2017, 57, 274–296. [Google Scholar] [CrossRef]
- Rosol, M. Community Volunteering as Neoliberal Strategy? Green Space Production in Berlin. Antipode 2011, 44, 239–257. [Google Scholar] [CrossRef]
- Galhena, H.; Freed, R.; Maredia, K.M. Homegardens: A promising approach to enhance household food security and wellbeing. Agric. Food Sci. 2013, 2, 8. [Google Scholar] [CrossRef]
- Pottinger, P. Ethical Food Consumption and the City. Geogr. Compass 2013, 7, 659–668. [Google Scholar] [CrossRef]
- Taylor, J.R.; Lovell, S.T. Urban home food gardens in the Global North: Research traditions and future directions. Agric. Hum. Values 2014, 31, 285–305. [Google Scholar] [CrossRef]
- Sioen, G.B.; Sekiyama, M.; Terada, T.; Yokohari, M. Post-Disaster Food and Nutrition from Urban Agriculture: A Self-Sufficiency Analysis of Nerima Ward, Tokyo. Int. J. Environ. Res. Public Health 2017, 14, 748. [Google Scholar] [CrossRef] [PubMed]
- Cloke, P. Conceptualizing rurality. In Handbook of Rural Studies; Cloke, P., Marsden, T., Lockie, S., Lawrence, G., Eds.; Sage: London, UK, 2006; pp. 18–28. [Google Scholar]
- Tani, Y.; Hashimoto, S.; Ochiai, M. What makes rural, traditional, cultures more sustainable? Implications from conservation efforts in mountainous rural communities of Japan. Landsc. Res. 2016, 41, 892–905. [Google Scholar] [CrossRef]
- Statistics Bureau. Japan’s Ministry of Internal Affairs and Communications, Japan Statistical Yearbook. 2017. Available online: http://www.stat.go.jp/english/data/nenkan/66nenkan/1431-02.htm (accessed on 10 January 2018).
- Ministry of Agriculture, Forestry and Fisheries (MAFF). FY2012 Annual Report on Food, Agriculture and Rural Areas in Japan. 2013. Available online: http://www.maff.go.jp/j/wpaper/w_maff/h24/pdf/e_all.pdf (accessed on 10 January 2018).
- Ministry of Agriculture, Forestry and Fishery. Municipality Questionnaire Survey Results on Food Access Problem in Japan. 2017. Available online: http://www.maff.go.jp/j/shokusan/eat/attach/pdf/access_genjo-2.pdf (accessed on 10 January 2018).
- Mori, T. The study about Japanese food desert issues and supply chain. J. Univ. Mark. Distrib. Sci. Bus. Adm. 2013, 26, 103–116. [Google Scholar]
- Asai, H.; Kumagai, M. Effects to measure the non-mobile consumer in mountainous area-The case of Kofu town in Tottori prefecture. AIJ J. Technol. Des. 2014, 20, 269–272. [Google Scholar] [CrossRef]
- Ishikawa, M.; Yokoyama, T.; Nakaya, T.; Fukuda, Y.; Takemi, Y.; Kusama, K.; Yoshiike, N.; Nozue, M.; Yoshiba, K.; Murayama, N. Food accessibility and perceptions of shopping difficulty among elderly people living alone in Japan. J. Nutr. Health Aging 2016, 9, 904–911. [Google Scholar] [CrossRef] [PubMed]
- Renting, H.; Marsden, T.K.; Banks, J. Understanding Alternative Food Networks: Exploring the Role of short Food Supply Chains in Rural Development. Environ. Plan A 2003, 35, 393–411. [Google Scholar] [CrossRef]
- Plieninger, T.; Kohsaka, R.; Bieling, C.; Hashimoto, S.; Kamiyama, C.; Kizos, T.; Penker, M.; Kieninger, P.; Shaw, B.J.; Sioen, G.B.; et al. Fostering biocultural diversity in landscapes through place-based food networks: a “solution scan” of European and Japanese models. Sustain. Sci. 2018, 13, 219–233. [Google Scholar] [CrossRef]
- McLaren, D.; Agyeman, J. Sharing Cities: A Case for Truly Smart and Sustainable Cities; The MIT Press: Cambridge, MA, USA, 2015; p. 445. [Google Scholar]
- Saito, O.; Kamiyama, C. Rural livelihood sustained by ecosystem services from satoyama and satoumi. Environ. Res. Q. 2016, 180, 72–79. [Google Scholar]
- Saito, O.; Havas, J.; Shirai, K.; Kurisu, K.; Aramaki, T.; Hanaki, K. Non-market Food Provisioning Services in Hachijo Island, Japan and their Implications toward Building a Resilient Island. J. Jpn. Soc. Civ. Eng. Ser. G Environ. Res. 2015, 71, 349–357. [Google Scholar] [CrossRef]
Figure 1.
Percentages of food obtained from various sources for the four agricultural area classifications.
Figure 1.
Percentages of food obtained from various sources for the four agricultural area classifications.

Figure 2.
Percentage of sources of purchased food for the four agricultural area classifications.

Figure 3.
Average number of food variety consumed by non-market food provision for each of the four agricultural area classifications.
Figure 3.
Average number of food variety consumed by non-market food provision for each of the four agricultural area classifications.


Table 1.
The criteria for agricultural area classification (AAC) used by this study.
| ACC | The Classification Criteria |
|---|---|
| Mountainous agricultural area | Municipalities with over 80% of forest cover and less than 10% of farmland cover |
| Semi-mountainous agricultural area | All municipalities not fitting the criteria for the other three categories |
| Flat agricultural area | Municipalities with over 20% of farmland cover |
| Urbanized area | Municipalities with over 500 people/km2 and less than 80% of forest cover |
Table 2.
Pearson’s correlation coefficient between non-market food provision percentages and land-use types.
Table 2.
Pearson’s correlation coefficient between non-market food provision percentages and land-use types.
| Non-Market Food Provision Ratio (%) | Land-Use Ratio (%) | ||||||||||||
|---|---|---|---|---|---|---|---|---|---|---|---|---|---|
| Rice and Cereal | Vegetables | Fruits | Fishery Products | Mushrooms | Edible Wild Plants | Meat | Eggs and Dairy Products | Farmlands | Forests | Other Green Spaces | Waters | Built-Up Areas | |
| Non-market food provision ratio (%) | |||||||||||||
| Rice and cereal | 1.000 | ||||||||||||
| Vegetables | 0.488 *** | 1.000 | |||||||||||
| Fruits | 0.353 *** | 0.591 *** | 1.000 | ||||||||||
| Fishery products | 0.212 *** | 0.363 *** | 0.433 *** | 1.000 | |||||||||
| Mushrooms | 0.263 *** | 0.398 *** | 0.434 *** | 0.461 *** | 1.000 | ||||||||
| Edible wild plants | 0.265 *** | 0.450 *** | 0.439 *** | 0.460 *** | 0.624 *** | 1.000 | |||||||
| Meat | 0.223 *** | 0.306 *** | 0.407 *** | 0.515 *** | 0.543 *** | 0.448 *** | 1.000 | ||||||
| Eggs and dairy products | 0.203 *** | 0.295 *** | 0.339 *** | 0.439 *** | 0.479 *** | 0.367 *** | 0.660 *** | 1.000 | |||||
| Land use ratio (%) | |||||||||||||
| Farmlands | 0.211 *** | 0.271 *** | 0.154 *** | 0.027 | 0.062 * | 0.068 ** | 0.039 | 0.057 * | 1.000 | ||||
| Forests | 0.060 ** | 0.150 *** | 0.072 ** | 0.078 ** | 0.119 *** | 0.178 *** | 0.081 ** | 0.016 | −0.118 *** | 1.000 | |||
| Other green spaces | 0.005 | −0.009 | −0.014 | 0.015 | 0.056 * | 0.037 | 0.002 | 0.005 | −0.051 | 0.147 *** | 1.000 | ||
| Waters | −0.002 | −0.020 | −0.008 | 0.089 *** | 0.017 | −0.008 | 0.021 | −0.011 | −0.127 *** | −0.111 *** | −0.006 | 1.000 | |
| Built-up areas | −0.203 *** | −0.306 *** | −0.164 *** | −0.112 *** | −0.145 *** | −0.181 *** | −0.097 *** | −0.051 ** | −0.617 *** | −0.610 *** | −0.169 *** | −0.197 *** | 1.000 |
* p < 0.05, ** p < 0.01, *** p < 0.001.
Table 3.
Pearson’s correlation coefficient between non-market food variety and land-use types.
| The Number of Food Varieties from Non-Market Food Provision | Land-Use Ratio (%) | ||||||||||||
|---|---|---|---|---|---|---|---|---|---|---|---|---|---|
| Rice and Cereal | Vegetables | Fruits | Fishery Products | Mush-Rooms | Edible Wild Plants | Meat | Eggs and Dairy Products | Farm-Lands | Forests | Other Green Spaces | Waters | Built-Up Areas | |
| The number of food variety from non-market food provision | |||||||||||||
| Rice and cereal | 1.000 | ||||||||||||
| Vegetables | 0.160 *** | 1.000 | |||||||||||
| Fruits | 0.409 *** | 0.577 *** | 1.000 | ||||||||||
| Fishery products | 0.397 *** | 0.560 *** | 0.675 *** | 1.000 | |||||||||
| Mushrooms | 0.643 *** | 0.270 *** | 0.516 *** | 0.521 *** | 1.000 | ||||||||
| Edible wild plants | 0.721 *** | 0.342 *** | 0.564 *** | 0.579 *** | 0.841 *** | 1.000 | |||||||
| Meat | 0.739 *** | 0.343 *** | 0.514 *** | 0.707 *** | 0.764 *** | 0.824 *** | 1.000 | ||||||
| Eggs and dairy products | 0.758 *** | 0.295 *** | 0.456 *** | 0.547 *** | 0.798 *** | 0.900 *** | 0.911 *** | 1.000 | |||||
| Land use ratio (%) | |||||||||||||
| Farmlands | −0.050 | 0.089 ** | −0.021 | −0.024 | −0.088 ** | −0.100 *** | −0.010 | −0.045 | 1.000 | ||||
| Forests | 0.037 | 0.013 | 0.020 | 0.006 | 0.046 | 0.086 ** | −0.004 | 0.008 | −0.118 *** | 1.000 | |||
| Other green spaces | −0.024 | −0.026 | 0.061 * | 0.070 * | 0.022 | 0.050 | −0.057 * | −0.052 | −0.051 | 0.147 *** | 1.000 | ||
| Waters | −0.035 | −0.021 | −0.023 | 0.034 | −0.067 * | −0.027 | −0.014 | −0.009 | −0.127 *** | −0.111 *** | −0.006 | 1.000 | |
| Built-up areas | 0.027 | −0.069 * | 0.004 | −0.007 | 0.051 | 0.011 | 0.020 | 0.039 | −0.617 *** | −0.610 *** | −0.169 *** | −0.197 *** | 1.000 |
* p < 0.05, ** p < 0.01, *** p < 0.001.
© 2018 by the authors. Licensee MDPI, Basel, Switzerland. This article is an open access article distributed under the terms and conditions of the Creative Commons Attribution (CC BY) license (http://creativecommons.org/licenses/by/4.0/).
Share and Cite
MDPI and ACS Style
Saito, O.; Kamiyama, C.; Hashimoto, S. Non-Market Food Provision and Sharing in Japan’s Socio-Ecological Production Landscapes. Sustainability 2018, 10, 213. https://0-doi-org.brum.beds.ac.uk/10.3390/su10010213
AMA Style
Saito O, Kamiyama C, Hashimoto S. Non-Market Food Provision and Sharing in Japan’s Socio-Ecological Production Landscapes. Sustainability. 2018; 10(1):213. https://0-doi-org.brum.beds.ac.uk/10.3390/su10010213
Chicago/Turabian StyleSaito, Osamu, Chiho Kamiyama, and Shizuka Hashimoto. 2018. "Non-Market Food Provision and Sharing in Japan’s Socio-Ecological Production Landscapes" Sustainability 10, no. 1: 213. https://0-doi-org.brum.beds.ac.uk/10.3390/su10010213
Note that from the first issue of 2016, this journal uses article numbers instead of page numbers. See further details here.