1. Introduction
At present, China still has a large number of people living in rural areas, so rural settlements are not only currently, but for a long time to come, the main form of living place for the rural population and for food production [
1]. Research on rural residential areas has always been a hot topic for scholars and experts [
2,
3,
4,
5,
6]. Rural residential area is an important form of population agglomeration in China. The development of the rural residential area is an important part of sustainable development in China [
7].
The research on rural settlements has always been a hot spot of Chinese scholars and international experts. The research methods are increasingly diversified and quantified qualitatively [
8,
9,
10]. Typical area of study includes various geomorphic types such as plains, low mountains, and hills and plateau mountains have also been basically covered [
9,
11,
12,
13]. The research scale has been expanded from the national, provincial, and municipal macroscopic scale to the meso-scale of counties, towns, and villages and the micro-scale of administrative villages [
4,
14,
15,
16,
17]. The time span of the study has also changed from single years to multiple years [
18,
19,
20]. In terms of the spatial distribution pattern of rural settlements, scholars have mainly focused on the further exploration and enrichment of spatial research theories [
21,
22], the spatial layout reconstruction of rural settlements [
11,
23,
24,
25], spatial and temporal pattern evolution, and the forecast and optimization of settlement layout [
16]. However, the research on the influencing factors has been relatively slow and has basically remained in using the landscape pattern index to build the index system of evaluation factors and explore the quantitative and qualitative methods of combining influencing factors [
26]. Through a survey of all the research results on rural settlements, it can be found that the research on the spatial layout of rural settlements has been relatively mature, but the current research on the influencing factors of rural settlements is still relatively weak in light of the enlightenment of the research results of the spatio-temporal dynamic comparison of the spatial pattern of rural residential areas [
11,
16,
21]. Based on the absence of studies on the change of influencing factors in rural residential areas in time span, this paper took Lishan Township, Hubei Province, China as the research area. Based on the reflection and inspiration of the results of the spatial-temporal dynamic contrast study on the spatial pattern of rural residential areas, this research focused on the following two aspects:
This paper introduced the spatial regression model and selected five main influencing factors of rural residential areas: elevation, slope, water system, roads, and townships as the evaluation indexes, and quantified the influence degree of these factors.
This paper made a comparative study on the change of the degree of the main influencing factors in rural residential areas in 2009, 2012, and 2015.
2. Data and Methods
2.1. Study Region
Lishan Township is located at 18 km northwest of Suizhou City, Hubei Province, China. It is the residence of the Suixian county government, Suizhou City. The geographical coordinates are longitude 113°12′–113°29′, north latitude 46°′06′–32°31′. The area of Lishan Township is about 237.6 km
2, and the main township area is about 4 km
2. The Handan and Xining railway meet here, so the transportation location advantage is obvious, the water system is rich, and the 316 National Highway passes through the township [
27,
28]. The construction of market townships is featured prominently, and the roads, hydropower, and other infrastructure of market townships have been improved. It is not only the cause of traffic congestion in northwest Hubei Province, but also an important distribution area of agricultural and commercial materials in the northwest of Suizhou City. Lishan Township has a rich history and culture, rich tourism resources, and a combination of cultural and natural landscapes. Currently, it has a total population of about 78,000 and now has jurisdiction over 27 village (residential) committees (
Figure 1 and
Figure 2) [
29].
2.2. Data Sources and Processing
The research data were from the second national land survey database of China. The survey database of land use change in 2009, 2012, and 2015, and the 90 m Digital Elevation Model (DEM) data of Lishan Township were downloaded from the Geo-spatial Data Cloud. First, we extracted data on the rural residential area, water system map (rivers and reservoir), township map, and road map (country road, railway, and highway) of the study area for the three years from the land use change survey database. Then, the slope and elevation of Lishan Township were obtained from the DEM data.
2.3. Methods
2.3.1. Near Analysis and Topographic Index
Near Analysis is a common function in Geographic Information System (GIS) that occurs between two sets. One set is an object of analysis and the other is a set of adjacent objects. The process of analysis is to collect elements for analyzing objects and calculate the nearest distance between them. In this paper, the distance from the rural residential areas to the water system (river, reservoir), township (city, town), and road (railway land, road land, rural road) were analyzed and counted by ArcGIS10.2 software (ESRI, 380 New York Street, Redlands, CA, USA).
The topographic index can reflect the spatial differentiation characteristics of rural settlements affected by terrain factors more objectively and synthetically. The calculation formula is as follows [
30]:
where
T refers to the topographic index;
Ei,
represent the elevation of the
ith rural residential area and the average elevation of all rural residential areas, respectively; and
Si and
represent the slope of the
ith rural residential area and the average slope of all rural residential areas, respectively. The higher the elevation and the higher the slope, the greater the topographic index, and vice versa.
2.3.2. Kernel Density Estimation
The kernel density estimation method is used to estimate the unknown density function based on the distribution characteristics of the research object in probability theory, which can make the distribution probability of the research object more intuitive. The calculation formula of the kernel density estimation method:
where
Fn(
x) is the estimated nuclear density of rural residential areas;
h is the search radius;
k is the nuclear density function;
n is the sample number of rural residential areas; and (
x −
xi) is the estimated distance between two rural residential areas.
The height of the kernel density value indicates the degree of clustering of the research object in space [
31]. The kernel density analysis method can mainly visualize the distribution pattern characteristics of rural residential areas. If the density of the rural residential area is high, the spatial distribution of rural residential area is dense. In other words, the distribution density of rural residential areas can represent its spatial distribution to some extent. Therefore, in the case of considering the location and density attributes of rural residential areas, in this paper, the kernel density estimation value of each rural settlement was taken as the attribute value, and then defined as the explained variable [
32,
33].
2.3.3. Spatial Econometric Regression Model
When spatial auto-correlation exists, errors are not independent of each other, and the traditional Ordinary Least Squares (OLS) regression model is not applicable [
34]. The spatial lag model (SLM) is introduced when the spatial dependence between variables is very high, which results in spatial correlation. When the error between variables causes spatial dependence, that is, when the error of the model is correlated in space, the spatial error model (SEM) is introduced [
35,
36,
37]. The models are given as follows:
(1) Spatial Lag Model (SLM), which can reflect whether each variable has diffusion (overflow effect). Expression:
where
y is the dependent variable;
X is the “
n × k” independent variable matrix (
n is the sample number,
k is the independent variable number);
W is the spatial matrix;
is the spatial lag coefficient;
is the independent variable regression coefficient; and
is the random error term.
(2) Spatial Error Model (SEM), which can reflect whether there is a sequence relationship between error terms. Its expressions are as follows:
where
is the spatial error coefficient;
is the random error obeying the normal distribution; and other parameters have the same meaning as Equation (3).
3. Results and Analysis
The factors influencing the spatial distribution and evolution of rural residential areas are natural factors and social factors. By referring to the existing research results and combining them with the regional uniqueness of Lishan Township, this paper concentrated on five influential factors of rural residential areas: altitude, slope, water system, town, and road. Using spatial analysis and ring buffer analysis tools with ArcGIS10.2, we studied and compared the five influencing factors in the three years consisting of 2009, 2012, and 2015. Then, we introduced the spatial econometric regression model to quantitatively study the effect of the five factors influencing the degree of size change over time by SPASS (SPSS Inc., Chicago, IL, USA), GeoDa (Center for Spatial Data Science Computation Institute, Chicago, IL, USA), and MATLAB (The MathWorks Inc, Natick, Massachusetts, USA).
3.1. Changes in the Rural Residential Areas
The vector data in 2009, 2012, and 2015 of Lishan Township were extracted and statistically analyzed by ArcGIS10.2. There were 874 rural residential areas with a total area of 1280.83 hm2 in 2009. There was a reduction to 861 rural residential areas with an area of 1263.15 hm2 in 2012, which slowly increased back to 876 in 2015 with a total area of 1273.34 hm2. This reflects the development of China’s rural areas over nearly 10 years as well as the change in major social and political factors affecting the scale of China’s rural residential areas. From 2009 to 2015, China’s urbanization process accelerated sharply. Cities developed rapidly and a large number of the rural population migrated into cities, while at the same time, the land administration law system was not perfect. The result was that land resources were wasted in a large number of illegal buildings. Since 2012, with the convention of the 18th National Congress, the idea of “Beautiful Rural Construction” was implemented to reactivate the rural places with fresh and powerful energy. As the rural infrastructure was improved and the ecological environment protected, the rural enterprises thrived and the wave of “Back to Rural” finally started. Meanwhile, the land administration laws were perfected. The rural residential areas had obtained reasonable planning and layout resulting from all the above-mentioned reasons.
3.2. Topography Is of Vital Importance and the “Hydrophilicity” Is Abnormal
With the help of ArcGIS10.2, the altitude and slope data of Lishan Township could be extracted from the DEM data. Then, the natural fracture method was applied for segmentation and Re-classification was used to divide elevation and slope into five levels (
Figure 3 and
Figure 4), where a higher level represented a weaker influence on rural residential areas (the same below). Finally, an extraction analysis tool was adopted to extract the elevation and slope values of the rural residential area patches in 2009, 2012, and 2015, then, the number and area of patches were counted (
Table 1 and
Table 2).
As can be seen from
Table 1 and
Table 2, from 2009 to 2015, nearly 98% of the rural residential areas were located in the low elevation areas of Grades I and II, and the low slope areas of Grades I and II. With the passage of time, the increase and decrease in the number and area of rural residential areas also occurred in the elevation and slope area of Grade I and II, but there were no significant changes in the elevation and slope zone of Grades III, IV, and V. It can be seen that topographic factors have a great influence on the primary layout of rural residential areas and occupy an absolutely important position. However, with the passage of time, the driving force of the evolution of rural settlements was obviously weakened.
Due to the necessity of water resources to human settlement activities, living near water is generally an important choice for the location and development of rural settlements. The water system factors (rivers, reservoir) of natural factors were also divided into five levels by multi-ring buffer analysis of 1 km intervals (
Figure 5,
Table 3).
As can be seen from
Figure 5 and
Table 3, the number of rural settlements, the area, and the proportion of rural settlements in the first class of the 1-km water system decreased from 2009 to 2015, however, the total number and area of rural settlements outside 2 km showed an upward trend. Compared with the traditional “hydrophilic” residential areas, the distribution characteristics of the residential areas were abnormal. The reason is that Lishan Township has a dense water system and a wide range of radiation, which makes it appear that the water system is of “general importance” in the selection of rural residential areas. In addition, there is a large reservoir in the north of Lishan Township, but the northern part is relatively high in elevation and steep in slope, which is not convenient for residential distribution, which greatly reduces the influence of the water system.
3.3. Traffic Access and Town Radiation Influence Increase
The access to roads and the radiation of townships are important factors affecting the distribution of rural settlements. The road network of Lishan Township in 2009, 2012, and 2015 was analyzed by a multi-ring buffer zone with an interval of 1 km, which was divided into five levels (
Figure 6), and the number and area of spots were counted (
Table 4). In the same way, the spaced 2.5-km multi-ring buffer analysis was carried out in Lishan Township, which was divided into five levels (
Figure 7), and the quantity was counted and area was calculated (
Table 5).
From
Figure 6 and
Table 4, from 2009 to 2015, the number and area of rural residential areas in the first-class road buffer zone showed a large increase, the number of map spots increased from 508 to 568, and the area increased from 680.96 hm
2 to 812.68 hm
2. However, the number and area of rural residential areas outside of 1 km showed an overall decreasing trend. As a result, the impact of road accessibility has become more and more important to rural settlements over time, which also reflects that the road network in Lishan Township has become more sound, and rural settlements are becoming more connected to the outside world, which is in line with the actual situation.
According to
Figure 7 and
Table 5, from 2009 to 2015, the number and area of rural residential areas within 2.5 km showed an increasing trend, and the number of population map spots increased from 467 to 597, an increase of nearly 130. The area increased from 689.05 hm
2 to 936.02 hm
2, and the proportion of area increased sharply from 53.80% to 75.51%. However, the number and area of rural residential areas from 2.5 km to 7.5 km decreased. The number and area of settlements in the IV and V regions were basically unchanged. From this, it can be concluded that the main part of the rural residential areas in Regions II and III was concentrated in Region I, and the effect of urban radiation became stronger and stronger.
3.4. Comparison of Influencing Factors Change in 2009, 2012, and 2015
Based on the previous research, we drew lessons from the case study of Ren Ping [
38] and other related research results [
39,
40,
41,
42]. The map of the rural residential area in Lishan Township was integrated into each administrative village, and the average value of the estimated kernel density of the residential area in each administrative village was set as the explained variable, taking the administrative village as the research unit. Taking the average value of the estimated kernel density of the residential area as the first explained variate. Additionally, we used the four influencing factors as other explained variates including the mean value of the topographic index (elevation, slope), and the mean value of the nearest distance from each residential area to the township (built township), water system (river, reservoir), and road (for highway, railway, and country road). All of the above variates were processed by natural logarithmic transformation with SPASS software. According to the model discriminant rule put forward by Anselin [
43], the spatial dependence test and calculation were carried out with the help of GeoDa software. Finally, the spatial error model (SEM) was adopted. The spatial error model was analyzed by spatial econometrics of the MATLAB software platform. The results are shown in
Table 6.
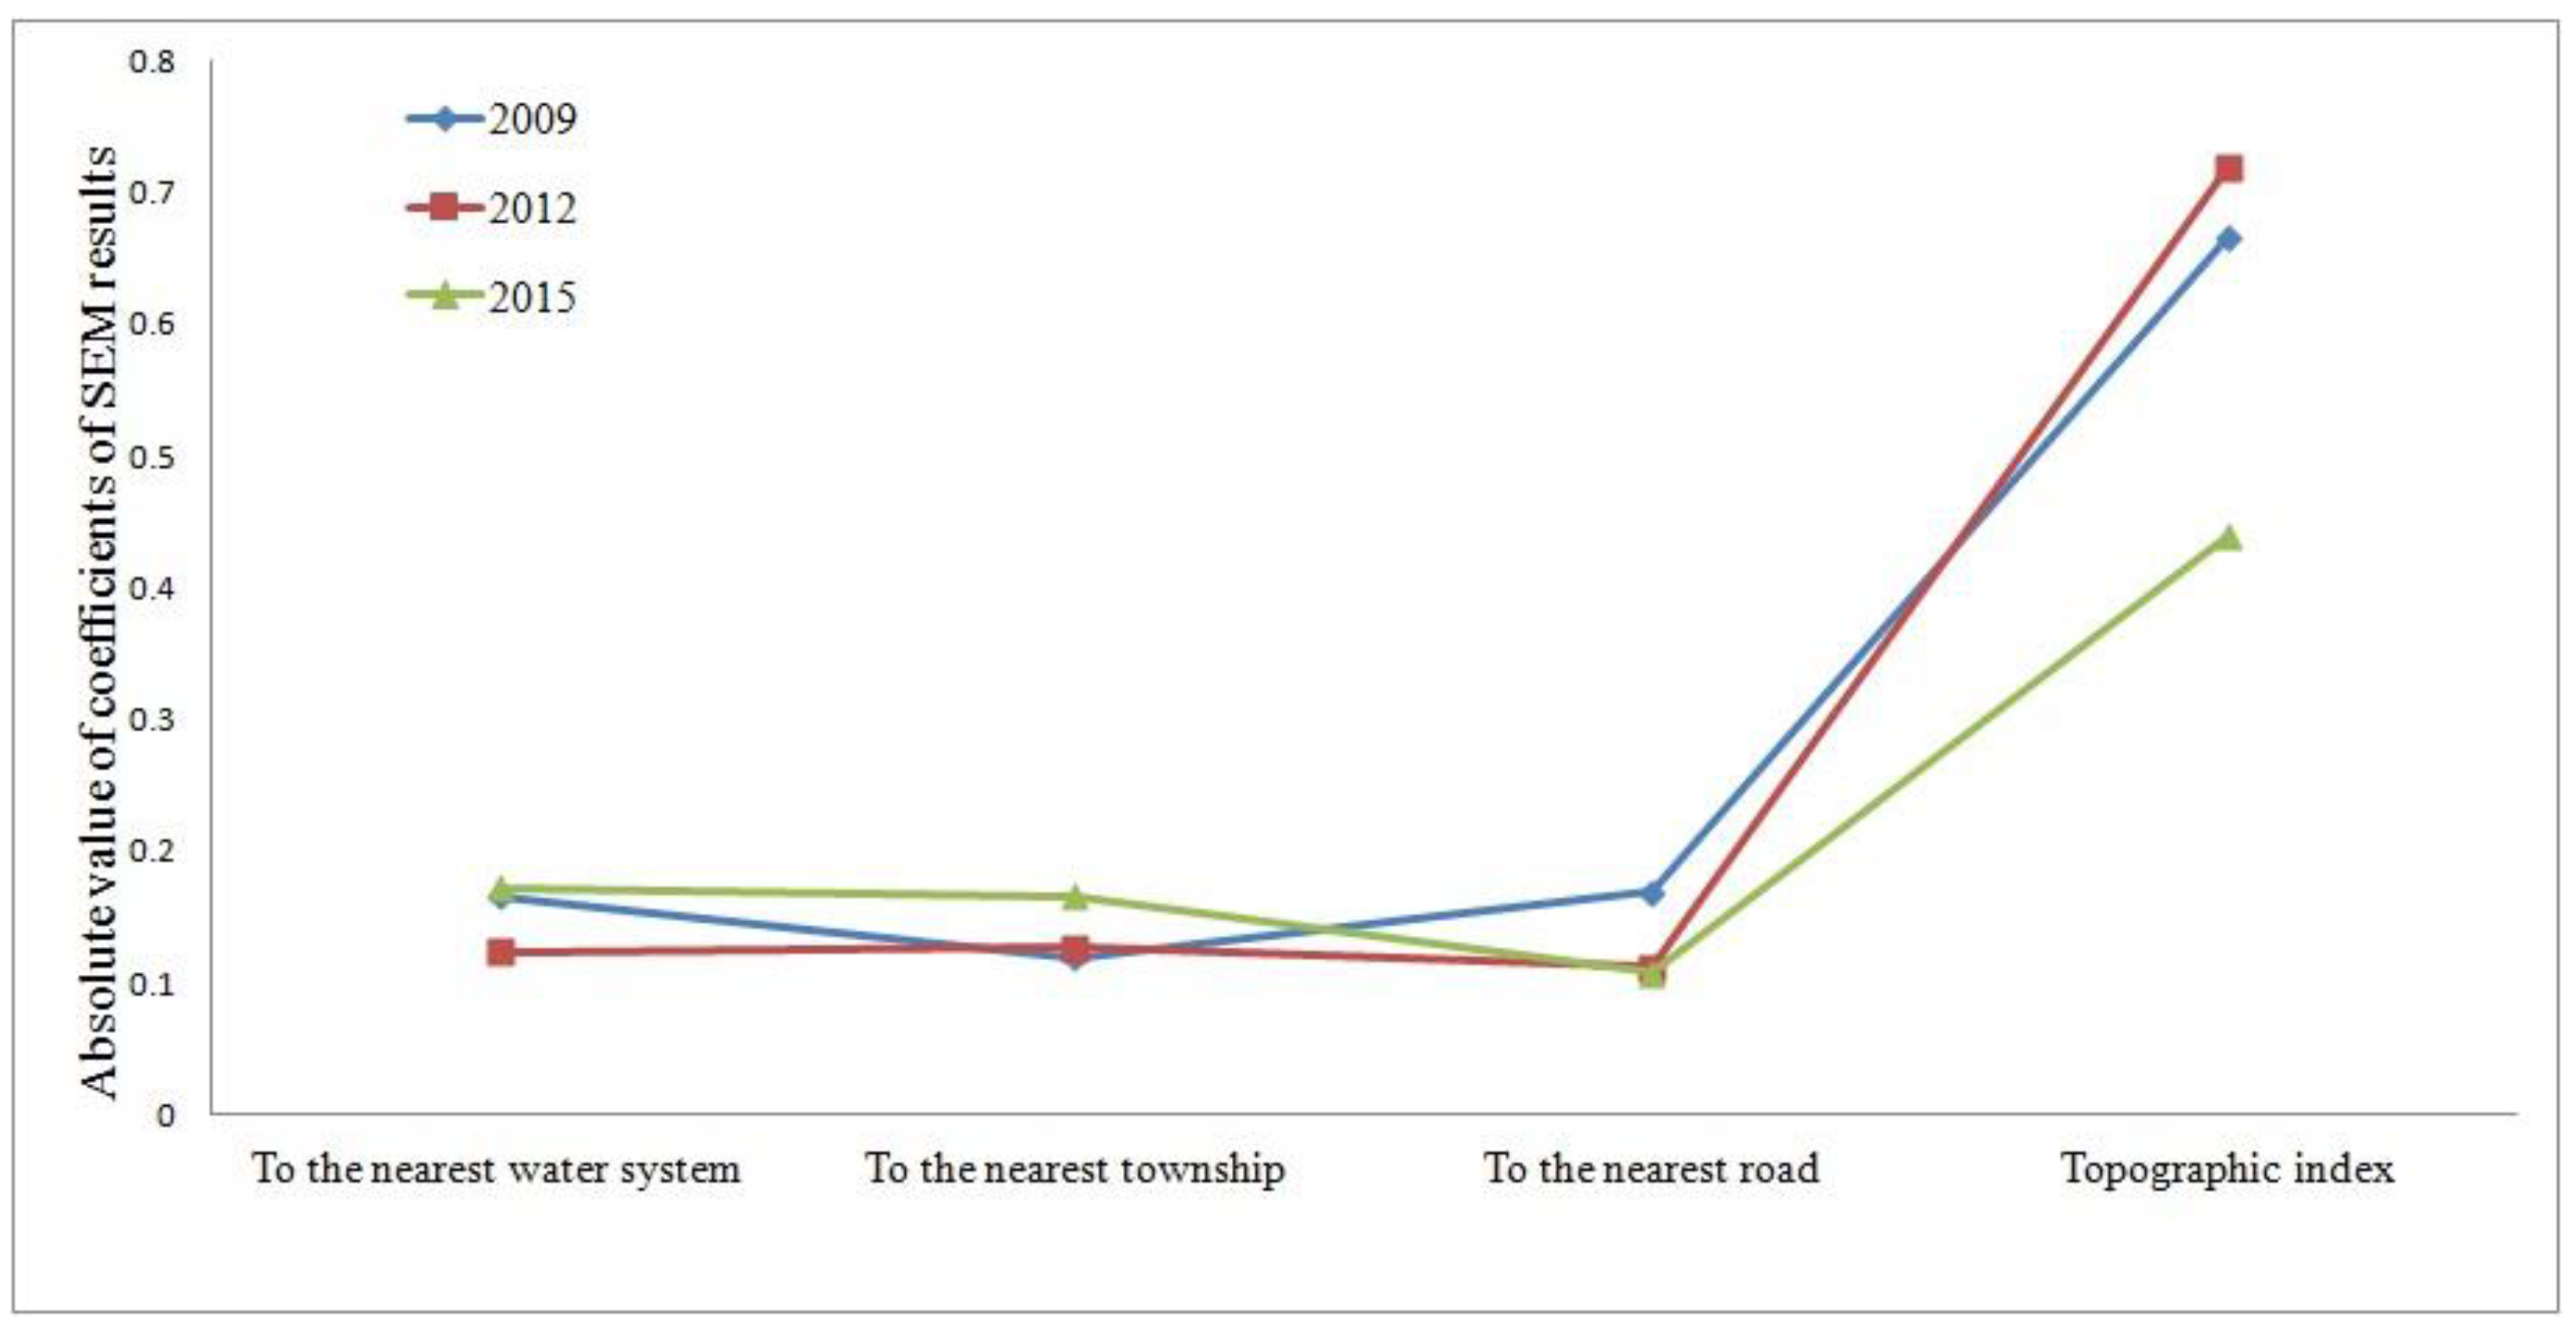
Based on the results of
Table 6, in order to more intuitively see the influence degree of the five factors in this study with time change, the factor coefficient value of the SEM result of three years was selected to make the broken line diagram (
Figure 8). From
Figure 8, according to the absolute values of the regression coefficients of each factor in 2009, 2012, and 2015, the “topographic indices” CTI was the highest, which means that the impact of topography on rural settlements was the most important. The coefficients of Road (CR) became smaller, which means that the impact of roads on rural settlements is waning. On the contrary, the coefficients of Town (CT) became bigger. Finally, the coefficients of Water (CWS) changed in volatility.
4. Discussion
Spatial regression analysis can scientifically show the influence degree of each influencing factor every year. Through this study, using SEM it was found that CRIS > CWS > CR > CT in 2009, CRIS > CT > CWS > CR in 2012 and CRIS > CWS > CT > CR in 2015. In addition, the influence of the roads and the topography decreased while the influence of the town and the water system increased from 2009 to 2015, which was consistent with the facts of Lishan Township. The soundness of the road network made its own radiation range wider, so it connected more settlements, and appeared “more but not precious”, therefore, its influence degree would weaken accordingly. The influence degree of the construction township showed a strong increasing trend with the change of time, indicating that the radiation effect of the rural residential area in Lishan Township was not so important when the original layout was in place, but that rapid urbanization rapidly advanced at the end. The functions of building townships and the medical system of culture, education, and so on were gradually optimized and perfected, and the attraction and radiation effects of rural settlements became stronger and stronger. At first, the influence of the water system was second only to that of topography. However, in the process of urbanization, the humanistic factor took the most important place. However, due to the steady development of the urbanization level, the water system was at a levelling stage. With the needs of modern agricultural production and daily production, the influence of the water system is again rising to an important position.
Spatial analysis and spatial statistics can help us calculate the number and area of rural settlements within each grade of each influencing factor. It can help us clearly know the specific changes of rural settlements over time. From the origin of human history to the present day, the terrain factor (elevation and slope) has been crucial to the choice of human habitation. As another important natural factor affecting the distribution of rural residential areas, living near water has always been an important choice and ideology for the development of human civilization. Water is the necessary for the construction of rural residential areas, agricultural production, and domestic use. Road accessibility is also an important reason for rural settlements. It can not only play a primary role, but also promote secondary development to rural settlements. In addition to considering the importance of natural causes in the primary distribution of rural residential areas, the road has become one of its most important indicators. Township is an important link between the city and the countryside. In order to obtain convenient living services, education, and medical treatment, the influence of the township on the rural residential area is particularly important. These facts are consistent with the results of spatial analysis and spatial statistics in this paper.
To some extent, this study provides a supplement for the analysis of the influencing factors of rural settlements. We not only found the importance of natural factors and humanistic factors, but also saw the degree of change of each influencing factor itself over time. The research results basically achieved the purpose of this paper. However, objectively speaking, there are still limitations that need to be considered, especially in the aspect of combining the characteristics of the spatial distribution changes of rural settlements. Moreover, it is necessary to consider the influencing factors of rural settlements under different types of topographic features, which will enrich the research conclusions.
5. Conclusions
Based on the spatial analysis and statistics, elevation and slope have always played a decisive role in the distribution of rural settlements. The characteristics of the “hydrophilicity” of rural residents in Lishan Township were abnormal. The influence of the water system was unstable to rural settlements. As social factors, roads, and towns played an increasingly important role in the development and evolution of rural settlements in Lishan Township. All of these were in accordance with the reality of social development.
Spatial regression analysis of the influencing factors in Lishan Township showed that the five influencing factors selected in this study all had a significant influence on the rural residential areas in Lishan Township in 2009, 2012, and 2015. Among them, the influence of elevation and slope remained the biggest. Moreover, the influence of the road always decreased, while the influence of towns kept increasing with time. The influence of water systems was characterized by increased volatility and the topography showed the opposite. These characteristics were in line with the actual development of Lishan Township.
The changing characteristics of the influencing factors of rural settlements in Lishan Township can represent a part of China’s rural areas, but are far from the whole. In order to realize the sustainable development of China’s rural areas, it is necessary to further study the changing characteristics of the influencing factors of rural settlements, which requires the study of more typical topographic areas and typical rural areas in China. In this way, we can better provide good decision-making guidance for rural revitalization in China.

 ,
, 


