1. Introduction
In recent years, a large number of policies have been approved throughout the world with the aim of encouraging the use of energy from renewable sources (REs henceforth). One reason for this is the need to reduce emissions of pollutant gases [
1], an objective initially pursued with the approval of the Kyoto Protocol in 1998, which committed the main industrialized countries to reduction of what are called greenhouse gases. More specifically, in the European framework, this fact was reinforced by the approval in 2001 of Directive 2001/77/EC, updated by Directive 2009/28/EC, creating a common framework in the promotion of RE for countries belonging to the European Union. According to Dusonchet and Telaretti [
2] (p. 3297), the most recent update of this directive had the following aims (‘…targets are based on a flat rate increase in the share of renewables weighted by GDP and modulated to take account of earlier development of these resources’ [
1]): ‘the reduction of at least 20% of greenhouse gases, from 1990; the production from Renewable Energy Sources (RES) of 20% of internal energy consumption; and the use of biofuels to cover at least 10% of the energy consumption for transport.’
Another reason is that encouragement of RE would allow dependence on fossil fuels from other countries to be reduced [
1]. Along these lines, Lesser and Su [
3] go further, declaring that policies aimed at this objective would not only allow a reduction in energy dependence but would also contribute towards creating a much more diversified energy mix as well as reducing exposure to fuel price fluctuations. Furthermore, REs also allow increased innovation and the development of industrial capabilities, as well as benefits for the regional and national economy [
4].
The types of policies intended to encourage REs are highly diverse (
Table 1). Their aim being to enable reduction in the costs of technologies allowing this type of energy to be obtained and to facilitate their greater market penetration [
5], each having strengths for producers of this kind of energy and society in general, and also showing weaknesses depending on how they are incorporated in each country [
6].
However despite the existence of different types of policy, feed-in tariff (FIT) systems are the most common tool in REs promotion in Europe; specifically, for the specific period between 2000 and 2012, the number of European countries applying FITs was increased, from 9–24 [
8]. Furthermore, these policies are an effective mechanism for the REs development; in this line, Haas et al. [
7] hold that compared with regions using tradable green certificates or other incentives, countries using FITs as a means of developing renewable energies obtain greater efficiency. On the other hand, these policies induce innovation on more costly energy technologies, such as solar power [
5].
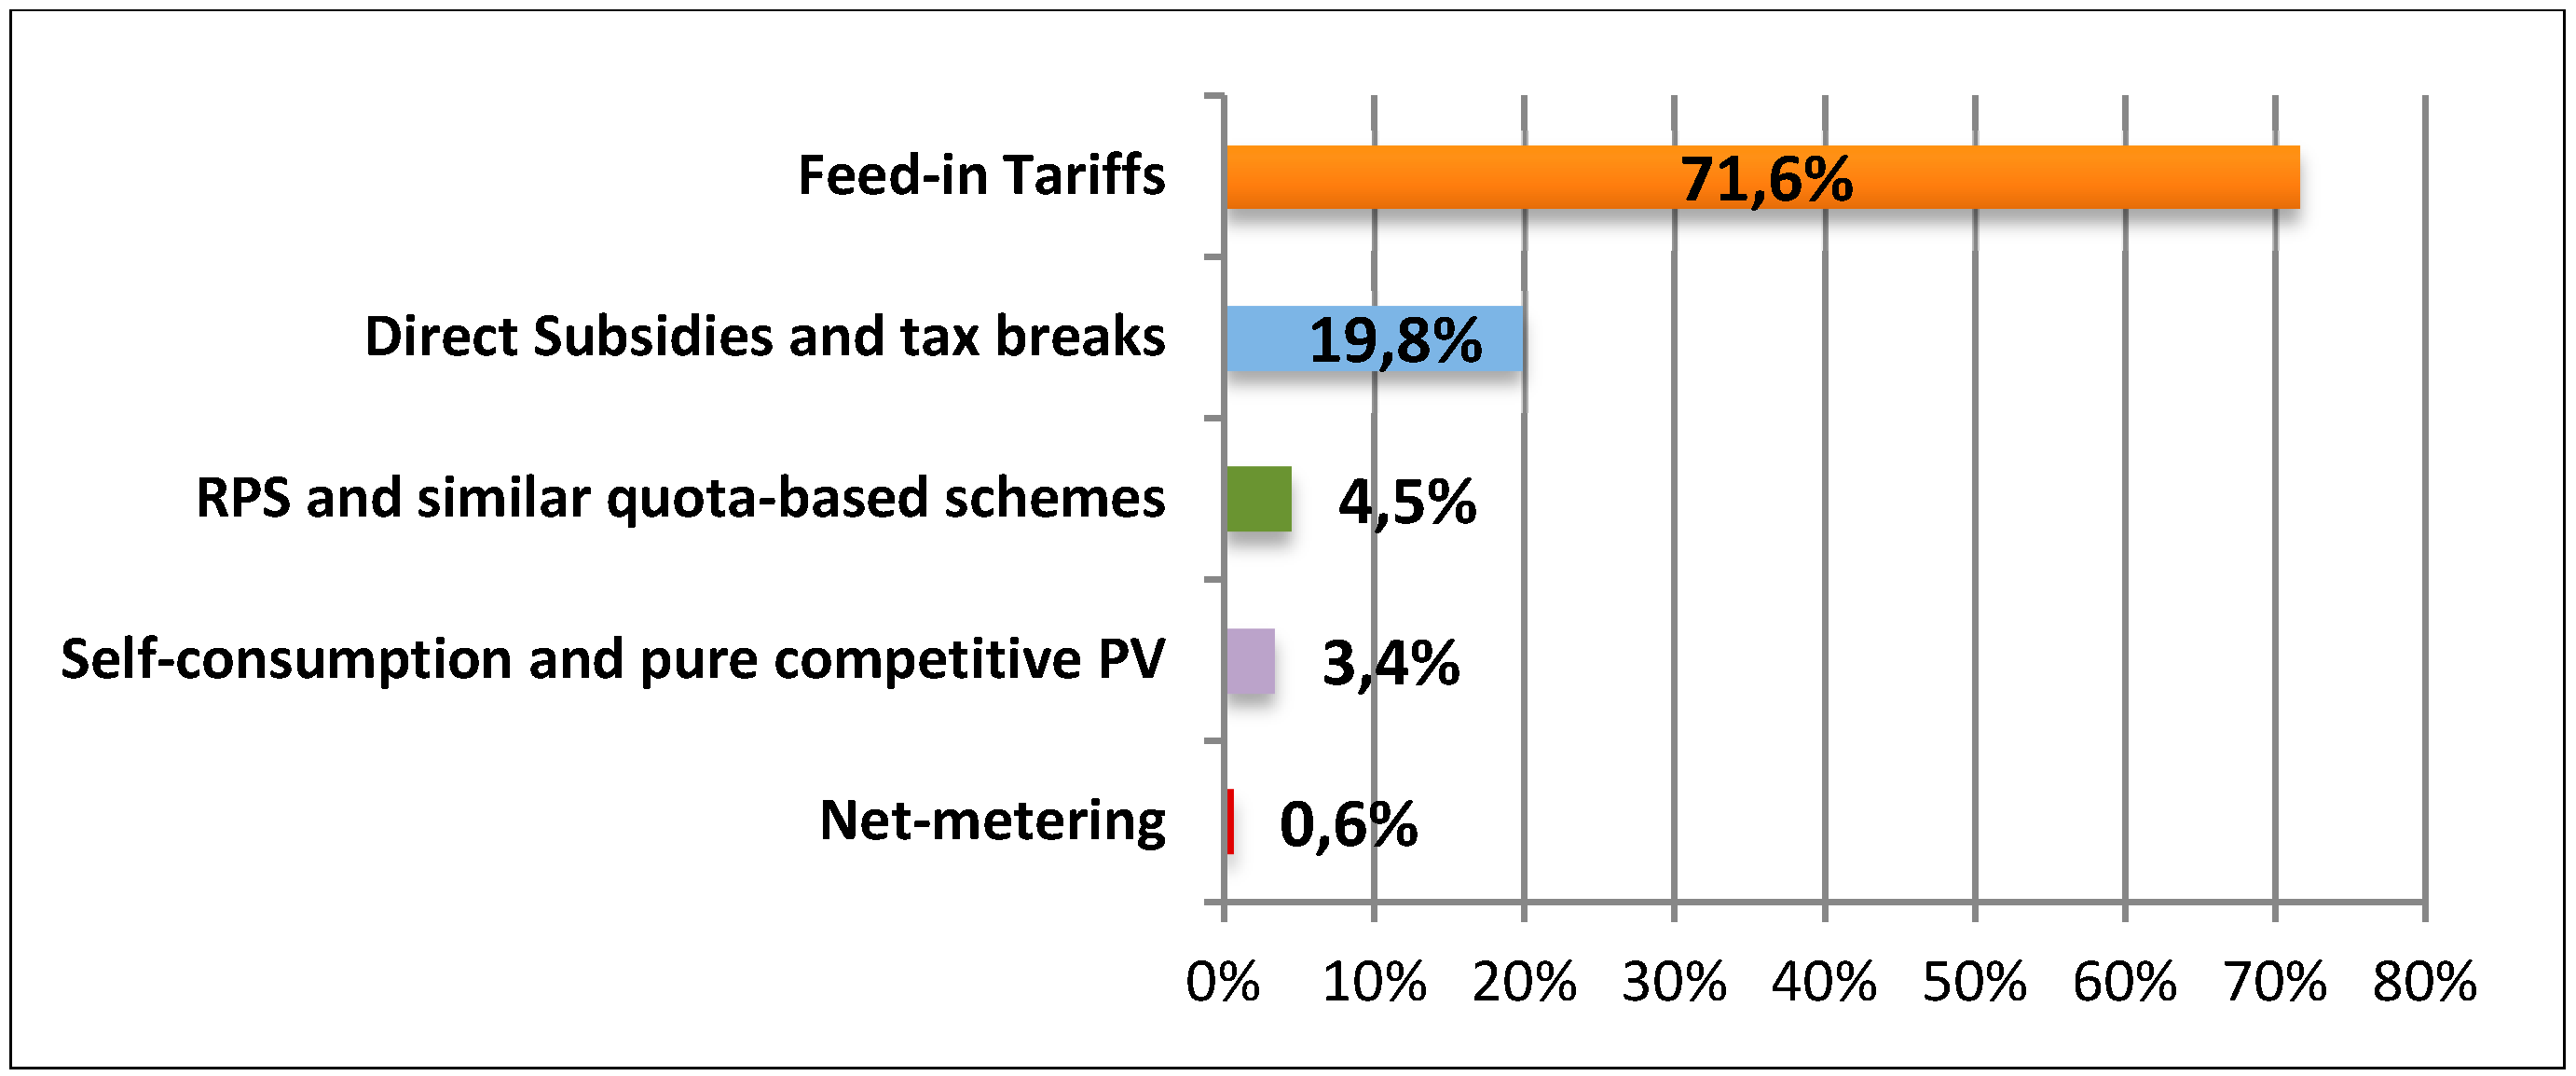
With reference to the importance of the FITs in the development of photovoltaic solar energy, besides producing a significant development of REs in general, FITs have been the policy most used to promote photovoltaic energy in Europe. According to the report published by the IEA [
9], these policies represent 61% of the total subsidies dedicated to photovoltaic in 2012 (
Figure 1), with a proportion in historical terms of 72% up to that year (
Figure 2). Also, FITs have been the first policy employed in the development of this type of energy [
6,
10,
11].
Moreover, these policies have contributed to significant growth of photovoltaic energy in recent years. Thus, Ragwitz et al. [
8] argue that these policies have allowed important growth in photovoltaic plants, the leading players being Germany and Spain, also facilitating the development of previously unimportant markets such as Italy, France, Portugal, the Czech Republic and Slovenia, and more recently the United Kingdom. In addition, some authors [
3,
12] hold that FITs are the most effective policies for the production of this type of energy, so enabling photovoltaic technology to have reached a constant learning rate [
13]. Furthermore, Campoccia et al. [
6] hold that currently, the photovoltaic market has a great potential in the contribution of REs to energy production (
Table 2); specifically the data provided by the EPIA’s 2014 report [
14] show how photovoltaic energy had over 10 GW connected to the grid at the end of 2013, contributing approximately 3% of European energy demand.
Regarding the types of FITs systems, in general, they can be classified as a fixed FITs and premium FITs, independent or not, respectively, of electricity market prices. Each type of policy has various advantages and disadvantages (see Couture et al. [
15] for further analysis). However, fixed FITs have been the policy preferred by European countries to support REs compared with premium FITs [
15], although Ragwitz et al. [
8] assert that the use of the latter has notably increased in recent years (Czech Republic, Denmark, Estonia, Finland, Germany, Italy, the Netherlands, Slovakia, Slovenia and Spain), whether as the main modality or in combination with other policies (Czech Republic, Germany, Slovenia and Spain).
Fixed FITs guarantee payment of a particular tariff, the value of which is independent of the electricity market price, generally out of it, for a particular period (about 20 years). As a consequence of this advantage, they make investors feel much more secure [
3,
16,
17] because they reduce the risks associated with these investments [
18,
19], by giving stable cash flows in the future [
20]. In addition, more targeted subsidies, such as FITs, are needed to induce innovation on more costly energy technologies, such as solar power [
5]. More specifically, García-Álvarez et al. [
21] analyze the success of these incentives for German and Spanish markets, finding that in both markets FITs enables essential development of REs, causing the increased employment, RDI and GDP, as well as reduced emission of pollutant gases. The essential stability to these incentives has allowed the creation of many jobs and economic opportunities in new sectors [
22].
However, some of these policies’ inherent disadvantages have also been shown. On the one hand, the fact that these tariffs are maintained for long periods of time may affect system costs, making them too high [
23,
24]. Along with this line, Lesser and Su [
3] maintain that this could cause tariffs to deviate from market prices and, if high, could increase electricity prices, while if they were low, would not achieve the objectives set. On the other hand, the study carried out by Dusonchet, and Telaretti [
2] shows how the effectiveness associated with FITs may be limited because sometimes the tariffs are established for short periods of time or the procedures required by the administration are too restrictive.
Ayoub and Yuji [
16] (p. 194) list the main reasons explaining the success of FITs policies: ‘FIT offers long-term security for investors through guaranteed and fixed tariffs for a long periods on a relatively high level (high price per kilowatt hour); the existence of well-built financial subsidy programs; regional investments towards economic and social welfare; technology-specific and location dependent differentiation; stable governmental regulations.’
Premium FITs are those which depend on electricity market prices, guaranteeing a premium (fixed or variable) or overprice above-market prices for renewable energy producers. According to Couture et al. [
15], the value of the premium established for these FITs is established so that either (i) environmental and/social costs in renewable energy production or (ii) the costs associated with energy generation by renewable means are taken into account.
The most significant advantage of these incentives is their market orientation [
15], because part of the total remuneration obtained by renewable energy generators is the price of electricity on the market [
21]; in fact, premium FITs allow the distortions occurring on the electricity market to be reduced, so this modality is preferable to fixed FITs [
1]. Additionally, Couture and Cagnon [
19] (p. 964) point out that while FITs allow a reduction in investment risk, premium FITs provide an incentive for energy production at times when it is most needed, ‘which alleviate peak supply pressures and improve the market integration of RE sources.’ In addition, linking the premium obtained to electricity market prices prevents producers from making extraordinary profits [
21], which in turn allows system costs not to be increased unnecessarily. Furthermore, the use of premium FITs would be more suitable for less mature technologies, according to the conclusions of the study carried out by Canton and Johannesson [
1]. In addition, in the future, this measure could contribute towards improving integration of renewable energies in the electricity market, an increase in the use of this system being observed precisely in recent years [
8].
With regard to the disadvantage of the use of premiums, the first is that because of exposure to the fluctuations of market prices increases the risks related to the investment [
21]. In addition, there being no guarantee of virtuous also increases these risks [
15]. However, compared with market price dependent premium FITs, FITs give investors greater security in terms of the investment [
17,
19], mainly because of minimization of the risks associated with the investment and the certainty with regard to the cash flow generated [
19]. However, being a less efficient system regarding costs, it causes costs per kWh produced to be higher on average than those of FITs [
15].
Given this scenario, FITs monitoring is necessary. These support measures require continuous supervision by governments so that they can be adapted correctly in a way that ensures the efficiency of this system and consequently uncontrolled growth of it can be avoided [
2]. So ‘well-managed FITs have proven effective in stimulating deployment while providing fair but not excessive remuneration to investors (…)’ [
25]. Haas et al. [
7], analyzing the different types of policy for stimulation of RE in the European regions, found that good design of these policies does allow development of RE with few implications for society in terms of costs. In addition, they declare that compared with those regions which use tradable green certificates or other incentives, the country is using FITs as an RE development measure of obtaining greater efficacy. Lesser and Su [
3] hold that economically efficient FITs would allow renewable energy producers to maximize their production without affecting electricity market prices. Following this argument, Ragwitz et al. [
8] indicate that FITs are effective as well as efficient in terms of costs as long as they are well designed, indicating that the best elements put into practice to control this aspect include measures such as gradual tariff reduction (with degressive feed-in tariffs that anticipate technical progress, the profits resulting from technical progress can be shared out more equitably by reducing the total cost borne by the community while granting a certain surplus to producers [
26].), the establishment of quotas, use of a staggered tariff or net-metering. Through this last system, producers of renewable energy for self-consumption can discharge the excess energy they do not need into the electricity network, energy demand greater than that generated by the system in question being compensated for in subsequent electricity bills.
However, in some cases, the wrong design of these policies coupled with unwise revising them has led to the adoption of damaging measures to the photovoltaic sector, in some cases clearly retroactive. The report of the EPIA [
27] gives details of how measures have been put into practice in certain European countries, including Italy, France and Spain, which are damaging to the photovoltaic market some of these measures being retroactive, moratoria, and unexpected reductions in levels of aid to this sector, causing cancellation of new plant construction projects, as well as investors’ insecurity and the loss of numerous jobs.
Regarding the current state of the research field, many authors [
2,
28,
29,
30] have analyzed the profitability of photovoltaic installations in different policy scenarios and with different economic and financing conditions, through well-known methods such as net present value (NPV) and internal rate of return (IRR). However, it only found the study carried out by Jaraité and Kazukauskas [
31] that more examines explicitly the profitability of electricity sector companies, regardless of the technology used, in markets applying tradable green certificates compared with those applying FITs, for the period 2002–2010.
With reference to the purpose of the work and its significance, this study contributes to enlarging the existing literature, because it is concentrated exclusively on photovoltaic companies in the way of allowing the influence of FITs on their economic profitability (ROI) to be analyzed in greater detail, this influence is expected to be positive, as is deduced from the aforementioned literature, also taking the characteristics of each of the companies comprising the sample into account.
On the other hand, the countries examined are those which are most representative of the European photovoltaic market: Germany, Italy, Spain and France; moreover, these countries have already been the subject of study in numerous studies because of their great importance in the context of the European photovoltaic market. In addition, this study has been conducted for the period 2008–2012. Those four regions and the period studied have been selected for the following reasons: (a) These four countries had high growth rates in this period in terms of installed photovoltaic power (
Table 3), with accumulated capacities at the end of 2012 of 35.7, 17.9, 5.3 and 4.7 GW, respectively, which means shares of each market in the total accumulated photovoltaic power in Europe of 46.06, 23.42, 7.42 and 5.77% for the same year (
Table 4). Also, subsequent reductions in the photovoltaic market occurred because of important cuts made to FITs; (b) FITs systems have been the prevailing policy in each of these countries for the promotion of photovoltaic solar energy (see Winkel et al., [
32] for a more detailed analysis), contributing to a substantial growth in this type of renewable energy, as we have already explained.
3. Results
After estimating the linear panel data model presented in
Section 2.1, in this section, we show the results obtained for the fixed effects and the random effects models (
Table 12 and
Table 13).
In the fixed effect model estimation (
Table 12), the F test shows that the Prob > F is lower than 0.05 (Prob > F = 0.000). Therefore, all the coefficients in the model are different from zero, what justifies an analysis taking into consideration the individual effects, using panel data.
The three variables omitted in the fixed effects model estimation, AGE, SECACT, and COUNTRY dummies are variables which do not vary over time; they are constant for each company. These time-invariant characteristics of the individuals are perfectly collinear with the companies in the sample.
In order to detect possible multicollinearity problems, we applied an ex-post and an ex-ante method. The first one consisted of calculating the correlation matrix for all variables in the study, and it showed that this correlation is not very high (<0.55). The ex-post method applied to detect multicollinearity consisted of testing for the variance inflation factors (VIF). This test also showed the absence of multicollinearity problems (mean VIF: 1.20).
In the random effects model estimation (
Table 13), the test (F) to see whether all the model coefficients are different from zero indicates that the model is useful because Prob > chi2 < 0.05 (0.0000).
Both regressions (
Table 12 and
Table 13) show that the main explanatory variable FIT is positive and significant. This result confirms our initial hypothesis, based on previous literature, that these incentives have positively influenced the profitability of photovoltaic companies. The coefficients of the regressors indicate how much the dependent variable in the models (ROI) changes when the explanatory variable increases by one unit.
In addition, all the variables characterizing photovoltaic companies, ASSETS, LIQUIDITY and LEVERAGE, are also positive and significant in both models. Firstly the positive relationship between return on investment and total assets suggests that larger companies may take advantage of the economies of scale generated and, consequently, obtain greater profits [
31,
36]. As to the positive relationship between liquidity ratio and return on investment, this indicates that the greater ability of companies with higher liquidity to take out loans with financial institutions and conduct investment projects [
31] makes them more profitable. Regarding leverage, contrary to expectations, its positive relationship with ROI suggests that companies more able to borrow funds for investing in PV technology, and so with a higher level of debt, are those with most return on investment in the period analyzed.
The variables AGE and dummy COUNTRY 1, Germany—time-invariant variables omitted in the fixed-effects model estimation—are positive and significant in the random model. One explanation for this, based on previous literature, is that companies with longer experience have fewer restrictions on borrowing capacity, and so their ability to invest is higher, increasing their profitability. Regarding the variable COUNTRY 1, a dummy equal to 1 if the company belongs to Germany and zero otherwise, its positive relationship with ROI shows that German PV companies are generally more profitable for the period 2001–2012.
The other variables, SECACT and other dummy COUNTRY, are not significant in any model. It was expected that PV companies with a secondary activity would see an increase in profitability with the diversification of their business to reduce the risk of photovoltaic market saturation, and consequently would avoid any negative impact on profitability. Yet this variable is not significant in any model.
Time-constant variables were omitted in the fixed effects model because they are collinear with the companies. Indeed, fixed effects models cannot be used to investigate time-invariant causes of the dependent variable. Nevertheless, although these variables have been included in the random effects model, as shown in
Table 13, most of them are not significant. Given this fact, we decided to base the selection of one of these models on the Haussmann test results. According to the Hausman test, the null hypothesis not being rejected, the use of a fixed effects model was more appropriate. The results for this test (Prob > chi2 = 0.0003) showed we should eventually choose the fixed effects model (
Table 14).
After the Haussmann test, we perform a modified Wald test for groupwise heteroscedasticity in the fixed effect model, implemented in Stata by Christopher Baum [
37]. The results (p < 0.05) indicate that we must reject the null hypothesis of homoscedasticity.
We also need to test for serial correlation which is very likely to appear in an individual-effects model. We use a test for serial correlation in the idiosyncratic errors of a linear panel-data model implemented by David Drukker [
37]. The probability obtained for our fixed effect model is 0.0616 (Ho: no first-order autocorrelation; F (1, 245) = 3.527; Prob > F = 0.0616). Therefore, at a 5% level of significance, we have enough statistical evidence for not to reject the null hypothesis. This indicates that the errors are not auto correlated.
In order to face the identified heteroscedasticity problem in our fixed-effect model to avoid biased statistical results, we run a fixed-effects (within) regression with Driscoll and Kraay standard errors [
37] (
Table 15).
The resulted econometric model, showed below, confirms the positive correlation between the feed-in tariff, the main treatment variable, and the ROI. The explanatory variables included in the model as control ones, the level of assets and the level of leverage, remain significant and positively correlated with the ROI.
4. Discussion
Extensive previous literature shows how FITs policies have been fundamental and effective in the development of renewable energies in Europe. To concentrate on the photovoltaic sector, FITs have allowed an extraordinary growth in the installed photovoltaic power in European countries. Numerous authors have published studies dealing with the effect of these policies on the profitability of production facilities of this type of energy, although previous empirical studies analyzing their effect on the profitability of companies dedicated to photovoltaic production have not been found. For this reason, the objective of our study was to analyze the influence of FITs on the financial profitability of the companies carrying out their activity in the four most representative photovoltaic markets (Germany, Italy, France and Spain), more specifically in the period 2008–2012.
To achieve our objective, a static linear panel data model was applied. Both, the fixed and the random effects models were estimated, and the Hausman test confirmed the suitability of the first one. The variables considered were the average FIT for each country and year, and variables describing different characteristics of the companies.
The fixed effects model’s results confirm the positive, significant influence of FITs policies on the profitability of photovoltaic companies, which had been deduced from a prior review of the existing literature. With regard to the company variables, total assets and leverage turned out to be determinant in explanation of ROI.
Since the introduction of the first FITs in Germany in the early 21st century, FITs have been introduced in many other countries to give certainty to investors regarding the return on their investment and to promote photovoltaic energy generation. Increasing this renewable source of energy generation would reduce greenhouse gas emissions, a major objective for countries worldwide.
Table 7 shows that Germany is the country in the sample with the highest level of CO
2 emissions and also with the highest PV capacity.
During the study period (2008–2012), PV technology was far more expensive than today, especially in countries such as Spain, given the lack of experience and the need for research and development. The main problem in this country was the sudden drop in the feed-in tariff, which in some cases led to major problems in paying off investors’ financial debts. But currently it is possible to get an appropriate return on investment in PV energy generation despite the fall in the FIT per kWh, because the cost of the technology installed has also fallen.
Regarding the policy implications of these incentives, Cointe and Nadaï [
38] analyze the historical trajectory of FITs as an instrument for the promotion of renewable energy in Europe. They look at the emergence and transformations of FITs as part of the policy arsenal developed to encourage the creation of markets for such energy. In our opinion, there is a mismatch between EU energy policy and liberalization as a key aim in the EU, and Member States’ interests and ways of regulating incentives for renewable energy generation. Accordingly we agree with the conclusion of [
38] that there are two interwoven storylines: that of the European Commission’s perspective on renewable energy policy, and that of the actual, more bottom-up emergence and evolution of FITs in Member States. They also highlight the intersection between environmental objectives, technological change and the ambition to liberalize the internal electricity market.
The variables in our study positively influencing ROI from 2008 to 2012, i.e., FITs, size (level of assets), and level of leverage, were the same ones which, shortly afterwards, led to problems for investors due to inappropriate government planning and policymaking. Companies with more experience were less affected by the sudden cuts in some countries.
With better policymaking, it would have been possible to avoid the problems detected in some countries, such as uncontrolled growth of PV installations or increase in electrical system costs [
2,
25].
Finally, with regard to future research, firstly, the possible continuation of profitability could be analyzed using a dynamic model. Secondly, the existing empirical literature could be enlarged upon by analyzing the factors determining the adoption of FIT policies, and which might contribute to efficient or optimum policy design.


