Article

Postseismic Restoration of the Ecological Environment in the Wenchuan Region Using Satellite Data

1
State Key Laboratory of Remote Sensing Science, Institute of Remote Sensing and Digital Earth of Chinese Academy of Sciences, Beijing 100101, China
2
College of Resource and Environment, University of Chinese Academy of Sciences, Beijing 100094, China
3
School of Life and Environmental Sciences, Schmid College of Science and Technology, Chapman University, Orange, CA 92866, USA
*
Authors to whom correspondence should be addressed.
Sustainability 2018, 10(11), 3990; https://0-doi-org.brum.beds.ac.uk/10.3390/su10113990
Submission received: 9 October 2018 / Revised: 25 October 2018 / Accepted: 25 October 2018 / Published: 1 November 2018

Abstract

:
Using Landsat remote-sensing data combined with geological information extracted from ALOS and Sentinel-1A radar data, the ecological environment was evaluated in the years 2007, 2008, 2013, and 2017 through gray correlation analysis on the basis of the construction of the pressure-state-response model. The main objective of this research was to assess the ecological environment changes in Wenchuan County before and after the earthquake, and to provide reference for future social development and policy implementation. The grading map of the ecological environment was obtained for every year, and the ecological restoration status of Wenchuan County after the earthquake was evaluated. The results showed that the maximum area cover at a “safe” ecological level was over 46.4% in 2007. After the 2008 earthquake, the proportion of “unsafe” and “very unsafe” ecological levels was 40.0%, especially around the Lancang River and the western mountain area in Wenchuan County. After five years of restoration, ecological conditions were improved, up to 48.0% in the region. The areas at “critically safe” and above recovered to 85.5% in 2017 within nine years after the deadly Wenchuan earthquake of May 12, 2008. In this paper, we discuss the results of detailed analysis of ecological improvements and correlation with the degrees of pressure, state, and response layers of the Pressure-State-Response (PSR) model.

1. Introduction

With the rapid development of social economy and the continuous improvement of living standards, the problem of the destruction of the ecological environment is becoming increasingly serious. Now, with improving environmental awareness, ecological assessment has received global attention, and in our country in particular [1]. Ecological security is an indispensable part of the national and social stability, and it is also a key factor in maintaining sustainable socioeconomic development [2]. The current state of ecological conditions and the knowledge of various sources influencing these conditions are important in evaluating future scenarios and their better management.
In recent years, efforts have been made to evaluate the ecological environment of almost every country in numerous ecological setups, for example, cities, lands, coastal areas, and river basins. Liao et al. [3] proposed an evaluation index system of karst-mountain ecological security from three resource aspects and ecological environmental pressure, resources, and ecological environmental qualities, as well as the capacity for environmental protection and ecological construction. Zhang et al. [4] have discussed the dynamic changes in the landscape pattern and ecological security of the Ebinur Lake basin in the past 10 years. Dong et al. [5] constructed the ecological safety assessment system of Shuifeng Lake from the four aspects of socioeconomic impact, water ecological health, ecological service functions, and regulatory management based on the Driving-Force-Pressure-State-Impact-Response (DPSIR) model.
Combined remote-sensing and GIS technologies are being widely used in the monitoring, mapping, and better managament of ecological environments. Zuo et al. [6] proposed a method of ecological safety assessment from a pixel scale to a small watershed or county scale using remote-sensing data and related models. Shao et al. [7] carried out a comprehensive evaluation of the ecoenvironmental quality of the resource-based city of Panzhihua from five aspects, biological abundance, vegetation coverage, water density, land degradation, and pollution load based on multisource remote-sensing data, statistical data, and GIS technical support. Cabello et al. [8] used a satellite remote-sensing technique to investigate the ecological functions of a protected area and found remote-sensing to be an important and effective tool.
The Wenchuan earthquake was a highly destructive earthquake in Chinese history, killing thousands of people, damaging buildings, causing widespread landslides, floods [9], and epidemic outbreaks [10,11], seriously affecting the ecological environment of Wenchuan County. Remote sensing and GIS tools were extensively used after this deadly event (Cao et al. [11]; Guo et al. [12]; Xu et al. [13]) to evaluate the quality of the ecological environment in the affected areas. Hu [14] evaluated and analyzed the ecological environmental quality of Wenchuan before and after the earthquake, and prepared a spatial distribution map of ecological damage. Wang [15] carried out analysis of the landslides and collapse of buildings in Yinxing Town using 3S technology.
A number of evaluation models and methods have been developed for ecological evaluations, such as analytic hierarchy process, artificial neural networks, cellular automata [16], panel data-cluster analysis [17], matter element analysis [18], and ecological footprint models [19]. These methods have their own advantages and disadvantages, some of which are difficult to implement, such as neural-network methods; others are too subjective in determining the weight of indicators, such as the analytic hierarchy process. The gray-relation method is an analysis method in gray system theory that measures the degree of correlation between factors based on similarity or dissimilarity. Gray-correlation analysis does not require sample size, or the typical distribution law. It is a relatively simple and reliable analysis method in system analysis [20]. At the same time, since entropy reflects the relative importance of indicators according to their objective information, it can avoid the subjectivity of weight determination compared with the analytic hierarchy process.
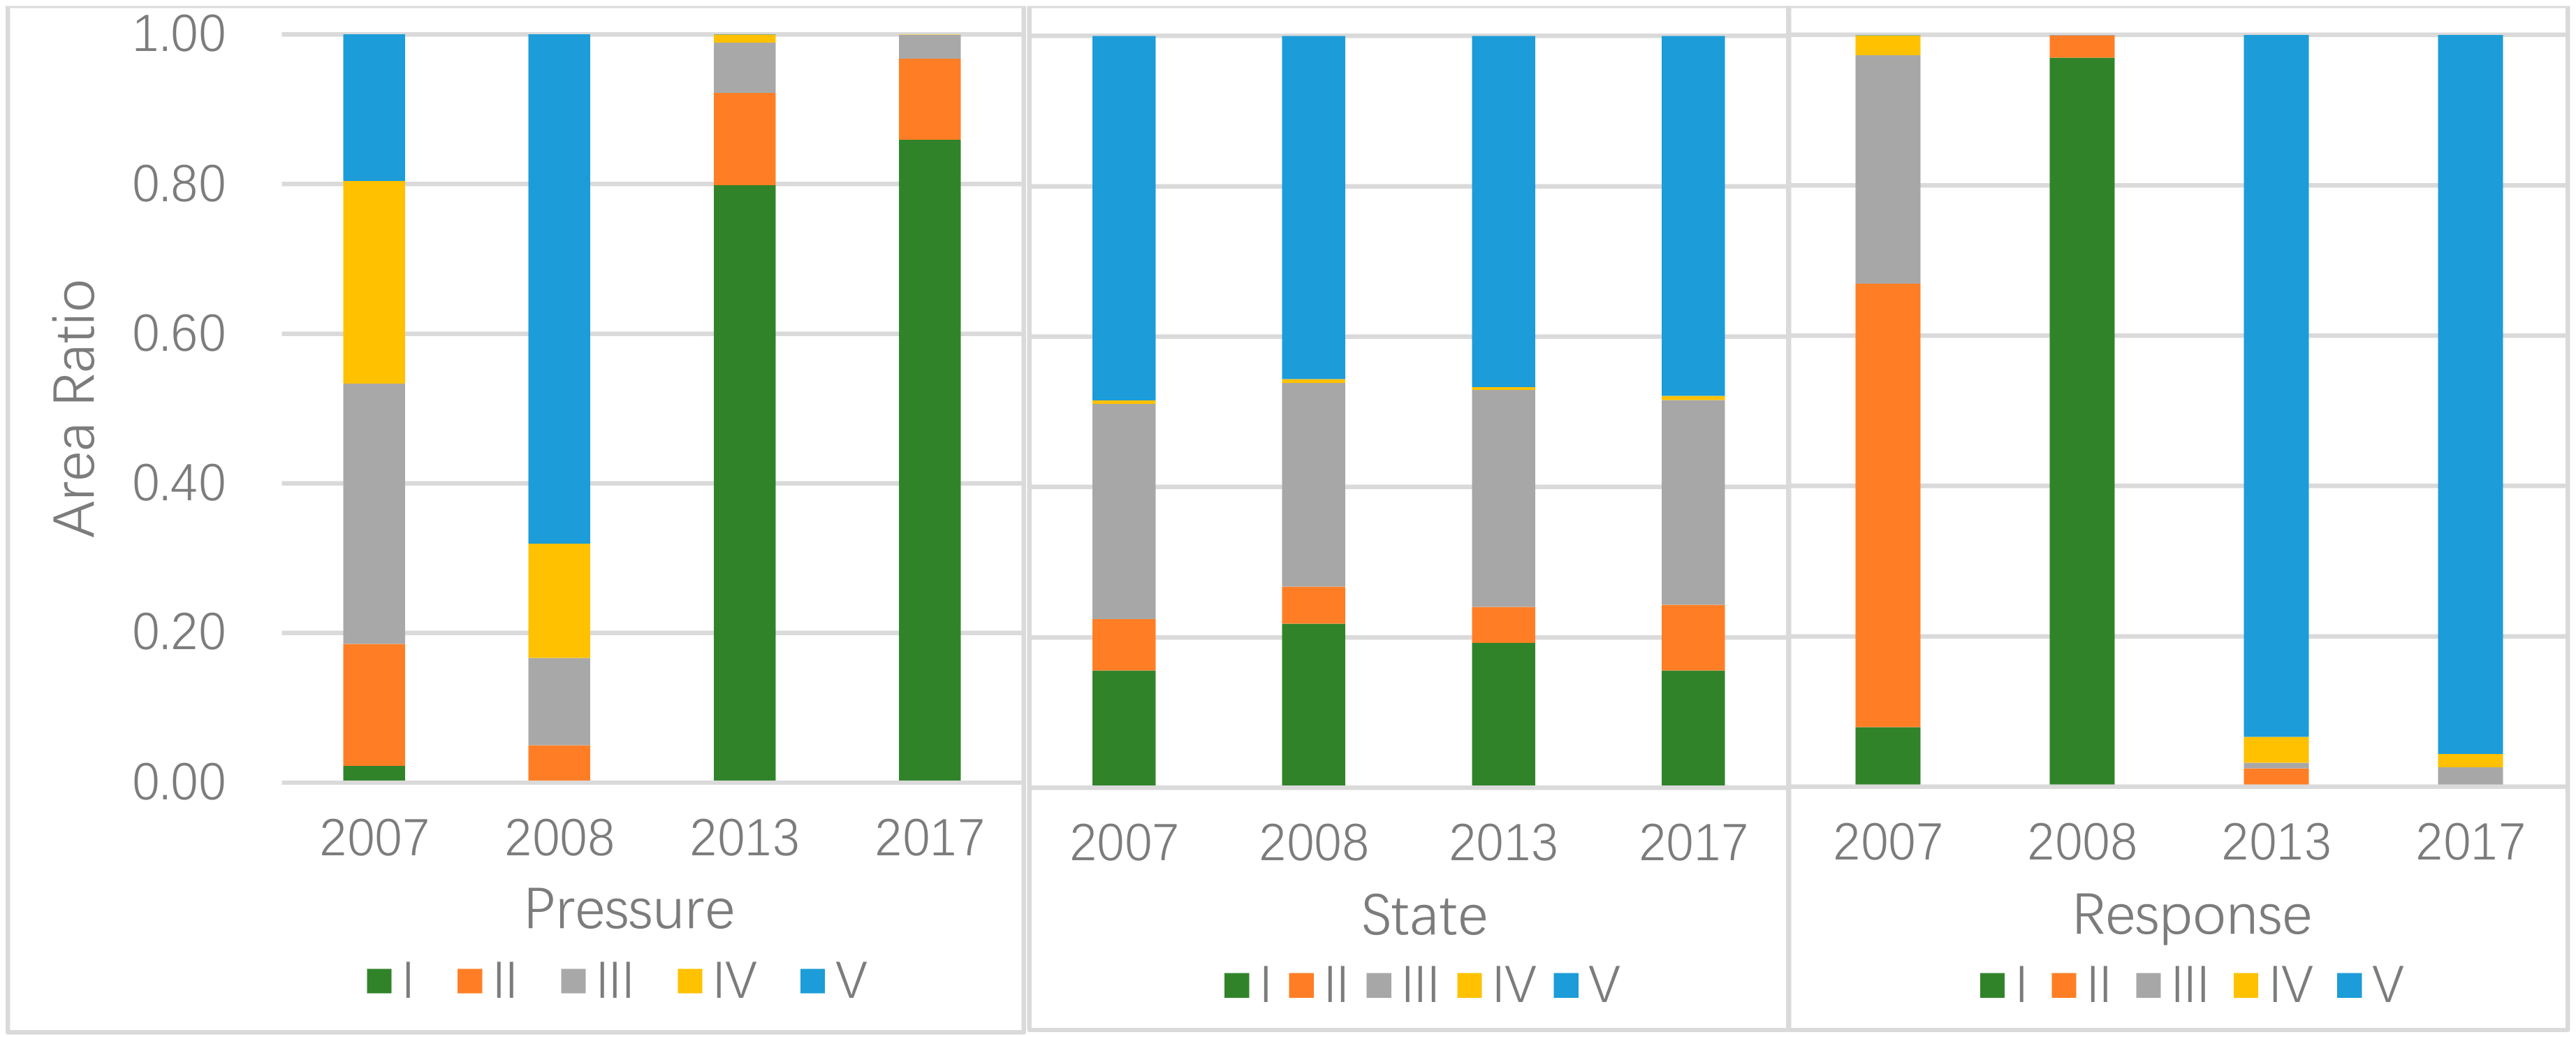
The Conceptual Model of Pressure-State-Response (PSR) was proposed by the Organization for Economic Co-Operation and Development (OECD) and the United Nations Environmental Program (UNEP) [21]. This model evaluates ecological security using pressure, status, and response indicators. Based on the above analysis, we discuss the quality of the ecological environment of Wenchuan County after the earthquake using gray-correlation analysis. An ecoenvironmental evaluation system could be established in accordance with the PSR model and remote sensing, survey data can be used to calculate evaluation indices, and weights of indicators were determined through an entropy-weighted method. Finally, a spatiotemporal analysis on the changes of ecological conditions in Wenchuan after the earthquake was carried out.

2. Materials and Methods

2.1. Study Area

Wenchuan County (Figure 1) is located in the northwestern part of Sichuan Province, in the southeastern part of the Aba Tibetan and Qiang Autonomous Prefecture (latitude varies from 30°45′ N to 31°43′ N, and longitude 102°51′ E–103°44′ E). The total area of the county is about 4084 km2. The topography of Wenchuan County rises from southeast to northwest, with uneven distribution of light, heat, and water. Annual average temperature of the county varies in the range of 13.5 °C–14.1 °C. The annual average frostfree period lasts 247–269 days, annual average precipitation is 528.7–1332.2 mm, and annual average sunshine is 1693.9–1042.2 h. The county has enough animal, plant, and mineral resources. Various kinds of data have been considered in the present work to calculate the relevant indicators (Table 1).

2.2. Study Methods

2.2.1. Introduction of Evaluation Method

Urban ecosystems consist of many factors, such as population, economy, and the natural environment. They have the characteristics of information uncertainty and incompleteness. Therefore, an urban ecosystem is a gray system. For a gray system, small sample data modeling can be used to find the law of the system through sequence generation. The basic idea of gray relation analysis is to judge whether the connection is tight based on the degree of similarity of the sequence-curve geometry. The closer the curve is, the greater the correlation between the corresponding sequences, and vice versa. That is, merits and demerits are evaluated by reflecting the closeness of each evaluation object to the ideal object [22].

2.2.2. Evaluation Indicator Selection and Processing

In the present study, we used the pressure, state, and response layers of the PSR model. The pressure layer characterizes the impact of human activities and natural disasters on the environment and resources. We considered population density and rural electricity consumption to describe the impact of human activities. At the same time, considering the damage caused by the Wenchuan earthquake and the occurrence of landslides and debris flows in areas sensitive to geological disasters after the earthquake, the intensity of geological disasters was selected to express the impact of natural disasters.
The state layer characterizes the environment at a specific time period. Topography and landform determine land-use situations; the adjustment ability and adaptability of ecosystems are very important for ecological restoration; landscape patterns can reflect the ecosystem status from its structure and composition. Here, we considered indicators including altitude, slope, land-use type, landscape index (Perimeter–Area Fractal Dimension, Splitting, Contagion) to describe the ecosystem status.
The response layer characterizes the ability to study changes in an ecological environment that are detrimental to human survival and development. We have considered the aridity index, net primary productivity, per capita GDP, the number of middle-school students, and the number of hospital technicians to evaluate the response from nature, economy, education, and health, respectively [23].
All the indicators used in the present study are shown in Table 2 and each indiex was computed as:
(1)
Population density, rural electricity consumption, GDP per capita, number of secondary-school students, and number of hospital technicians were obtained by querying the Sichuan Statistical Yearbook and Wenchuan County National Economic and Social Development Statistical Communique.
(2)
The earthquake and its secondary disasters caused serious damage to the ecological environment. We used DInSAR technology to process ALOS and Sentinel 1A satellite data, and measure the surface deformation of Wenchuan County in each year so as to extract geological-disaster information. Due to the nonavailability of radar images, 2011 radar data were used.
(3)
Land-use type was obtained from remote-sensing image classification. In order to improve classification accuracy, manual interpretation was performed based on automatic classification based on ground-truth samples that were collected from reference data, including Google Earth satellite images and existing land-use maps. Then, Fragstats was used to calculate the landscape index.
(4)
The altitude and slope were obtained from Advanced Spaceborne Thermal Emission and Reflection Radiometer Global Digital Elevation Model (ASTER GDEM) data with a resolution of 30 m.
(5)
Net Primary Productivity (NPP) was obtained from MOD17A3, a MODIS product, which is widely used in the calculation of net primary productivity.
(6)
Aridity index was calculated using the modified Selianinov equation. In Equation (1), A represents the dryness index, t and r represent temperature and precipitation, respectively, t is ≥ 10°C accumulated temperature, r is the total rainfall when the temperature is ≥10 °C. The temperature and precipitation data were obtained by interpolating the data from the 13 nearest weather stations around Wenchuan County.
  A = 0.16 t / r  

2.2.3. Standardization of Indicators

Since the dimensions of each evaluation indicator were different, not comparable, and could not be directly used for ecosystem evaluation, it was necessary to apply nondimensionalization to all evaluation factors. Here, we quantified all indicators to 0–1, reflecting the change of ecological environment quality in the aspect of one indicator from good to bad. The indicators for ecological assessment can be divided into positive and negative types. The positive and negative values represent ecological conditions.
Equation (2) was used to standardize positive indicators. Equation (3) was used to standardize negative indicators. In these two equations,   X i is the original value of index, X m a x , X m i n are the maximum and minimum values of the i-th indicator, and Q i is the normalized value.
  Q i = ( ( X i X m i n ) / ( X m a x X m i n ) )  
  Q i = ( 1 ( X i X m i n ) / ( X m a x X m i n ) )  

2.2.4. Weight Calculation

The impact of each indicator on the evaluation object was different; the scientific determination of the weight of each indicator is of great significance to the overall evaluation result. Entropy is a kind of objective weighting method that determines weight according to the size of the difference, i.e., the resolving ability between each object, and it is widely used in multiobjective decision making.
Entropy value e j of the j-th index was calculated using Equation (4), where m is the number of objects to be evaluated, k = 1 / ln m , and y i j is the j-th index value of the i-th evaluation object after normalization. If y i j is equal to 0, replace it with 0.00001.
  e j = k i = 1 m y i j ln y i j    
The weighting formula for the j-th indicator is as follows, where d j = 1 e j is the difference coefficient of the j-th indicator.
  w j = d j i = 1 n d j

2.2.5. Establishment of the Gray Relation Model

(1)
Since the original data were normalized and converted to positive indicators, the optimal vector is
  G = ( g 1 , g 2 , g n ) = ( y 11 v y 12 v y 1 m , y 21 v y 22 v y 2 m , y n 1 v y n 2 v y n m   )    
(2)
Using a gray correlation coefficient formula to calculate correlation coefficient ξ i ( Y j , G ) between j-th index Y j and optimal vector G :
  ξ i ( Y j , G ) = min i   min j | y i j g i | + ρ   max i   max j | y i j g i | | y i j g i | + ρ   max i   max j | y i j g i |
In the formula, min i   min j | y i j g i | and max i   max j | y i j g i | are, respectively, two-level minimum difference and two-level maximum difference. ρ is the resolution coefficient, 0 < ρ < 1, generally taking ρ = 0.5.
(3)
Calculate degree of association R between the i-th evaluation object and optimal vector G :
  R = m n w j × ξ i ( Y j , G )  

2.2.6. Analytical Methods

(1) Ecological Security Grading
The correlation degree of ecological security was divided into five levels, from “safe” to “very unsafe”, as seen in Table 3 [22]. Different correlation-degree levels reflect the differences in ecological security in the study area.
(2) Change Trend of Ecological Security
On the basis of the hierarchical division of the ecological safety correlation degree, we calculated the ecological safety difference for each of two years in 2007, 2008, 2013, and 2017, and divided the ecological safety change into 7 levels according to the results: significant deterioration (SD), moderate deterioration (MD), light deterioration (LD), no change (NC), light improvement (LI), moderate improvement (MI), and significant improvement (SI).
(3) Analysis of Pressure, State, and Response Layer of the Ecological System
Calculate the security correlation degree of the pressure, status, and response layers, and analyze the distribution of the correlation degree and the factors in each layer.

3. Results

3.1. Ecological Security Grading

Using the method described in the second section, the security correlation degree in Wenchuan County in 2007, prior to the earthquake, and after the earthquake, in 2008, 2013, and 2017, were calculated and compared with the urban ecological safety grading standards that are shown in Table 3. Mean and variance were calculated for each year, and results are shown in Table 4. The average correlation in 2007 was found to be the highest; the value in 2017 was slightly lower than that in 2007. The smallest average correlation degree was in 2008. In 2008, the variance of correlation degree was the highest, followed by 2013 and 2007, and the variance in 2017 was lower than other years, clearly showing a recovery of ecological conditions. In 2008, ecological conditions were poor, seriously damaged due to the deadly earthquake in 2008. After five years of recovery, the level of ecological conditions in Wenchuan County improved significantly in 2013, and continued to increase in the following four years. In 2017, ecological conditions were almost restored as they existed in 2007, prior to the earthquake (Figure 2).
The area ratio of each ecological security level area was calculated, and results are shown in Figure 3. It can be seen that the area ratio of ecological security grade V was over 40% in 2007 and 2017, and close to 30% in 2013, which was the largest-proportion ecological safety type in these three years. In 2008, the largest-proportion ecological security level was IV. The area of ecological safety grades II and I accounted for 40.05% of the total area in 2008. According to Figure 2, these areas were mainly distributed around the Lancang River and in the western mountainous region of Wenchuan County, and this value decreased to 23.65% in 2013.

3.2. Change Trend of Ecological Security

Based on the ecological safety grades of Wenchuan County in each year, the changes in ecological security in 2007–2008, 2008–2013, 2013–2017, and 2007–2017 were calculated and results are shown in Figure 4. The proportions of regional areas with different degrees of change were counted, and Figure 5 quantitatively shows the degree of changes in ecological security during these four periods. As can be seen from Figure 5, the Wenchuan earthquake caused tremendous damage to the ecological security of Wenchuan County; 46.9% of the area was slightly damaged, 19.8% of the area was moderately damaged, and the area where ecological safety was severely reduced accounted for 4.9%. It can be seen from Figure 4 that these areas were mainly distributed on both sides of the Minjiang River and in the mountainous areas in the west, which is consistent with ecological safety grades I–II. After five years of restoration, ecological condition security has improved by up to 47.9% of the region. In 2017, 40.2% of the region has been improved compared to 2013. Compared to 2007, the level of ecosafety in 10.9% of the region increased to varying degrees in 2017, while a slight decrease in 12.8% of the region was observed.

3.3. Analysis of Pressure, State, and Response of the Ecological System

Under the premise of comprehensive annual ecological security correlation degree, the security correlation degrees of pressure, state, and response layers were calculated, and the area proportion of each ecological level is shown in Figure 6.

3.3.1. Pressure-Layer Analysis

Comparing the ecological security of the pressure layer in each year, the area of ecological security above the “critically safe” level accounted for 81.5% in 2007 and 95% in 2008. In 2013 and 2017, the “very unsafe”-level areas accounted for the largest proportion, reaching 79.8% and 85.9%, respectively.
Comparing the index values of the pressure layers in each year (Table 5), we found that the 2008 Wenchuan earthquake caused a pronounced reduction in the population of Wenchuan County and, thereby, in electricity consumption. In 2008, the two indicators of population density and rural electricity consumption were higher than those of other years. Even if the earthquake caused a large-scale geological disaster, because the number of high score indicators was more than that of low score indicators, the annual ecological safety level was still high in 2008. The reason why the ecological level of Wenchuan County in 2007 was slightly lower than that of 2008 was because the population in 2007 was the highest in four years, so the population-density index had the lowest score. In the the meantime, electricity consumption in 2007 was slightly higher than in 2008. In 2013 and 2017, the scores on rural electricity consumption were very low compared to 2007 and 2008, resulting in the former’s ecological level in the pressure layer being much lower than the latter.

3.3.2. State-Layer Analysis

Analyzing the ecological security of the state layer in each year shows that, in 2007 and 2013, the area ratio at the “safe” level was the highest, followed by 2017, and the “safe” area in 2008 was the lowest. From this conclusion, it can be seen that Wenchuan County had the best ecological conditions in 2007. The 2008 earthquake caused great damage to the ecological environment. After five years of recovery, the area at the “safe” level in 2013 has increased compared to 2008 to a certain degree. The area at the “safe” level in 2017 has increased from 2013 to about 47.8%.
Figure 7 shows the area ratio of various land types in each year. It can be seen from the figure that Wenchuan County had the largest vegetation coverage area in 2007, followed by 2017 and 2013, while unutilized land area in 2008 was the largest in four years, which may have been caused by earthquake-induced geological disasters.
The distribution and the proportion of land-use types affects the landscape pattern. Table 6 shows the landscape-index scores of each year.
The Perimeter-Area Fractal Dimension (PAFRAC) mainly reflects the complexity of the appearance of the plaque. A higher PAFRAC value shows that the patch fractal is more complex, and with a smaller degree of human interference. A low PAFRAC value represents a more regular and simpler patch shape, with a greater degree of human interference [24]. The PAFRAC value was the lowest in 2017, while the value was relatively high in 2008 when the Wenchuan earthquake occurred. In 2008, the earthquake destroyed the ecological structure of Wenchuan County, breaking plaques and making them irregular in shape. Therefore, the PAFRAC value in 2008 reflected the natural disaster’s interference with the environment. In 2017, restoration work and huge construction and cultivated land made the patches inside the area look simpler and more regular, showing the impact of human activities on the environment.
The Splitting Index (SPLIT) represents the degree of fragmentation; a higher degree shows higher spatial heterogeneity that impacts loss of biodiversity [25]. The SPLIT score in 2008 was the lowest, indicating that the earthquake destroyed the ecological environment of Wenchuan County (Table 6). The vegetation of the regional landscape changed, and ecological functions were severely damaged.
CONTAG (Contagion) indicates the connectivity of the landscape; a high degree reflects a low degree of landscape fragmentation, indicating that the main patch has high integrity and connectivity, and has a positive effect on organism migration within the region [26]. The CONTAG index in 2013 was the highest, and in 2007 it was slightly lower than in 2013. The index severely decreased in 2008 and, afterward, due to further restoration work, the index was also decreased in 2017 (Table 6).

3.3.3. Response-Layer Analysis

Our detailed analysis of the ecological safety of the response layer has shown that, in 2007, the area at the “critically safe” level and below was 66.9%, which reached 99.8% in 2008. In 2013, only 2.4% of the regions were at the “unsafe” and “very unsafe” levels, and about 96.8% of the region had a “comparatively safe” and higher level of ecological security. After nine years after the earthquake we observed 95.7% of the areas were “safe”.
From Table 7, it was seen that the average NPP in 2008 and 2017 relatively small. In 2007, the number of hospital technicians and the average aridity index were lowest while the number of middle school students had the highest score. In addition to the higher average score of the aridity index in 2008, the scores of other indicators of response layer were very low. So we can draw a conclusion that in 2008, Wenchuan County had poor response to environmental degradation. In addition to the number of middle school students had the lowest score in 2017, the scores of other indicators are all at or close to the highest score. Therefore, in 2017, Wenchuan County has a stronger ability to respond to the deteriorating ecological environment.

4. Discussion

Hu used data from 2006 and 2008 to evaluate the ecological environment quality before and after the Wenchuan earthquake [14]; Cao et al. calculated and analyzed the ecological security and recovery of Wenchuan County in 2007, 2008, and 2013 [27]. In order to verify whether the results of this study are reliable, the results obtained in this study were compared with the results of these two similar studies.
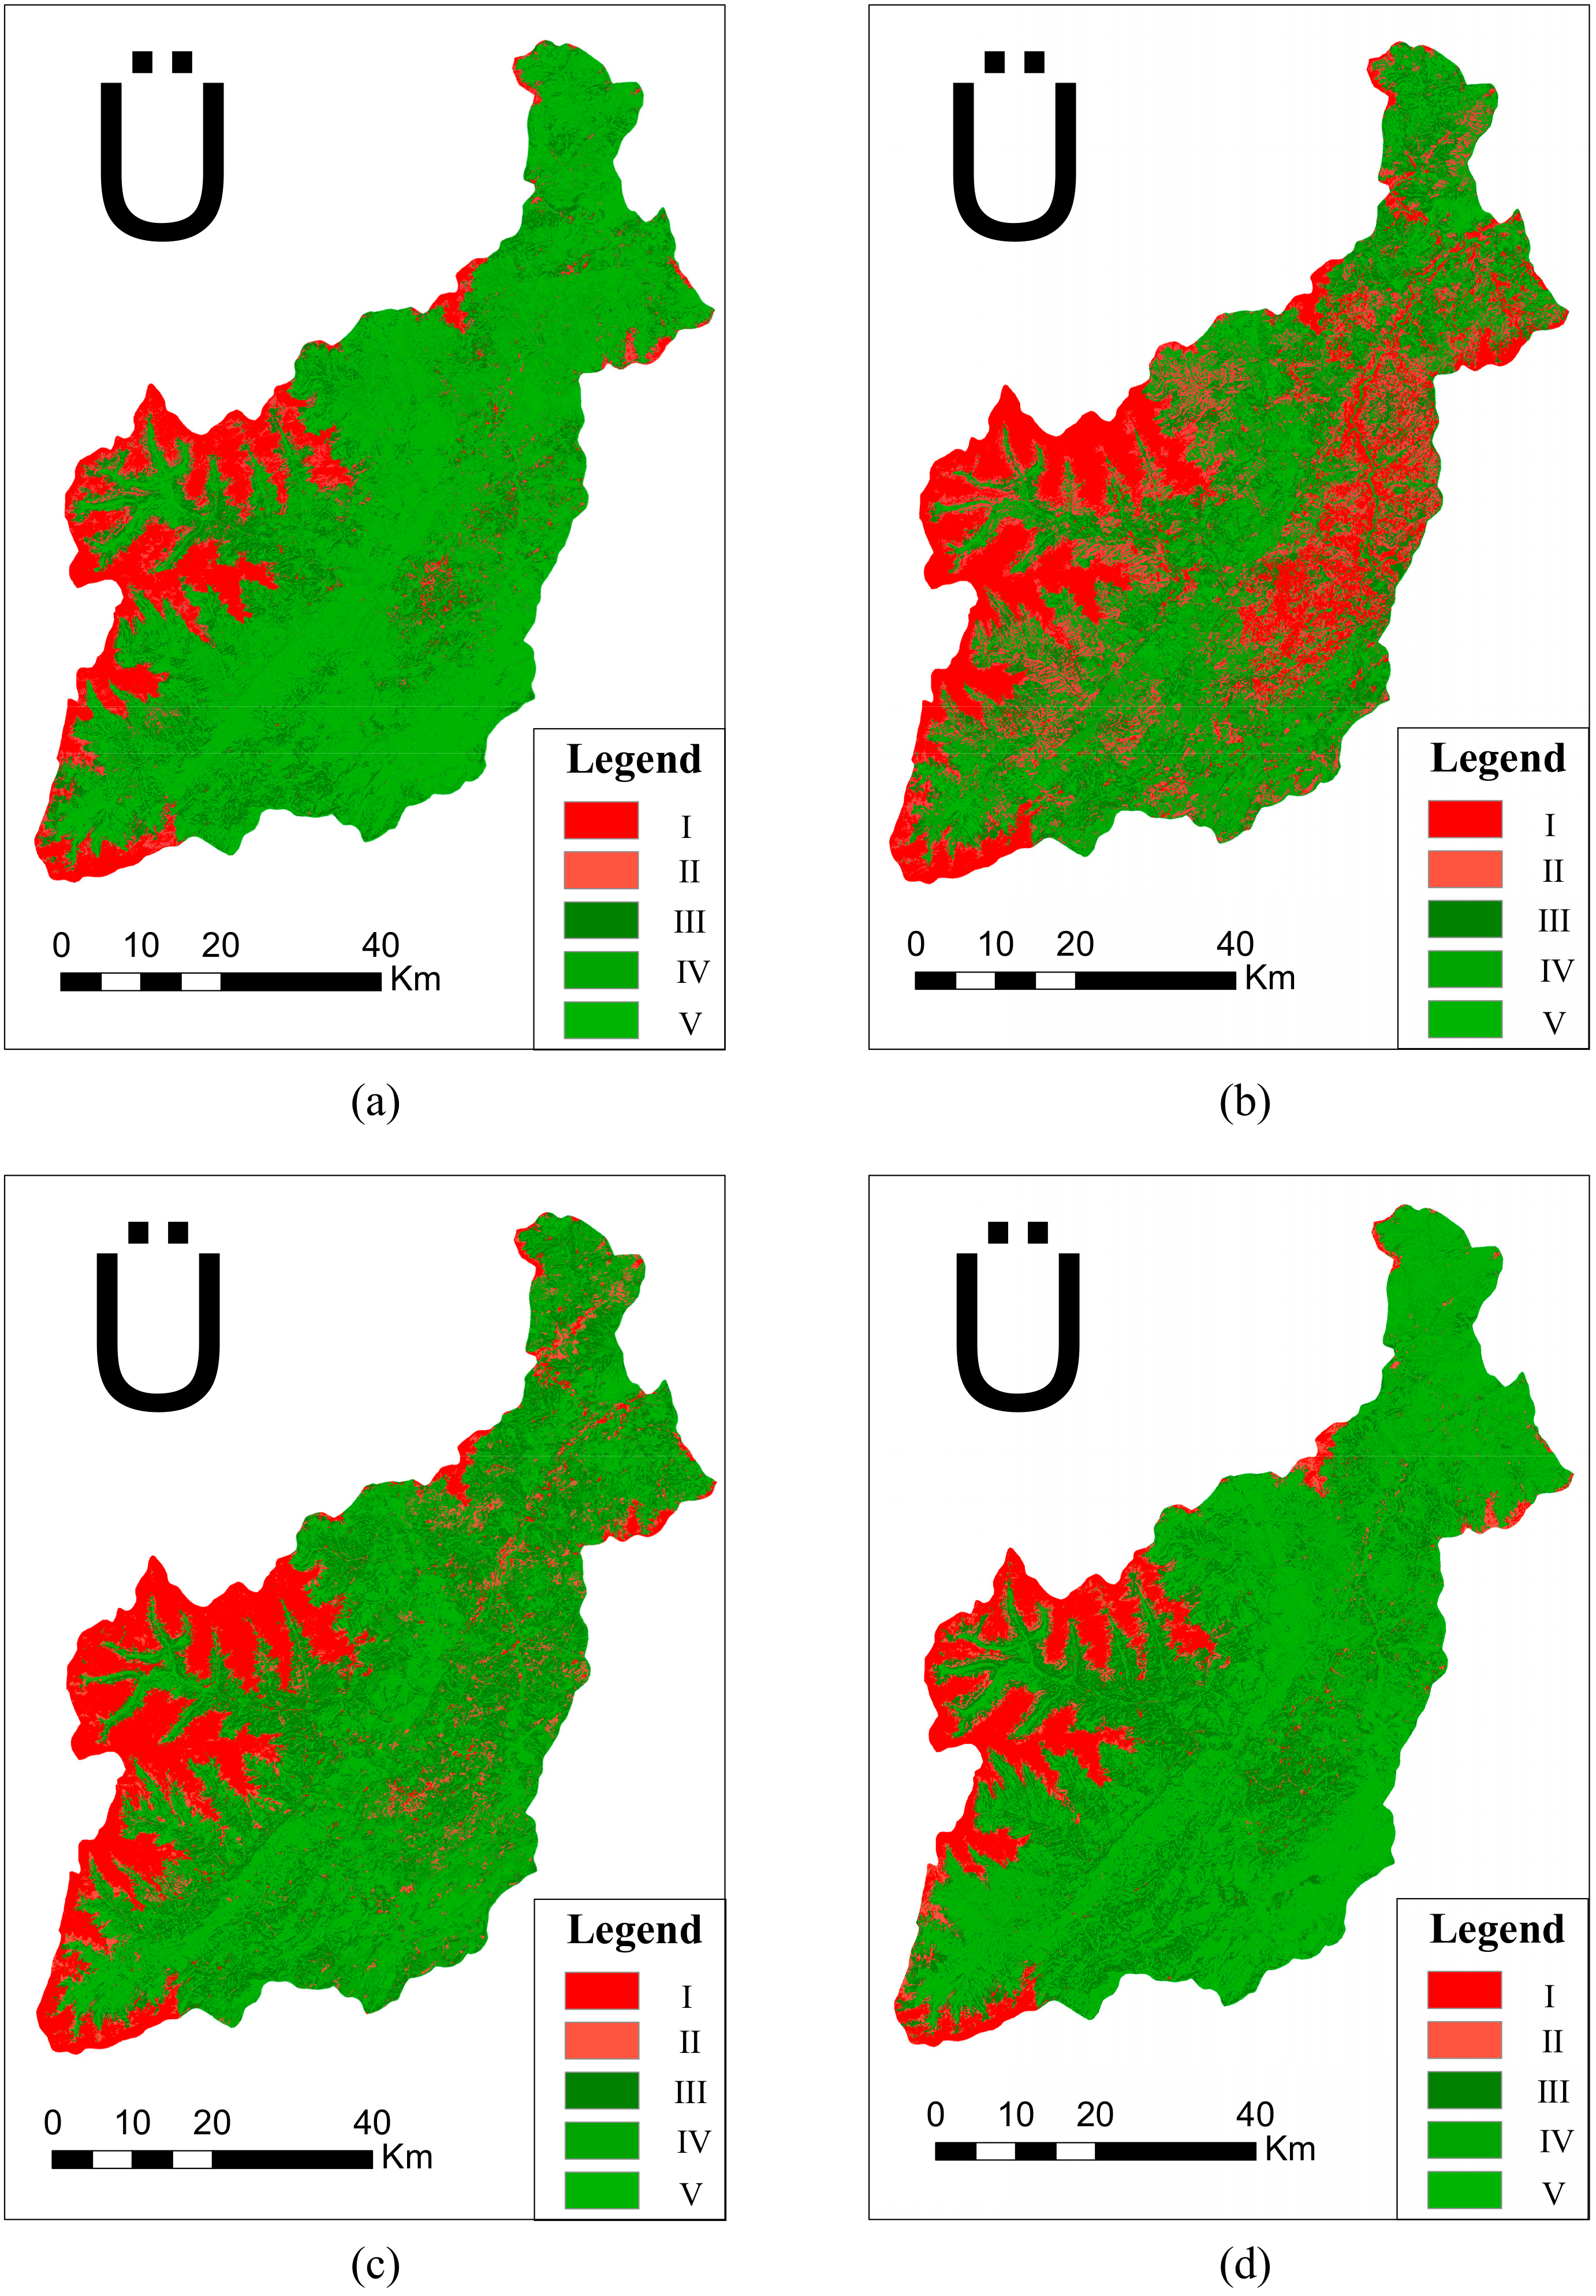
Since Hu used the 2006 data in calculating the pre-earthquake ecological environment quality, their study is quite different from the 2007 data used in this study, so only the 2008 results were compared. Among the results obtained by Hu, in 2008 the region that accounted for Wenchuan County’s environmental quality rating of “good” and “relatively good” was 67.3%, the “generally good” area accounted for 27.9%, while 4.8% of the region was “poor” and “terrible”. The results obtained in this study corresponded to values of 38.2%, 21.7%, and 40.0%, respectively.
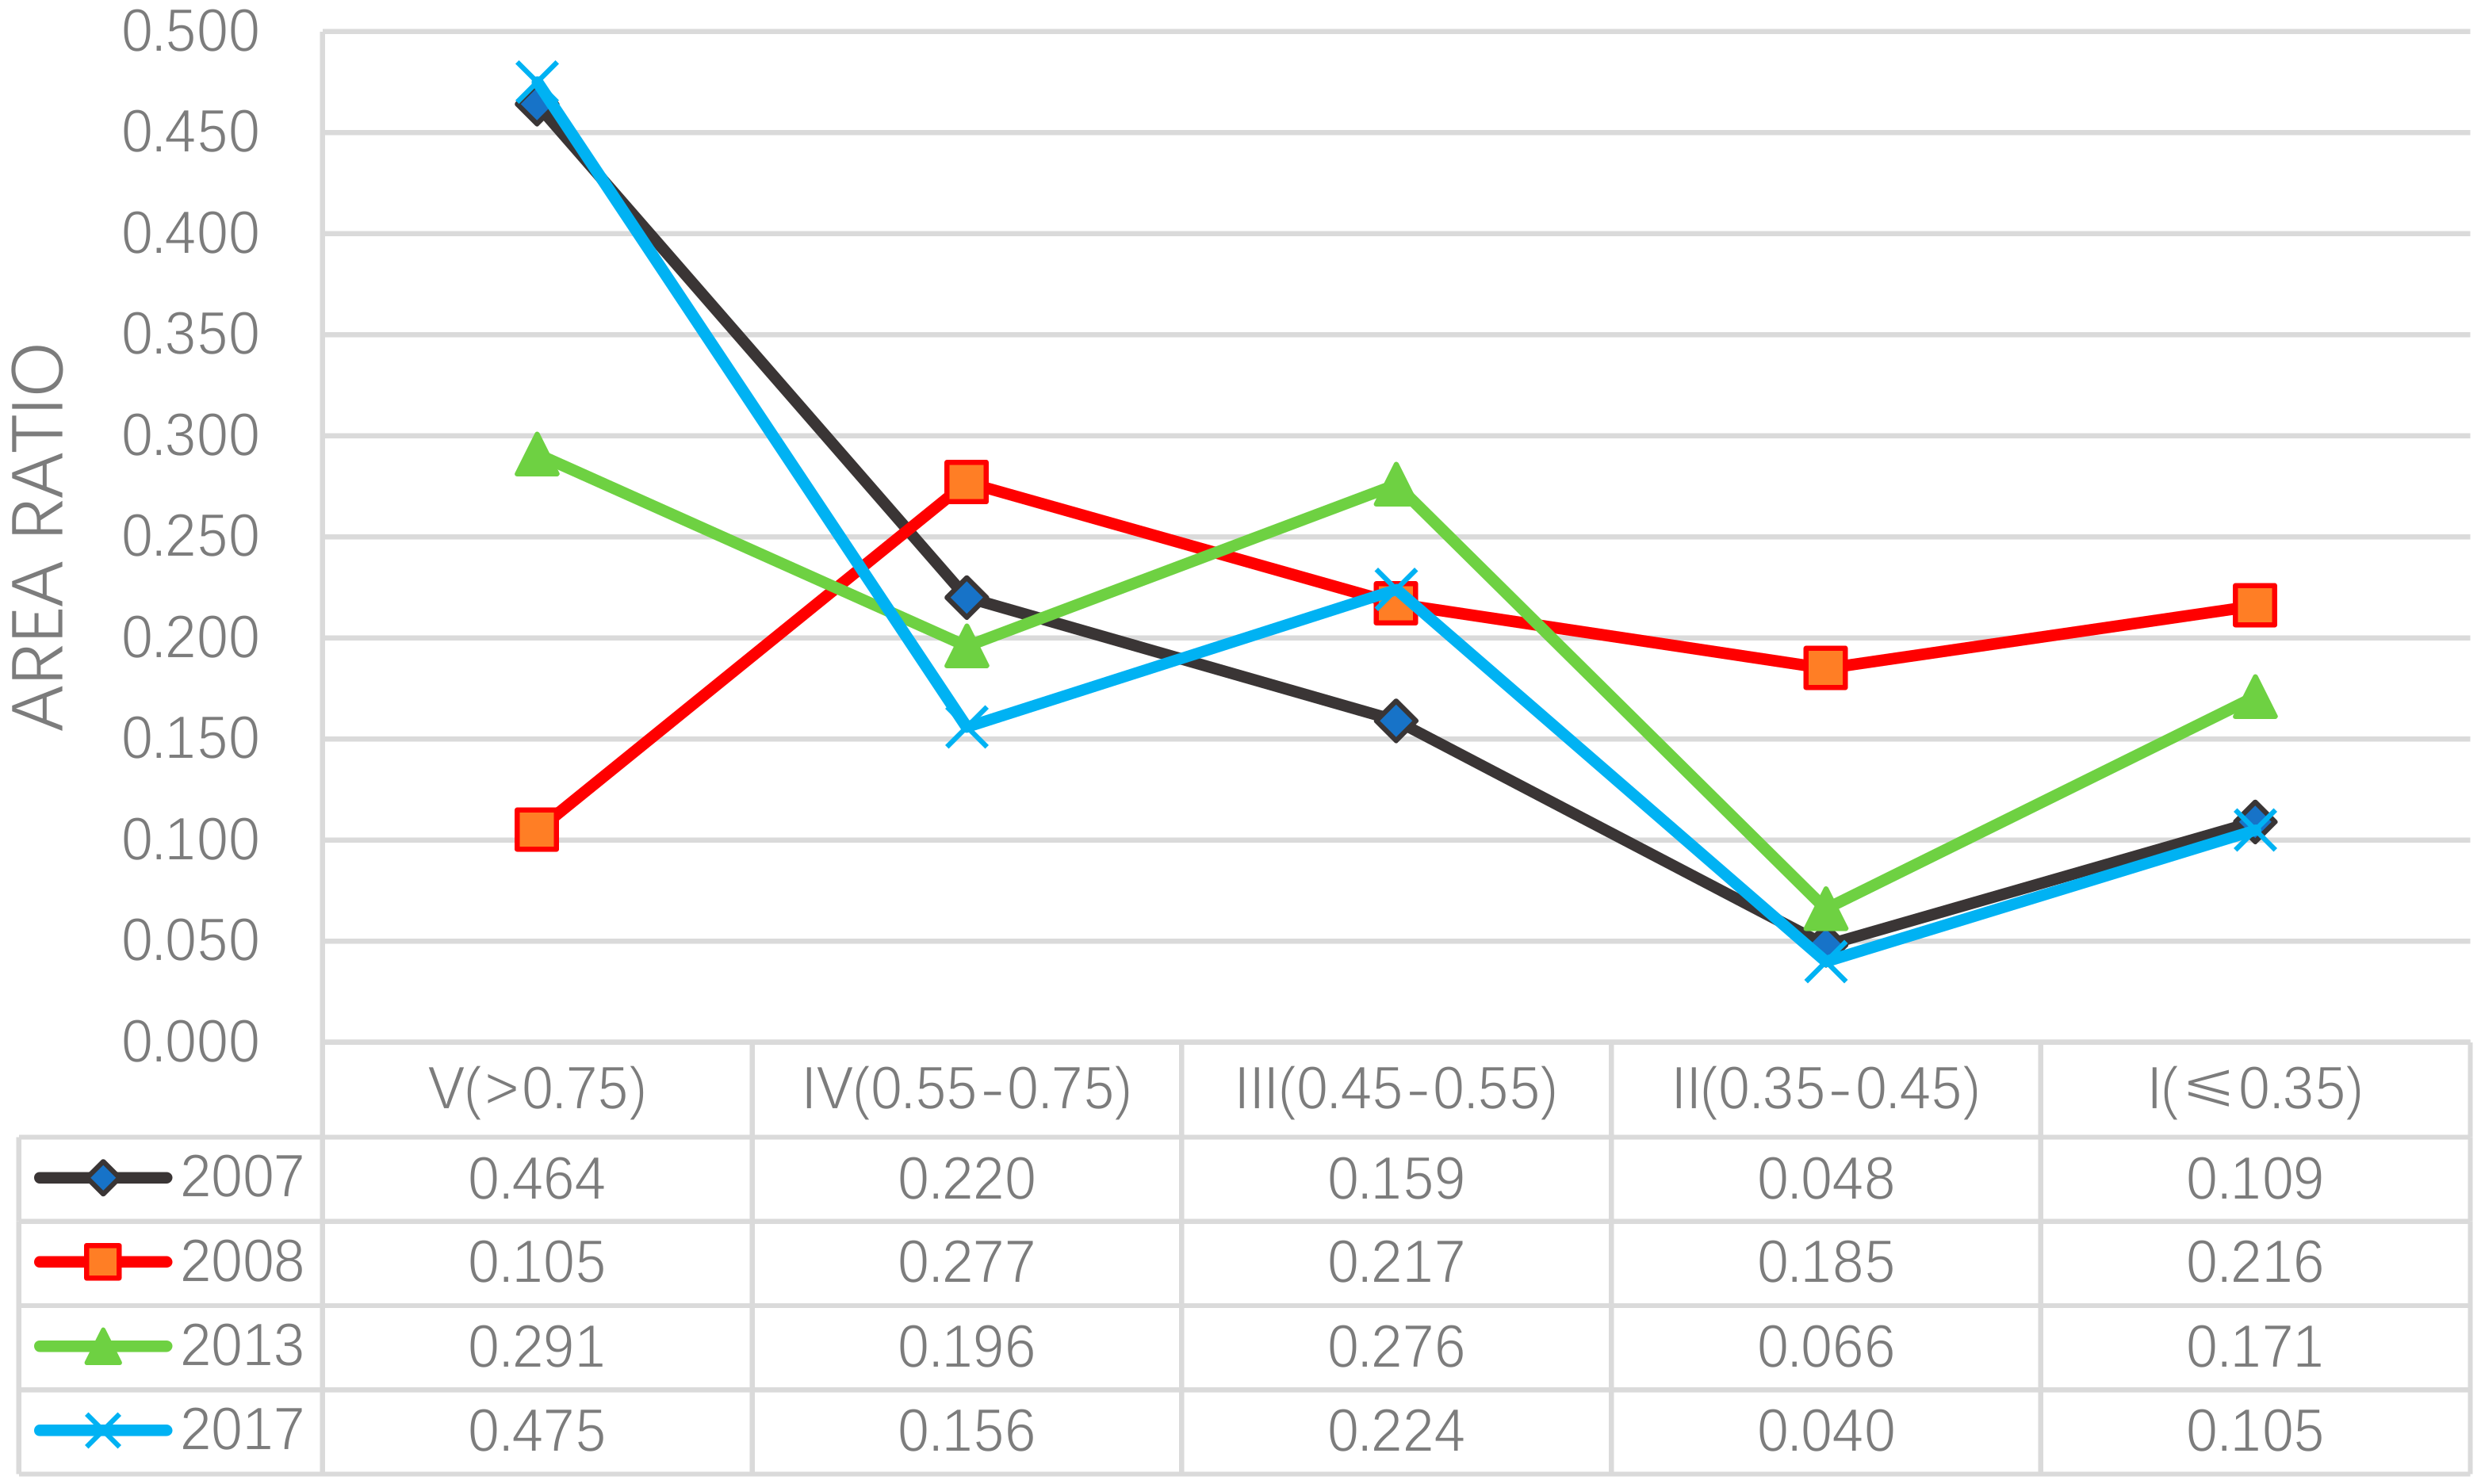
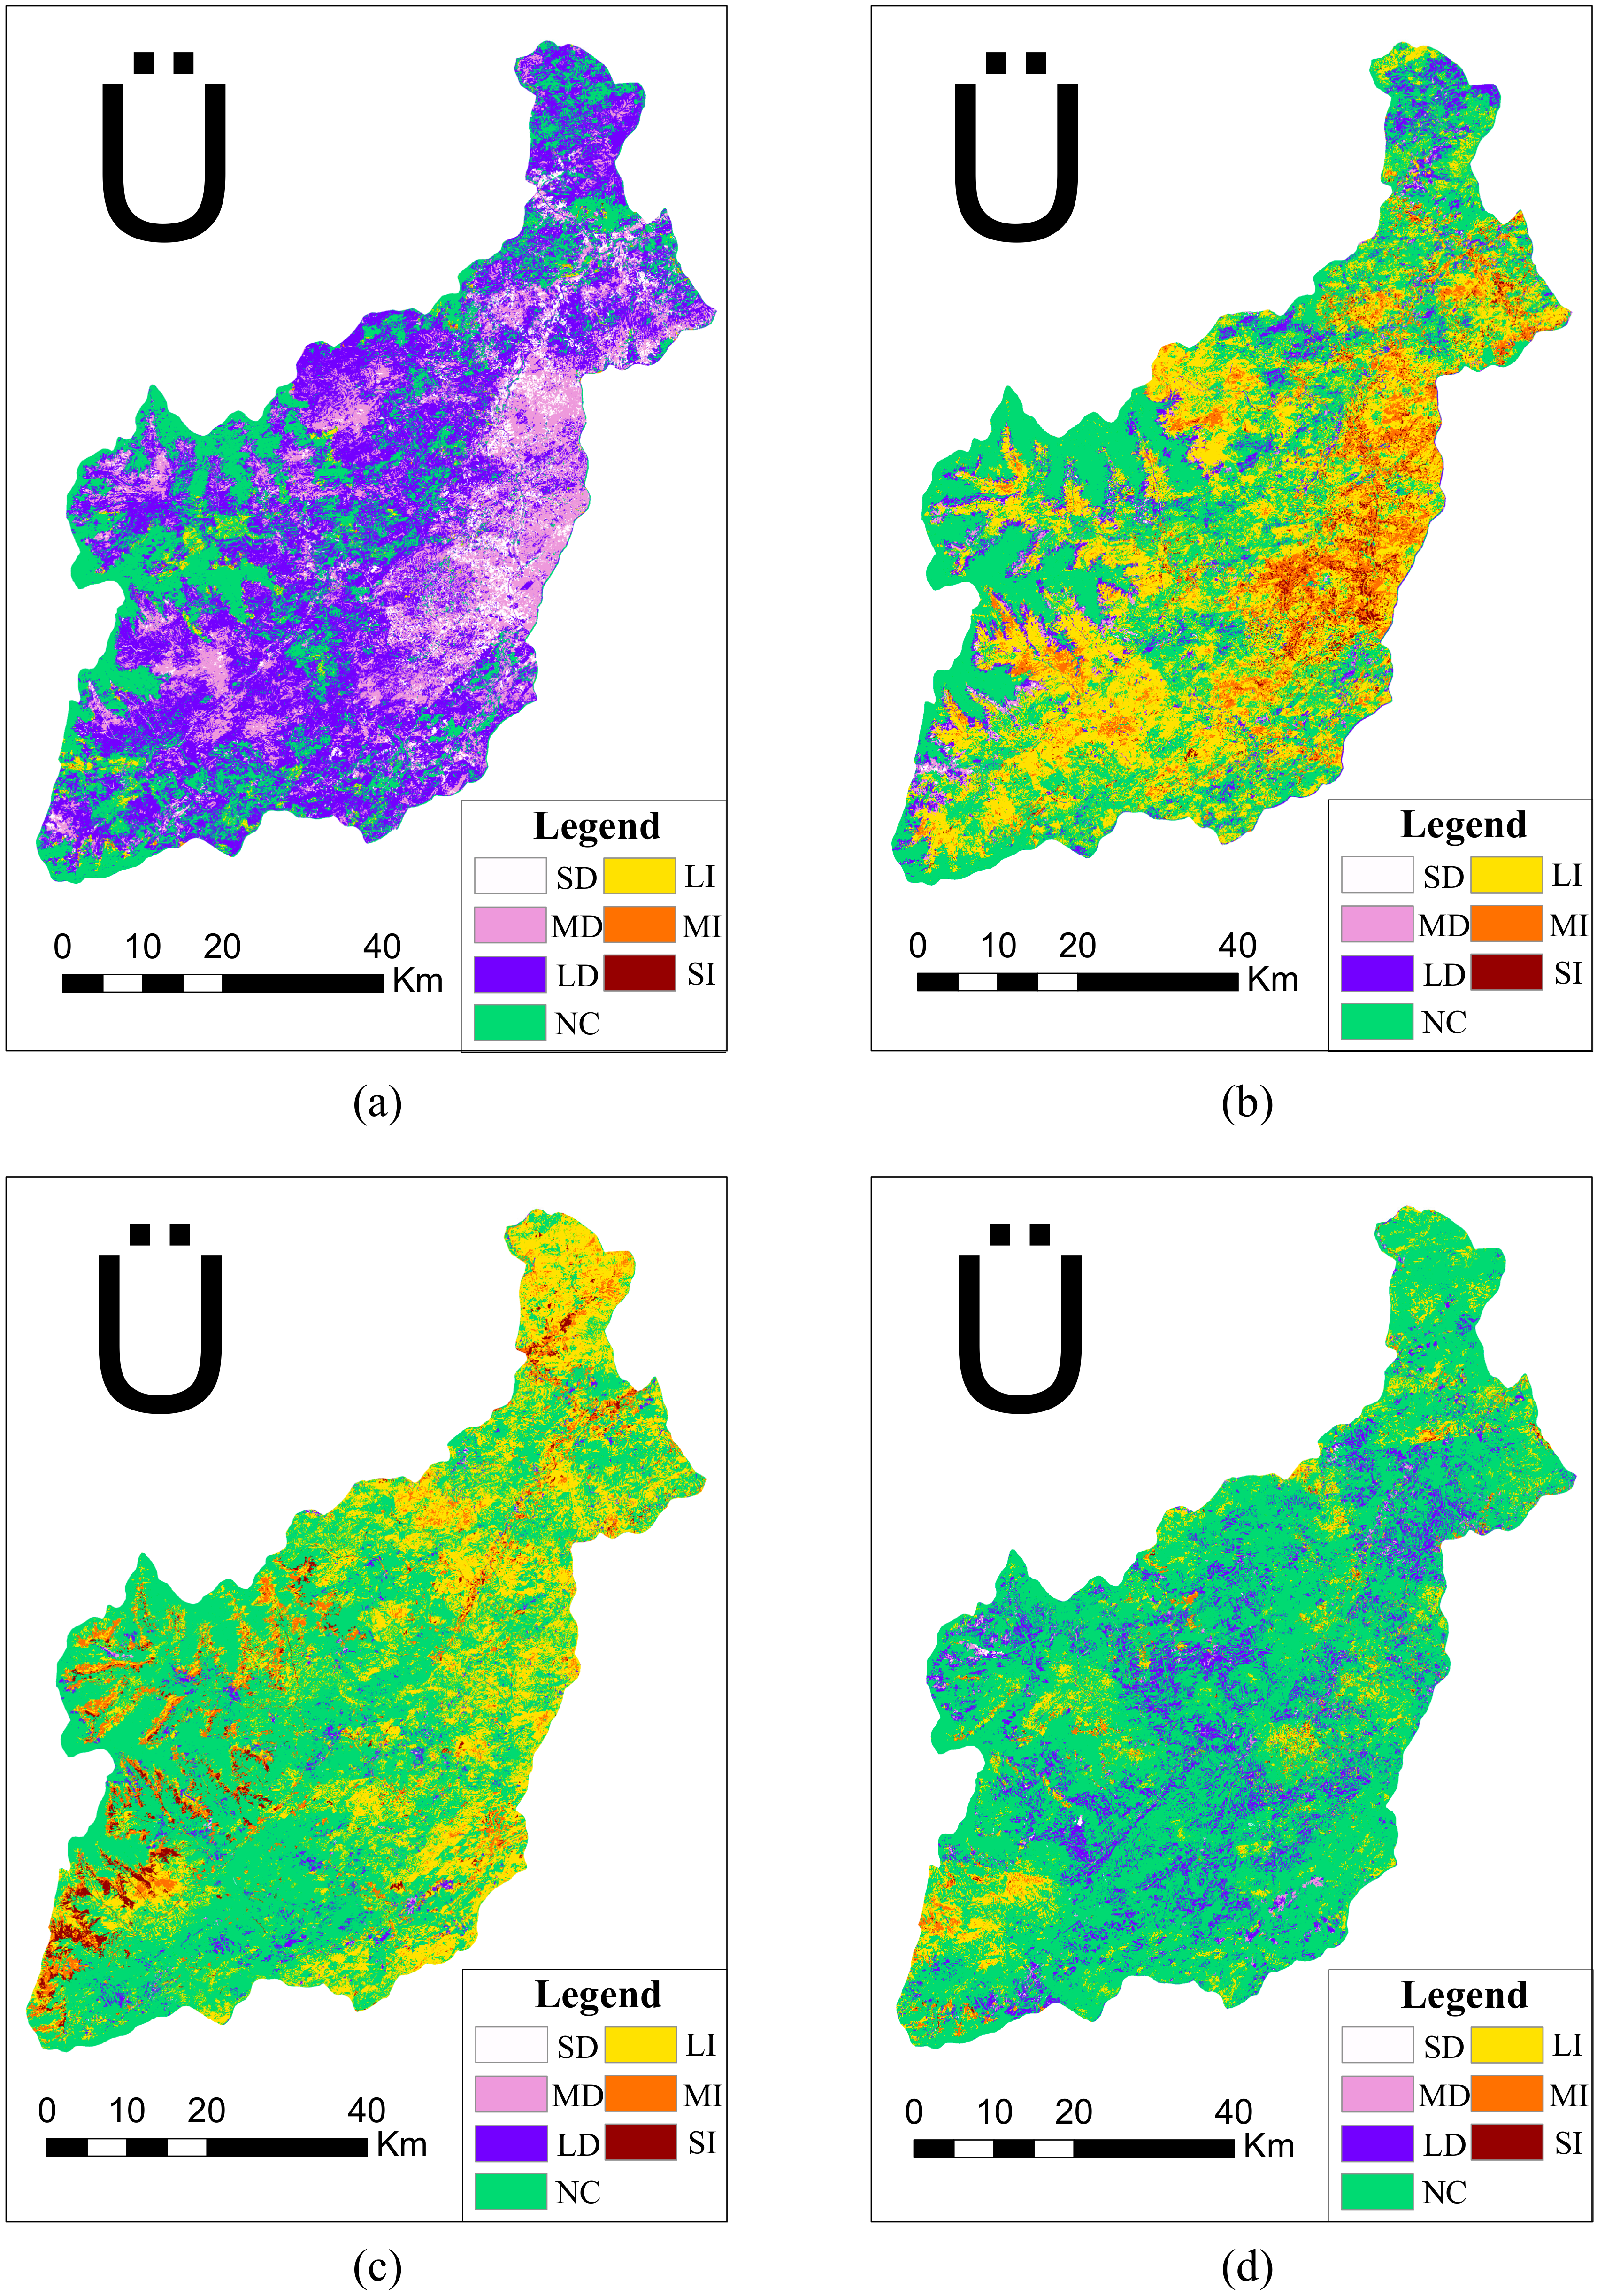
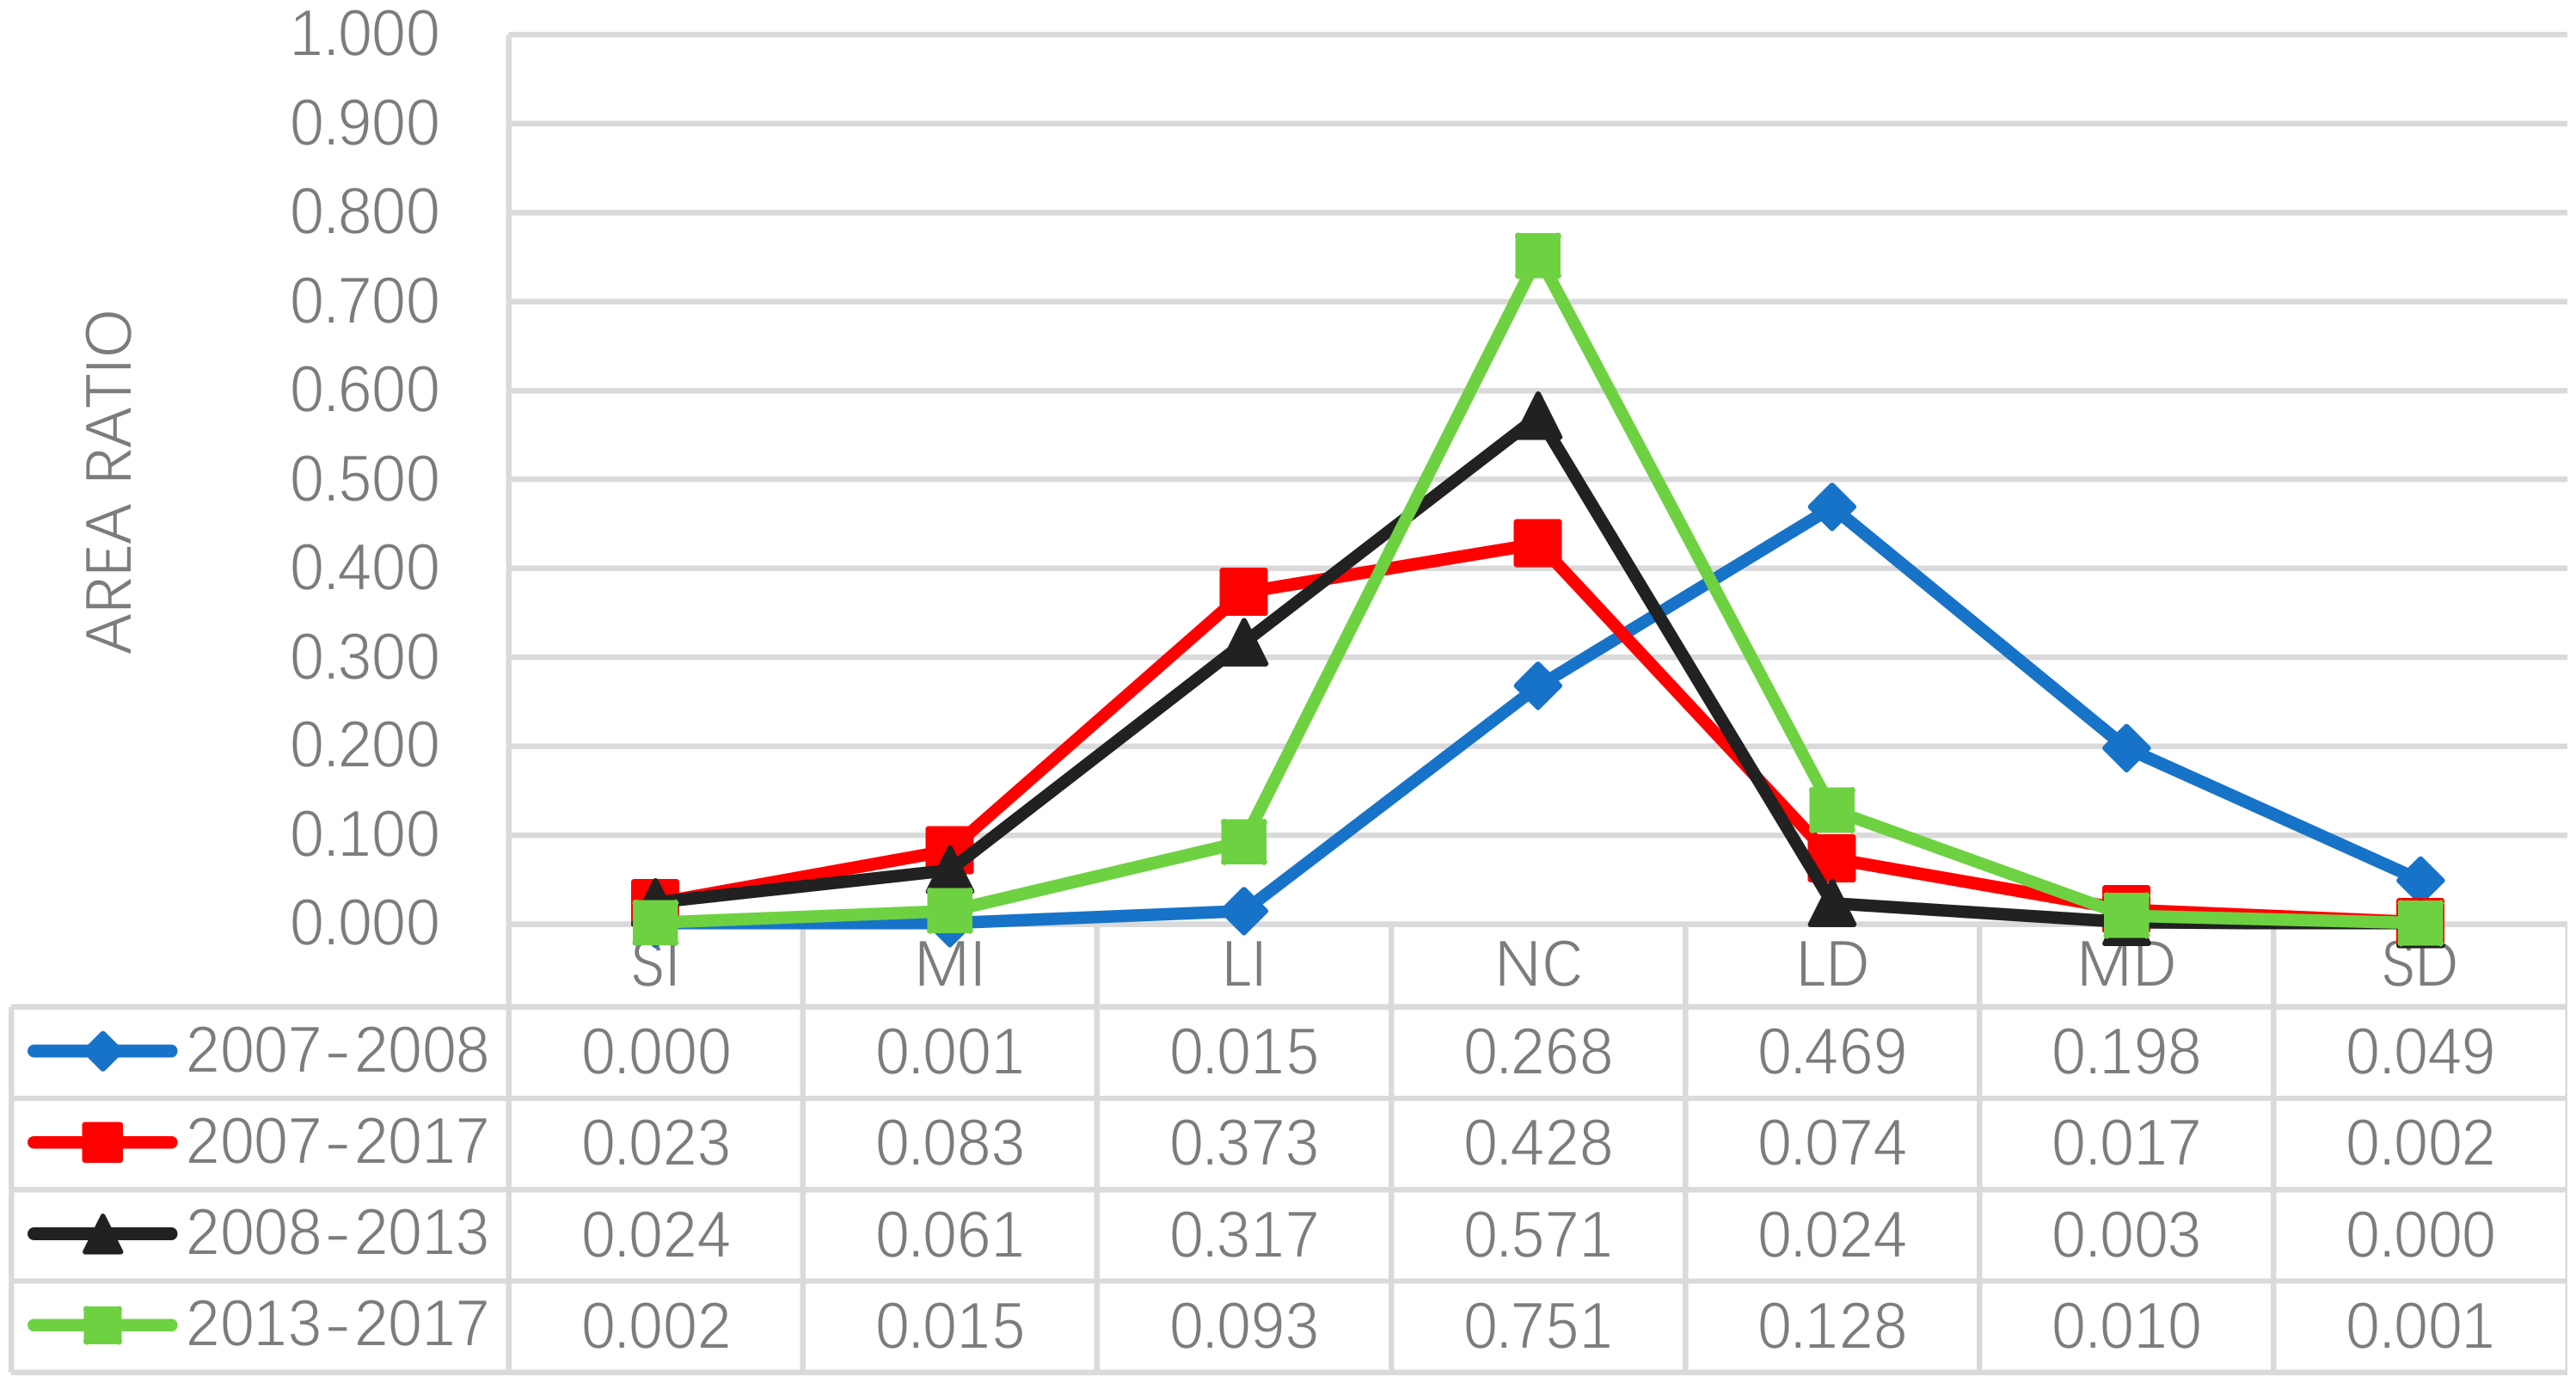
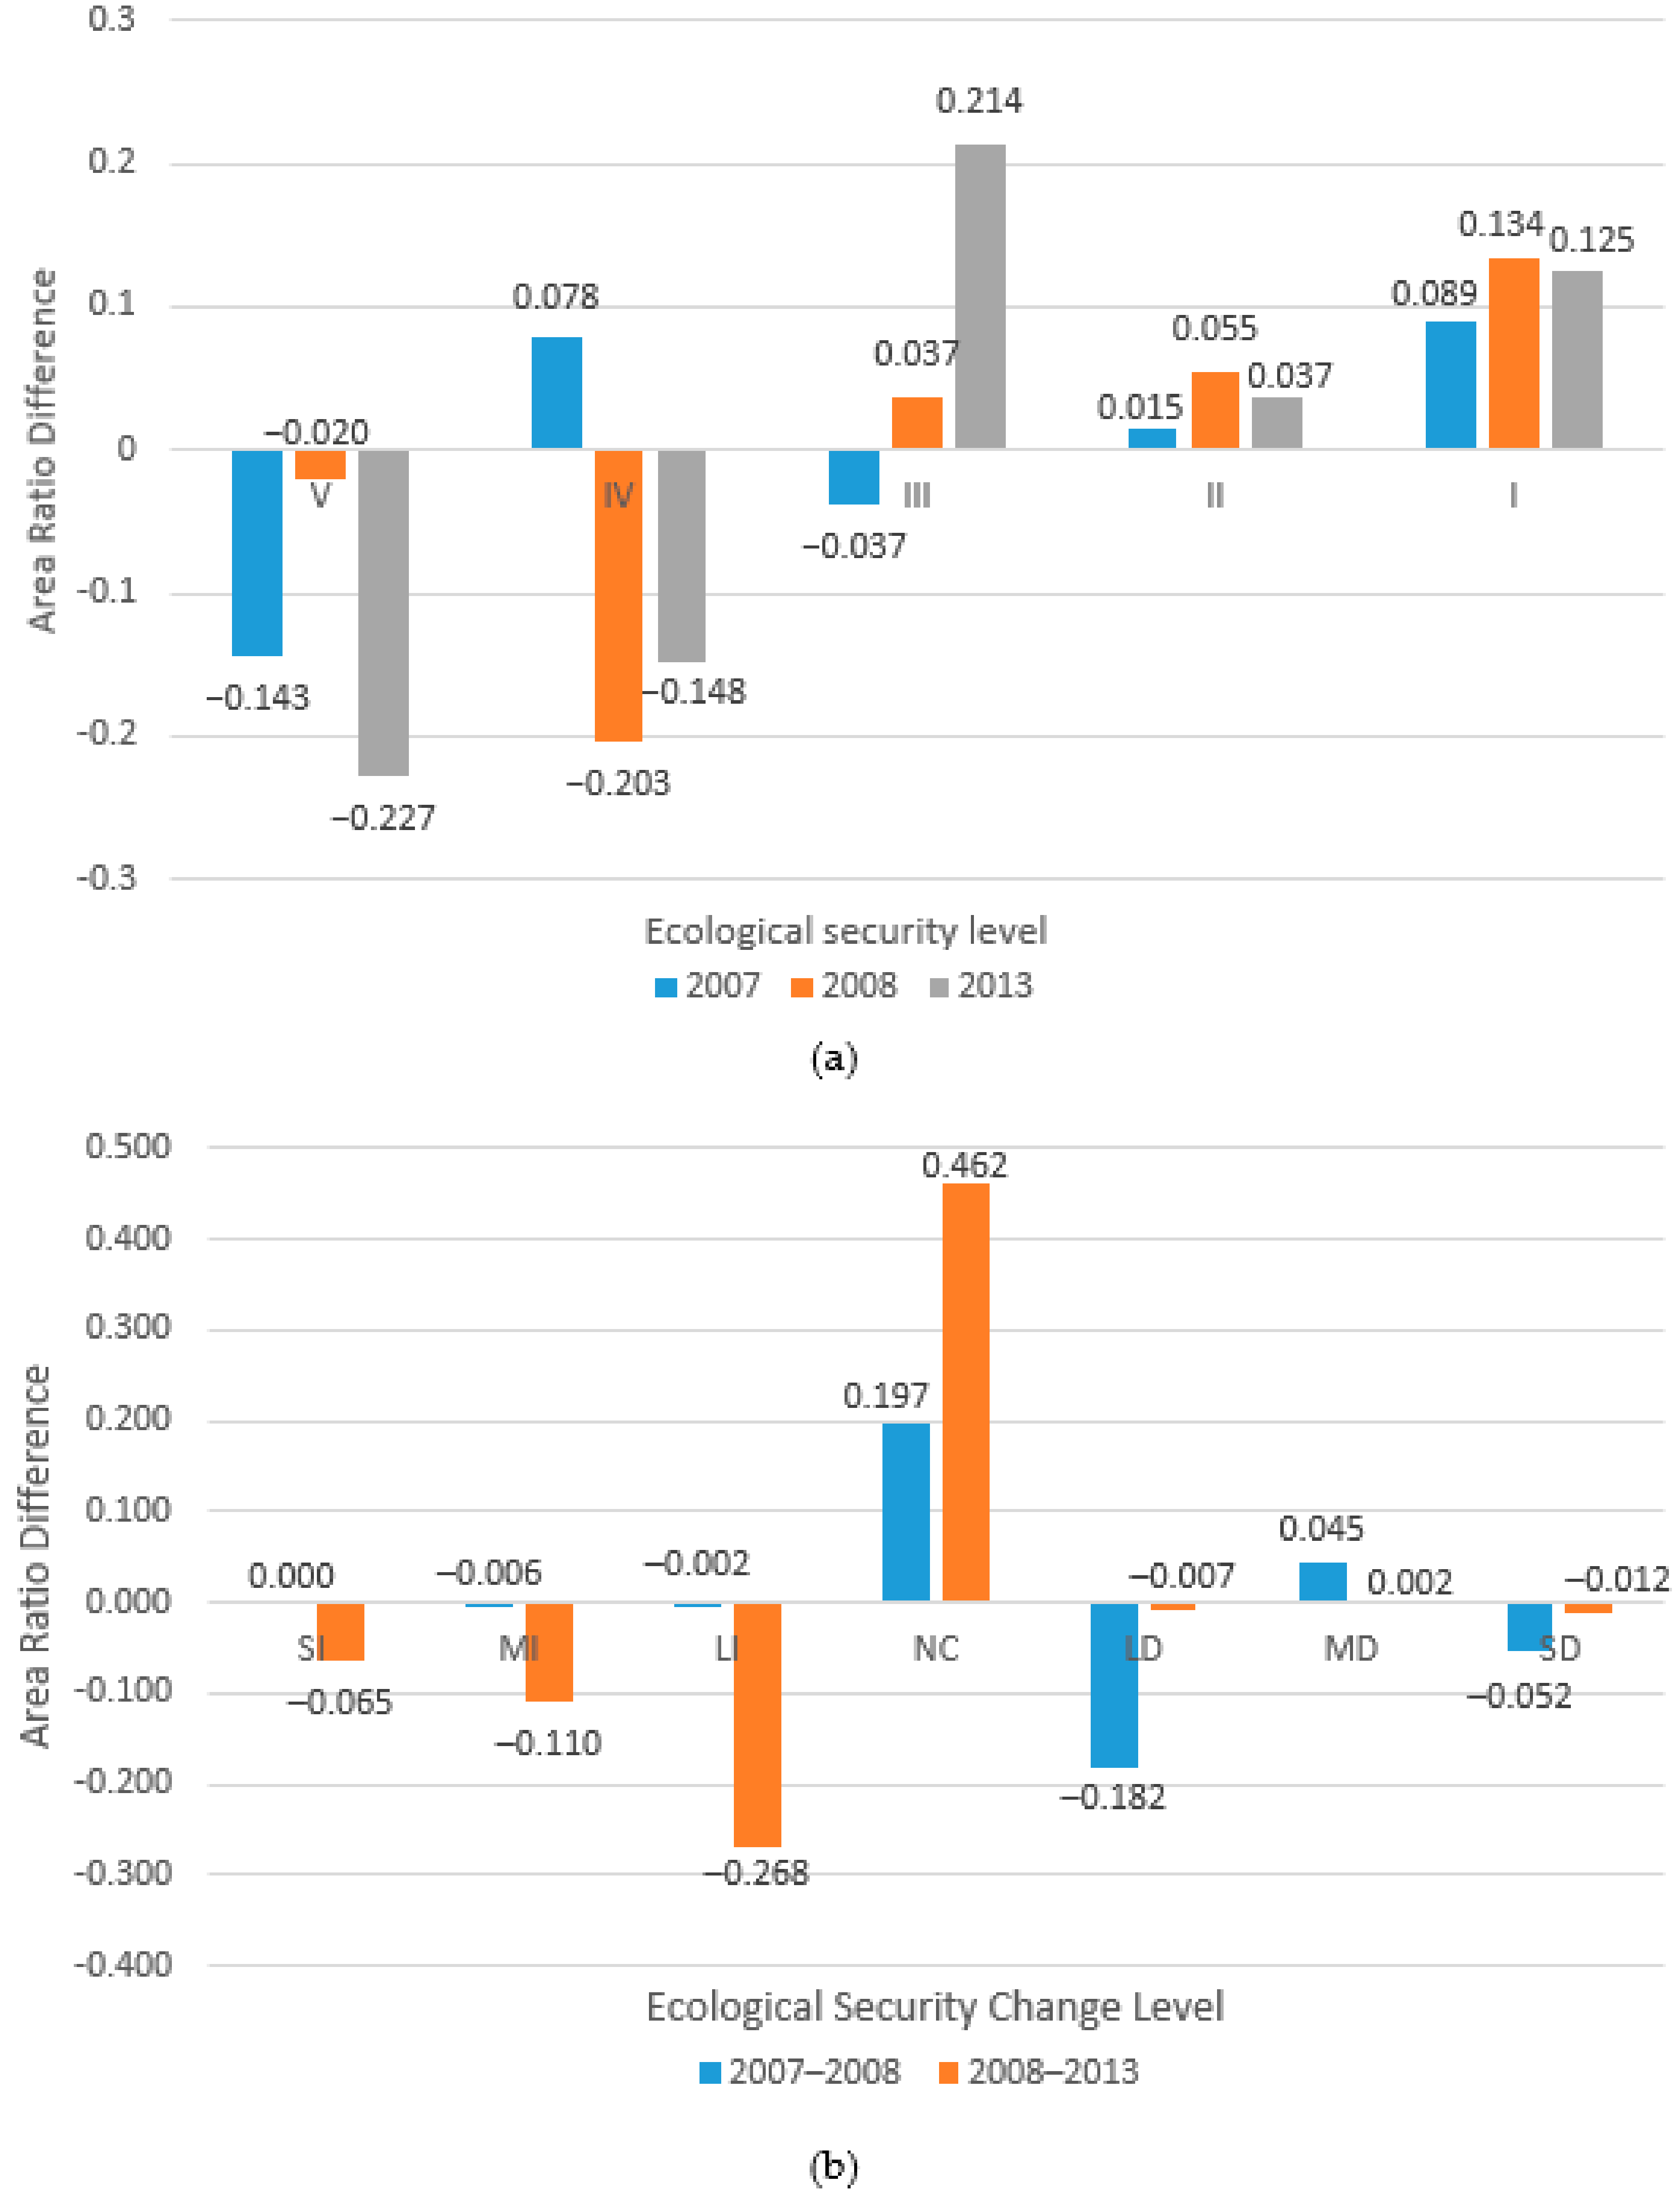
The difference between the results obtained in this study and those obtained by Cao et al. is shown in Figure 8, where Figure 8a is the area ratio difference of different ecological levels in 2007, 2008, and 2013, and 8b is the difference in area ratios for different ecological security change levels for 2007–2008 and 2008–2013. Combined with specific values and figures, it can be seen that the results obtained by the two studies have a relatively consistent trend as a whole, but there are significant differences in individual data items. In 2007, the largest area proportion oof ecological safety level in the two studies was V, but the value obtained in this study was 46.4%, and the value obtained by Cao et al. is 60.7%. In 2008, Cao showed that the proportion of the region with a “critically safe” rating and below was 39.2%, and the corresponding value in this study was 61.8%. Cao’s research showed that the proportion of the region with a “critically safe” rating and above was 92.4%, while the corresponding value in this study was 76.3%. For 2007–2008 and 2008–2013 ecological security change levels, the two studies had obvious differences in the LI, NC, and LD levels. However, LI, NC, and LD are three adjacent levels, all of which indicate small changes, and it is possible to make a difference due to variations in rank.
Based on the above analysis, the results of this study and the two other studies on the ecological environment of Wenchuan County are different. One of the reasons is that the latter two studies both use the comprehensive index method for environmental assessment and the Analytic Hierarchy Process (AHP) to determine the index weight. The results of this study were quite different from those of Hu. This may because Hu’s evaluation object was on ecological environment quality, and the selected evaluation index was very different from this paper. Because the evaluation objects were consistent, this study and Cao’s research were more uniform in the selection of indicators, but due to the different data used, the calculation method of indicators, and the method of determining the weights, the final results still had differences. In the overall trend, this study was consistent with the two other studies, so the results obtained in this study have a certain reference significance.

5. Conclusions

The present study evaluated ecological security using the PSR model and presented indicators based on the available data. Multisource remote-sensing image and statistical data were used to calculate the evaluation index, and weights of indicators were determined by entropy. At the same time, gray-correlation analysis was used to evaluate the restoration of the ecological environment after the Wenchuan County earthquake. The calculated ecological security correlation was divided into five grades, from “safe” to “very unsafe”. We evaluated the difference in ecological safety level in 2007–2008, 2008–2013, 2013–2017, and 2007–2017. Based on the discussed results, the changes in ecological safety were classified and divided into seven classes. Finally, the security correlation of the pressure, status, and response layers was calculated, and the impact of each indicator in each layer on ecological safety was analyzed. Based on the detailed analysis, the following conclusions were drawn:
(1)
The 2008 earthquake caused substantial reduction in the level of ecological security in Wenchuan County compared to 2007. After five years of recovery, the overall level of ecological security in Wenchuan County in 2013 has significantly improved. In the next four years, the ecological security level in Wenchuan County continued to improve, but it was still worse than that in 2007, before the earthquake.
(2)
In 2008, the security level of the pressure layer in almost all areas was above “critically safe”. Due to the reduced security of the state layer caused by the earthquake and poor resistance to the deteriorating environment, the security correlation of the response layer was low and, the overall level of ecological security in 2008 was lower than the other three years. The ecological status of Wenchuan County in 2007 was inferior to that of 2017 since the degree of security correlation of its status layer was lower than that of 2007. However, the environmental pressure in Wenchuan County in 2017 was lower than in 2007, and the environmental response capability was very strong. Therefore, the overall ecological safety level that was enhanced in 2017 was high.
Our results clearly show that Wenchuan County currently has a high degree of ecological security, with a good environmental status and strong environmental response. However, environmental pressure is relatively high due to economic development, increasing urbanization rate, and other reasons; the environmental conditions of some regions have not recovered to the ecological conditions that existed prior to the earthquake. The areas still need to maintain ecological environment stability.

Author Contributions

Conceptualization, M.X.; Data Curation, Z.H. and X.L.; Formal Analysis, Z.H.; Supervision, C.C.; Visualization, Z.H.; Writing—Original Draft, Z.H.; Writing—Review & Editing, W.C. and R.P.S.

Funding

The present study paper was supported by the National Key Research and Development Program of China (Grant No. 2017YFD0600903) and Technological Basic Special Funds (No. 2013FY1118063).

Acknowledgments

The author is very grateful to reviewers and editors for their helpful and constructive comments on the manuscript.

Conflicts of Interest

The authors declare no conflicts of interest.

References

  1. Qu, G. The Problems of Ecological Environmental Have Become a Popular Subject of Country Safety. Environ. Prot. 2002, 5, 3–5. [Google Scholar] [CrossRef]
  2. Yang, H. Ecological Security Assessment of Hebei by PSR Model. Environ. Sci. Manag. 2017, 42, 185–189. [Google Scholar]
  3. Liao, C.; Li, L.; Yan, Z.; Hu, B. Ecological Security Evaluation of Sustainable Agricultural Development in KARST Mountainous AREA—A Case Study of Du’an Yao Autonomous County in Guangxi. Chin. Geogr. Sci. 2004, 14, 142–147. [Google Scholar] [CrossRef]
  4. Zhang, F.; Tashpolat, T.; Cao, X.; Ding, J.; Zhang, Y.; Jiang, H. Spatial and Temporal Change of Landscape Pattern and Ecological Security Assessment of Ebinur Lake Watershed in Inland Arid Region. Bull. Soil Water Conserv. 2015, 35, 249–255. [Google Scholar]
  5. Dong, D.; Sun, X.; Wei, Y.; Wang, W. Assessment of Ecological Security for Shuifeng Lake Based on the DPSIR Model. J. Hebei Univ. (Nat. Sci. Ed.) 2017, 37, 630–639. [Google Scholar]
  6. Zuo, W.; Zhou, H.; Zhu, X.; Wang, Q.; Wang, W.; Wu, X. Integrated Evaluation of Ecological Security at Different Scales Using Remote Sensing: A Case Study of Zhongxian County, the Three Gorges Area, China. Pedosphere 2005, 15, 456–464. [Google Scholar]
  7. Shao, H.; Xian, W.; Yang, W.; Huang, J.; Liu, Z. Ecological Environment Quality Evaluation in Mining City—A Case of Panzhihua. In Proceedings of the 2009 Joint Urban Remote Sensing Event, Shanghai, China, 26 June 2009; pp. 1–6. [Google Scholar]
  8. Cabello, J.; Fernandez, N.; Alcaraz-Segura, D.; Oyonarte, C.; Pineiro, G.; Altesor, A.; Delibes, M.; Paruelo, J.M. The Ecosystem Functioning Dimension in Conservation: Insights from Remote Sensing. Biodivers. Conserv. Event 2012, 21, 3287–3305. [Google Scholar] [CrossRef] [Green Version]
  9. Zhu, Q.; Wang, Y. Research on the Restoration and Protection of Post-Disaster Ecological Environment in Wenchuan County. West China Dev. Rev. 2012, 50–57. [Google Scholar]
  10. Yan, L.; Ren, Y.; Chen, C.; Yao, J.; Chen, W.; Huang, X.; Wang, S. Geographic Epidemiology Methods for Analysis of Disease Outbreaks in An County after Wenchuan Earthquake. J. Geo-Inf. Sci. 2009, 11, 349–354. [Google Scholar] [CrossRef]
  11. Cao, C.X.; Chang, C.Y.; Xu, M.; Zhao, J.; Gao, M.X.; Zhang, H.; Guo, J.P.; Guo, J.H.; Dong, L.; He, Q.S.; et al. Epidemic Risk Analysis after the Wenchuan Earthquake Using Remote Sensing. Int. J. Remote Sens. 2010, 31, 3631–3642. [Google Scholar] [CrossRef]
  12. Guo, H.D.; Liu, L.Y.; Lei, L.P.; Wu, Y.H.; Li, L.W.; Zhang, B.; Zuo, Z.L.; Li, Z. Dynamic Analysis of the Wenchuan Earthquake Disaster and Reconstruction with 3-Year Remote Sensing Data. Int. J. Digit. Earth 2010, 3, 355–364. [Google Scholar] [CrossRef]
  13. Xu, M.; Cao, C.X.; Zhang, H.; Guo, J.P.; Nakane, K.; He, Q.S.; Guo, J.H.; Chang, C.Y.; Bao, Y.F.; Gao, M.X.; et al. Change Detection of an Earthquake-Induced Barrier Lake Based on Remote Sensing Image Classification. Int. J. Remote Sens. 2010, 31, 3521–3534. [Google Scholar] [CrossRef]
  14. Hu, B.R. Evaluation on the Ecological Environments before and after 5.12 Wenchuan Earthquake by Remote Sensing and GIS. Master’s Thesis, Chengdu University of Technology, Chengdu, China, 2009. [Google Scholar]
  15. Wang, M. Application of 3S Technology in Geological Disasters Monitoring and Analysis of Geological Disasters Sensitive Areas in Yingxiu Town-Yinxing Township of Wenchuan County. Master’s Thesis, Chengdu University of Technology, Chengdu, China, 2015. [Google Scholar]
  16. Gong, J.; Liu, Y.; Xia, B.; Zhao, G. Urban Ecological Security Assessment and Forecasting Based on a Cellular Automata Model: A Case Study of Guangzhou, China. Ecol. Model. 2009, 220, 3612–3620. [Google Scholar] [CrossRef]
  17. Li, H.; Nan, L.; Li, S. Evaluation of Land Ecological Security Based on Panel Data Cluster Analysis: A Case Study in Shaanxi Province. Areal Res. Dev. 2017, 36, 136–141. [Google Scholar]
  18. Zhang, F.; Wang, L.; Su, W. Evaluation of Land Ecological Security in Chongqing Based on the Matter-Element Analysis-DPSIR Model. China Environ. Sci. 2016, 36, 3126–3134. [Google Scholar]
  19. Ning, Y.; Zhao, W.; Li, B.; Zhang, P. Land Use Ecological Security Analysis in Baoding City Based on Improved Ecological Footprint Model. Guizhou Agric. Sci. 2015, 43, 175–179. [Google Scholar]
  20. Guo, X. Application of Grey Correlation Method in Evaluation of Regional Competitiveness. Decis. Ref. 2004, 5, 54–59. [Google Scholar] [CrossRef]
  21. Hammond, A.L. Environmental Indicators: A Systematic Approach to Measuring and Reporting on Environmental Policy Performance in The Context of Sustainable Development; World Resource Institute: Washington, DC, USA, 1995. [Google Scholar]
  22. Zhang, F.; Su, W.; Zhou, J. Assessment of Urban Ecological Security Based on Entropy-Weighted Gray Correlation Analysis. Chin. J. Ecol. 2008, 27, 1249–1254. [Google Scholar]
  23. Du, L.M.; Li, X.S.; Wu, B.F.; Pei, L. Spatial fuzzy assessment of regional eco-security in fast urbanizing area. Urban Environ. Urban Ecol. 2011, 24, 1–4. [Google Scholar]
  24. Zeng, C. Dynamic Evaluation of Landscape Pattern and Ecological Vulnerability in Yuanjiang City. Master’s Thesis, Central South University of Forestry and Technology, Changsha, China, 2015. [Google Scholar]
  25. Guo, Y. The Study of Ecological Construction of Green Patch of Fuzhou. Master’s Thesis, Fujian Agriculture and Forestry University, Fuzhou, China, 2010. [Google Scholar]
  26. Shen, J.; Wang, X. Spatial-Temporal Changes in Ecological Risk of Land Use before and after Grain-for-Green Policy in Zhengning County, Gansu Province. J. Resour. Ecol. 2013, 4, 36–42. [Google Scholar] [CrossRef]
  27. Cao, C.; Yang, B.; Xu, M.; Li, X.; Singh, R.P.; Zhao, X.; Chen, W. Evaluation and Analysis of Post-Seismic Restoration of Ecological Security in Wenchuan Using Remote Sensing and GIS. Geomat. Nat. Hazards Risk 2016, 7, 1–18. [Google Scholar] [CrossRef]
Figure 1. Location of the studied area.
Sustainability 10 03990 g001
Figure 2. Evaluation results of ecological security in (a) 2007, (b) 2008, (c) 2013, and (d) 2017.
Sustainability 10 03990 g002
Figure 3. Statistics of the area ratio of ecological conditions in 2007, 2008, 2013, and 2017.
Sustainability 10 03990 g003
Figure 4. Changes of ecological conditions (a) from 2007 to 2008, (b) from 2008 to 2013, (c) from 2013 to 2017, and (d) from 2007 to 2017.
Sustainability 10 03990 g004
Figure 5. Statistics of ecological security changes in 2007, 2008, 2013, and 2017.
Sustainability 10 03990 g005
Figure 6. Statistics of levelled Pressure-State-Response (PSR) in 2007, 2008, 2013, and 2017.
Sustainability 10 03990 g006
Figure 7. Area ratio of different land types in 2007, 2008, 2013, and 2017.
Sustainability 10 03990 g007
Figure 8. Difference between results obtained in this study and those obtained by Cao et al.: (a) area-ratio difference of different ecological levels in 2007, 2008, and 2013; (b) area-ratio difference for different ecological security change levels for 2007–2008 and 2008–2013.
Sustainability 10 03990 g008
Table 1. Introduction to the datasets.
NameAcquisition TimeAcquisition Source
Landsat-5 TM18 September 2007USGS
18 July 2008
Landsat-7 ETM+17 August 2013
11 July 2017
ALOS4 January, 2 February, and 21 December 2007Alaska Satellite Facility
7 January, 5 February, 8 April, 24 May, 5 June, 22 June 2008
12 January, 10 February 2010
13 February, 2 May 2011
Sentinel-1A7 January, 28 December 2017ESA
ASTER GDEM2009
Surface climate daily data in China2007, 2008, 2013, 2017China Metereological Data-Sharing Service System
NPP2007, 2008, 2013, 2014NASA
Statistical data2007, 2008, 2013, 2016Sichuan Statistical Yearbook
Table 2. Evaluation indicators.
Object LayerCriterion LayerIndex LayerDirectionAcquisition Source
Evaluation system of ecological securityPressure layerPopulation densityStatistical data
Rural electricity consumption
Geological-disaster intensityRemote-sensing images
State layerLand-use index+
CONTAG+
Perimeter-area fractal dimension+
Splitting
AltitudeMeteorological data
Slope
Response layerAridity indexRemote-sensing images
Net primary productivity+
Per capita GDP+Statistical data
Number of junior middle-school students+
Number of health workers in hospitals and health centers+
Table 3. Ecological security level.
Evaluation LevelCodeCorrelation Degree
Very unsafeI≤0.35
UnsafeII0.35–0.45
Critically safeIII0.45–0.55
Comparatively safeIV0.55–0.65
SafeV>0.65
Table 4. Ecological security level.
Time2007200820132017
Mean0.6050.4660.5260.596
Variance0.0270.0280.0270.025
Table 5. Indicator scores in the pressure layer.
2007200820132017
Population density0.5260.7510.7170.747
Rural electricity consumption0.8621.0000.3790.029
Average score of geological hazard indicators0.7550.5150.5570.760
Table 6. Landscape index scores.
PafracSplitContag
20070.4470.5000.809
20080.4440.3940.745
20130.4190.5740.815
20170.3870.4130.755
Table 7. Scores of Indicators in Response Layer.
2007200820132017
Per capita GDP0.9220.4941.0001.000
The number of middle school students0.2980.2050.2120.150
The number of hospital technicians0.6260.6390.8851.000
Mean score of standardized npp0.6130.5860.6080.567
Mean score of standardized aridity0.0540.5000.8390.597

