Multi-Criteria Evaluation Framework in Selection of Accelerated Bridge Construction (ABC) Method


1
School of Transportation Engineering, Shandong Jianzhu University, Jinan 250101, Shandong, China
2
Department of Civil and Environmental Engineering, Florida International University, 10555 W. Flagler Street, EC 3730, Miami, FL 33174, USA
*
Author to whom correspondence should be addressed.
Sustainability 2018, 10(11), 4059; https://0-doi-org.brum.beds.ac.uk/10.3390/su10114059
Submission received: 8 October 2018
/
Revised: 22 October 2018
/
Accepted: 1 November 2018
/
Published: 6 November 2018
(This article belongs to the Section Sustainable Transportation)
Abstract
:Accelerated Bridge Construction (ABC) is bridge construction that uses innovative planning, design and construction methods in a safe and cost-effective manner, which reduces construction mobility and environmental impacts, and contributes to city sustainable planning and development. To deal with the pressing need to support the decisions associated with the selection between the ABC and conventional bridge construction, this paper presents the development of a multi-criteria evaluation framework. Methods are developed and identified to estimate the construction, agency, and user costs associated with the construction methods. A novel model was developed to allow the estimation of the construction and agency costs of ABC relative to conventional construction. This paper also demonstrates the estimation of user costs, including those associated with mobility, reliability, safety, and emissions, utilizing combinations of the proposed prediction method. The paper then compares the use of the return-on-investment and Technique for Order Performance by Similarity to Ideal Solution (TOPSIS) Multi-Criteria Decision Making (MCDM) evaluation approaches in the decision to select between ABC and conventional bridge construction. The results from the employment of the two approaches to a case study demonstrate the advantage of using the TOPSIS approach, which is also applicable in the urban planning process.
1. Introduction
According to the United States Department of Transportation (USDOT), 25.9% of all the bridges in the United States are either structurally deficient or functionally obsolete. There is therefore a pressing need for significant bridge repair and replacement efforts [1]. These bridge projects create a challenge to State Transportation Agencies (STAs) to minimize the associated costs and impacts on traffic, associated with the construction. In an effort to combat this challenge, the Federal Highway Administration (FHWA) is adopting and promoting the implementation of accelerated bridge construction techniques (ABC) through the “Every Day Counts” initiative to expedite project delivery and minimize their impacts on the transportation network [2].
Accordingly, a number of STAs are implementing ABC techniques and have experienced positive outcomes in a significant number of bridge replacement and/or rehabilitation projects. However, ABC techniques are often associated with high initial costs, which deter many STAs from a wider implementation of these techniques [3]. Therefore, there is a pressing need to provide decision makers with the appropriate tools to support the decisions associated with ABC versus conventional bridge construction including: construction costs, agency cost, and user costs. This paper presents a framework for analyzing and estimating the ABC impacts, compares them to those of conventional construction methods, and utilizes the results in decision-making processes. The aim is to support agency decisions when selecting between conventional and ABC bridge construction approaches. The paper explores the methods for the estimation of construction, agency, and user costs and uses the results from the estimation as inputs to a return on investment (present-worth) analysis and a Technique for Order Performance by Similarity to Ideal Solution (TOPSIS) Multi-Criteria Decision Making (MCDM) analysis. The decision recommendations based on these two analysis approaches are compared for a real-world case study.
2. Literature Review
Assessing the total costs associated with ABC versus conventional bridge construction methods requires the evaluation of construction costs, engineering and inspection costs, user costs, ecological costs, revenue loss costs, right of way, quality of work, and the impact on surrounding communities and businesses [4].
Qualitative decision support tools are simple in application while there are only a few evaluation criteria. One of the qualitative tools is the FHWA flowchart that is designed to assist decision makers in determining the use of prefabricated bridges concerning the construction schedule, location, safety and traffic impacts [5]. On the other hand, quantitative method, such as life-cycle cost analysis (LCCA), is also used in bridge construction projects. Kendall et al. developed a life-cycle costs analysis model to compare alternative bridge deck designs from a sustainability perspective that accounts for agency, user, and environmental costs [6]. The results show that the mobility costs related to construction compromise 90% of the total costs. In the research from Safi et al., the life-cycle considerations are incorporated into bridge investment and management decision-making processes with optimizing the use of taxpayers’ money [7]. Antunes et al. developed the life-cycle costs assessment tool for pavement structure alternatives concerning the technical, economic and environmental factors [8]. The proposed tool was simple and useful to select the ideal paving solutions in the case study. However, more and more factors, that are difficult to quantify, need to be considered in the decision-making process, which makes the employment of LCCA restricted.
To deal with the complex decision-making process in bridge construction projects, the Multi-Criteria Decision-Making (MCDM) approach involving both qualitative and quantitative factors was widely used. A variety of MCDM methods and techniques, including AHP (Analytic Hierarchy Process), SAW (Simple Additive Weighting), COPRAS (COmplex PRoportional ASsessment), TOPSIS (Technique for Order of Preference by Similarity to Ideal Solution) and so on, were employed in the decision-making practice [9]. Among them, the analytic hierarchy process (AHP) is one of the most popular MCDM method. Youssef at al. developed an intelligent Decision Support System based on the AHP method that helps construction professionals and designers during the early stages of a construction project [10]. The research found that the bridge physical characteristics and stake holders’ objectives could also affect final evaluation. In the research from [11,12,13,14], the decision-making systems to determine the weights of both qualitative and quantitative factors, such as environmental, economic and social aspects, was built based on the AHP method. The case studies illustrated the capability of the AHP method in the decision-making process. Nevertheless, in order to make the AHP method more flexible, the integrated AHP method was also developed and implemented. According to the maintenance priorities, Wang et al. proposed an integrated AHP–DEA methodology for bridge risks assessment of different bridge structures [15]. The new method was able to deal with any number of criteria. Aghdaie et al. explored to prioritize the construction projects of footbridge, considering the total cost, environmental factors, and socio-economic factors using integrated AHP and COPRAS-G methods [16]. Bitarafan et al. proposed an integrated MCDM approach based on the SWARA and WASPAS methods to evaluate the real-time intelligent sensors for monitoring the structural health of bridges [17]. The evaluation criteria were obtained through an expert survey. Ardeshir et al. developed a hybrid decision-making method based on the Geographic Information System (GIS) and AHP methods and applied it to bridge construction site selection [18]. Moreover, in order to handle the uncertainty of subjective judgement, the fuzzy AHP method was developed to select the bridge construction method [19]. The fuzzy triangular number was proposed to solve the uncertainty and vagueness, and the results present the capability of the new approach.
Another popular MCDM method is the Technique for Order Performance by Similarity to Ideal Solution (TOPSIS) method. TOPSIS was first developed by Hwang and Yoon [20] and is based on the concept that the chosen alternative should have the shortest distance from the positive ideal solution (PIS) and the farthest from the negative ideal solution (NIS). Zavadskas et al. reviewed the papers which developed, extended, proposed and presented TOPSIS approach for solving decision-making (DM) problems [21]. The conclusions present the wide use of TOPSIS method in business, engineering and other fields. Kannan et al. proposed a framework using Fuzzy TOPSIS to select green suppliers for a Brazilian electronics company [22]. The framework is built on the criteria of green supply chain management (GSCM) practices. Guo et al. employed the fuzzy TOPSIS method to select the Electric Vehicles site from a sustainability perspective, which consists of environmental, economic and social criteria [23]. A sensitivity analysis indicates that the selection of the alternative is no matter with the sub-criteria weight change. Selim et al. developed a maintenance planning framework to reduce and stabilize the maintenance costs of the manufacturing companies [24]. The framework is based on fuzzy TOPSIS and failure mode and effects analysis (FMEA) techniques and supports maintenance planning decisions in a dynamic way. For the decision-making process in construction projects, there are also several papers to explore the TOPSIS or integrated TOPSIS method. Wang et al. developed a fuzzy TOPSIS method based on alpha level sets and nonlinear programming, and its application in bridge risk assessment [25]. The results illustrate the better performance of using the fuzzy TOPSIS method. Taylan et al. proposed a fuzzy TOPSIS and AHP framework for construction projects selection and risk assessment considering time, cost, quality, safety and environment sustainability [26]. To deal with the imprecise or vague nature of complex decisions, Chaphalkar et al. deployed the fuzzy AHP and TOPSIS approach in the selection of bridge type in Pune city, respectively [27]. Both the AHP and TOPSIS methods suggested the same alternative. However, the TOPSIS method was simpler for use and robust in assessing more criteria than the AHP method.
As a summary, a variety of methods were developed and implemented to deal with the decision-making problem in construction projects. The LCCA method is applicable to assess the factors that can be quantified, while the AHP method is able to handle the decision-making problem with a few criteria. Nevertheless, in order to account for the imprecise or vague nature of complex decisions, the TOPSIS method is more applicable and flexible.
3. Methodology
In this paper, a framework was developed and employed to estimate the components of the total cost of ABC versus conventional construction methods, and to use these estimates as inputs to return-on-investment (present-worth) and TOPSIS MCDM analyses. The following sections describe the methods developed.
3.1. Construction Costs
Construction costs include the material, labor, and equipment costs needed to build the bridge, in addition to the contractor’s costs. Agencies still have no good answers regarding the relative costs of the two construction approaches. To help answering this question, a model was developed in this study to estimate and identify the expected construction costs expressed in $/ft2 for ABC bridges.
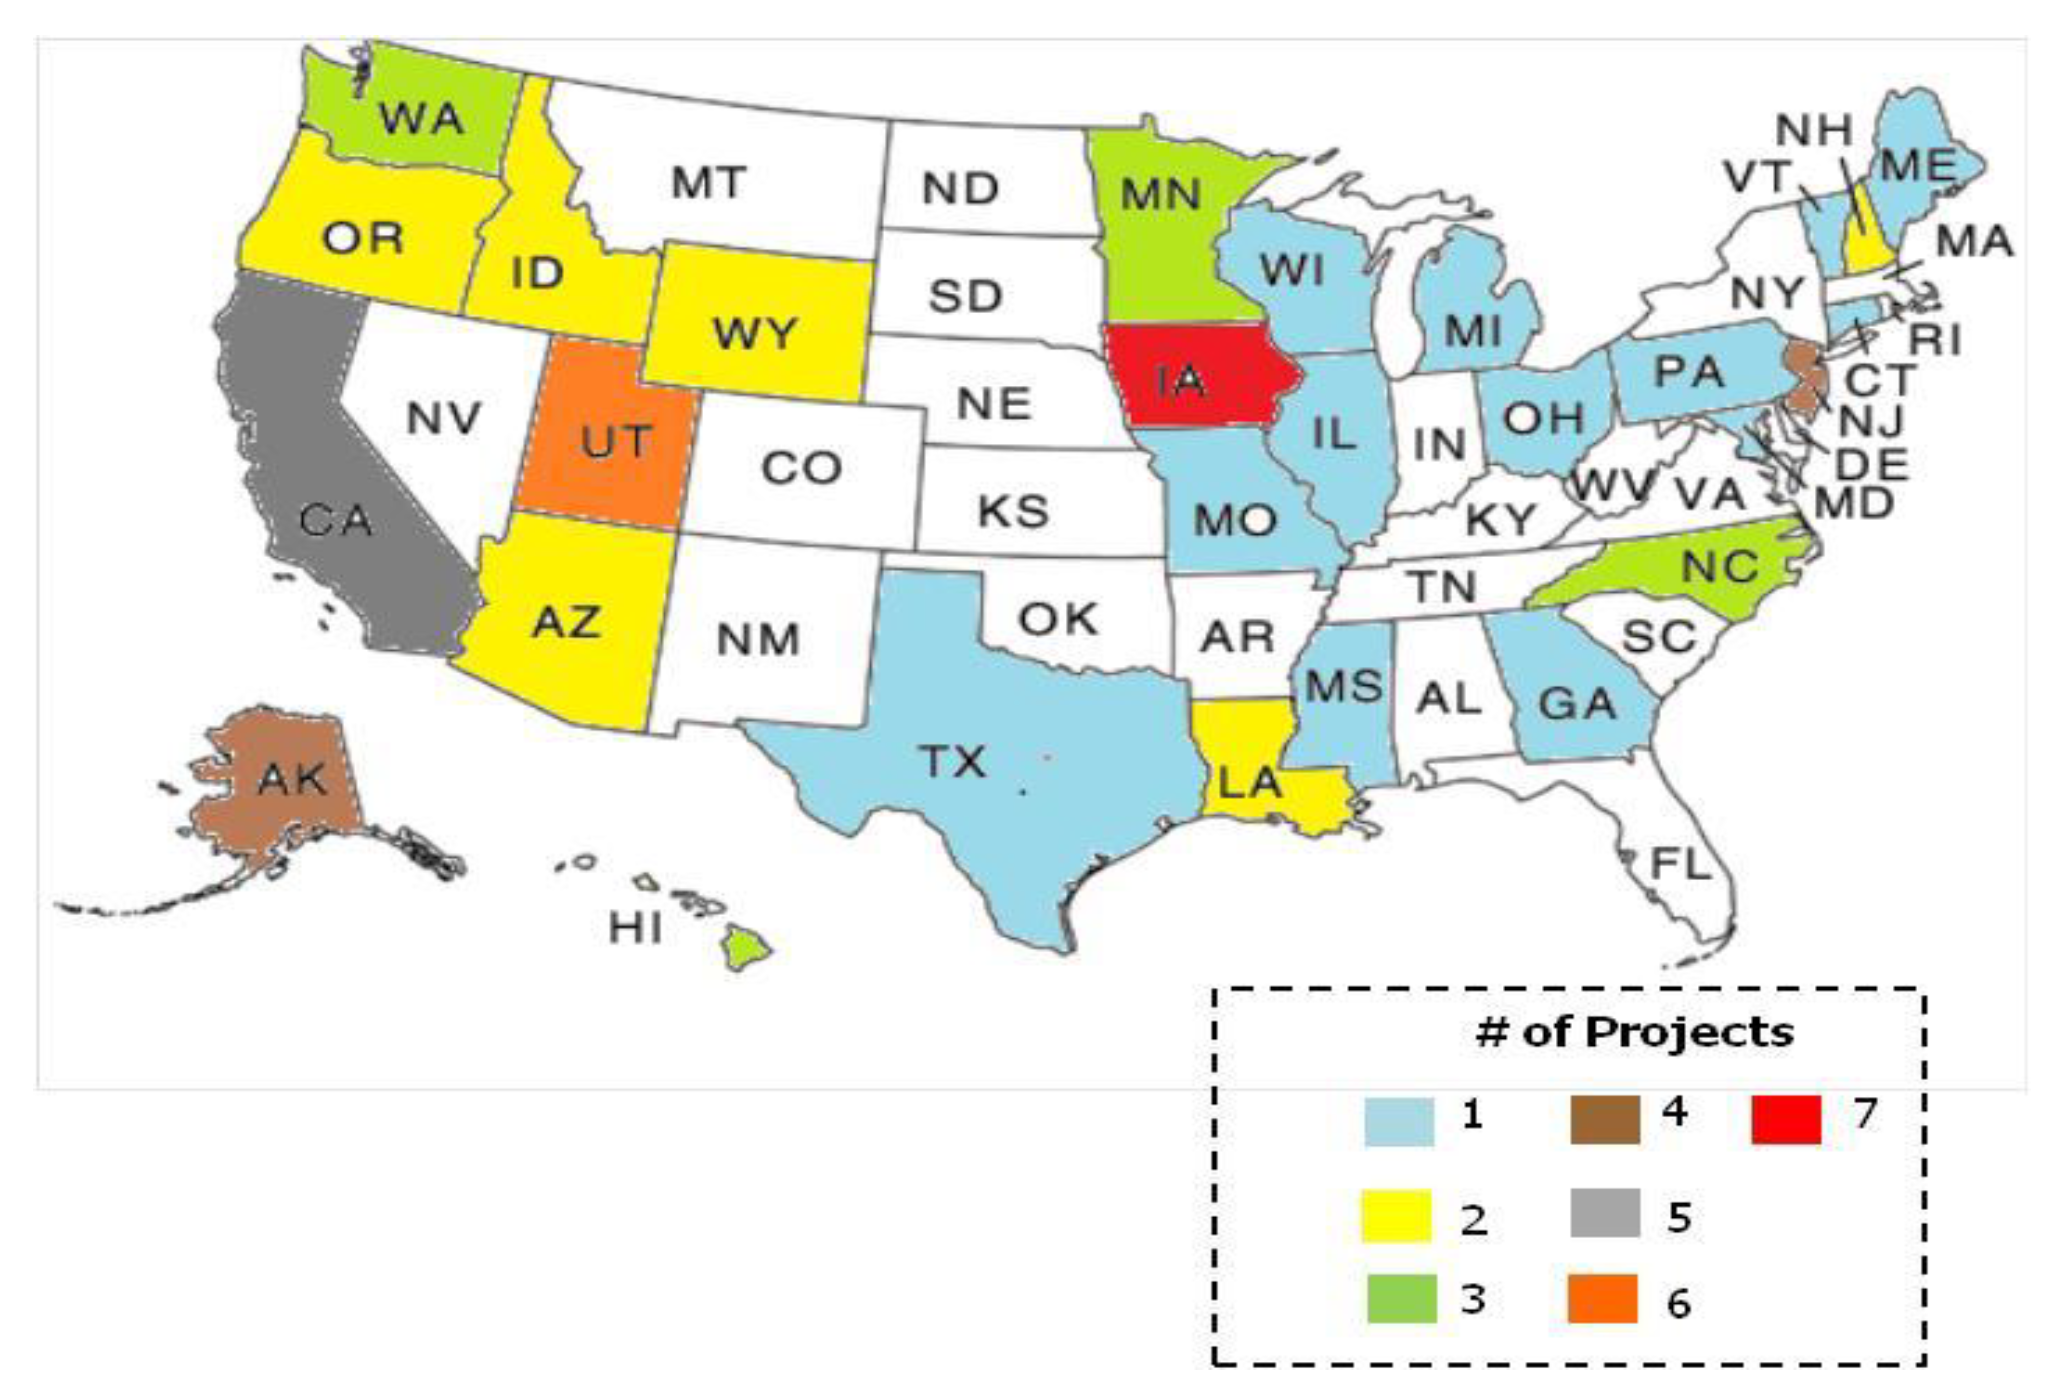
To develop the cost estimation model, historical data on construction costs of ABC projects was collected from the FHWA SharePoint database developed under the National ABC Project Exchange, which is an ongoing project sponsored by Florida International University—University Transportation Center. This database includes detailed information about a considerable number of nationwide ABC projects; including, but not limited to: construction schedule, type of structure, cost, and the ABC methods used. The cost data in the database includes the engineer’s estimate, bid, and final costs. The final construction cost is given per square foot and in some cases a comparison of the construction cost per square foot for the same bridge, if it was constructed conventionally, is given, which enabled the research team to conduct a comparative analysis between the costs of the two methods. Furthermore, follow-up emails and phone calls to transportation agency personnel was conducted to collect any missing data, where needed. In total, the research team was able to collect sufficient data for 65 ABC projects from 29 different states (as shown in Figure 1). The collected data cover bridges constructed between the years of 1998 and 2013 include ABC methods such as: self-propelled modular transporter (SPMT), lateral sliding, and pre-fabricated bridge elements & systems (PBES).
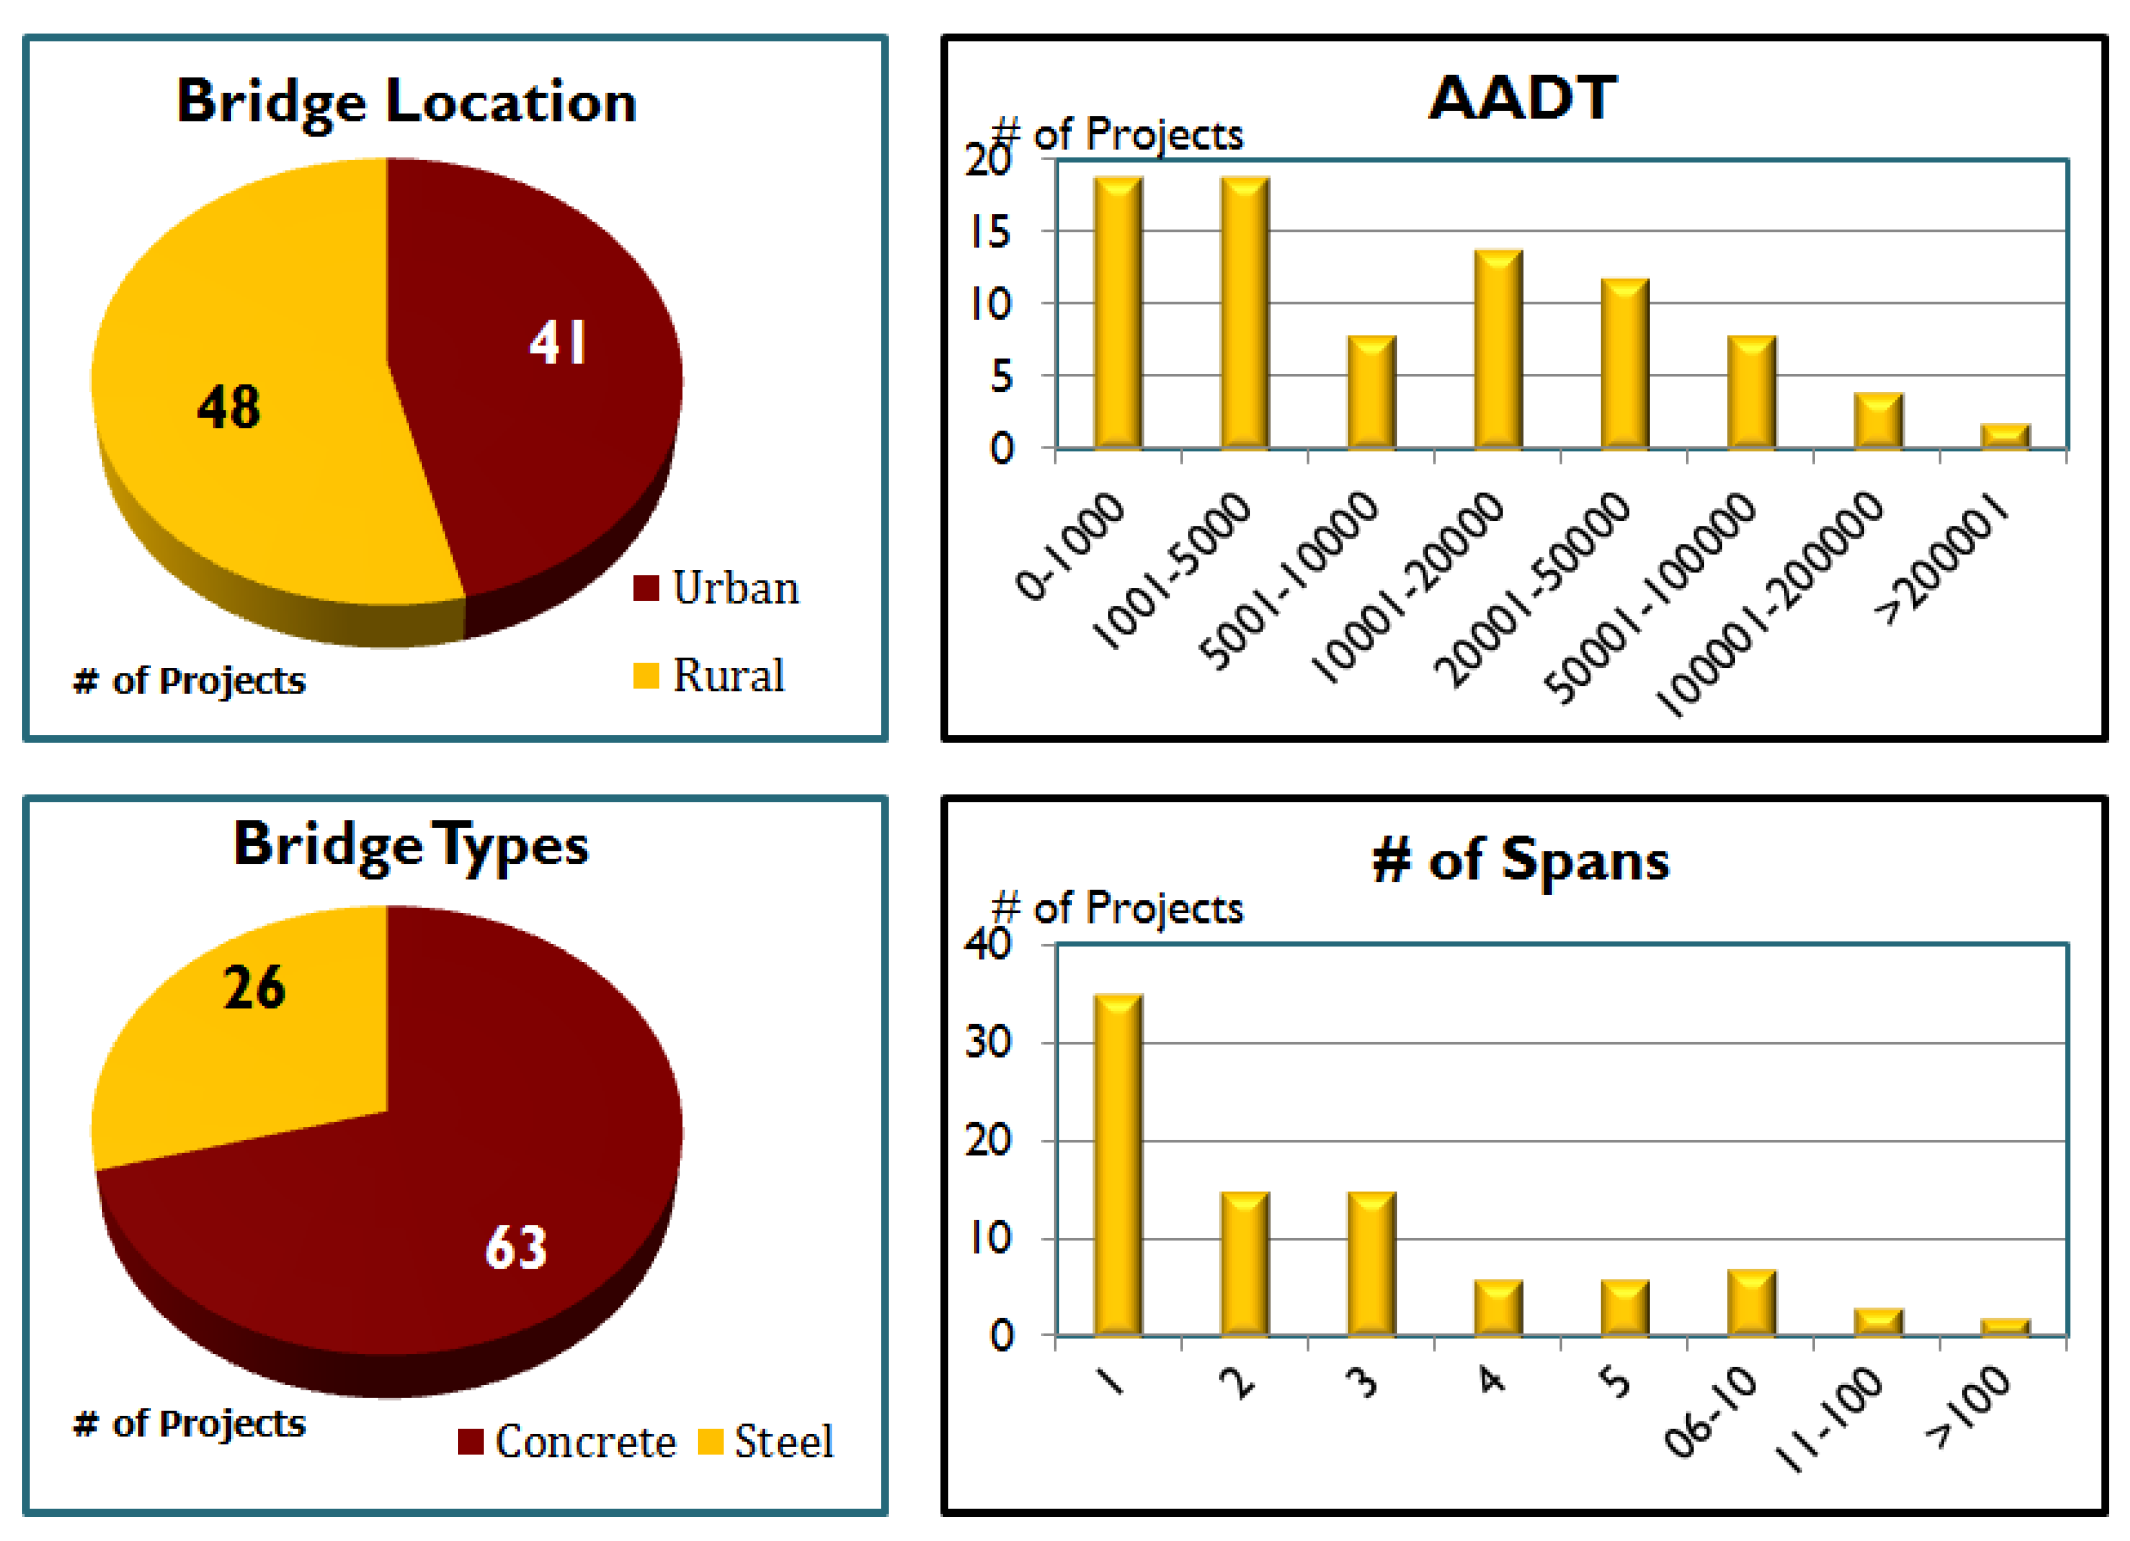
The collected cost data was normalized by time and location to allow for an accurate analysis. This normalization was performed using the time and location indices from the widely used RSMeans cost data [28]. All construction costs were adjusted to the year 2014. Similarly, construction costs were normalized to the national average using the indices correspondent to bridge locations. The data was grouped by four main variables: (i) bridge location, (ii) type (concrete/steel), (iii) annual average daily traffic (AADT), and (iv) number of spans. For example, 39 out of the 65 bridges were constructed in rural locations and 50 of them were concrete bridges (see Figure 2). The 65 bridges had spans ranging from a single span to seven spans, and the length of span ranges from 60 ft to 200 ft. The annual average daily traffic on these bridges ranges from, as low as few hundreds, to as high as 200,000 vehicles per day.
A classification and regression tree (C&RT) analysis was performed on the abovementioned grouped data using the Statistical Package for the Social Sciences (SPSS) software package. As shown in Table 1, the C&RT analysis showed that all of the aforementioned four characteristics had significant impacts on the final total construction cost of the ABC bridges with the AADT and number of bridge spans being the two factors with the highest impacts. The analysis shows that the prediction of the final cost per square foot of an ABC bridge improves considerably after categorizing the data by the number of spans and the AADT.
The aforementioned four independent variables were used to develop a model to estimate the range of construction costs per square foot for an ABC project using logit regression analyses. The AADT values used as independent variables in the model were divided into eight different intervals, each given a categorical value as shown in Table 2. The bridge type was categorized as: “0” for concrete bridges casted on site, “1” for concrete bridges pre-casted and “2” for steel bridges. A value of “0” was used for bridges in rural areas and “1” for urban areas. The construction cost was also categorized as shown in Table 3.
It is noteworthy that the predicted cost represents a national average due to the cost data normalization mentioned earlier and it is therefore important to adjust it to the specific location of the bridge under study. The RSMeans cost indices mentioned above can be used for this purpose [28]. To allow for comparing the predicted cost with the conventional construction methods, the average conventional bridge construction rates published by different state departments of transportation (DOTs), were summarized and used.
3.2. Other Agency Costs
An analysis of 10 projects from ODOT was used to identify any statistically significant difference in agency costs between ABC and conventional bridge construction methods. The considered costs in this category included preliminary engineering, right of way, construction engineering, and inspection costs. Due to limited data availability, statistical data analysis was performed only for preliminary engineering and construction engineering costs both of which did not show any statistically significant difference between ABC and conventional methods. The examined data seems to indicate that the agency cost can be approximately calculated as 20% of the construction cost for both conventional and accelerated bridge construction.
3.3. User Costs
A report by the FHWA presents a framework for the use of user and construction costs in construction alternative analysis [29]. The report also discusses how the unit cost of delays, vehicle operating cost, crashes, and safety can be calculated based on outputs from tools and methods that can calculate these parameters.
A number of tools have been developed that can be used to assess the impacts of construction on mobility. The FHWA Traffic Analysis Toolbox documents [30] classify these tools to sketch planning tools, traffic demand models, signal optimization tools, macroscopic simulation, mesoscopic simulation, and microscopic simulation. These documents provide guidance to assist in selecting between these different types of tools based on various factors. The sketch planning tools range from simple spreadsheets that allow the analysis of a single link like the Q-DAT [31] developed for Texas Transportation Institute (TTI) to slightly more complicated tools like the QuickZone tool [32] developed by the FHWA that allows the modeling of multiple links on the subject facility and an alternative route. A good example of a macroscopic simulation model is the tool that implements the freeway and urban street facility procedures of the Highway Capacity Manual (HCM) including the updated work zone procedures in the latest version of the HCM [33]. An example of the use of simulation-based dynamic traffic assignment modeling tools is the WISE approach developed as part of a Strategic Highway Research Program 2 (SHRP 2) project [34]. However, the existing research does not address comprehensively the tools and methods to perform the assessments of user costs.
In this paper [35], mobility, reliability, safety and emission impacts, in line with the FHWA report and SHRP 2 reliability program recommendations, are considered and assessed to estimate road user costs. For mobility impacts, the QuickZone tool was used in this study to estimate the total delay due to work zones. The mobility costs could be estimated by the equation 1 as follows,
where, VOT is value of time, TotalDelay represents the total delay during construction, and delay occupancy is a region-specific parameter that can vary by time of day and trip purpose (occupancy of 1.4 persons per vehicle is used in this study). The value of time (VOT) used in this study is 16.64 $/person-hour according to the recommendation of the FHWA report mentioned earlier [29].
Another important component for road user cost is travel reliability [36]. Regression equations to estimate reliability, originally developed in the SHRP 2 L03 project [37] and later implemented in a spreadsheet tool developed in the SHRP 2 L07 project [38], were used to estimate reliability in this study, considering the lane hour lost due to construction. The utilized measures of reliability that can be calculated using the models are the nth percentile travel time indexes (TTIs), where nth could be the 10th, 50th, 80th, 95th, and mean travel time index (TTI). The TTI estimation models have the following general functional form,
where is nth percentile of TTI; LHL represents lane hour lost due to incidents and/or construction; is the critical demand to capacity ratio; is the number of hours of rainfall exceeding 0.05 inch; and represents coefficients for the nth percentile of TTI.
In this paper, the buffer time, representing the extra time budgeted for travel, is selected as the reliability measure to estimate reliability costs with the value of reliability (VOR) of 22.5$/h based on the recommendation from SHRP 2 L04 project [39], as equations 3–4 illustrate.
This paper estimates the safety impacts of work zones utilizing the default values used in the Florida ITS Evaluation (FITSEVAL) tool [40]. The average cost per crash was assumed to be 9700 dollars for property damage only (PDO) crash, 125,200 dollars for injury crash and 5,277,700 dollars for fatal crash [41], as equation 5 shows,
The average speed approach of the Motor Vehicle Emission Simulator (MOVES), developed by the United States Environmental Protection Agency (EPA) was used in this study to estimate emission [42]. The average speed approach is the simplest of the project level analysis in MOVES and is based on the average speed of the vehicles and the vehicle miles traveled by vehicle type. The utilized unit costs of emission were obtained from the FHWA report mentioned earlier [29]. Three types of pollutants are considered in this study, including Carbon Oxide (CO), Nitrogen Oxide (NOx), and Hydrocarbons (HC), as following equation describes,
3.4. TOPSIS Approach to the Accelerated Bridge Construction (ABC) Decision
In this paper, five criteria including construction costs, mobility, safety, reliability, and emission impacts were considered in the evaluation. This allows direct comparison of the results of the MCDM with those of the return on investment analysis that includes the same factors. Additional factors can be included such as whether bridge location is on an evacuation route, schedule constraints, site constraints, impacts on business, impacts on freight, customer service, and so on, as considered by the FHWA flow chart and ODOT tool approaches [5].
The detailed procedures of fuzzy TOPSIS algorithm utilized in the paper can be expressed as follows,
- Step 1: Construct a decision matrix. Assume there are m alternatives to be assessed with n criteria . The decision group has K members. Let to present the fuzzy importance weight of criterion assessed by the kth decision maker; let to present the rating of the with respect to criterion evaluated by kth decision maker. The decision matrix can be expressed as,where, and are linguistic variables. These linguistic variables can be described by triangular fuzzy numbers.
- Step 2: Calculate the integrated weight for criteria and the aggregated fuzzy rating of Alternative under criteria .where, and represent the fuzzy triangular number.
- Step 3: Normalize the fuzzy decision matrix . Let B denote the set of benefit criteria, while C is the set of cost criteria.
- Step 4: Construct the weight normalized fuzzy decision matrix . is the normalized fuzzy number and belongs to [0, 1].
- Step 5: Calculate the distance to fuzzy positive ideal solution (FPIS) and fuzzy negative ideal solution (FNIS). Compute the closeness coefficient (CC) of each alternative.where, and .
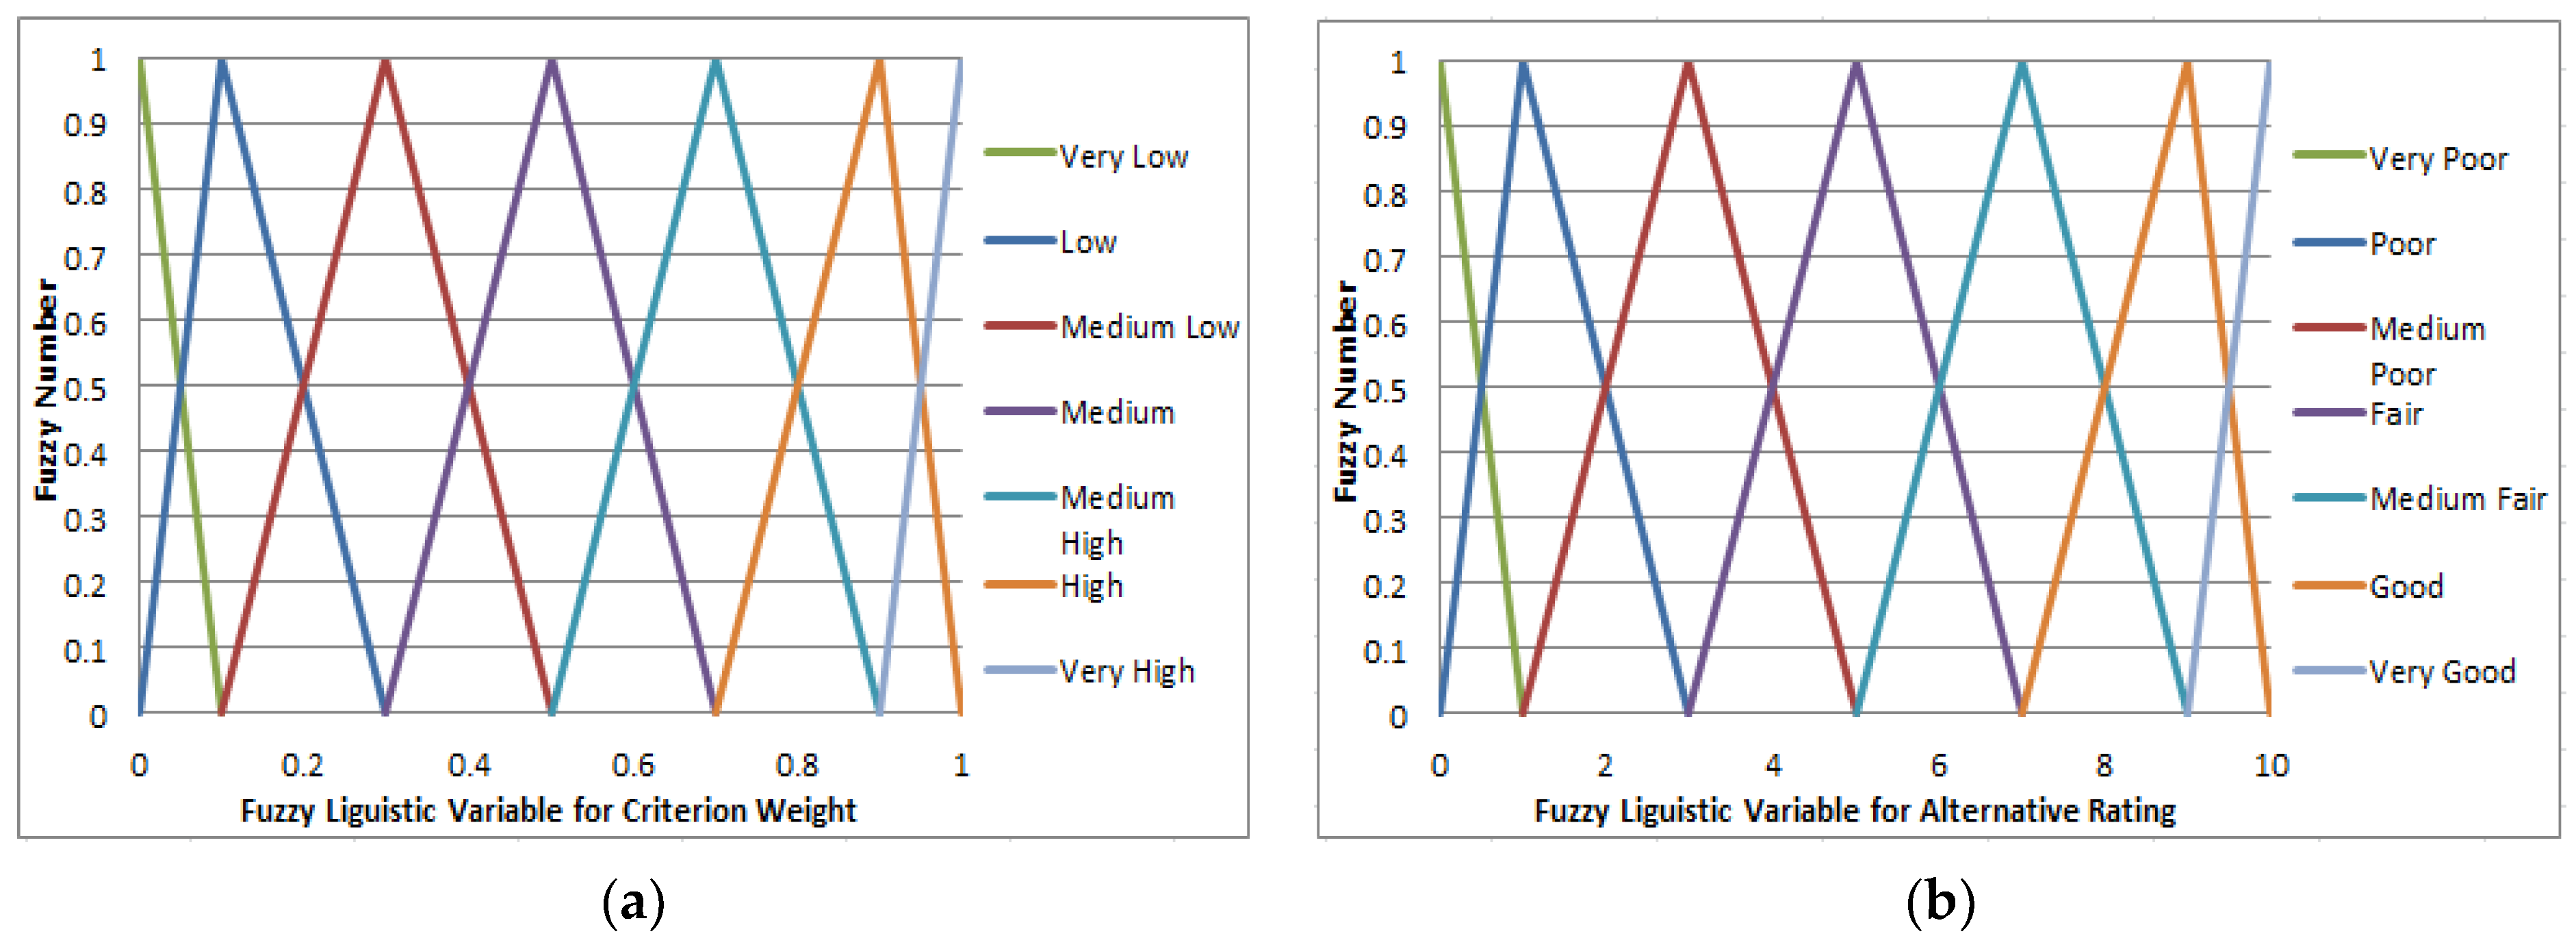
With the TOPSIS procedures described above, the triangular fuzzy number is utilized to express the importance of each criteria and the assessment of each alternative, as Figure 3 shows. The decision-makers could use linguistic variables to express their perceptions about the level of importance of each criterion as shown in Figure 3a. The importance ranges from “very low” to “very high.” The decision-makers also provide a rating of the assessed performance of each alternative with respect to each criterion. The linguistic variable for the assessment of each alternative ranges from “very poor” to “very good,” as shown in Figure 3b.
To test the use of the TOPSIS method, four engineers with significant past experience on the subject were asked to assess the importance of each criterion and to rate the assessed performance. The responses are shown in Table 4 and Table 5. To help understand the information presented in Table 5, we point as an example that the information presented in the table indicates the Expert 2 rates the ABC mobility impact as good, if the ABC produces 30% to 40% less delay compared to conventional construction.
4. Case Study
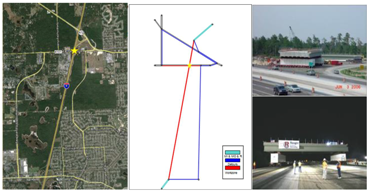
A case study was used to illustrate the use of the framework developed in this study for the estimation of the direct construction costs, agency costs and user costs of bridge construction with ABC and conventional methods, and the use of the results as part of the return-on-investment and TOPSIS MCDM approaches. The bridge is located at the interchange of I-4 and Graves Avenue in Orlando, FL (see Figure 4).
The existing two-lane four-span prestressed concrete beam bridge was 215 ft long and 30 ft wide. The replacement bridge has two 12-ft-wide traffic lanes, and a 10-ft-wide shoulder and 5-ft-wide sidewalk on each side. The basic information for the construction site is in Table 6. and the construction schedules for different assessed alternatives are described below.
- ABC method. ABC method requires I-4 to close one outside lane from 21:00 to 24:00 for only four nights. This schedule was obtained based on project documents.
- Conventional method I (Con I). Conventional method I requires I-4 to close two outside lanes from 21:00 to 24:00 for 48 nights. This schedule is a hypothetical schedule used in this study for further illustration of the methodology. The construction cost of Con I is assumed to be 15% higher than conventional method II, described below.
- Conventional method II (Con II). Conventional method II requires I-4 to close all the lanes from 21:00 to 24:00 for 32 nights. This is a schedule obtained from the project documentation.
4.1. Return-On Investment Analysis
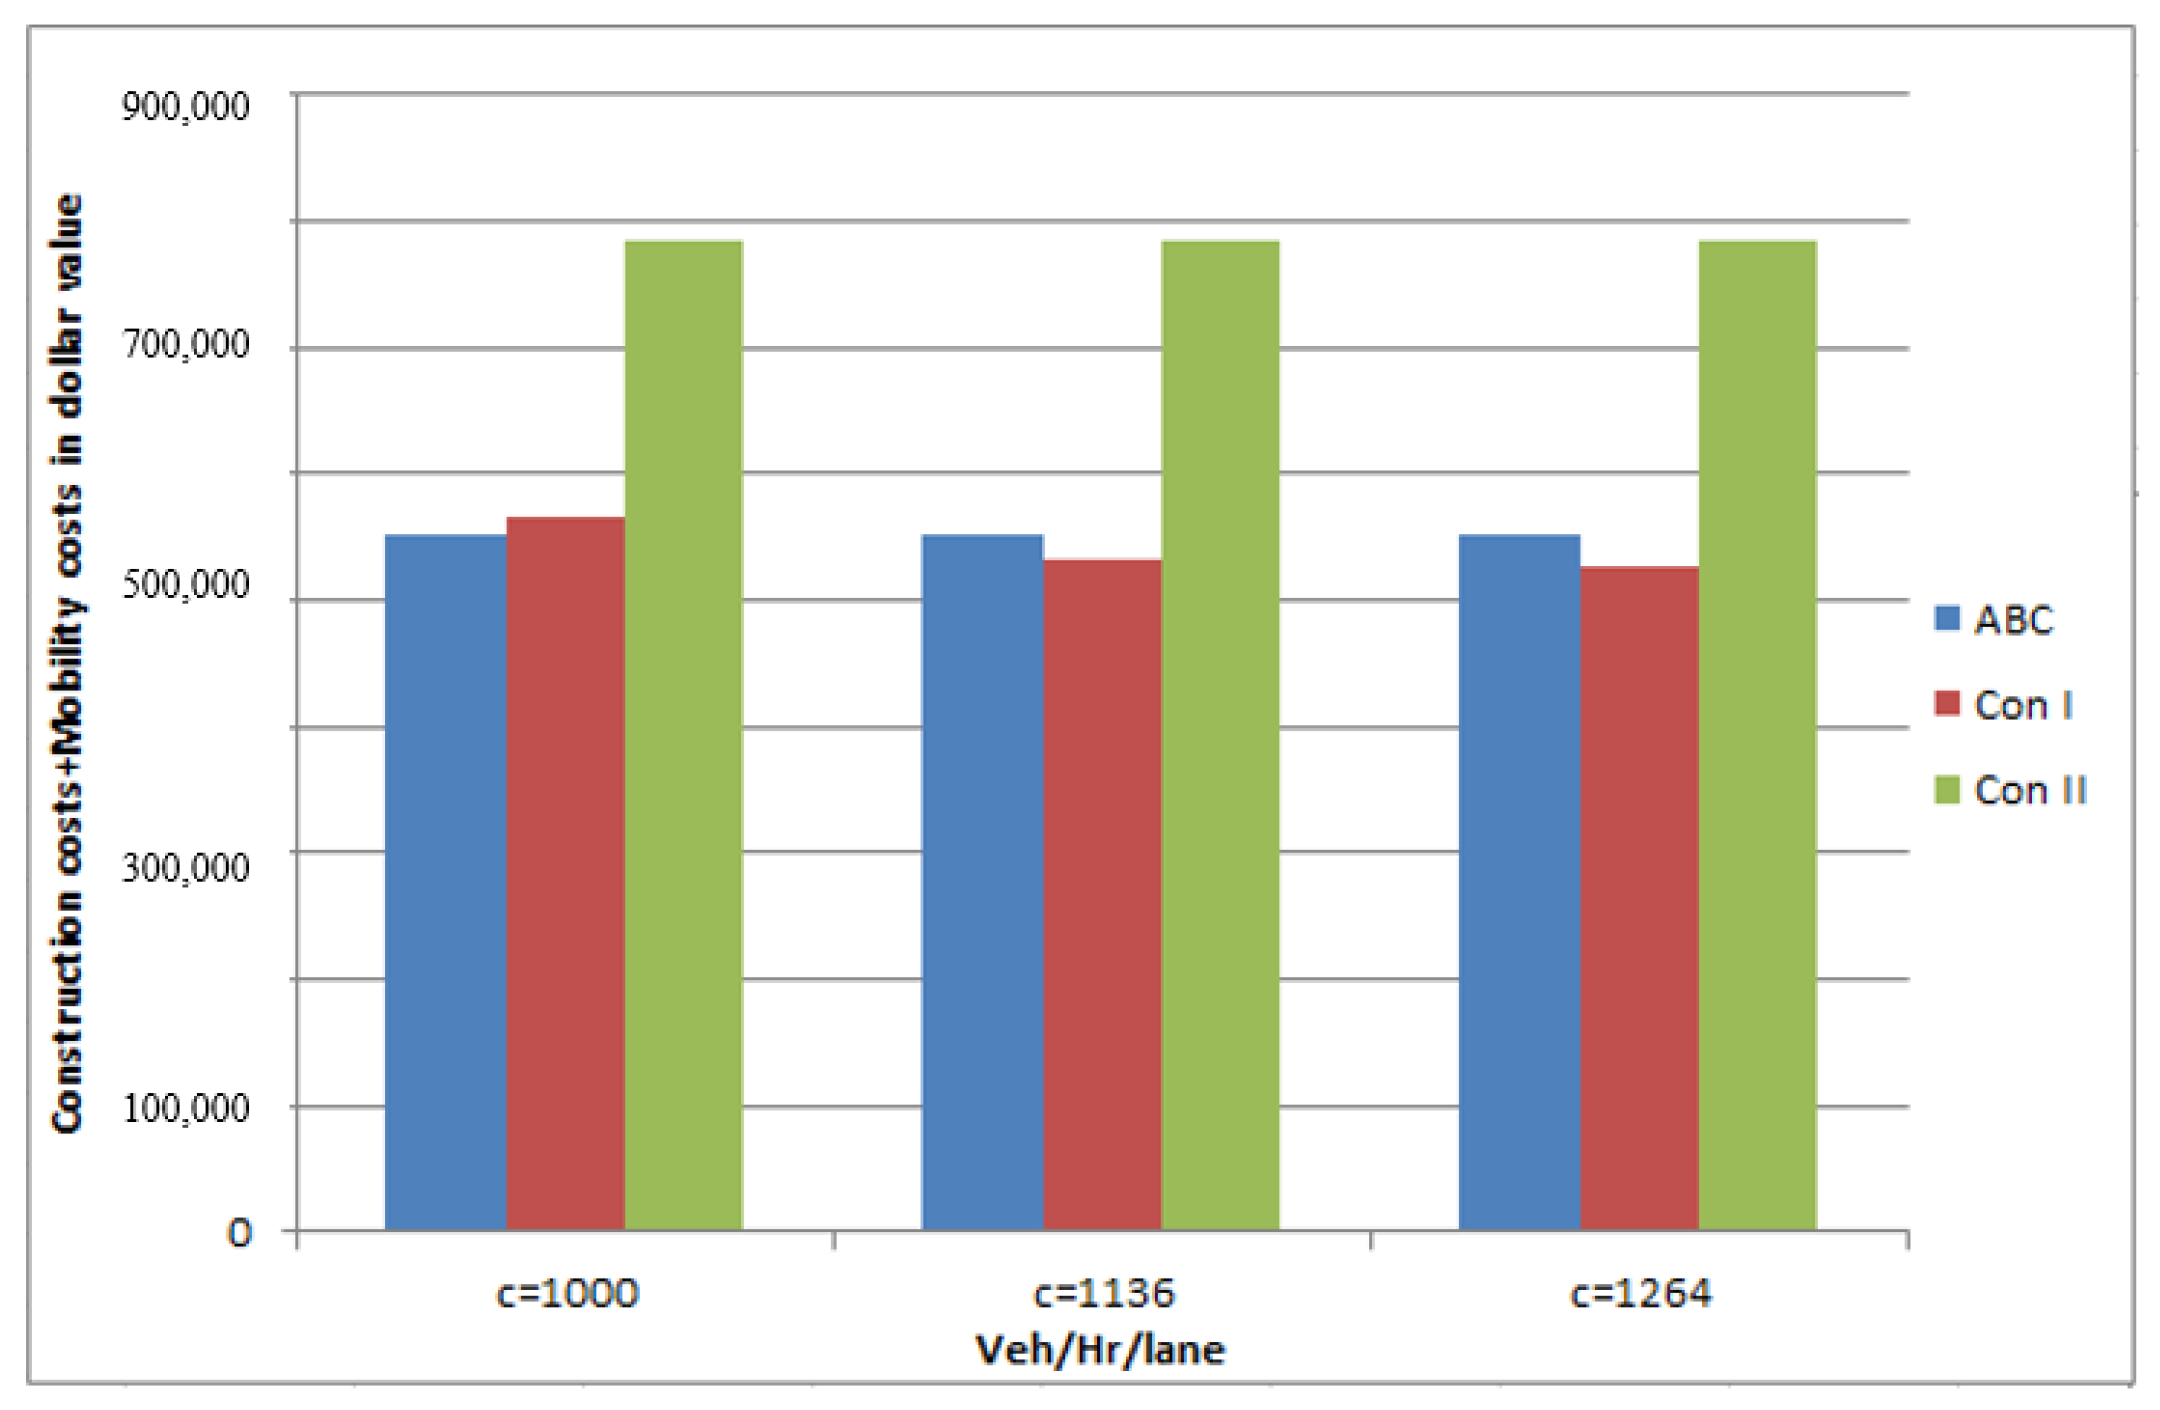
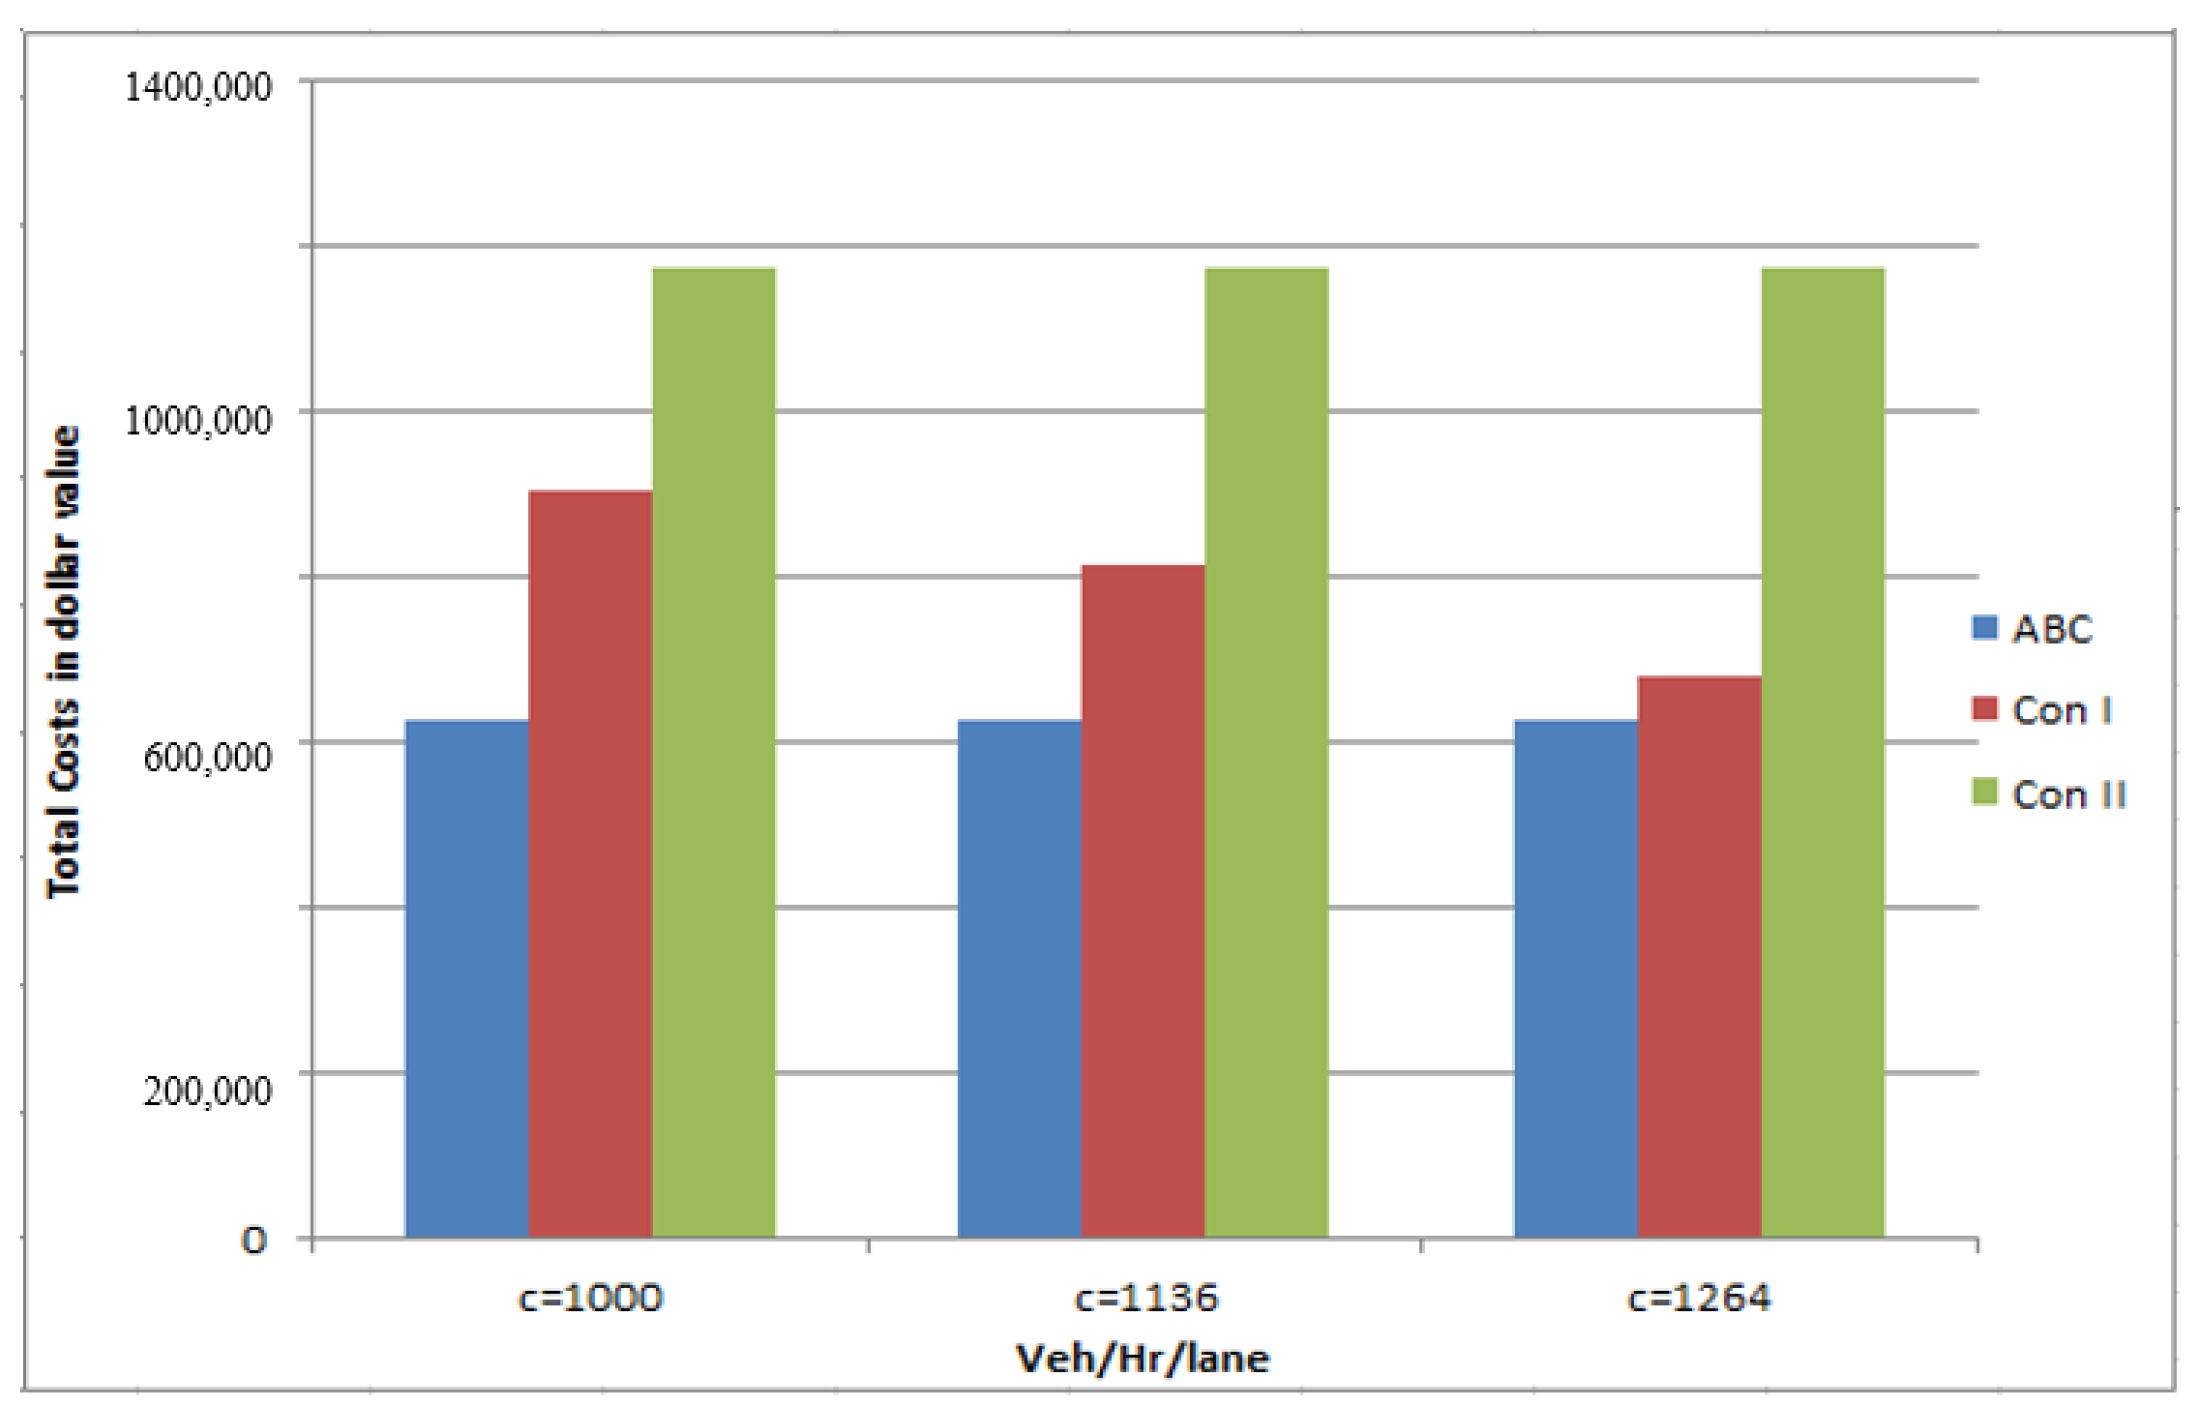
It is well known that work zone capacity has a large influence on the estimation of mobility and reliability impacts and thus the road user costs. Since there is uncertainty in the open lane capacity during construction, sensitivity analysis was done in this study to determine the impact of this parameter value on the analysis results. Three values of the capacity were used and the impacts on performance results were compared. These values are: An estimate from a previous analysis of real-world data by this study’s researchers (capacity equal to 1000 veh/hr/lane), an estimate based on HCM 2010 procedure [33] (1136 veh/hr/lane), and an estimate obtained from a method derived in a recent research and implemented in the latest version of the HCM [43] (capacity equal to 1264 veh/hr/lane).
The return-on-investment (present worth) analysis results of the case study are shown in Table 7 and Figure 5 to Figure 6. As shown in Table 7, the construction cost of the ABC is higher than the conventional methods. If the comparison was done based on the construction cost alone, the agencies will select Conventional Method II. If the mobility (travel time delays due to construction) is added to the comparison, as is sometimes done when comparing construction and construction management alternatives, Figure 5 shows that Conventional Method I and the ABC alternatives have comparable costs and are lower than that of Conventional Method 2. When all components of the user costs were added to the analysis, Figure 6 indicates that the ABC is the best alternative. This illustrates the benefit of using the total costs in the comparison between ABC and conventional methods. If there are aadditional user costs, such as the impacts on businesses and toll revenue losses, if any were added, then the user cost could be even higher than that factoring the ABC alternative. In this project, I-4 was not a tolled highway and there was no impact on businesses that could be quantified.
4.2. Fuzzy TOPSIS Analysis
The fuzzy TOPSIS approach was also conducted for the evaluation between ABC and conventional construction alternatives. The performance measure values do not have to be converted to a dollar value with this approach. The assessment of the various measures for different alternatives is shown in Table 8. The rating of these assessments based on the four expert’s opinions is given in Table 9. The results from the TOPSIS analysis are shown in Table 10. In Table 10, D(max) represents the distance between the alternative to the best alternative, while D(min) represents the distance between the alternative to the worst alternative. CC shows the final utility of the alternatives. It can be found that the ABC alternative has a significant advantage compared to the other two alternatives when using the TOPSIS method that considers decision makers and preferences. Although the identification of the ABC as the best alternative is consistent with the conclusion from using the return-on-investment analysis described earlier, the magnitude of the advantage of ABC compared to the other methods is higher when using the TOPSIS MCDM method. As stated earlier, additional criteria can also be added to the MCDM analysis that cannot be added to the return-on investment analysis because their assessment results cannot be converted to dollar values, which is another significant advantage of the MCDM approach.
5. Conclusions
To deal with the pressing need to provide decision-makers with the appropriate tools to support the decisions associated with the selection between the ABC and conventional bridge construction, this paper presents an evaluation framework considering the total cost of the project that includes construction, agency, mobility, safety and ecological costs. Methods were developed to estimate these costs and to use these costs as inputs to the decision-making process to select between ABC and other alternatives. A new model was developed to allow the assessment of the construction cost of ABC relative to conventional construction. The main influencing factors on the construction cost were found to be the AADT, number of spans, location (urban versus rural), and ABC type. The examined data seems to indicate that the agency cost can be approximately calculated as 20% of the construction cost for both conventional and accelerated bridge construction. This study also demonstrated the estimation of user costs utilizing combinations of existing tools and methods. The estimated user cost components are related to mobility, reliability, safety, and emission impacts of the construction schedule.
This paper then compared the use of return-on-investment (present worth analysis) and MCDM evaluation approaches in the decision associated with the selection between ABC and conventional bridge construction. The return-on-investment analysis results indicate that the ABC can have a higher construction cost than conventional methods but its total cost can be lower, if all the elements of the user costs are added to the return-on-investment analysis.
The MCDM approach based on the TOPSIS method for the case study shows that the ABC alternative can be even more preferable, according to this method, than what can be concluded based on the return-on-investment analysis. This confirms the importance of accounting for agency priorities and user preference in the decision-making process of selection between ABC and conventional construction alternatives, as is done with the MCDM approach. Another advantage of using MCDM compared to return-on-investment analysis is that additional factors can be included in the decision process such as whether bridge location is on an evacuation route, schedule constraints, site constraints, impacts on business, impacts on freight, customer service, and so on.
Author Contributions
In this paper, J.J. developed the methodology part on user costs and MCDM approach, analyzed the case study and completed the original writing. M.I. developed the methodology part on construction costs and agency costs. M.H. developed the methodology part on user costs and completed the writing-review. W.O. completed the data curation for construction projects and writing of construction costs and agency costs part. Y.X. completed the writing—review and editing.
Funding
This research received no external funding.
Acknowledgments
The project sponsored by Florida International University–University Transportation Center (FIU-UTC).
Conflicts of Interest
The authors declare no conflict of interest.
References
- Federal Highway Administration (FHWA). 2013 Status of the Nation’s Highways, Bridges, and Transit: Conditions & Performance; In Report to Congress; FHWA: Washington, DC, USA, 2013.
- Federal Highway Administration (FHWA). Accelerated Bridge Construction: Changing How America Builds Infrastructure; Structure Magazine; FHWA: Washington, DC, USA, 2012.
- National Research Council. Innovative Bridge Designs for Rapid Renewal: ABC Toolkit; Transportation Research Board: Washington, DC, USA, 2013. [Google Scholar]
- Salem, S.; Richard, A.M. Accelerated Construction Decision-Making Process for Bridges; No. MRUTC 05-04; Midwestern Regional University Transportation Center, College of Engineering, Department of Civil and Environmental Engineering, University of Wisconsin: Madison, WI, USA, 2006. [Google Scholar]
- Tang, B. Framework for prefabricated bridge elements and systems (PBES) decision-making. In Proceedings of the Second US-Taiwan Bridge Engineering Workshop, San Mateo, CA, USA, 21–22 September 2006. [Google Scholar]
- Kendall, A.; Keoleian, G.A.; Helfand, G.E. Integrated life-cycle assessment and life-cycle cost analysis model for concrete bridge deck applications. J. Infrastruct. Syst. 2008, 14, 214–222. [Google Scholar] [CrossRef]
- Safi, M. Life-Cycle Costing: Applications and Implementations in Bridge Investment and Management. Ph.D. Thesis, KTH Royal Institute of Technology, Stockholm, Sweden, 2013. [Google Scholar]
- de Lurdes Antunes, M.; Marecos, V.; Neves, J.; Morgado, J. Decision to Paving Solutions in Road Infrastructures Based on Life-Cycle Assessment. Balt. J. Road Bridge Eng. 2016, 11, 43–52. [Google Scholar] [CrossRef]
- Keshavarz-Ghorabaee, M.; Amiri, M.; Zavadskas, E.K.; Turskis, Z.; Antuchevičienė, J. Ranking of Bridge Design Alternatives: A. TOPSIS-FADR Method. Balt. J. Road Bridge Eng. 2018, 13, 209–237. [Google Scholar] [CrossRef]
- Youssef, M.A.; Anumba, C.J.; Thorpe, T. Intelligent selection of concrete bridge construction methods in Egypt. Comput. Civ. Eng. 2005, 1–14. [Google Scholar] [CrossRef]
- Wang, Z.Z.; Fan, L.C.; Hastak, M. Multi-Criteria Optimization of Bridge Management. Adv. Mater. Research. 2011, 255, 4080–4084. [Google Scholar] [CrossRef]
- Salem, O.M.; Miller, R.A.; Deshpande, A.S.; Arurkar, T.P. Multi-criteria decision-making system for selecting an effective plan for bridge rehabilitation. Struct. Infrastruct. Eng. 2013, 9, 806–816. [Google Scholar] [CrossRef]
- Rashidi, M.; Samali, B.; Sharafi, P. A new model for bridge management: Part B: Decision support system for remediation planning. Aust. J. Civ. Eng. 2016, 14, 46–53. [Google Scholar] [CrossRef]
- Yadollahi, M.; Ansari, R.; Abd Majid, M.Z.; Yih, C.H. A multi-criteria analysis for bridge sustainability assessment: A case study of Penang Second Bridge, Malaysia. Struct. Infrastruct. Eng. 2015, 11, 638–654. [Google Scholar] [CrossRef]
- Wang, Y.M.; Liu, J.; Elhag, T.M. An integrated AHP–DEA methodology for bridge risk assessment. Comput. Ind. Eng. 2008, 54, 513–525. [Google Scholar] [CrossRef]
- Aghdaie, M.H.; Hashemkhani Zolfani, S.; Zavadskas, E.K. Prioritizing constructing projects of municipalities based on AHP and COPRAS-G: A case study about footbridges in Iran. Balt. J. Road Bridge Eng. 2012, 7, 145–153. [Google Scholar] [CrossRef]
- Bitarafan, M.; Zolfani, S.H.; Arefi, S.L.; Zavadskas, E.K.; Mahmoudzadeh, A. Evaluation of Real-time Intelligent Sensors for Structural Health Monitoring of Bridges Based on SWARA-WASPAS; A. Case in IRAN. Balt. J. Road Bridge Eng. 2014, 9, 333–340. [Google Scholar] [CrossRef]
- Ardeshir, A.; Mohseni, N.; Behzadian, K.; Errington, M. Selection of a bridge construction site using fuzzy analytical hierarchy process in geographic information system. Arabian J. Sci. Eng. 2014, 39, 4405–4420. [Google Scholar] [CrossRef]
- Pan, N.F. Fuzzy AHP approach for selecting the suitable bridge construction method. Autom. Constr. 2008, 17, 958–965. [Google Scholar] [CrossRef]
- Hwang, C.L.; Yoon, K. Methods for multiple attribute decision making. In Multiple Attribute Decision Making; Springer: Berlin, Germany, 1981; pp. 58–191. [Google Scholar]
- Zavadskas, E.K.; Mardani, A.; Turskis, Z.; Jusoh, A.; Nor, K.M. Development of TOPSIS method to solve complicated decision-making problems—An overview on developments from 2000 to 2015. Int. J. Inf. Technol. Decis. Mak. 2016, 15, 645–682. [Google Scholar] [CrossRef]
- Kannan, D.; de Sousa Jabbour, A.B.; Jabbour, C.J. Selecting green suppliers based on GSCM practices: Using fuzzy TOPSIS applied to a Brazilian electronics company. Eur. J. Oper. Res. 2014, 233, 432–447. [Google Scholar] [CrossRef]
- Guo, S.; Zhao, H. Optimal site selection of electric vehicle charging station by using fuzzy TOPSIS based on sustainability perspective. Appl. Energy. 2015, 158, 390–402. [Google Scholar] [CrossRef]
- Selim, H.; Yunusoglu, M.G.; Yılmaz Balaman, Ş. A dynamic maintenance planning framework based on fuzzy TOPSIS and FMEA: Application in an international food company. Qual. Reliab. Eng. Int. 2016, 32, 795–804. [Google Scholar] [CrossRef]
- Wang, Y.M.; Elhag, T.M. Fuzzy TOPSIS method based on alpha level sets with an application to bridge risk assessment. Expert Syst. Appl. 2006, 31, 309–319. [Google Scholar] [CrossRef]
- Taylan, O.; Bafail, A.O.; Abdulaal, R.M.; Kabli, M.R. Construction projects selection and risk assessment by fuzzy AHP and fuzzy TOPSIS methodologies. Appl. Soft Comput. 2014, 17, 105–116. [Google Scholar] [CrossRef]
- Chaphalkar, N.B.; Shirke, P.P. Application of multi-criteria decision making techniques for bridge construction. Int. J. Innov. Res. Sci. Eng. Technol. 2013, 2, 3617–3626. [Google Scholar]
- Rsmeans Data. Available online: https://www.rsmeans.com/ (accessed on 26 October 2017).
- Mallela, J.; Sadavisam, S. Work Zone Road User Costs: Concepts and Applications; US Department of Transportation, Federal Highway Administration: Washington, DC, USA, 2011.
- Hardy, M.; Wunderlich, K.E. Traffic Analysis Toolbox Volume VIII: Work Zone Modeling and Simulation—A Guide for Decision-Makers; No. FHWA-HOP-08-029; Federal Highway Administration: Washington, DC, USA, 2008.
- Texas Transportation Institute (TTI). Q-DAT Lane Closure Analysis Tool-Operation Instructions; Texas Transportation Institute: College Station, TX, USA, 2010. [Google Scholar]
- Mitretek, Quickzone Delay Estimation Program-User Guide; Federal Highway Administration: Washington, DC, USA, 2000.
- Transportation Research Board National Research Council. Highway Capacity Manual, 6th ed.; TRB Business Office: Washington, DC, USA, 2016. [Google Scholar]
- Pesesky, L.; Ismart, D.; Matherly, D.; Huffman, C.; Chiu, Y.C.; Zheng, H.; Nava, E.; Dixit, V.; Wolshon, B.; Radwan, E.; et al. Strategic Approaches at the Corridor and Network Level to Minimize Disruption from the Renewal Process; [Supporting Datasets]. No. SHRP 2 Report S2-R11-RW-1; United States, National Transportation Library [Distributor]: Washington, DC, USA, 2017. [Google Scholar]
- Jia, J.M.; Ibrahim, M.; Hadi, M.; Orabi, W.; Ali, M.; Xiao, Y. Estimation of the Total Cost of Bridge Construction for Use in Accelerated Bridge Construction Selection Decisions. In Proceedings of the Transportation Research Board 95th Annual Meeting, Washington, DC, USA, 10–14 January 2016; p. 17. [Google Scholar]
- Vandervalk, A.; Louch, H.; Guerre, J.; Margiotta, R. Incorporating Reliability Performance Measures into the Transportation Planning and Programming Processes: Technical Reference; No. SHRP 2 Report S2-L05-RR-3; Transportation Research Board: Washington, DC, USA, 2014. [Google Scholar]
- National Research Council. Analytical Procedures for Determining the Impacts of Reliability Mitigation Strategies; Transportation Research Board: Washington, DC, USA, 2013. [Google Scholar]
- Potts, I.B.; Harwood, D.W.; Hutton, J.M.; Fees, C.A.; Bauer, K.M.; Lucas, L.M.; Kinzel, C.S.; Frazier, R.J. Identification and Evaluation of the Cost-Effectiveness of Highway Design Features to Reduce Nonrecurrent Congestion; Transportation Research Board: Washington, DC, USA, 2014. [Google Scholar]
- Mahmassani, H.S.; Kim, J.; Chen, Y.; Stogios, Y.; Brijmohan, A.; Vovsha, P. Incorporating Reliability Performance Measures into Operations and Planning Modeling Tools; Transportation Research Board: Washington, DC, USA, 2014. [Google Scholar]
- Hadi, M.; Xiao, Y.; Ozen, H.; Alvarez, P. Evaluation Tools to Support ITS Planning Process: Development of a Sketch Planning Tool in FSUTMS/Cube Environment; Florida Department of Transportation: Tallahassee, FL, USA, 2008.
- National Research Council (US). Highway Safety Manual; American Association of State Highway and Transportation Officials (AASHTO): Washington, DC, USA, 2010; Volume 1. [Google Scholar]
- EPA. Motor Vehicle Emission Simulator (MOVES) User Guide; US Environmental Protection Agency: Washington, DC, USA, 2010.
- National Cooperative Highway Research Program (NCHRP). Capacity Models for Freeways/Multilane Highways, Urban Street, and Two-Lane Highways; NCHRP Project 03-107; Transportation Research Board: Washington, DC, USA, 2014. [Google Scholar]
Figure 1.
Data from Nationwide ABC Projects.

Figure 2.
Descriptive Statistics of the Collected Construction Cost Data.

Figure 3.
Fuzzy Linguistic Variable Utilized in This Study: (a) Importance of Criteria; (b) Rating of Alternative Performance.
Figure 3.
Fuzzy Linguistic Variable Utilized in This Study: (a) Importance of Criteria; (b) Rating of Alternative Performance.

Figure 4.
Location of Bridge Construction Project.

Figure 5.
Comparison of the construction costs when only mobility cost is added to construction costs in the comparison.
Figure 5.
Comparison of the construction costs when only mobility cost is added to construction costs in the comparison.

Figure 6.
Comparison of the total costs of different alternatives with the consideration of the construction and user costs.
Figure 6.
Comparison of the total costs of different alternatives with the consideration of the construction and user costs.


Table 1.
Relative Importance of Each Variable According to the C&RT Analysis Results.
| Independent Variable | Importance |
|---|---|
| AADT | 100.0% |
| Number of Span | 99.2% |
| Type | 59.4% |
| Location | 35.3% |
Table 2.
The AADT Independent Variable Representation.
| AADT Categorical Value | AADT Range |
|---|---|
| 0 | 0 to 1000 |
| 1 | 1001 to 5000 |
| 2 | 5001 to 10,000 |
| 3 | 10,001 to 20,000 |
| 4 | 20,001 to 50,000 |
| 5 | 50,001 to 100,000 |
| 6 | 100,001 to 200,000 |
| 7 | More than 200,001 |
Table 3.
The Cost Ranges Utilized in the Analysis.
| Category | 1 | 2 | 3 | 4 | 5 | 6 | 7 | 8 | 9 | 10 |
| Range ($/ft2) | 0–100 | 101–200 | 201–300 | 301–400 | 401–500 | 501–600 | 601–700 | 701–800 | 801–900 | 901–1000 |
Table 4.
Criteria Importance Table.
| Criteria | Expert1 | Expert2 | Expert3 | Expert4 |
|---|---|---|---|---|
| C1: Mobility | H | VH | VH | H |
| C2: Reliability | H | VH | MH | ML |
| C3: Safety | VH | VH | H | H |
| C4: Emission | M | MH | MH | L |
| C5: Construction Costs | VH | H | H | VH |
Table 5.
Rating of the Performance of ABC with Respect to Conventional Construction.
| Rating | Expert | Mobility Impacts | Reliability Impacts | Safety Impacts | Emission Impacts | Construction Costs |
|---|---|---|---|---|---|---|
| VP | Expert1 Expert2 Expert3 Expert4 | Equal or higher Equal or higher 10% lower 10% higher | Equal or higher Equal or higher 10% lower 10% higher | Equal or higher Equal or higher 10% lower 10% higher | Equal or higher Equal or higher 10% lower 10% higher | 100% higher 10% higher 50% higher 30% higher |
| P | Expert1 Expert2 Expert3 Expert4 | 10~30% lower 0~10% lower 10~20% lower 0~10% higher | 10~30% lower 0~10% lower 10~20% lower 0~10% higher | 10~30% lower 0~10% lower 10~20% lower 0~10% higher | 10~30% lower 0~10% lower 10~20% lower 0~10% higher | 75~100% higher 5~10% higher 40~50% higher 25~30% higher |
| MP | Expert1 Expert2 Expert3 Expert4 | 30~45% lower 10~15% lower 20~35% lower 0~15% lower | 30~45% lower 10~15% lower 20~35% lower 0~15% lower | 30~45% lower 10~15% lower 20~35% lower 0~15% lower | 30~45% lower 10~15% lower 20~35% lower 0~15% lower | 50~75% higher 0~5% higher 35~40% higher 20~25% higher |
| F | Expert1 Expert2 Expert3 Expert4 | 45~60% lower 15~20% lower 35~50% lower 15~30% lower | 45~60% lower 15~20% lower 35~50% lower 15~30% lower | 45~60% lower 15~20% lower 35~50% lower 15~30% lower | 45~60% lower 15~20% lower 35~50% lower 15~30% lower | 30~50% higher Equal 30~35% higher 15~20% higher |
| MF | Expert1 Expert2 Expert3 Expert4 | 60~80% lower 20~30% lower 50~65% lower 30~45% lower | 60~80% lower 20~30% lower 50~65% lower 30~45% lower | 60~80% lower 20~30% lower 50~65% lower 30~45% lower | 60~80% lower 20~30% lower 50~65% lower 30~45% lower | 20~30% higher 0~5% lower 20~30% higher 10~15% higher |
| G | Expert1 Expert2 Expert3 Expert4 | 80~95% lower 30~40% lower 65~80% lower 45~60% lower | 80~95% lower 30~40% lower 65~80% lower 45~60% lower | 80~95% lower 30~40% lower 65~80% lower 45~60% lower | 80~95% lower 30~40% lower 65~80% lower 45~60% lower | Equal 5~10% lower 10~20% higher 5~10% higher |
| VG | Expert1 Expert2 Expert3 Expert4 | 95% lower 40% lower 80% lower 60% lower | 95% lower 40% lower 80% lower 60% lower | 95% lower 40% lower 80% lower 60% lower | 95% lower 40% lower 80% lower 60% lower | 0~20% lower 10% lower 10% higher 5% higher |
Table 6.
Basic Information for I-4/Graves.
| Segment | No. of Lanes | Length (Miles) | Free Flow Speed (mph) |
|---|---|---|---|
| I-4-work zone | 6 lanes | 3.11 | 60 |
| Detour for I-4 | 4 lanes | 4.32 | 30 |
| Graves Ave | 2 lanes | 0.83 | 45 |
| Detour for Graves | 2 lanes | 1.91 | 30 |
Table 7.
Sensitivity Analysis on Total Costs with Different Capacity.
| Costs in Dollar Value ($) | Mobility Impact | Reliability Impact | Safety Impact | Emission Impact | Construction | Construction Agency Costs | Total Cost | |
|---|---|---|---|---|---|---|---|---|
| C = 1000 veh/hr/lane | ABC | 120,347 | 32,807 | 40,864 | 1615 | 430,000 | 53,320 | 678,953 |
| Con I | 224,591 | 258,414 | 77,313 | 2274 | 342,125 | 46,529 | 951,246 | |
| Con II | 487,838 | 258,580 | 127,434 | 3102 | 297,500 | 40,460 | 1,214,914 | |
| C = 1136 veh/hr/lane | ABC | 120,347 | 32,489 | 40,864 | 1615 | 430,000 | 53,320 | 678,635 |
| Con I | 191,339 | 202,851 | 77,207 | 2425 | 342,125 | 46,529 | 862,476 | |
| Con II | 487,838 | 258,580 | 127,434 | 3102 | 297,500 | 40,460 | 1,214,914 | |
| C = 1264 veh/hr/lane | ABC | 120,347 | 32,311 | 40,864 | 1615 | 430,000 | 53,320 | 678,457 |
| Con I | 183,026 | 73,715 | 77,207 | 2499 | 342,125 | 46,529 | 725,101 | |
| Con II | 487,838 | 258,580 | 127,434 | 3102 | 297,500 | 40,460 | 1,214,914 | |
Table 8.
Comparison of Different Alternatives.
| Alternatives | Mobility Impacts (in veh-hr) | Reliability Impacts (in veh-hr) | Emission Impacts (in Ton) | Safety Impacts (Crashes) | Construction Costs (Direct Plus Agency) |
|---|---|---|---|---|---|
| ABC | 7338 | 1444 | 2.79 | 0.79 | 483,320 |
| Con I | 11,667 | 9016 | 4.19 | 1.49 | 388,654 |
| Con II | 29,746 | 11,492 | 5.36 | 2.46 | 337,960 |
Table 9.
Rating Results for Alternatives Based on Expert Criterion.
| Alternatives | Mobility Impacts (in veh-hr) | Reliability Impacts (in veh-hr) | Emission Impacts (in ton) | Safety Impacts (crashes) | Construction Costs (Direct Plus Agency) | |
|---|---|---|---|---|---|---|
| Expert1 | ABC | VG | VG | G | VG | MP |
| Con I | G | MP | MP | F | MF | |
| Con II | P | VP | P | P | VG | |
| Expert2 | ABC | VG | VG | VG | VG | P |
| Con I | G | F | F | F | P | |
| Con II | VP | VP | VP | VP | VG | |
| Expert3 | ABC | VG | G | F | VG | VP |
| Con I | F | MP | VP | MF | MF | |
| Con II | VP | VP | VP | VP | VG | |
| Expert4 | ABC | VG | G | VG | VG | VP |
| Con I | F | F | P | G | F | |
| Con II | VP | VP | VP | VP | VG | |
Table 10.
Fuzzy Evaluation Results.
| Alternatives | D(max) | D(min) | CC |
|---|---|---|---|
| ABC | 3.076 | 6.178 | 0.667 |
| Con I | 5.993 | 3.029 | 0.335 |
| Con II | 7.036 | 1.929 | 0.215 |
© 2018 by the authors. Licensee MDPI, Basel, Switzerland. This article is an open access article distributed under the terms and conditions of the Creative Commons Attribution (CC BY) license (http://creativecommons.org/licenses/by/4.0/).
Share and Cite
MDPI and ACS Style
Jia, J.; Ibrahim, M.; Hadi, M.; Orabi, W.; Xiao, Y. Multi-Criteria Evaluation Framework in Selection of Accelerated Bridge Construction (ABC) Method. Sustainability 2018, 10, 4059. https://0-doi-org.brum.beds.ac.uk/10.3390/su10114059
AMA Style
Jia J, Ibrahim M, Hadi M, Orabi W, Xiao Y. Multi-Criteria Evaluation Framework in Selection of Accelerated Bridge Construction (ABC) Method. Sustainability. 2018; 10(11):4059. https://0-doi-org.brum.beds.ac.uk/10.3390/su10114059
Chicago/Turabian StyleJia, Jianmin, Mohamed Ibrahim, Mohammed Hadi, Wallied Orabi, and Yan Xiao. 2018. "Multi-Criteria Evaluation Framework in Selection of Accelerated Bridge Construction (ABC) Method" Sustainability 10, no. 11: 4059. https://0-doi-org.brum.beds.ac.uk/10.3390/su10114059
Note that from the first issue of 2016, this journal uses article numbers instead of page numbers. See further details here.