Research on Sustainable Development of the Stock Market Based on VIX Index

School of Business, Northeast Normal University, Changchun 130117, China
Sustainability 2018, 10(11), 4113; https://0-doi-org.brum.beds.ac.uk/10.3390/su10114113
Submission received: 28 September 2018
/
Revised: 4 November 2018
/
Accepted: 5 November 2018
/
Published: 9 November 2018
(This article belongs to the Special Issue Expert Systems: Applications of Business Intelligence in Big Data Environments)
Abstract
:The frequent occurrence of financial crises has made the dynamic linkage between international financial markets an important research topic. In the past, scholars mostly studied the correlation between financial markets directly, however ignored the impact of exogenous financial variables on financial markets. The stock market is an important part of the financial market and plays an important role in the overall economy. Information asymmetry is common and has a certain degree of impact on investors’ returns. However, many scholars believe that the problem of information asymmetry in China has seriously negatively impacted investors, forming an unsustainable state. At present, there are still many problems in the Chinese stock market, especially the stock market fraud, which brings great challenges to the sustainable development of the stock market. Based on the idea of the STCC model, it is assumed that the Copula parameter is affected by the exogenous variables and the time-varying dynamic Copula model-ST-VCopula model is established. Based on the model, the influence of market volatility (VIX index) on the stock market is explored and then the stock index data of several countries are empirically analyzed. The empirical results show that the VIX index has a significant impact on the linkage between stock markets. The VIX index is easy and more intuitive to obtain, providing another way for the dynamic linkage research between the market, which can provide investors with some guidance and advice when conducting financial activities such as diversification.
1. Introduction
Most studies directly relate to correlation and analyze the dynamic changes of correlation [1]. There are few literatures on the correlation between stock market returns that are affected by exogenous variables, and the main determinants of this correlation are difficult to determine [2]. The stock market is an important part of the financial market; it can transfer funds from the hands of people without productive purposes to the hands of people with productive purposes. It is an important channel for enterprise financing and is one of the short- and long-term investments of investors [3,4,5]. Therefore, the healthy operation of the stock market plays an important role in personal wealth, enterprise development, financial market and the overall economy [6]. The original intention of designing the VIX (influence of market volatility) index is to reflect investors’ expectations for the future of the market [7]. However, with the deepening of research, people gradually found that in addition to this feature, the VIX index also has a wider range of applications. Therefore, the influence of exogenous variables on market correlation is a topic of great research significance. Relevance is one of the most important means to analyze financial problems [8]. Especially, the significant increase of correlation is considered as one of the important test methods of contagion. Information asymmetry exists in the financial market, and the stock market is no exception. Asymmetric information refers to the fact that one party of a transaction lacks sufficient knowledge of the other party and, thus, affects its decision-making [9]. The consequences and manifestations of asymmetric information are adverse selection and moral hazard. After years of empirical testing, people found that the VIX index and stock market returns have a negative correlation, which prompted people to think of using the VIX index to hedge stock portfolio risk [10]. Of course, this was for the long-term development of the stock market, to protect the interests of investors and for the company to create a good financing market environment. It also puts forward some policy suggestions to promote the healthy development of China’s stock market and improve the efficiency of the stock market in reflecting market information so as to form a more effective stock market [11,12].
Kang et al. show that the dynamic correlation between commodities (gold and oil) and BRIC markets is time-varying and sensitive to major financial and economic events [13]. Some studies considered the impact of the global financial crisis (GFC). Baur and McDermott used regression analysis data from 1979 to 2009, which used virtual variables representing extreme market conditions [14]. They believe that gold cannot effectively hedge the extreme volatility of the BRICs market, including India. Xu and Hamori used the cross correlation function method to show that the volatility link between the U.S. and BRIC stock markets has been significantly weakened after the GFC [15]. We use vector autoregression (VAR) and multivariate GARCH models, as well as linear and nonlinear causal frames. Mensi et al. used the quantile regression method to study the dependence structure between BRIC stock markets and several influential global factors from September 1997 to September 2013 [16]. Arui found evidence of a time-varying correlation between U.S. economic policy uncertainty and BRICS stock markets [17]. Ko and Lee point out that the relationship between uncertainty in international economic policy and stock prices is usually negative, however that it changes over time [18]. From January 2001 to March 2013, Nath Sahu et al. showed that there is a long-term relationship between oil and India’s stock market [19]. They also confirm that there is no checking variable between short-term causality and reveal that a positive shock to oil prices has a small but sustained positive impact on Indian stocks in the short term.
2. Game Model Suitable for China’s Current Market
For the securities market, especially in China, where the transparency of information is not 100%, there is indeed an incomplete information disclosure of listed companies [20]. Market information is not reflected in the information asymmetry, information transmission leakage, information analysis distortion and other information asymmetry, and basically cannot reach the effective market situation [21]. There are various forms of counterfeiting in the stock market, such as the manipulation of accounting profits by listed companies, the black-box operation of large institutions, large investors, etc. [22]. We call the policymakers who have the tendency to fabricate fraud the counterfeiters. In the stock market, even if small and medium shareholders buy counterfeit stocks, they cannot use them for a period of time to know the authenticity of the goods, just as when they buy other goods [23]. The complete rationality hypothesis of neoclassical economics guarantees the optimal behavior of investors and the general equilibrium of the market under the condition of obtaining complete information [24]. Similarly, under this assumption, the stock market will undoubtedly achieve general equilibrium and achieve Pareto optimality [25]. However, under the real economic conditions, the complete rationality does not exist, mainly in two aspects:
First, information is incomplete. The information distribution among investors in the securities market is not uniform and the adequacy of information disclosure of the listed companies often fails to meet the expectations of investors [26]. The reason why the relevant information of listed companies cannot be fully disclosed may be that the relevant information of listed companies has externality. Once disclosed, the unique strategic value of the information may be known to other companies in the same industry, thus losing the competitive advantage of the information [27]. At this point, the lack of information disclosure of listed companies has endogenous characteristics. Second, market participants have limited rationality. Bounded rationality means that decision makers are limited by incomplete information and exhibit non-optimal behavior [28]. If left laissez-faire, these incomplete rationalities can lead to the failure of many securities markets. Therefore, the information between stock counterfeiters and other stakeholders, especially small and medium shareholders, is extremely asymmetric, which provides a living condition for counterfeiters to falsify. In the long run, there are factors in the stock market that expose the behavior of counterfeiters, which provides conditions for stock market fraud [29]. Therefore, there is a game problem between counterfeiters and stock market fraud. The rational return of stockholders is to buy stocks, then investors will pay more attention to stock dividends. In order to increase the stock price, listed companies must increase the distribution of cash per share [30]. In this way, those companies that only want to make money from the stock market through fraud will fall and the interests of the counterfeiters will be impaired, which will have a certain inhibitory effect on stock market fraud [31]. The normal state of the securities market, such as information asymmetry, bounded rationality and the resulting market failure under realistic conditions to truly reflect the information and efficiency of the securities market.
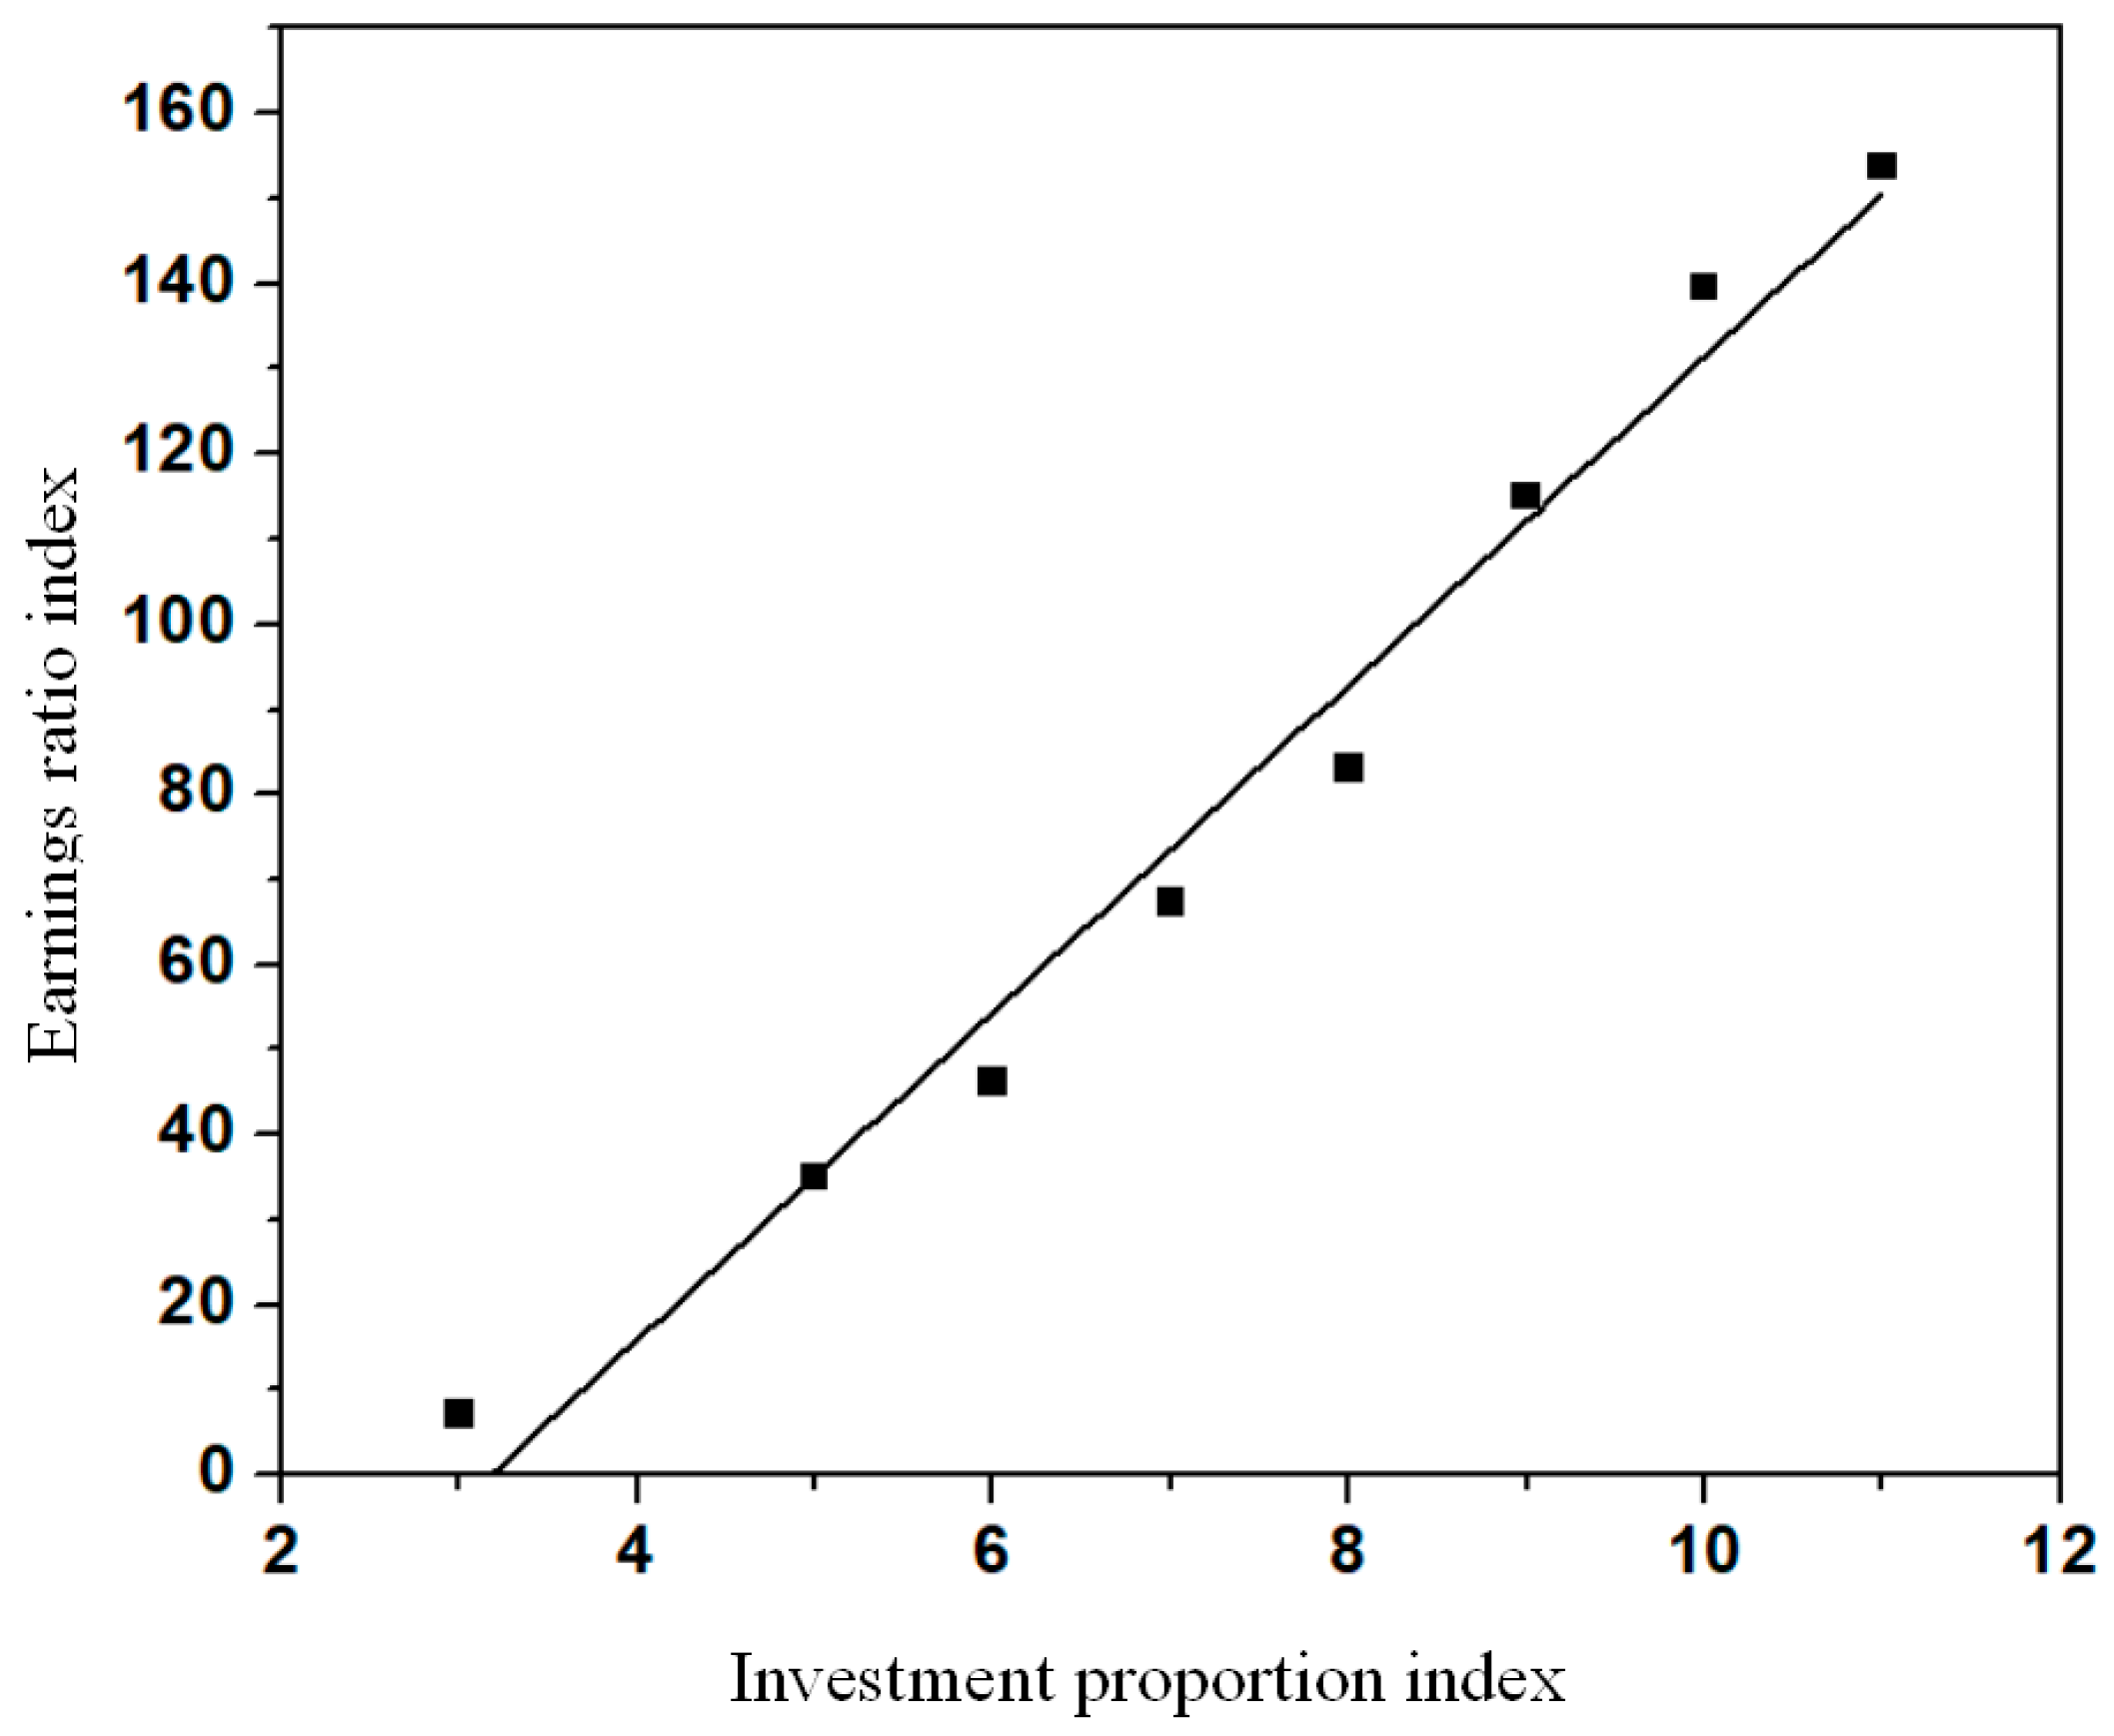
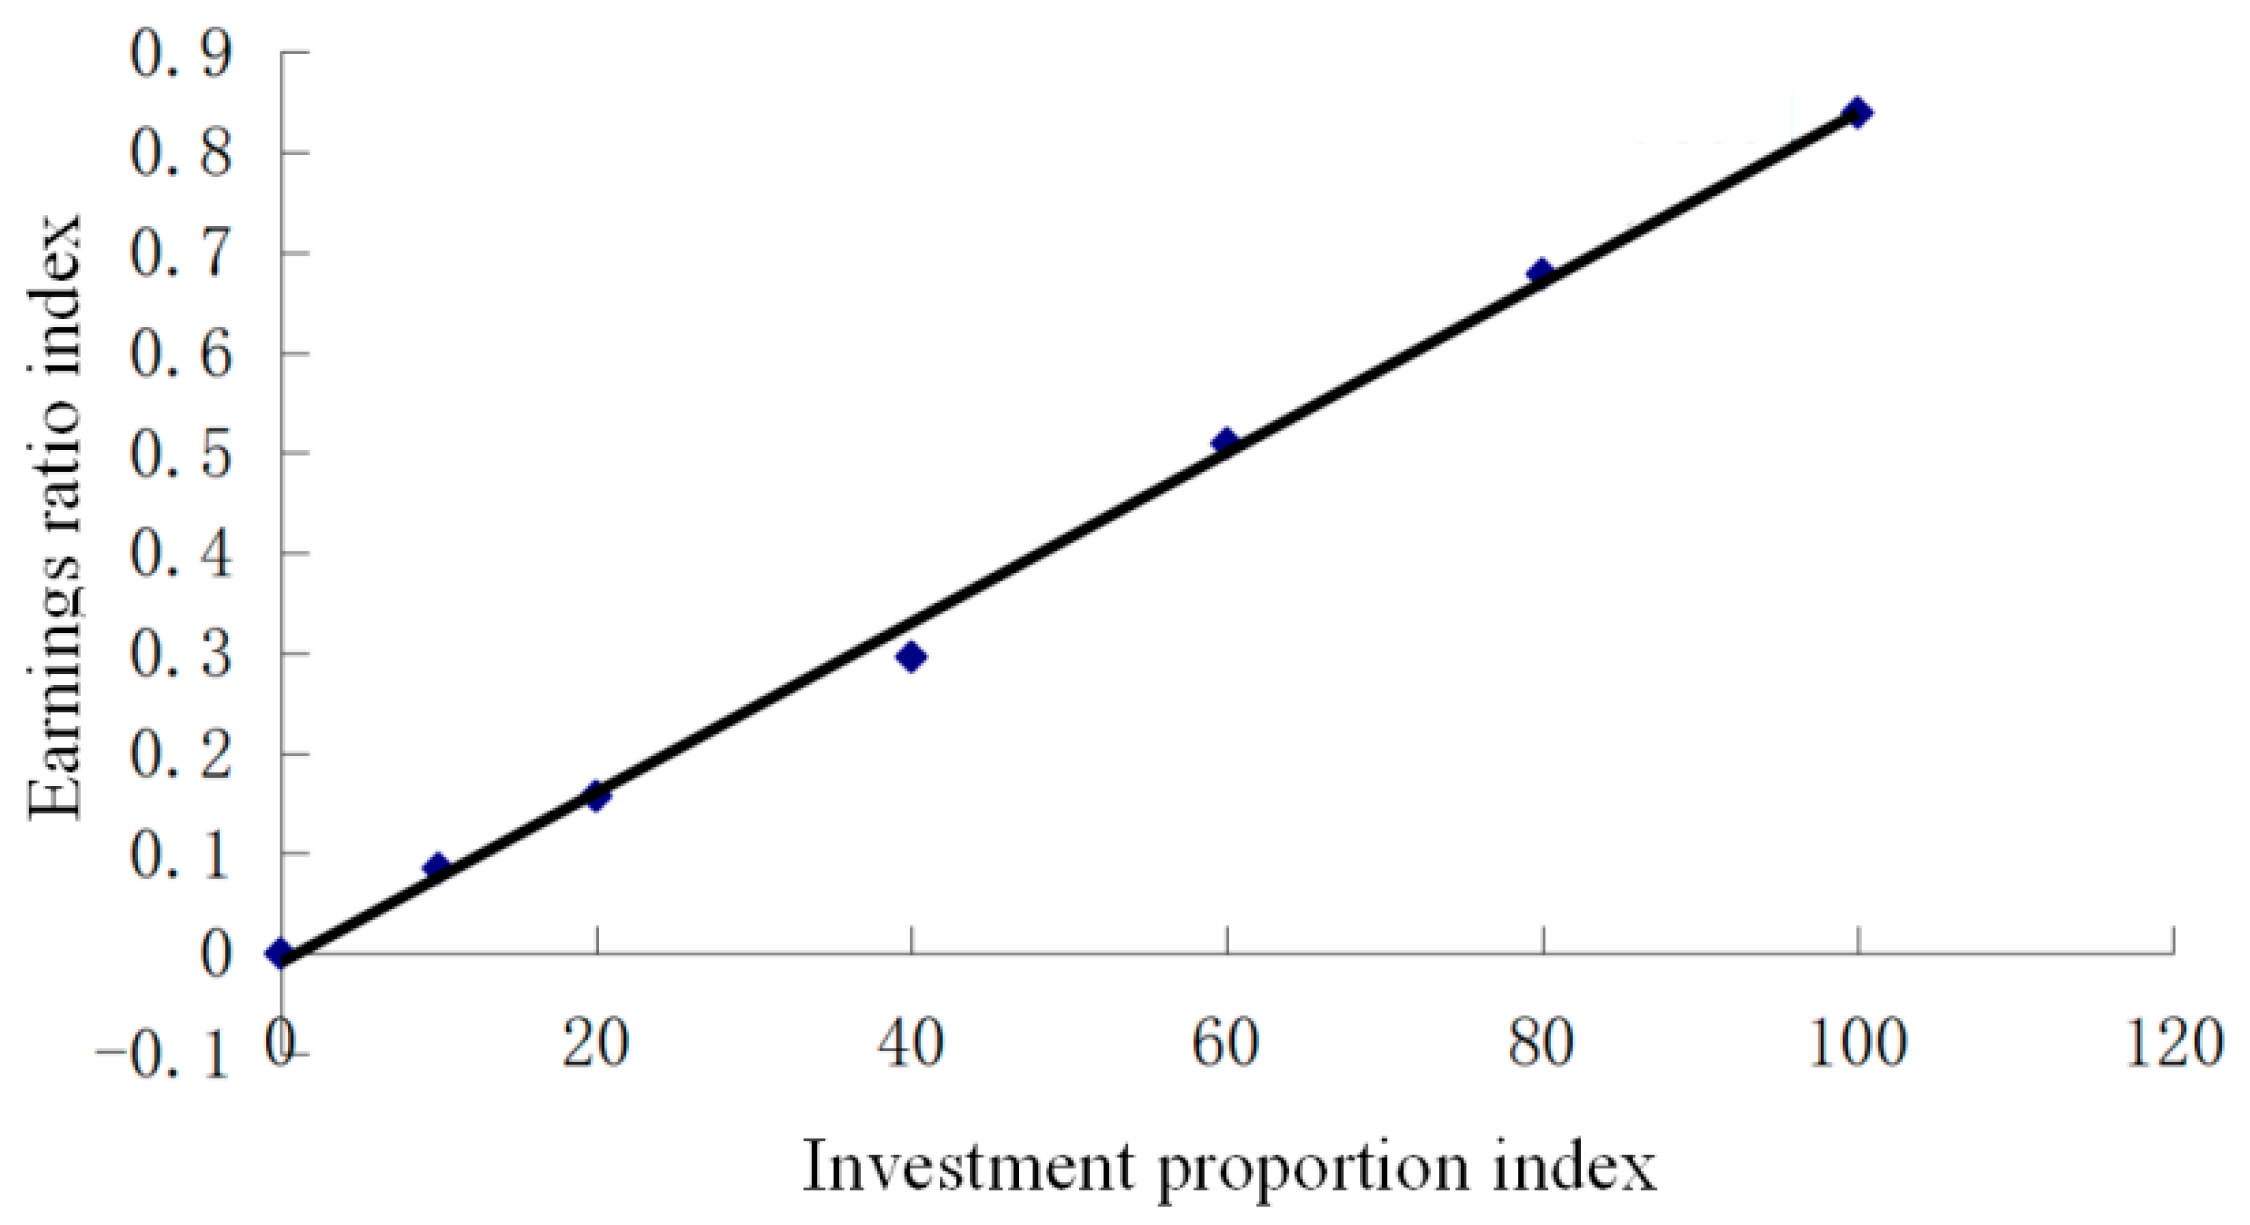
A share investors’ investment income ratio and a share investors’ profit ratio are shown in Figure 1 and Figure 2. The X axis shows the proportion of the investors’ investment and the Y axis represents the proportion of the investors’ earnings.
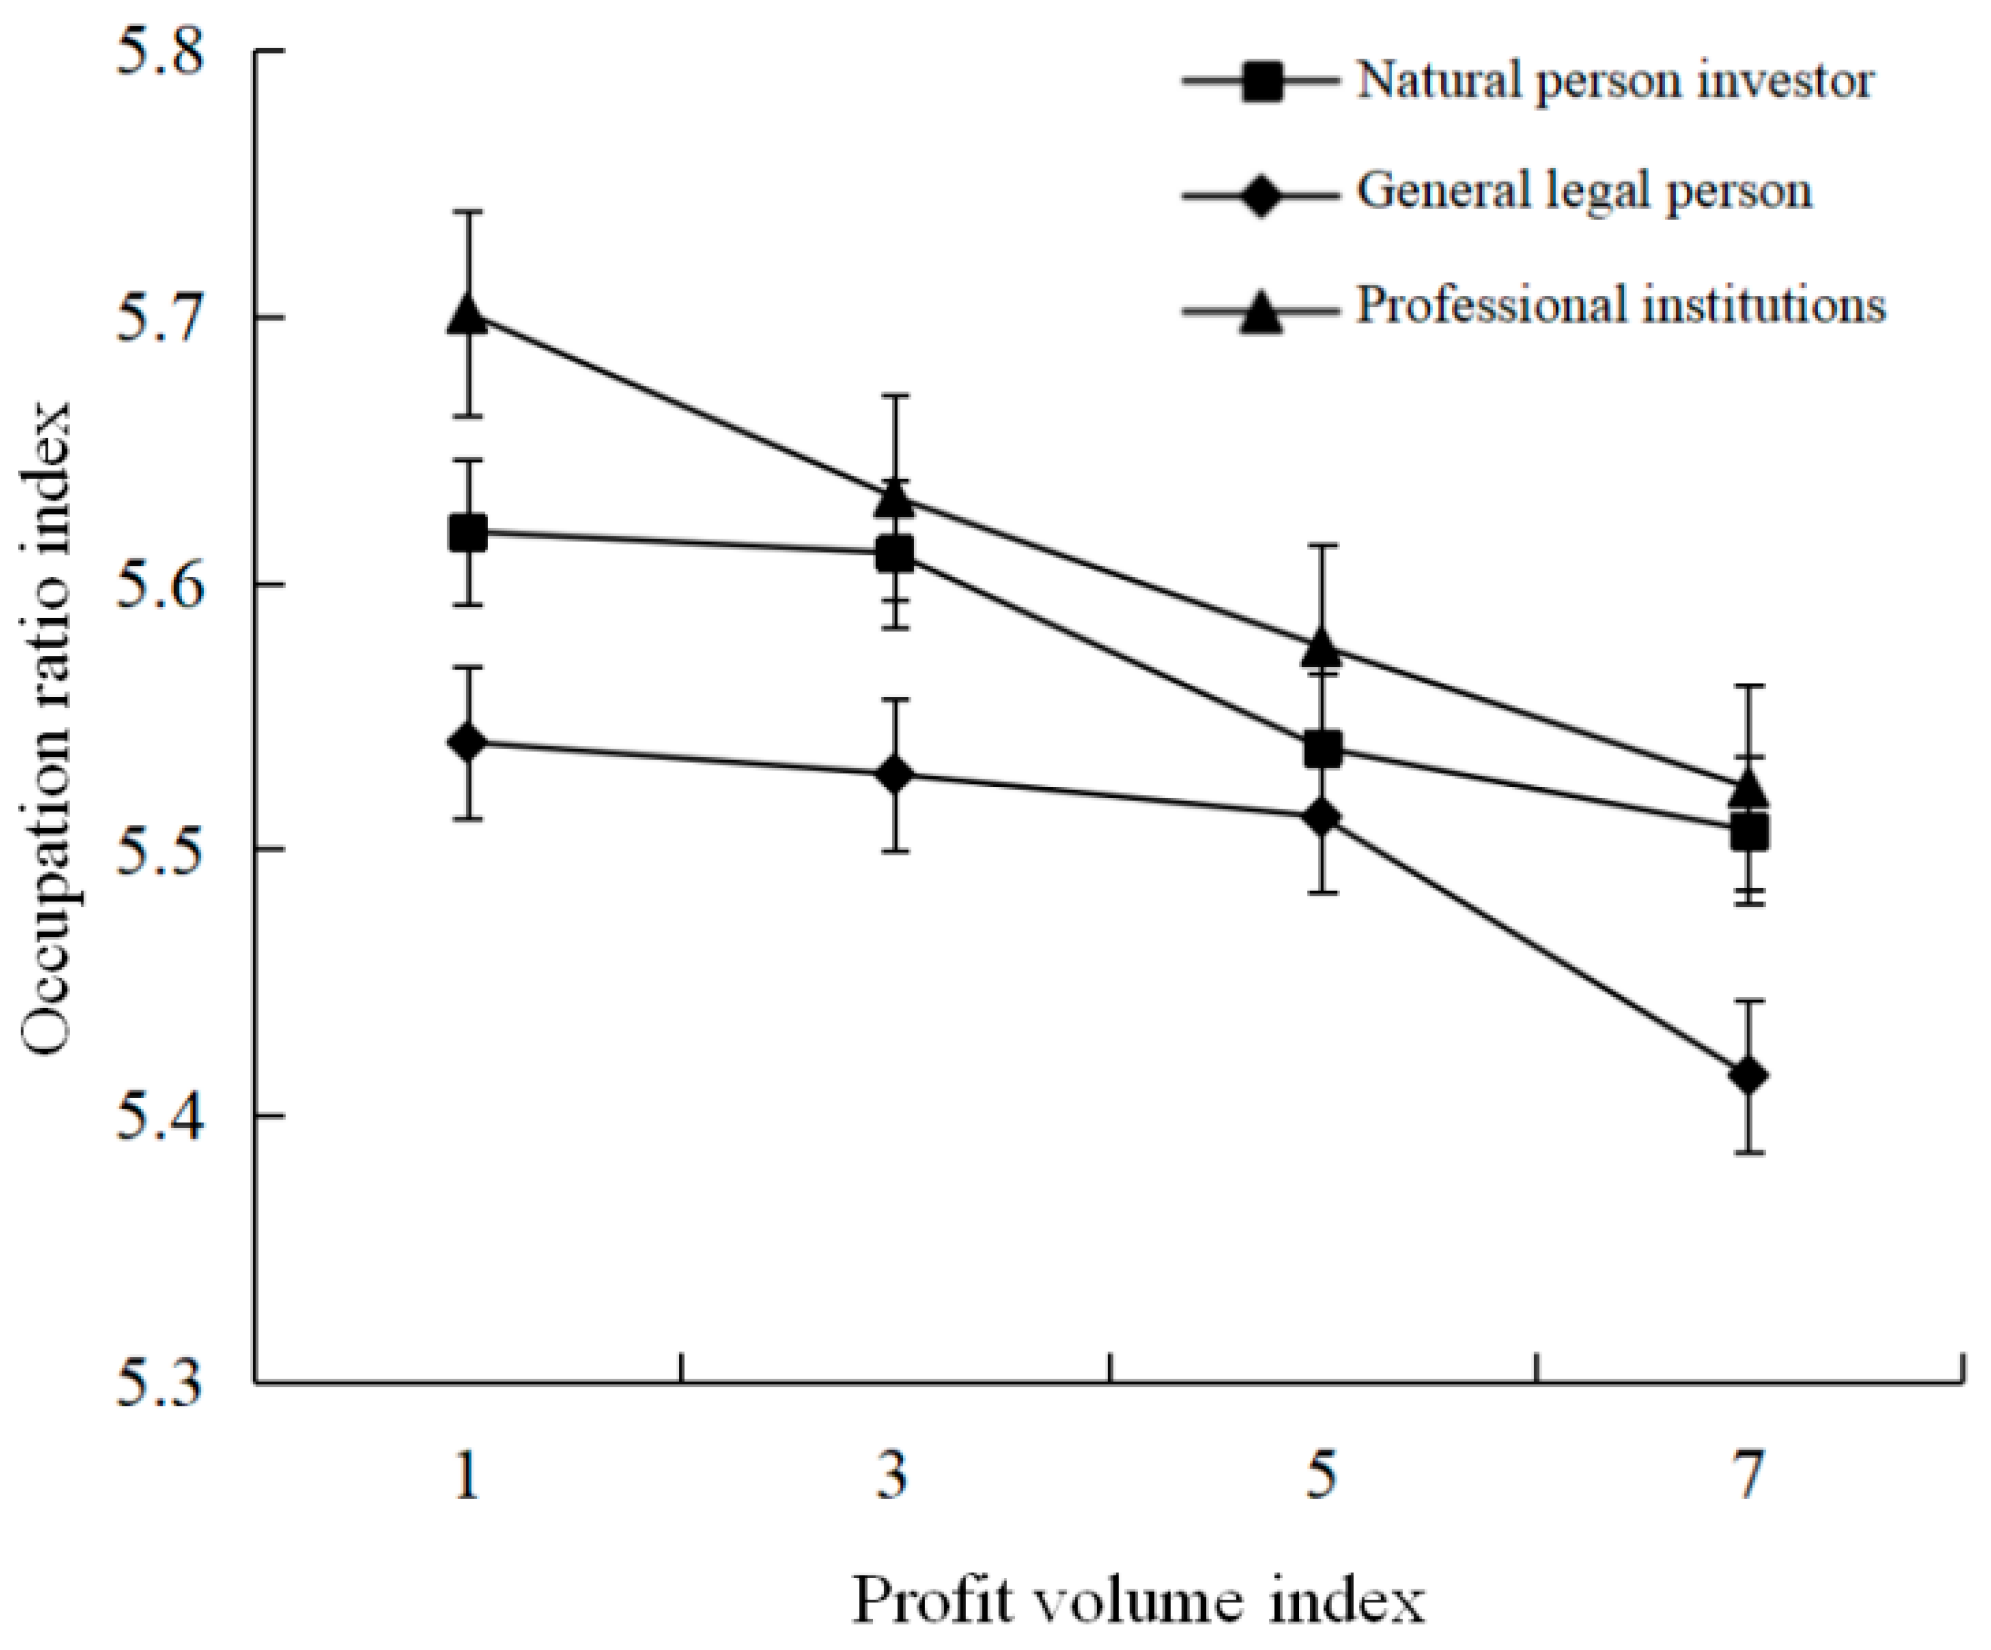
The actual income distribution of investors in the share market is shown in Table 1 and Figure 3. The X axis in the chart represents the profit volume index and the Y axis represents the yield ratio.
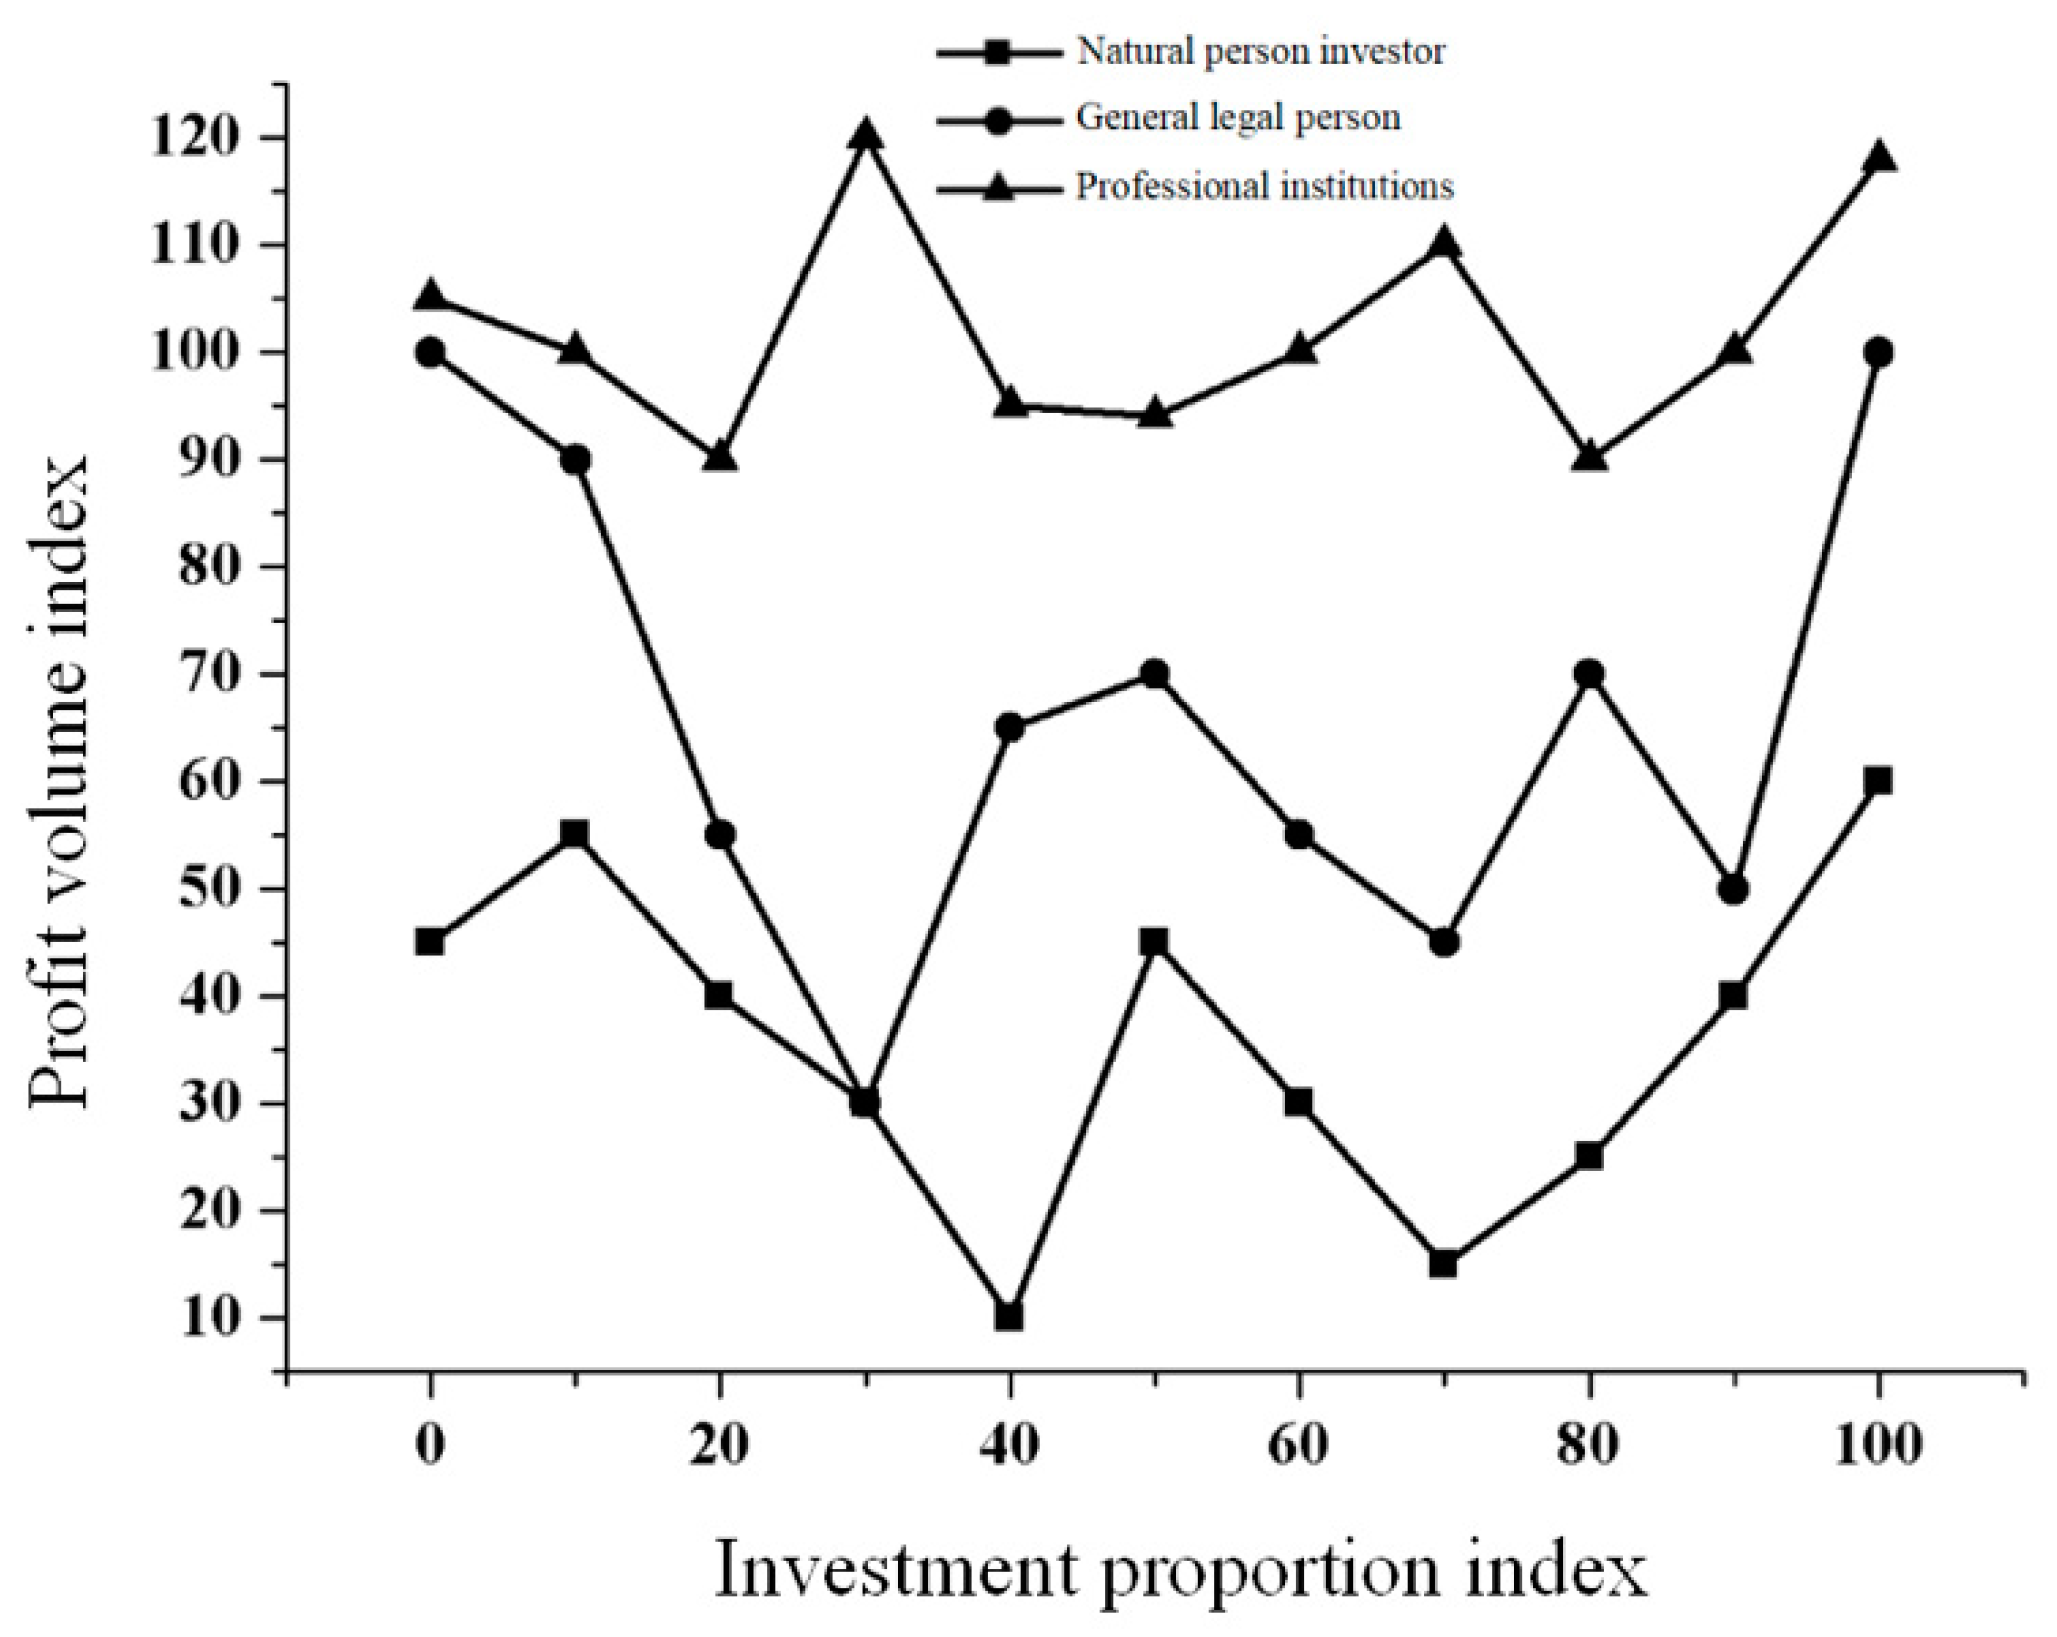
The shareholding of investors in the share market is shown in Figure 4. The X axis represents the investment proportion index and the Y axis represents the profit index.
The risk events in the financial market have good correspondence with the peak of the VIX index. When the risk event occurs, the investor’s panic is intensified. The VIX index reached a local high, which should be accompanied by a sharp fall in stock prices. This further illustrates the close relationship between the VIX index and the investor’s panic, and how the investor’s panic will have a negative impact on stock prices. Therefore, it can be concluded that there is also a certain relationship between the VIX index and the stock price. There is a strong negative relationship between VIX index and the stock market index. So, we can use the VIX index to create derivatives based on the VIX index, providing investors with a financial product against market risk. However, the game model at this time is not a complete information game model. Therefore, the incomplete information game model is not inconsistent with the efficient market hypothesis. The efficient market hypothesis holds that the efficient market eliminates all unused profit opportunities. Therefore, the current price of securities fully reflects all of the available information. The elimination of unused profit opportunities is essential for efficient markets, however it does not require that all market participants have a good grasp of the information. The counterfeiter can make the stock price rise and make a huge profit. Therefore, if its fraudulent behavior is not recognized by the stock market, the fraudulent stock will use its false profits to compete with the fraudulent stock once the counterfeit stock enters the stock market. Under the competitive pressure of counterfeit stocks, the share price of counterfeit stocks declines and the profits are damaged, which induces the counterfeiters to abandon the truth and fake it.
3. Prediction and Analysis of the Stock Market Trend Based on VIX Index
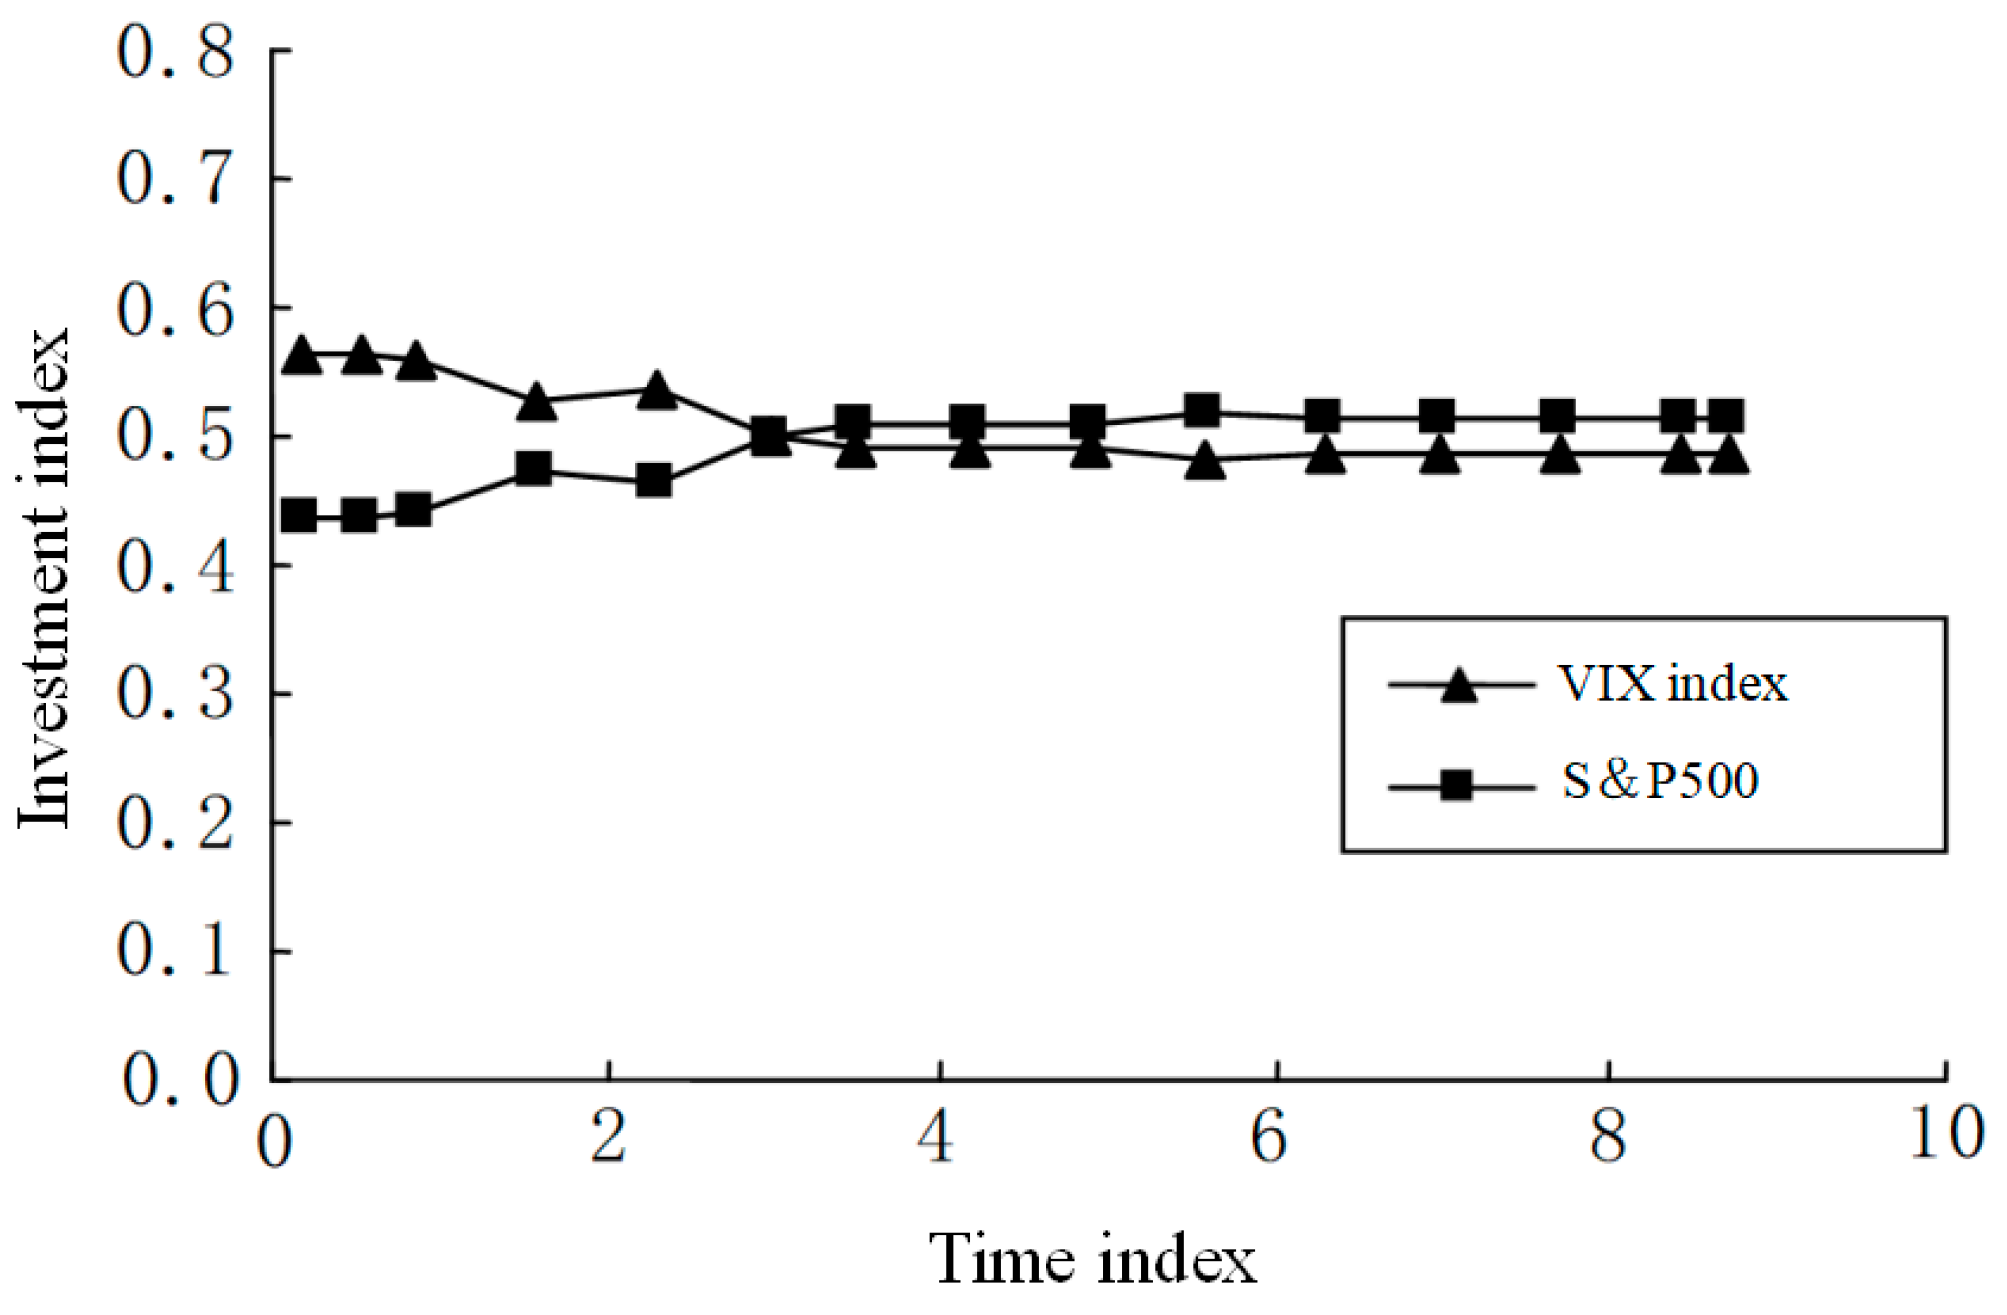
There is indeed a negative relationship between the VIX index and the stock market, which means that investors can arbitrage through the height of the VIX index. So, we need to use the VIX index to estimate the stock market forecast analysis, get a more reliable forecast value, buy low and sell high to achieve the purpose of earning investment returns. Since the VIX index is an investor’s expectation of market volatility, there should be a certain lag order for the future trend of stocks. We use the monthly data of the VIX index and the S&P500 to make a line chart as shown in Figure 5. In the figure, the X axis represents the time index and the Y axis represents the investment index.
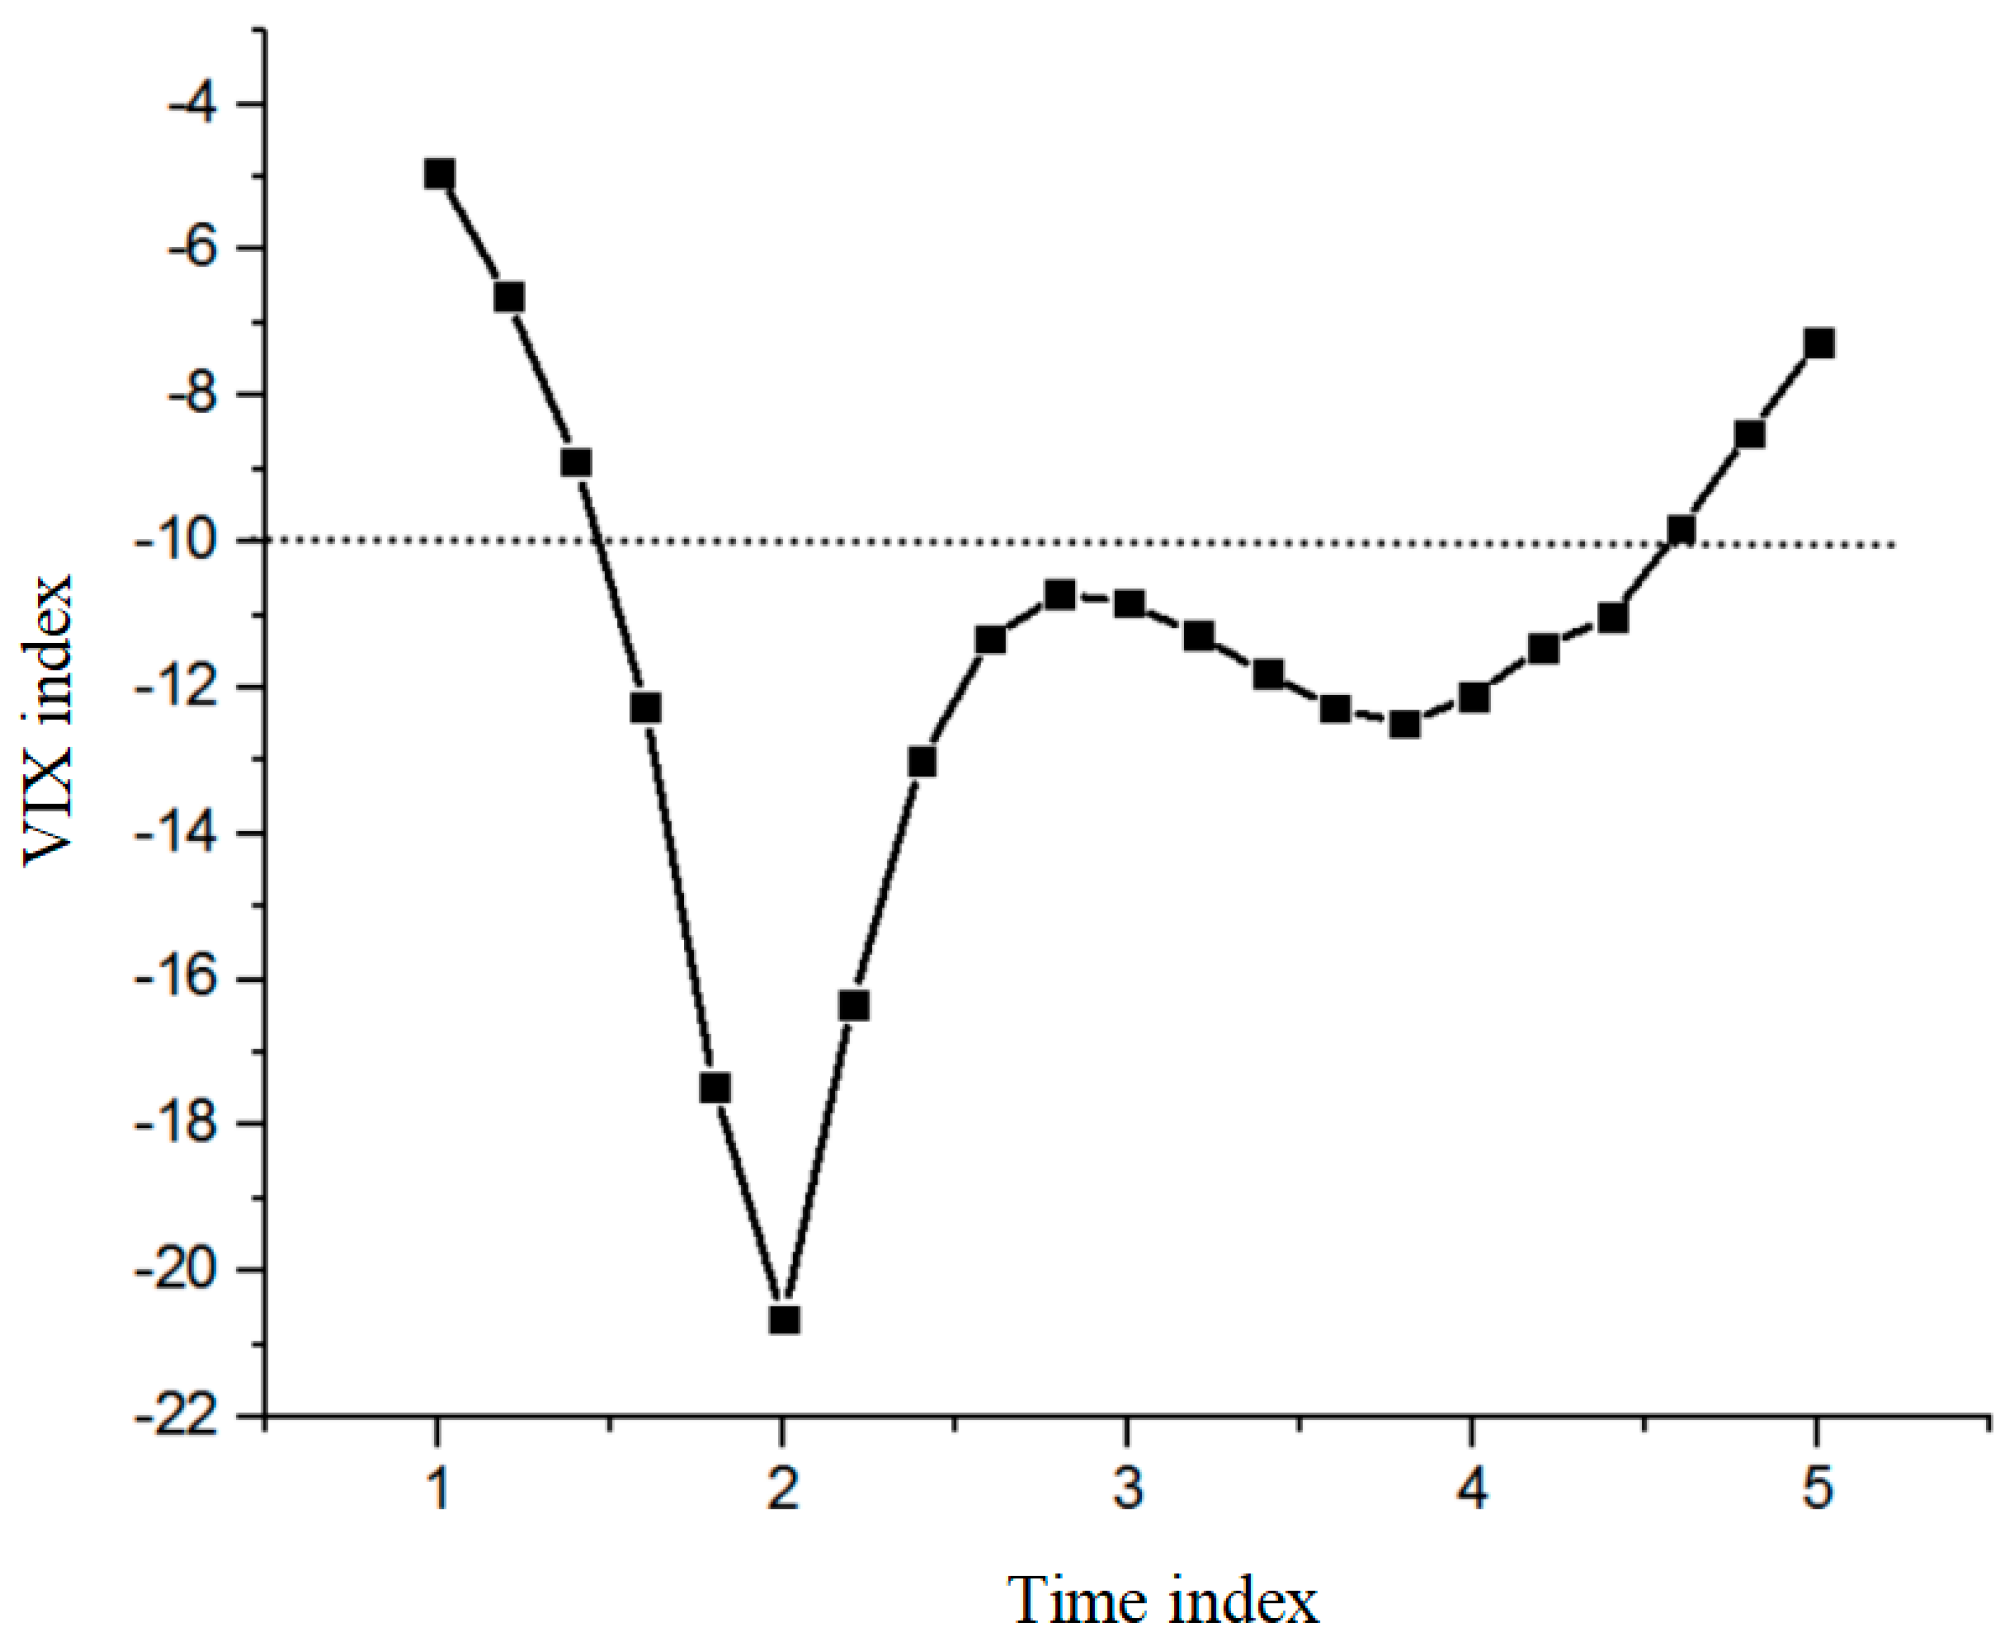
As you can see from Figure 5, VIX, as an emotional indicator of market collapse or crash, shows a level of risk above the average and reached a phased peak. At the same time, when the market is in good condition, the VIX index tends to be stable and has a certain degree of decline. In the course of the S&P500 rise, the VIX index will fall, while in the S&P500 fall, the VIX index will rise sharply. In the meantime, we can see from the observation of Figure 5 that when the VIX index reaches a high point, it is often the time when the market starts to reverse or rebound when it reaches the bottom. The securities regulatory authorities should adopt institutional arrangements for supervision, punishment and information disclosure. In order to effectively control the stock market counterfeiting, the securities regulatory authorities should pay attention to the institutional arrangements for counterfeiting and strengthen supervision and punishment of counterfeiters. The historical chart of the VIX index is shown in Figure 6. The X axis in the chart represents the time trend of the VIX index and the Y axis represents the VIX exponent.
Participants in the game include securities regulators and counterfeiters. This means that the stock market trend has a certain lag order for the VIX index, which means that the stock market has a certain lag in response to the VIX index. After that, this paper takes the VIX index and S&P500 monthly data as an example to calculate the coefficients. Then, by comparing with the coefficient of adding the lag period, we can get the approximate prediction of S&P500 to the lag order of the VIX index. The coefficients obtained are shown in Table 2.
According to Table 2, when the VIX index lags 2, the coefficient between the VIX index and the S&P500 is 0.65, which is the maximum value in the table. So, there is reason to believe that the stock market’s response time to the VIX index is around two months. Based on this, we can establish a model, time series analysis, and, ultimately, according to the parameters of the model, the VIX index can predict the trend of the stock market.
The presence of the unit roots of the three series that were considered was examined using the Enhanced Dickery Fuller (ADF), Phillip Perron (PP) and Kwiatkowski–Phillips–Schmidt–Shin (KPSS) tests. The empty HY model for ADF and PP testing is that the series contains unit roots and is therefore not fixed. In contrast, the null hypothesis of the KPSS test is that the series is fixed. Due to data availability (1446 observations), the data was compiled daily from 16 March, 2011 to 9 December, 2016, covering the implied volatility index of the US (VIX) and BRIC stock markets, as well as oil (Implied volatility index for OVX) and gold (GVZ). The cross-sectional regression analysis of stock liquidity changes that were caused by changes in shareholding structure found that institutional investors’ shareholding ratio was negatively correlated with stock liquidity. Equity concentration is positively related to stock liquidity. There is no significant relationship between equity checks and balances and the shareholding ratio of managers. From the perspective of ownership structure, this paper analyzes the liquidity of private placement stocks and finds that the proportion of institutional investors is negatively correlated with the liquidity of stocks. It is of great theoretical and practical significance to examine the change of stock liquidity from the perspective of the change of stock ownership structure for perfecting the stock ownership structure of listed companies, promoting the perfection of corporate governance, providing valuable information for relevant policy authorities, protecting small and medium investors and improving stock liquidity.
The initial phase is described by the availability of data collected from Thomson Reuters data streams. According to the VIX method, the implied volatility index (IVI) is derived from the price of put and call options, representing a forward-looking measure of the volatility to be realized in their respective asset markets over the next 30 days. With indiavix as a dependent variable, it was observed that the increase (decrease) of crudevix led to the increase (decrease) of indiavix. The latest discoveries have increased MaGyeReh et al. (2016); the implied volatility of crude oil affects the implied volatility of India. In addition, we report that the increase (decrease) in gold reserves has led to an increase (decrease) in the Indian stock market: India’s broader stock market volatility expectations are sensitive to volatility expectations in the oil and gold markets. India’s VIX has no effect on crude oil and gold VIX. The shift of investors from the stock market to the gold market led to an increase in the volatility of gold prices, which led to an increase in the implied volatility of gold prices. This shift will also lead to a loss of liquidity in the stock market, leading to an increase in implied volatility. In the post-crisis period, investors have become risk-averse and have turned to the gold market during short-term uncertainty, thus exacerbating these volatility linkages.
For any function G, conditional expectation s can be expressed as the following Taylor expansion:
If we only extend to the first order and move S to the left side of the equation, we can get:
Considering that a bivariate joint distribution function i and j with edge distribution Q and u is an information set, then there exists a conditional Copula function which makes:
The Copula function assumes that P is the parameter vector in the Copula function:
The joint density function of two variables is obtained from the function expression (1) that is jointly distributed by the condition.
The parameters of Copula are dynamically modeled and then the parameters of each model are estimated by maximizing the logarithmic likelihood function values of the following dynamic Copula functions:
Among them, k, n and d are the parameters of the edge distribution and the Copula function, respectively, and r is the length of the time series.
If the exogenous variable (VIX index) does not have a significant impact on the Copula parameters, the weight G does not have an impact on the parameters. Therefore, the original hypothesis and the opposite hypothesis can be set as follows:
When the constraint condition of the original hypothesis is established, the ST-VCopula model degenerates into a general static Copula model. Suppose the maximum likelihood function is f and the maximum likelihood function is x in the unconstrained case (ST-VCopula model). According to the likelihood ratio test, the following test statistics are constructed.
The PDE of the VIX index call option is derived from the following:
Because M is not a trading asset price, we allow the market risk price S to be related to the VIX index. If the stochastic fluctuation process of VIX obeys the stochastic differential equation k, then the risk-neutral process obeys the following stochastic differential equation:
Thus, a new risk neutral process is obtained:
Since M itself is not the price of a portfolio, whether E is a nonlinear function of the price of other securities or not, it will not affect the nature of the result.
The coefficient T test between VIX index and S&P500 and the coefficient U test between VIX index and S&P500 are shown in Table 3 and Table 4.
The monthly data of VIX index and S&P500 are selected as the analysis data of the time series. At the same time, in order to eliminate the heteroscedasticity in the data and reduce the volatility of the data, the time series data is logarithmic, making it easier to become a wide stationary time series. In the model setting, we use Y to represent the logarithm of the VIX exponent and N to indicate the logarithm of S&P500. Moreover, since the determination of the lag order is two orders above, the data is substituted into the model and the estimated models are as follows:
Then, the residual in the regression equation of the model tested to determine whether there is an equilibrium relationship between VIX index and S&P500. In this paper, we use the ADF test, and the results are shown in Table 5.
As shown in Table 5, the residual sequence rejects the original hypothesis at the 99% confidence level, indicating that the residual sequence is stable. It can be explained that the model is reliable and reasonable and that there is a balanced relationship between VIX index and S&P500.
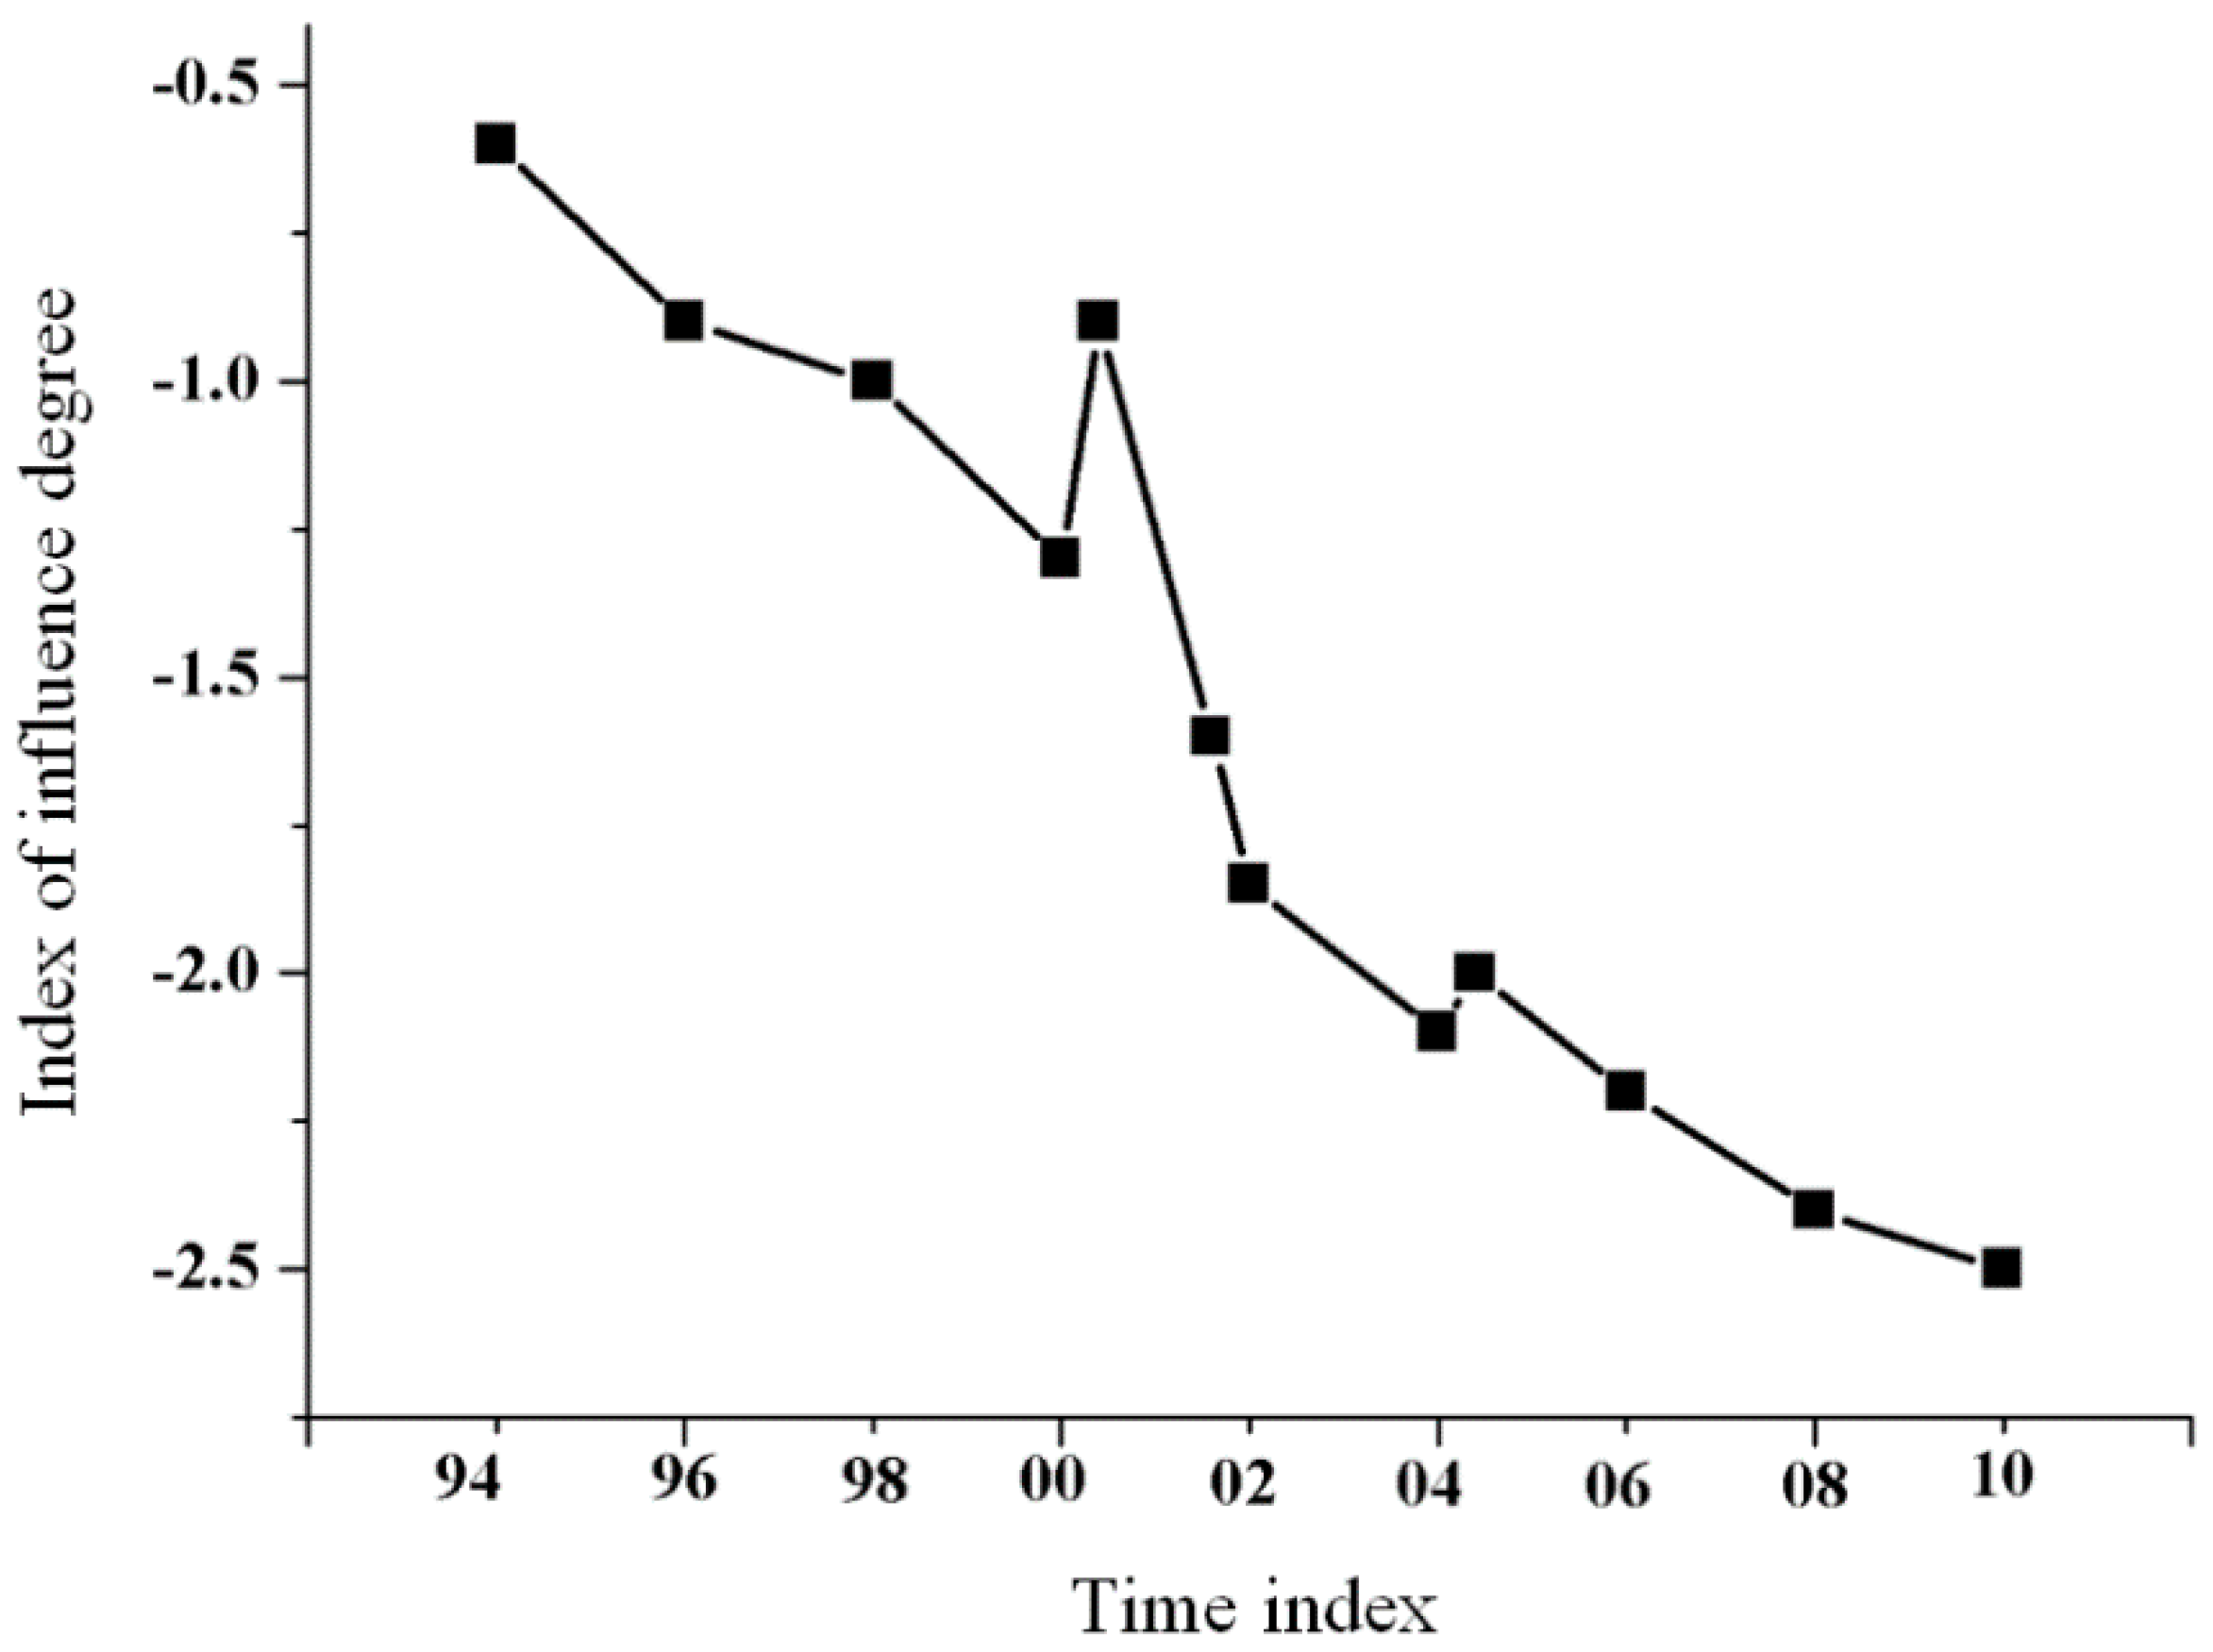
In the model, the G and H values can only be used to show whether the change of one variable has a significant statistical effect on the change of the dependent variable under the premise that other variables remain unchanged. However, it cannot be used to explain the positive and negative relationship between variables and how long the impact will last. In this paper, the problem is characterized by the impulse response function graph and the variance decomposition graph of the model, as shown in Figure 7. The X-axis shows the time required for the pulses to cause the S&P500 fluctuations due to the impact of the VIX exponent, and the Y-axis represents the impact of the VIX exponent to cause the S&P500 fluctuations.
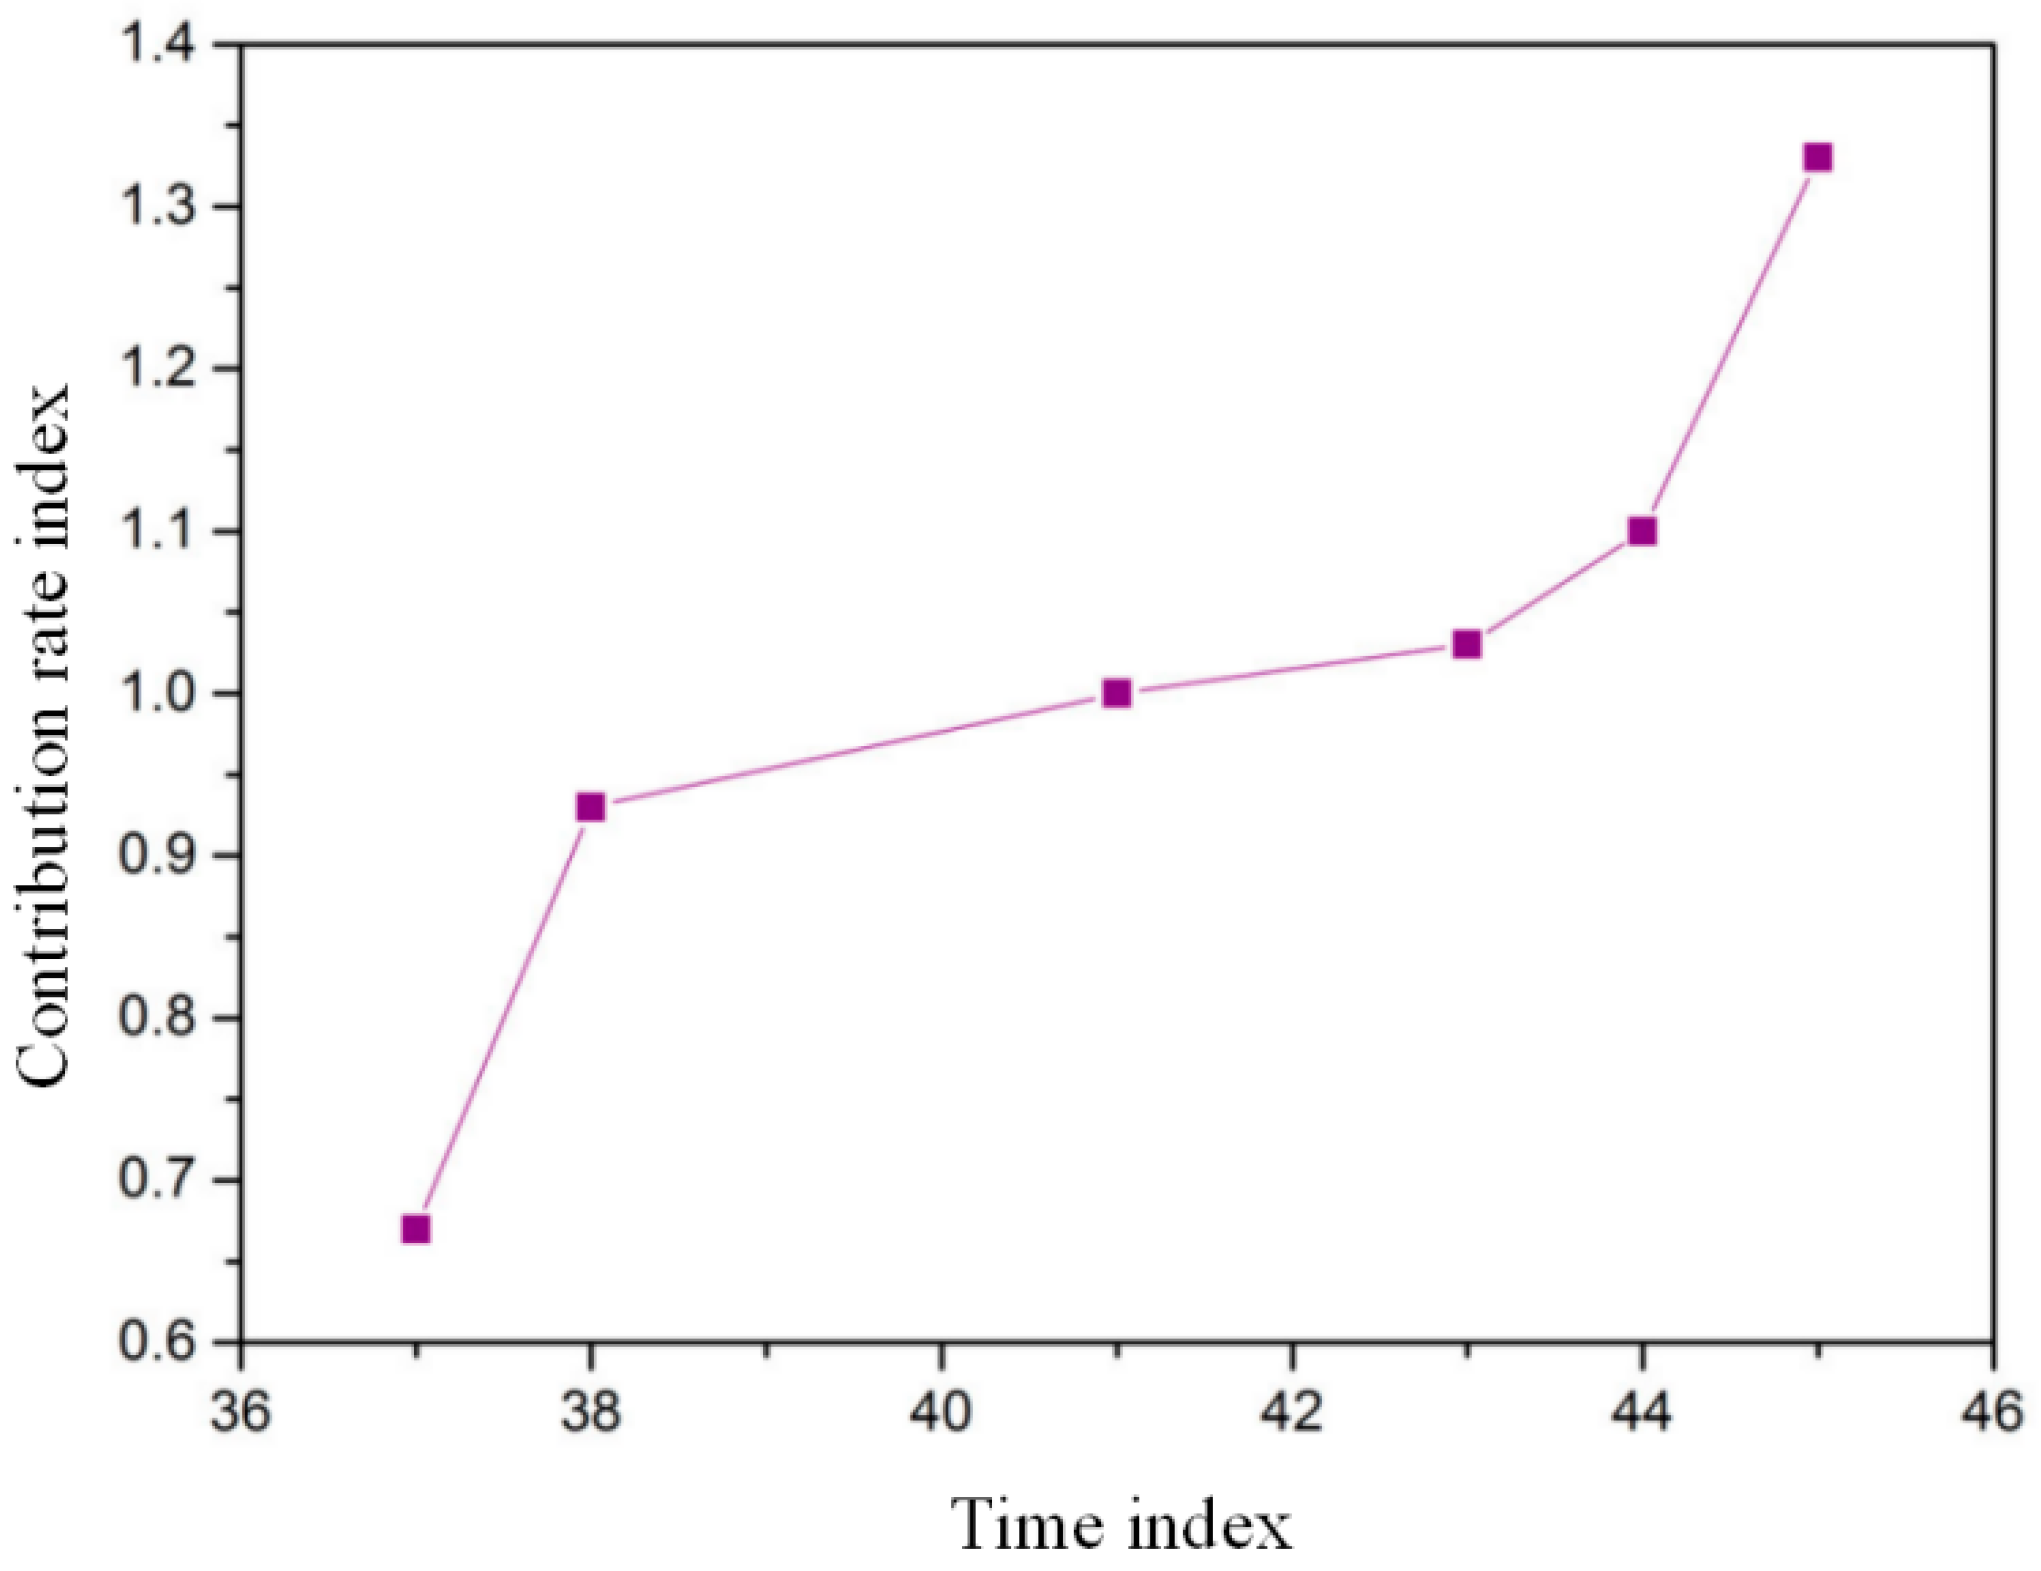
In Figure 8, the variance decomposition method is used to measure the contribution of VIX exponential shocks to S&P500 changes and to determine the importance of VIX exponential changes. Through the above analysis, we can see that there is an internal relationship between the changes of VIX index and S&P500, which is the trend of the stock market. That is to say that the volatility of investor sentiment in the market will indeed have a very far-reaching impact on the future trend of the market. The X-axis shows the time when the VIX exponent shocks the S&P500 and the Y-axis represents the contribution of the VIX exponent shocks to the S&P500.
4. Conclusions
Based on the idea of the STCC model, this paper establishes the ST-Vcopula model, considering the influence of exogenous variables on Copula parameters. Based on the maximum likelihood estimation method, the model parameters are estimated and the model is selected by the likelihood ratio test method. The development of China’s financial system is still imperfect, therefore, the importance of building volatility index in China cannot be ignored. China’s linkage with the international economy is weaker due to policy reasons. However, with the continuous advancement of economic globalization, inter-state linkage has increased in times of crisis. It is very difficult for a country to be completely out of the way. Intermarket linkage analysis is of great significance to investors in risk prediction and hedging. The construction of the VIX index also indicates that China has made a great breakthrough in risk prediction and hedging, which also means that China has taken a solid step on the road to international risk hedging. The VIX index can be regarded as one of the best measures of the future market trend. Further, its great ability in information transmission enables us to use this as a starting point to analyze the impact of changes in the VIX index on the linkage between stock markets, and then to predict the possibility of contagion and spread of the crisis.
Funding
This research was funded by the Fundamental Research Funds for the Central Universities, China (Grant No. 2412018QD028), Jilin Scientific and Technological Development Program, China (Grant No. 20180418095FG) and Social Science research project of Jilin Province Education Department, China (Grant No. JJKH20180057SK).
Acknowledgments
Great thanks to the anonymous reviewers and editors for their constructive comments to this manuscript.
Conflicts of Interest
The author declares no conflict of interest.
References
- Barunik, J.; Kocenda, E.; Vacha, L. Asymmetric Connectedness on the U.S. Stock Market: Bad and Good Volatility Spillovers. J. Financ. Mark. 2016, 27, 55–78. [Google Scholar] [CrossRef]
- Yarovaya, L.; Brzeszczyński, J.; Chi, K.M.L. Volatility spillovers across stock index futures in Asian markets: Evidence from range volatility estimators. Financ. Res. Lett. 2016, 17, 158–166. [Google Scholar] [CrossRef] [Green Version]
- Nasr, A.B.; Lux, T.; Ajmi, A.N.; Gupta, R. Forecasting the volatility of the Dow Jones Islamic Stock Market Index: Long memory vs. regime switching. Int. Rev. Econ. Financ. 2016, 45, 559–571. [Google Scholar] [CrossRef] [Green Version]
- Gamba-Santamaria, S.; Gomez-Gonzalez, J.E.; Hurtado-Guarin, J.L.; Melo-Velandia, L.F. Stock Market Volatility Spillovers: Evidence for Latin America. Financ. Res. Lett. 2016, 20, 207–216. [Google Scholar] [CrossRef]
- Hong, M.; Ramchander, S.; Wang, T.; Yang, D. Role of index futures on China’s stock markets: Evidence from price discovery and volatility spillover. Pac-Basin Financ. J. 2017, 44, 13–26. [Google Scholar]
- Pati, P.C.; Barai, P.; Rajib, P. Forecasting stock market volatility and information content of implied volatility index. Appl. Econ. 2018, 50, 1–17. [Google Scholar] [CrossRef]
- Dimpfl, T.; Jank, S. Can Internet Search Queries Help to Predict Stock Market Volatility? Eur. Financ. Manag. 2016, 22, 171–192. [Google Scholar] [CrossRef]
- O’Neill, M.; Wang, K.; Liu, Z. A State-Price Volatility Index for China’s Stock Market. Account. Financ. 2016, 56, 607–626. [Google Scholar] [CrossRef]
- Lee, H.C.; Hsu, C.H.; Chien, C.Y. Spillovers of international interest rate swap markets and stock market volatility. Manag. Financ. 2016, 42, 943–962. [Google Scholar] [CrossRef]
- Chen, M. The Impact of Margin Trading on Volatility of Stock Market: Evidence from SSE 50 Index. J. Financ. Risk Manag. 2016, 5, 178–188. [Google Scholar] [CrossRef]
- Luo, L.; Pairote, S.; Chatpatanasiri, R. GARCH-type forecasting models for volatility of stock market and MCS test. Commun. Stat. Simul. Comput. 2016, 46, 5303–5312. [Google Scholar] [CrossRef]
- Joher, H.; Ahmed, A.; Hassan, A.; Nasir, A.M.D. The Relationship between Trading Volume, Volatility and Stock Market Returns: A test of Mixed Distribution Hypothesis for A Pre-and Post Crisis on Kuala Lumpur Stock Exchange. Invest. Manag. Financ. Innov. 2017, 2, 146–158. [Google Scholar]
- Kang, S.H.; McIver, R.; Yoon, S.M. Modeling time-varying correlations in volatility between BRICS and commodity markets. Emerg. Mark. Financ. Tr. 2016, 52, 1698–1723. [Google Scholar] [CrossRef]
- Baur, D.G.; McDermott, T.K. Is gold a safe haven? International evidence. J. Bank. Finance 2010, 34, 1886–1898. [Google Scholar] [CrossRef]
- Xu, H.; Hamori, S. Dynamic linkages of stock prices between the BRICs and the United States: Effects of the 2008–2009 financial crisis. J. Asian Econ. 2012, 23, 344–352. [Google Scholar] [CrossRef]
- Mensi, W.; Hammoudeh, S.; Reboredo, J.C.; Nguyen, D.K. Do global factors impact BRICS stock markets? A quantile regression approach. Emerg. Mark. Rev. 2014, 19, 1–17. [Google Scholar] [CrossRef]
- Waygood, S.; Waygood, S. How do the capital markets undermine sustainable development? What can be done to correct this? J. Sustain. Financ. Invest. 2011, 1, 81–87. [Google Scholar] [CrossRef]
- Ko, J.H.; Lee, C.M. International economic policy uncertainty and stock prices: Wavelet approach. Econ. Lett. 2015, 134, 118–122. [Google Scholar] [CrossRef]
- Nath Sahu, T.; Bandopadhyay, K.; Mondal, D. An empirical study on the dynamic relationship between oil prices and Indian stock market. Manag. Finance 2014, 40, 200–215. [Google Scholar] [CrossRef]
- Rada, J.; Trisoglio, A. Capital-Markets and Sustainable Development. Columbia J. World Bus. 1992, 27, 42–50. [Google Scholar]
- Ma, S.; Tian, G.; Andrew, B. Sustainable development of the Chinese economy and capital market. J. Asia Pac. Econ. 2016, 21, 321–324. [Google Scholar] [CrossRef]
- Victor, P.A. Indicators of sustainable development: Some lessons from capital theory. Ecol. Econ. 1991, 4, 191–213. [Google Scholar] [CrossRef]
- Gowdy, J.M. The Social Context of Natural Capital: The Social Limits to Sustainable Development. Int. J. Soc. Econ. 1994, 21, 43–55. [Google Scholar] [CrossRef]
- Samuel, S.E.; Alih, U.; Yaro, I.B. The Impact of Globalization on Capital Markets and the Mobilization of Foreign Capital for Sustainable Development in Africa. Kogi J. Account. 2013, 1, 141–152. [Google Scholar]
- Rutkauskas, A.V.; Miečinskiene, A.; Stasytyte, V. Investment decisions modelling along sustainable development concept on financial markets. Ukio Technol. Ir Èkon. Vystym. 2008, 14, 417–427. [Google Scholar] [CrossRef]
- Salvioni, D.M.; Bosetti, L. Sustainable Development and Corporate Communication in Global Markets. Symph. Emerg. Issues Manag. 2014, 1, 1–19. [Google Scholar] [CrossRef] [Green Version]
- Bouri, E.; Jain, A.; Biswal, P.C.; Roubaud, D. Cointegration and nonlinear causality amongst gold, oil, and the Indian stock market: Evidence from implied volatility indices. Resour. Policy 2017, 52, 201–206. [Google Scholar] [CrossRef]
- Bouri, E.; Roubaud, D.; Jammazi, R.; Assaf, A. Uncovering frequency domain causality between gold and the stock markets of China and India: Evidence from implied volatility indices. Financ. Res. Lett. 2017, 23, 23–30. [Google Scholar] [CrossRef]
- Ji, Q.; Bouri, E.; Roubaud, D. Dynamic network of implied volatility transmission among US equities, strategic commodities, and BRICS equities. Int. Rev. Financ. Anal. 2018, 57, 1–12. [Google Scholar] [CrossRef]
- Yang, L.; Tian, S.; Yang, W.; Xu, W.; Hamori, S. Dependence structures between Chinese stock markets and the international financial market: Evidence from a wavelet-based quantile regression approach. N. Am. J. Econ. Financ. 2018, 45, 116–137. [Google Scholar] [CrossRef]
- Yang, L.; Yang, L.; Hamori, S. Determinants of dependence structures of sovereign credit default swap spreads between G7 and BRICS countries. Int. Rev. Financ. Anal. 2018, 59, 19–34. [Google Scholar] [CrossRef]
Figure 1.
A share investors’ return on investment ratio.

Figure 2.
Profit share of share investors.

Figure 3.
The actual income distribution of investors in the share market.

Figure 4.
A share investors’ investment ratio.

Figure 5.
Monthly charts of VIX index (influence of market volatility) and S&P500.

Figure 6.
Historical trend of the VIX index.

Figure 7.
Impulse response function of S&P500 fluctuation caused by the impact of the VIX exponent.

Figure 8.
Impact of the VIX index’s impact on S&P500 changes.


Table 1.
The actual income distribution of investors in the share market.
| Investor Classification | Profit Amount (100 million yuan) |
|---|---|
| Natural person investor | 19,874.19 |
| General legal person | 6871.96 |
| Professional institutions | 13,541.98 |
| Total | 40,288.13 |
Table 2.
Coefficient table between S&P500 and the lagged VIX index.
| Lag Period | Correlation Coefficient |
|---|---|
| 1 | 0.58 |
| 2 | 0.65 |
| 5 | 0.45 |
Table 3.
T test of the coefficient between VIX index and S&P500.
| Correlation Coefficient | n | t Value |
|---|---|---|
| 0.148 | 159 | 15.64 |
| 0.294 | 186 | 16.64 |
| 0.291 | 168 | 17.56 |
Table 4.
U test of the coefficient between VIX index and S&P500.
| Correlation Coefficient | n | t Value |
|---|---|---|
| 0.641 | 162 | 13.26 |
| 0.418 | 168 | 15.19 |
| 0.694 | 191 | 17.19 |
Table 5.
Test for residuals of the regression equation.
| Test Critical Values | t-Statistic |
|---|---|
| 10% level | 0.26 |
| 15% level | 0.29 |
| 20% level | 0.28 |
© 2018 by the author. Licensee MDPI, Basel, Switzerland. This article is an open access article distributed under the terms and conditions of the Creative Commons Attribution (CC BY) license (http://creativecommons.org/licenses/by/4.0/).
Share and Cite
MDPI and ACS Style
Ruan, L. Research on Sustainable Development of the Stock Market Based on VIX Index. Sustainability 2018, 10, 4113. https://0-doi-org.brum.beds.ac.uk/10.3390/su10114113
AMA Style
Ruan L. Research on Sustainable Development of the Stock Market Based on VIX Index. Sustainability. 2018; 10(11):4113. https://0-doi-org.brum.beds.ac.uk/10.3390/su10114113
Chicago/Turabian StyleRuan, Lei. 2018. "Research on Sustainable Development of the Stock Market Based on VIX Index" Sustainability 10, no. 11: 4113. https://0-doi-org.brum.beds.ac.uk/10.3390/su10114113
Note that from the first issue of 2016, this journal uses article numbers instead of page numbers. See further details here.