Following the methods outlined in
Section 3.2.2, this paper created the patent citation network for SWH/PV patents (see
Figure 3,
Figure 4,
Figure 5,
Figure 6,
Figure 7 and
Figure 8) based on the cleaned patent data. To develop a better overview, we included all patents of the top 50 global SWH/PV firms, and all the case firms were included. In September 2007, China issued the Mid-term and Long-term Development Plan for Renewable Energy in China, and proposed a national renewable energy development target including wind, solar, and biomass energy. Around 2008, along with the global financial crisis, a series of consumer-promotion policies such as home appliances going to the countryside, promoting SWH, and trade-in replacements.
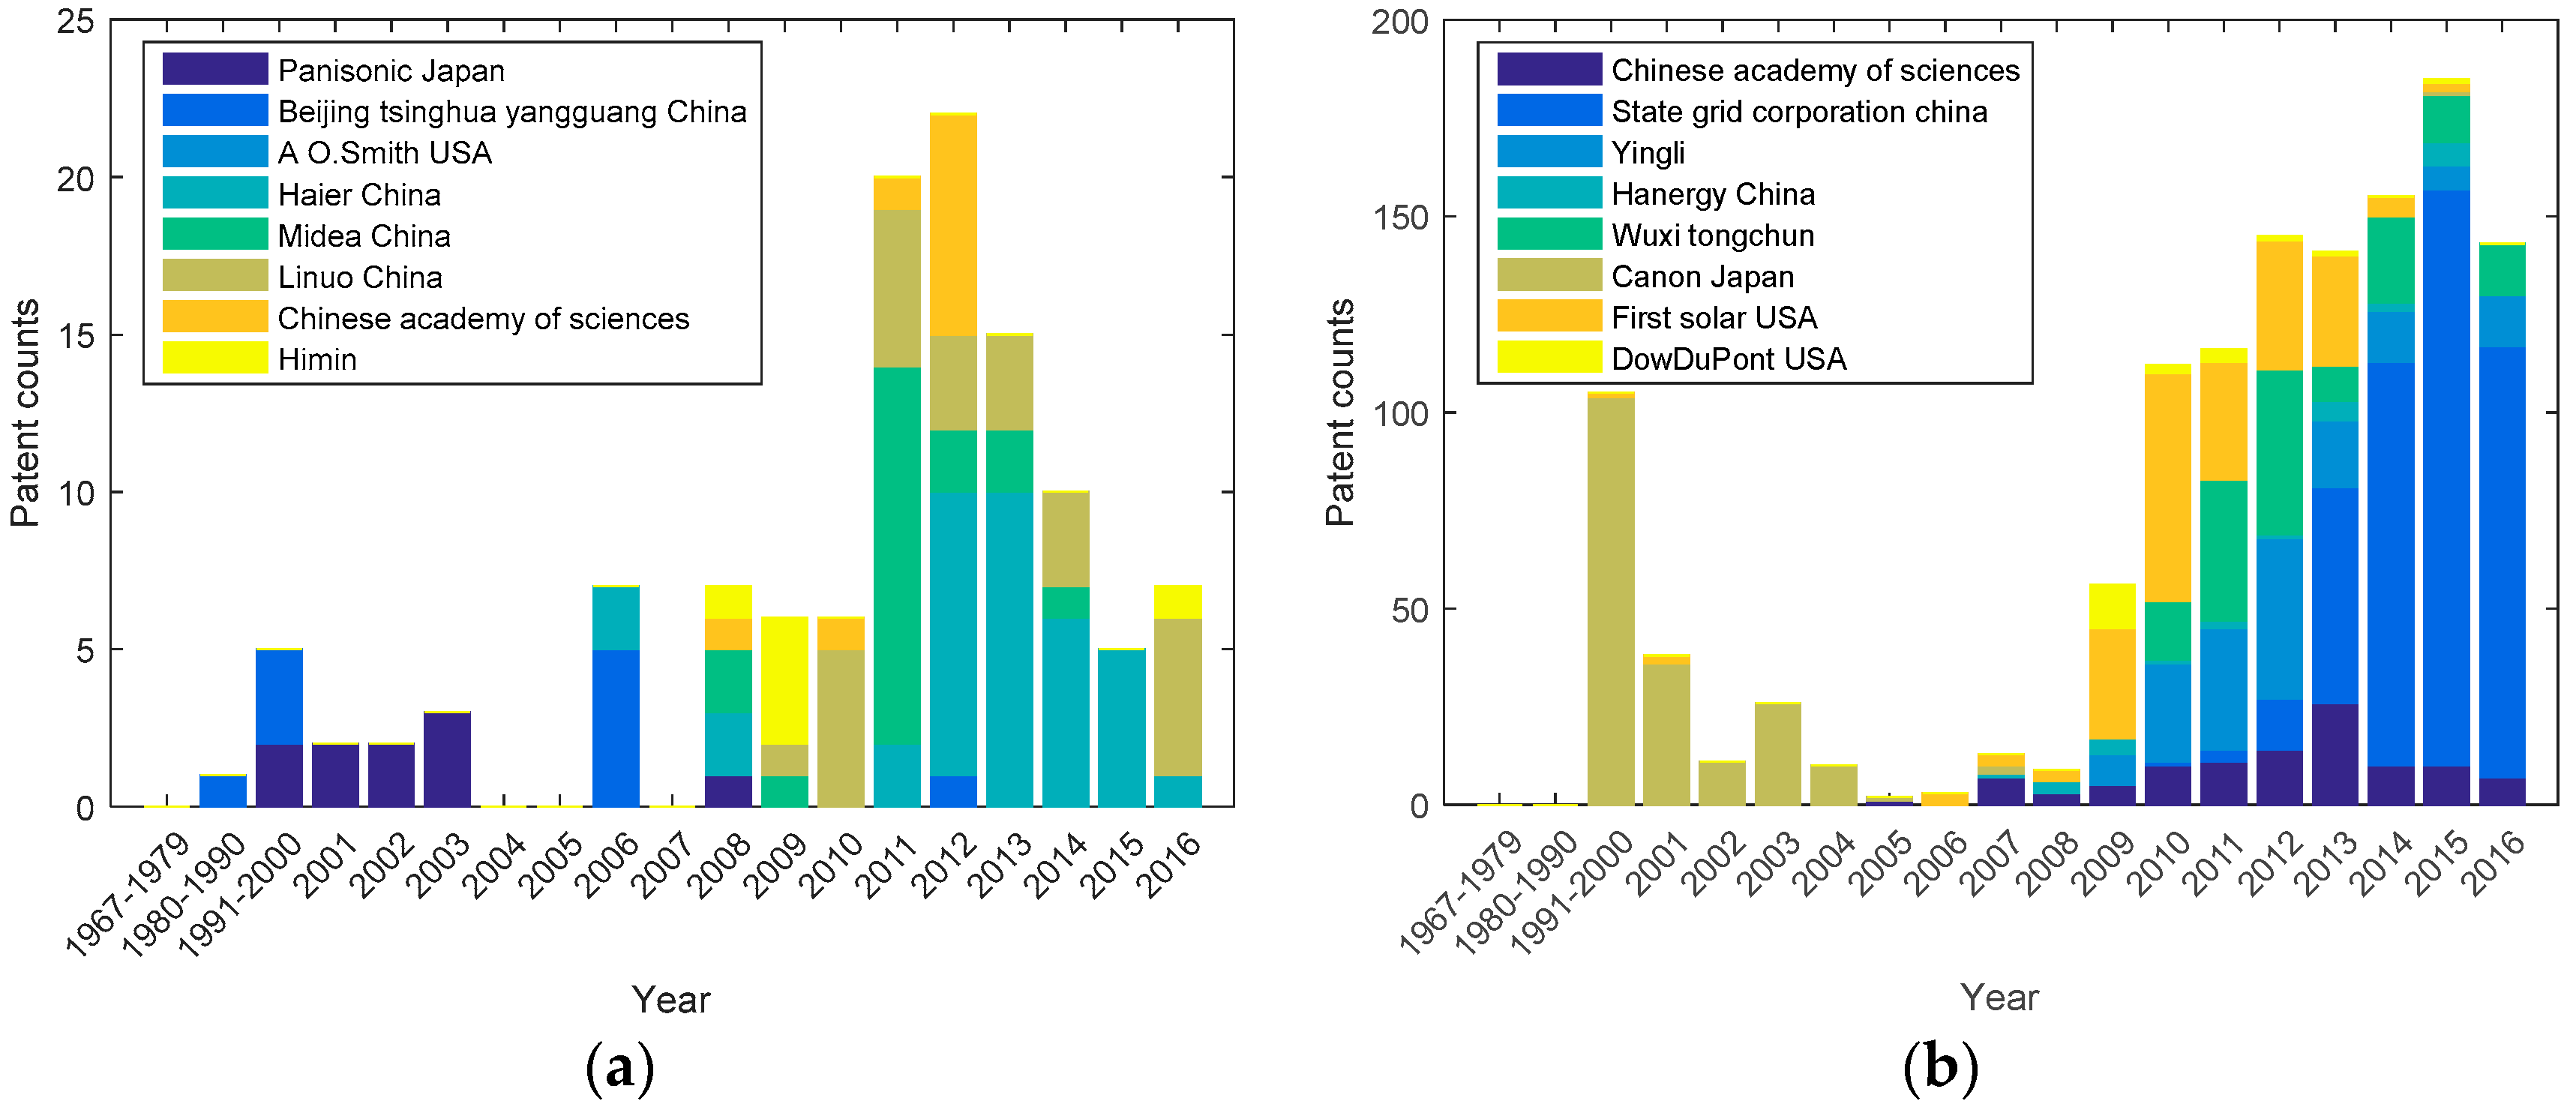
Figure 1 and
Figure 2 show that 2008 was a critical turning point for the solar energy industry. This may be because of the Eleventh Five-Year Plan of Renewable Energy Development promulgated in 2008, which promoted the development of the solar industry, particularly PV. Based on the above, our research divided the period (1995–2016) into two phases, making 2008 the cutoff year (in
Section 3.2.3), to construct two sub-networks (1995–2008 and 2009–2016) and a full network (1995–2016). This allowed us to research the organizations’ growth changes over time.
Table 3 and
Table 5 show the evolution of the network structure’s key indicators for the different periods.
4.2.1. SWH Patent Citation Network Analysis
As
Table 3 shows, the increase in network density (total patents/total citations) is consistent with the exponential growth in patent citations of SWH firms after 2008, while the total number of patents also increased, which means the knowledge flows (citations) appear to have increased within the network. The average distance means the shortest average paths between key nodes. The rise of average distance values suggests that knowledge diffuses faster in the 2009–2016 network compared with the earlier network (1995–2008), as more and more actors are emerging and the network is more complex. In addition, the decrease in fragmentation (proportion of firms/nodes that could not reach each other) means that the number of isolated islands within the SWH patent network has decreased. The obvious increase in reciprocity (full-time network) indicates that the producers and consumers of knowledge have changed significantly over time in the SWH industry, which means that after the innovation leaders spilled over knowledge before 2008, the latecomers learned and absorbed much, and some may have grown into knowledge spillers. Next, the minor value of distance-based cohesion in the network (1995–2008) means the competition level is low in the Chinese SWH industry before 2008, but the obvious increase in cohesion (compactness) means the SWH industry is growing quickly, and more inter-firm knowledge flow occurs. In-degree centrality increased more than out-degree centrality after 2008, indicating more and more latecomers, but the conspicuous change after 2008 means that new dominant leaders are emerging, hence knowledge competition may have matured in the SWH industry and no stronger competition emerges in the later network.
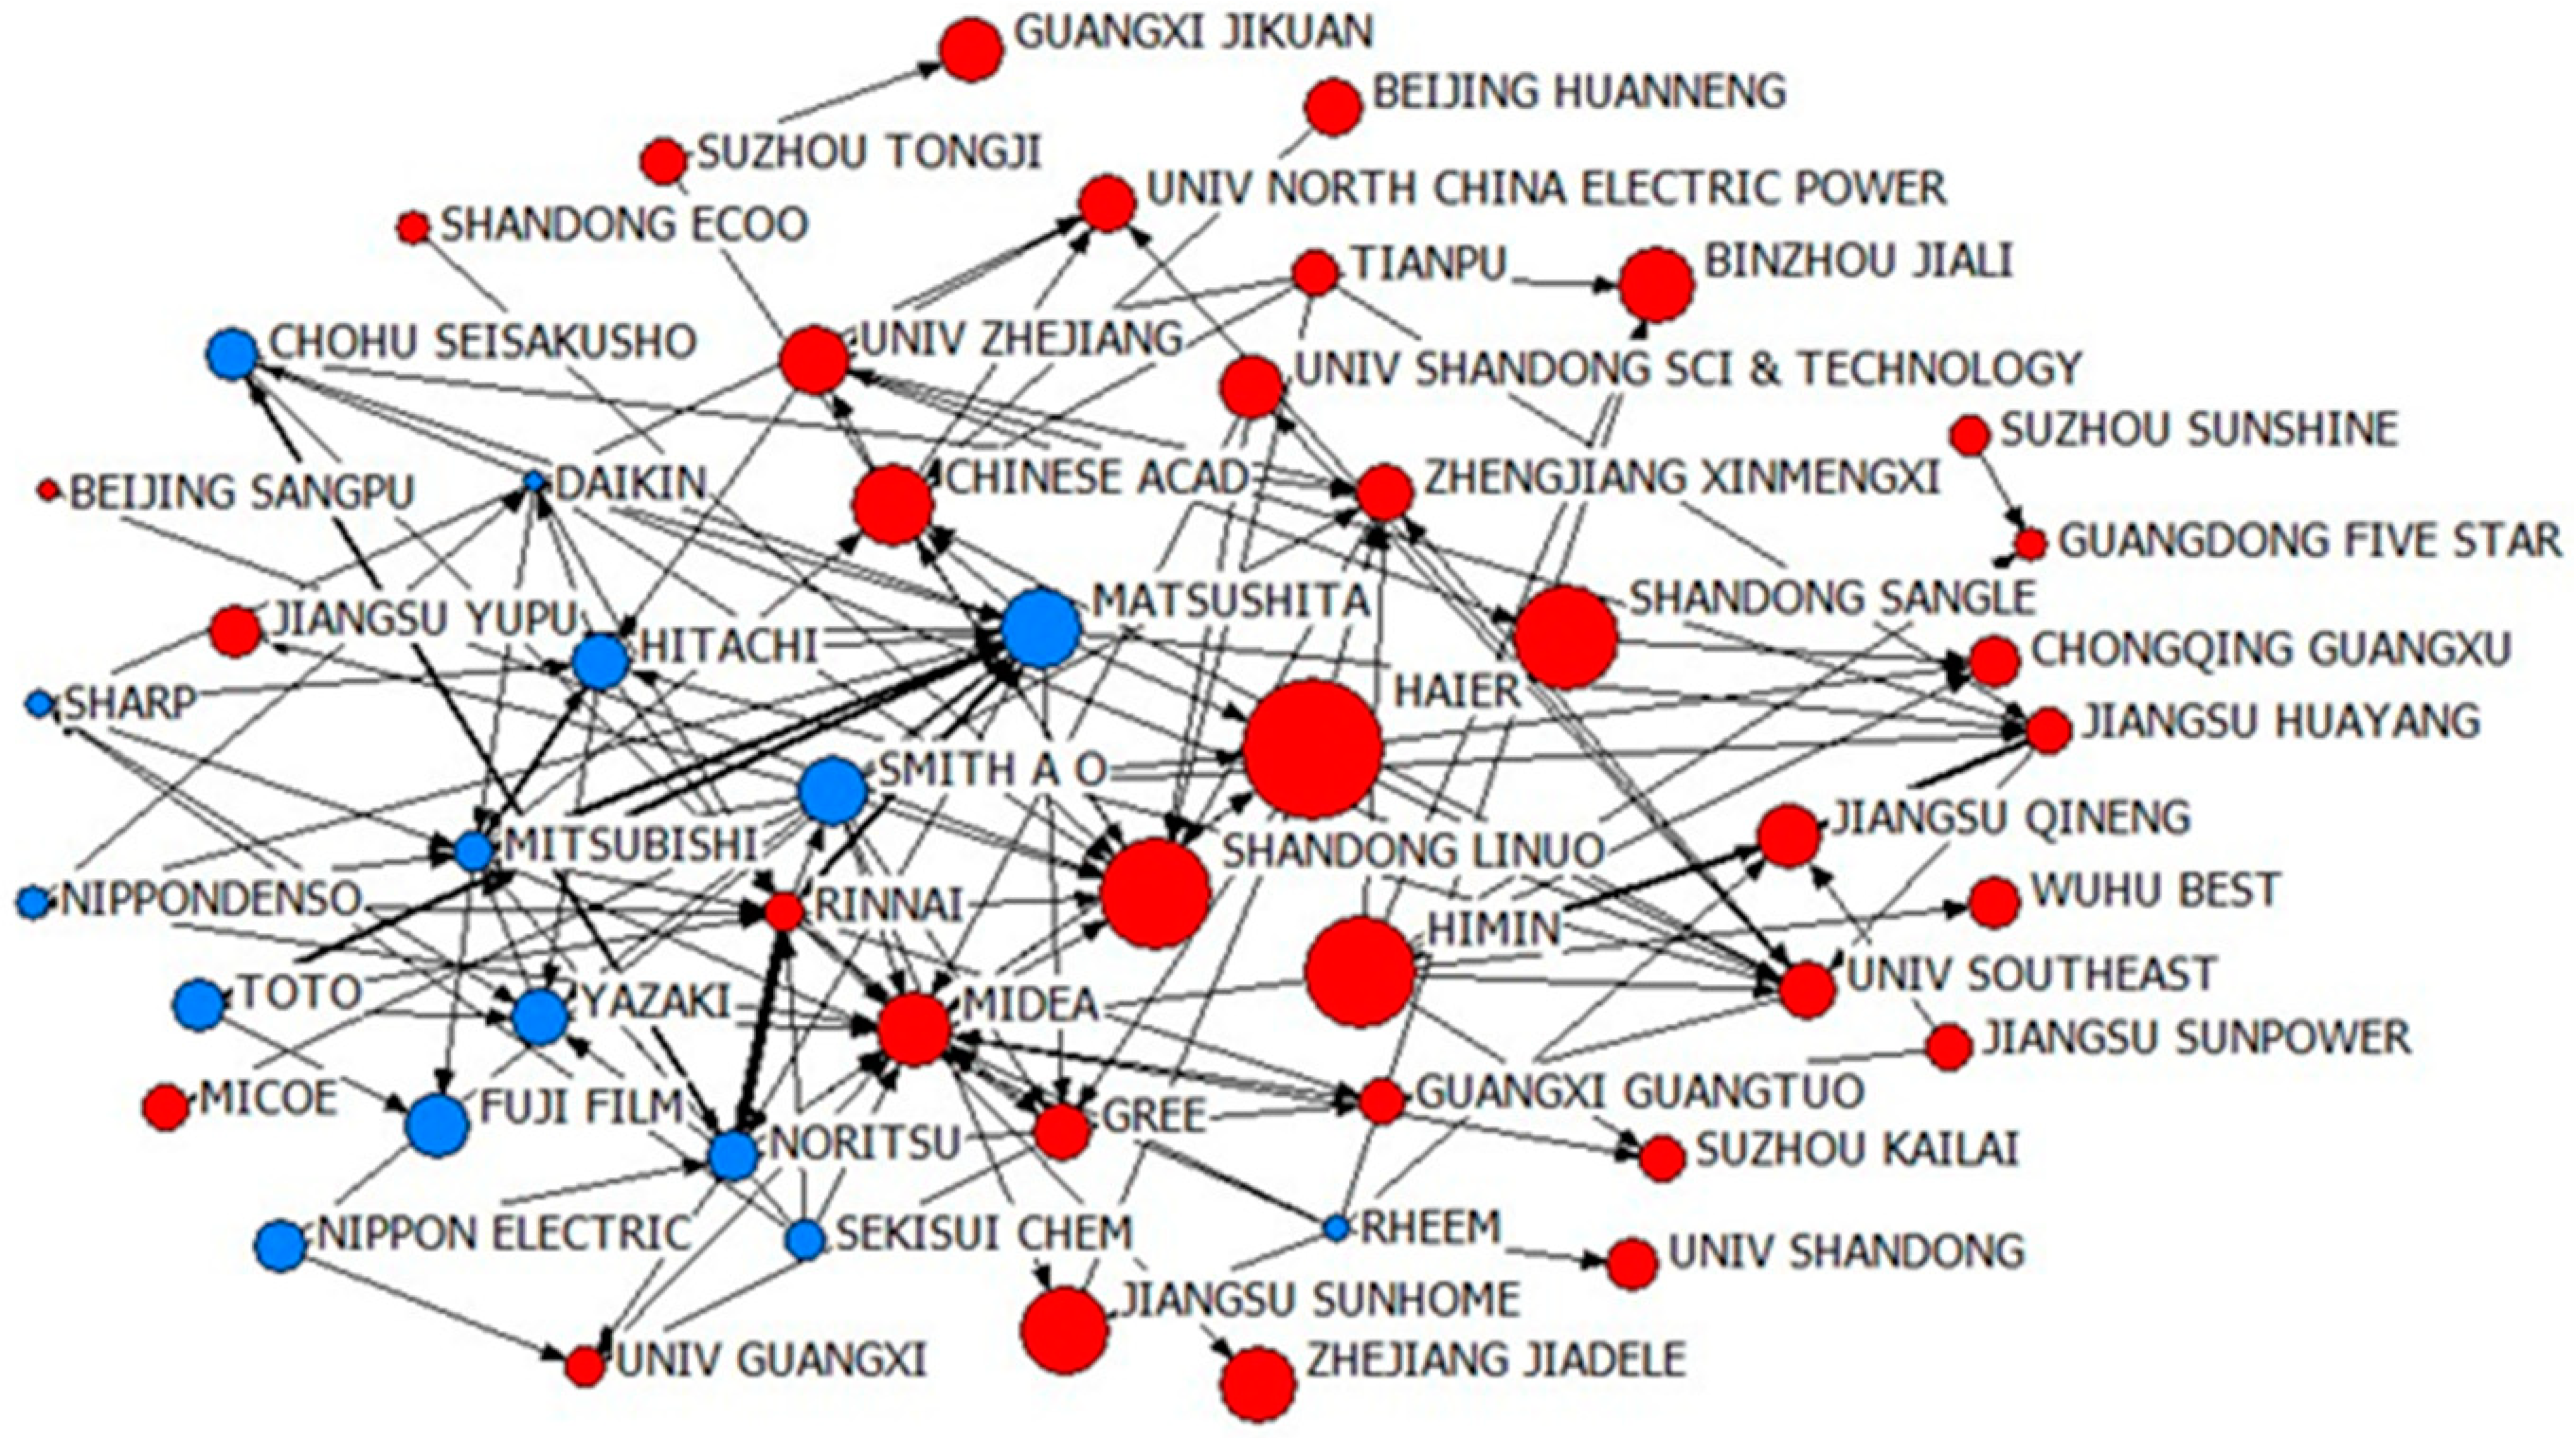
Figure 3,
Figure 4 and
Figure 5 illustrate the resulting network of SWH organizations. The lines represent the cumulative citations in both directions: the thicker the line, the more citations between two firms. The size of a node is determined by the patent count. The core/periphery structure of the three network diagrams represents each company’s position in the network. The red nodes represent Chinese firms or colleges, while the blue ones represent overseas entities.
First, we observed that the core companies (the larger circles) in all three networks included traditional Japanese leaders such as Panasonic, Mitsubishi, and American A. O. Smith. The Chinese Haier also appeared to be a core firm, which may be due to its diversified development mode and rich knowledge base. In the later network (2009–2016), some Chinese firms, such as Himin, Shandong Linuo, and Shandong Sangle, grew into technology leaders. The positions of them in the network were transferred from the periphery to the center area, suggesting that increasing numbers played significant roles in knowledge flows. Comparing networks (1995–2008 and 2009–2016), more Chinese firms appeared, indicating the quick development of the Chinese SWH market. The data reveal that Chinese SWH firms were already in a core position in the solar water heater international knowledge network after 2008.
Second, the circles representing the leading Chinese firms in the core positions were generally larger (more patents), indicating that they learned through knowledge flows. Conversely, the Japanese and American companies did not change much, indicating that they did not consider SWH business as a key development target. Meanwhile, Chinese research institutes, such as the Chinese Academy of Science, Southeastern University, and Shandong University, appeared in the later and full-time networks, which means they were attracted by the growing SWH industry in China, and focused on technology importation and innovation. The research found some other interesting features. For example, some Chinese leading firms that that opened up large market territories, such as Shangdong Ecoo, Micoe and Gree, are still positioned on the edge of the later network.
Third, the network figures reveal that although the circles representing Chinese firms became obviously larger in 2009–2016 and 1995–2016, the lines between them and the others were thicker in 2009–2016, showing that they were frequently cited. Thus, it is found that Chinese firms have developed into creators of solar water heater technologies and there was related knowledge spillover. In other words, Chinese firms are the foundation of the solar water heater industry, and the leading Chinese firms have grown into core companies through years of knowledge importation. This is consistent with our analysis in
Section 4.1.
Table 4 shows the key indicators for the SWH sample organizations in networks (
Table A1 shows the indicators for 50 SWH organizations). The net citation counts indicate the net knowledge producers (positive) and net knowledge consumers (negative) [
45]. Panasonic contributed significantly to the world, with by far the highest net citation count in 2009–2016, but with a large drop in in-degree value.
Table A1 indicated that the Chinese leading SWH firms, such as Himin, Sunpower and Tianpu, have grown from knowledge absorbers with negative net citations in 1995–2008 to knowledge creators with highly positive net counts in 2009–2016. Most Chinese SWH firms had a very limited presence in terms of both citing and being cited in 1995–2008. However, since 2008, many have become more active in both directions. Some, such as Jiangsu Qineng, Guangdong Fivestar, and Chongqing Guangxu, developed into knowledge absorbers in 2008–2016, although they never appeared in knowledge flows in 1995–2008.
Table 4 also shows that Chinese firms have fewer net citations than leading Japanese SWH firms. This may be partly because until recently Chinese research was mainly published only in the Chinese language. However, leading Japanese firms’ net citations decreased from 2009–2016 to 1995–2008, while Chinese firms’ citation counts increased. An interesting phenomenon can be observed: some Chinese leading firms, such as MICOE, Beijing Sangpu, and Shandong Ecoo, have a limited presence despite their large market share, and they are still on the periphery of the network (2009–2016) in
Figure 4. Some other core SWH firms, like Midea and Linuo, were net knowledge consumers with negative net citations, acting positively in knowledge flow with high indegree centrality, which meant they absorbed more knowledge than they produced. All this indicates that the rapid development of the Chinese SWH industry is driven by the market, mainly learning new knowledge from others to expand the market.
Table A1 also reveals that some Chinese research institutes, such as the Chinese Academy of Sciences, had a high betweenness centrality (after 2008), which indicated that they played an important intermediary role in the knowledge flow.
Based on the above analysis, the results can be summarized as follows: (a) The Chinese SWH industry has increased its competitive intensity since 2008, but has not yet reached the level of competition that can stimulate more breakthrough innovations; (b) Chinese SWH firms have developed from knowledge consumers into knowledge producers since 2008, and they are core to international knowledge networks; (c) the Chinese leading SWH firms are following a market-driven innovation mode based on knowledge that was previously acquired from others; (d) under the current situation of insufficient competition, Chinese SWH leading firms will still act as knowledge spillovers instead of knowledge creators.
4.2.2. PV Patent Citation Network Analysis
As
Table 5 shows, the increase in network density (total patents/total citations) means that patent citations between PV firms grew quickly during 1995–2016. Comparing networks (2009–2016 to 1995–2008), an obvious increase in average distance means the distances between organizations was gradually increasing after 2008, which indicates that there were more organizations emerging and a stronger knowledge flow in the network in 2009–2016. The increase in cohesion (compactness) and patents, plus the decrease in fragmentation (proportion of firms/nodes that cannot reach each other), represents the reduced number of isolated islands, hence a more frequent knowledge flow within the PV patent network. In addition, the reciprocity has remained stable, which may indicate that the producers and consumers of knowledge have not changed significantly over time in the PV industry, as the innovation leaders are still spilling over knowledge and latecomers are still learning and absorbing. Comparing 2009–2016 to 1995–2008, we can observe a small decrease in out-degree centrality and a small increase in in-degree centrality. There is no obvious change in 1995–2016 compared to 1995–2008, which means there are no new innovation technology leaders emerging, hence knowledge competition has not yet matured in the PV industry.
Figure 6,
Figure 7 and
Figure 8 illustrate the resulting network of PV organizations, with the red nodes representing the Chinese organizations and the blue ones representing ones from other countries. First, it can be observed that the core companies in all three networks included traditional Japanese leading companies like Matsushita and Mitsubishi, as well as American First Solar. This research also found that more Chinese firms appeared after 2008, which may be attributed to the energetic support from China’s central government. State Grid Corporation China grew into a much larger core leader in 2009–2016, occupying a dominating position in patent counts. State Grid Corporation of China is a state-owned company directly managed by the central government with branches all over the country; its rapid development confirms the positive role of government support in the development of the PV industry. In addition, the American IBM, General Electric, and DowDuPont grew quickly into leading firms after 2008, which meant the PV industry had developed into an important and rapidly developing industry all over the world, attracting more and more firms. Second, it can be found that despite some foreign firms still being innovation leaders in the solar PV industry, the leading Chinese PV companies, such as Yingli and Hanergy, have grown into important members near the center of the later network, partly due to Yingli’s strategic cooperation with North China Electric Power University and Hanergy’s acquisition strategy. Third, the network figures also revealed that those firms in core positions were closer to each other, and the ties between them were much stronger, especially in 1995–2016, indicating frequent knowledge flow and fierce competition in the PV industry.
Table 6 shows the key indicators for the PV samples in networks (
Table A2 shows the indicators for 50 PV organizations). It can be observed that the leading Japanese firms still acted as knowledge producers in the two networks. Some Japanese firms, such as Canon and Panasonic, contributed significantly to PV innovation. The American firm Applied Materials also acted as an important knowledge spiller in 2009–2016. First Solar was a net knowledge consumer but had high numbers of both backward out-degree and in-degree in the two networks, indicating active knowledge flows. All the above meant that the PV leading firms from abroad were carrying out technological innovations in these timeframes, and the PV industry was still a fiercely competitive field.
In addition, the leading Chinese firm, Hanergy, had grown into a knowledge spiller during 2009–2016, with highly positive net citations, while Yingli was still a knowledge absorber but very active in knowledge flow. Focusing on negative net citations, although many Chinese firms were still knowledge learners, many had more presence in terms of both citing and being cited since 2008, which meant they were creating more and more knowledge while absorbing. Observing only out-degree centrality, we found the values of some Chinese PV firms, such as GCL and Yingli, rising from 0 in 1995–2008 to 44 and 49, respectively, in 2009–2016, and they had more presence in in-degree centrality in the later network. At the same time, some, such as QC Suzhou, had grown into knowledge spillers in 2009–2016. Others, like Wuxi-based Suntech and Changzhou-based Trina, had a large decrease in in-degree centrality and a significant increase in out-degree centrality. All this meant that Chinese PV firms increased their presence and became much more active both in terms of citing and being cited since 2008.
Table 6 also reveals that some Chinese research institutes, such as the Chinese Academy of Sciences, had high betweenness centrality after 2008, indicating that they played an important intermediary role in knowledge flow. In addition,
Table A2 shows that almost all Chinese PV firms with large market shares play actively in international knowledge flow since 2008, which means Chinese PV firms developed in terms of technological innovation, rather than blindly pursuing market expansion.
Based on the above, the results can be summarized as follows: (a) competition in the Chinese PV industry has become more and more intense since 2008; (b) Chinese PV firms have grown from knowledge absorbers into knowledge spillers after 2008, bringing them close to the center of the international knowledge networks; (c) the leading Chinese PV firms are following an innovation-driven mode for long-term development; (d) the Chinese PV industry continues to be a thriving field with fierce global competition, and Chinese PV leading firms will develop into knowledge creators based on continuous innovations.


