An Integrated Environment–Cost–Time Optimisation Method for Construction Contractors Considering Global Warming


1
Department of Construction Management, Harbin Institute of Technology, Harbin 150001, China
2
Department of Civil, Environmental, and Natural Resources Engineering, Luleå University of Technology, 97187 Luleå, Sweden
3
Department of Construction Management, Key Lab of Structures Dynamic Behavior and Control of the Ministry of Education, Key Lab of Smart Prevention and Mitigation of Civil Engineering Disasters of the Ministry of Industry and Information Technology, Harbin Institute of Technology, Harbin 150090, China
*
Author to whom correspondence should be addressed.
Sustainability 2018, 10(11), 4207; https://0-doi-org.brum.beds.ac.uk/10.3390/su10114207
Submission received: 22 October 2018
/
Revised: 8 November 2018
/
Accepted: 10 November 2018
/
Published: 14 November 2018
(This article belongs to the Special Issue Sustainable Construction and Building Materials)
Abstract
:Construction contractors play a vital role in reducing the environmental impacts during the construction phase. To mitigate these impacts, contractors need to develop environmentally friendly plans that have optimal equipment, materials and labour configurations. However, construction plans with optimal environment may negatively affect the project cost and duration, resulting in dilemma for contractors on adopting low impacts plans. Moreover, the enumeration method that is usually used needs to assess and compare the performances of a great deal of scenarios, which seems to be time consuming for complicated projects with numerous scenarios. This study therefore developed an integrated method to efficiently provide contractors with plans having optimal environment–cost–time performances. Discrete-event simulation (DES) and particle swarm optimisation algorithms (PSO) are integrated through an iterative loop, which remarkably reduces the efforts on optimal scenarios searching. In the integrated method, the simulation module can model the construction equipment and materials consumption; the assessment module can evaluate multi-objective performances; and the optimisation module fast converges on optimal solutions. A prototype is developed and implemented in a hotel building construction. Results show that the proposed method greatly reduced the times of simulation compared with enumeration method. It provides the contractor with a trade-off solution that can average reduce 26.9% of environmental impact, 19.7% of construction cost, and 10.2% of project duration. The method provides contractors with an efficient and practical decision support tool for environmentally friendly planning.
1. Introduction
The mitigation of energy use and environmental impacts during the building operation has been the research focus in last few decades [1]. However, when the potential for curbing operational impacts has been greatly explored, the current emphasis has shifted to the construction phase, i.e., the transportation of building materials to construction site and on-site construction [2]. Li et al. [3] and Bilec et al. [4] proposed that the construction phase cause relatively intensive impacts in a short construction period and in a specific location. Considering the fast increased urbanisation in developing countries worldwide, the impacts from construction phase could be significant at the aggregate level [5]. Contractors, who are responsible for planning of the construction configurations, may mitigate the environmental impacts by developing an environmentally friendly plan [6].
The life cycle assessment (LCA) is the most widely used approach to assess environmental impacts from the construction phase [7]. Many constructive suggestions for environmentally friendly construction have been provided by previous studies. Li et al. [3] proposed a systematic construction impact assessment model with a LCA method, and applied it to an earthworks case. Results suggested that reducing the construction dust, reusing water, and concrete waste are the most effective way to alleviate construction impacts. Bilec et al. [4] holistically analysed the environmental impacts of the construction processes with a process-based hybrid LCA. They found the construction phase is as important as other life-cycle stages like materials production and demolition. In order to compare environmental performance of different construction activities, Sandanayake et al. [8] proposed an assessment method using LCA to characterise the impacts into different geographical perspectives. Results showed the activity with more GWP impacts, such as fuel intensive work have more influence at global perspective. And the activity with more POFP and HTP such as earthmoving work have more influence at regional and local perspectives. However, Davies et al. [9] still claimed that it lacks a practical tool that would allow the contractor to develop the environmentally friendly plans.
One reason for this may be due to the contractor normally assumed that the cost and duration performances certainly suffered from the environmentally friendly planning [10]. LCA-based approaches focusing on environmental metrics may provide the contractor with optimal plans that yield conflicting costs or duration performances. It could put contractors under a dilemma for adopting low-impact planning. The study of Shi et al. [10] found that this is one of the most significant factors, preventing contractors from environmentally friendly construction.
In order to overcome this limitation, Ozcan-Deniz et al. [11,12] introduced genetic algorithms into construction to take trade-off environmental performances with project time and cost. Cheng and Tran [13] proposed a novel method based on differential evolution to reach a construction environment–time–cost optimisation. Nevertheless, previous methods have simplified the construction process with a fix logic, and used static performance data that cannot address other potentials [11].
Another difficulty of environmentally friendly planning may derive from the characteristics of construction. The interactions in the construction processes cause the re-calculation of the performance for all scenarios, due to even one variable change potentially leading to effects in whole construction [14]. Discrete event simulation (DES) is adept at capturing complicated interactions in complex systems [15]. A widely applied method uses the DES technique to enumerate interested plans. This includes the research conducted by Krantz et al. [16], which applied DES-based simulation to analyse the CO2 and the cost of different earthmoving strategies. More references can be referred to [17,18,19]. This enumeration method is suitable for cases with limited construction scenarios. However, at the construction planning stage, many alternative plans could be available for construction activity [6]. It seems to be very inefficient for enumerating all scenarios, because there are a great deal of scenario combinations.
This study, therefore, developed an integrated method in order to provide contractors with an efficient multi-objective optimization approach, considering the environmental performance. DES, which has the ability to simulate alternative scenarios by capturing the interaction among construction processes [20], is used to simulate the duration and cost of each scenario. While environmental performances are assessed, based on data from DES and environmental database, which overcomes the limitation of previous studies that usually simplify the process interaction. Particle swarm optimisation (PSO), owing to their advantage on multi-objective optimisation, is used to search optimal environment–cost–time construction solutions. DES, performance assessment, and PSO are integrated working in an iterative loop, which avoids the enumeration of every single scenario. The integrated method is design to be a multi-objective decision-making tool for contractors to effectively and efficiently search a great deal of scenarios and to develop environment–cost–time optimal plans.
2. Literature Review
2.1. Construction Multi-Objective Performances and Optimisation
The construction projects usually have multiple dimensional objectives that need to be pursued. Among others, project cost and duration are normally two of the objectives of most concern when contractors develop construction plans. Eshtehardian et al. [21] proposed a method that combines fuzzy set theory and genetic algorithm to solve time–cost trade-off problems in construction schedule planning, and the results show that the proposed method can provide the contractor with Pareto solutions, considering the different risk acceptance level. Zhang and Ng [22] applied the ant colony optimisation to solve construction time–cost multi-objective problems. A case study shows the present method used less computing loads, compared with the genetic algorithm. The construction quality could be another interested target that is usually studied by previous multi-objective research. El-Rayes and Kandil [23], and Cristóbal and Ramón [24] integrated quality performance into traditional time–cost problems. Optimisation methods such as genetic algorithms and integer programming were proposed and applied into cases, and the results show the Pareto solutions that simultaneously made a trade-off among time, cost, and quality could be achieved.
With the increase of environmental consciousness in Architecture, Engineering and Construction (AEC) field, several pilot studies have analysed the relationship between the environment and other traditional objectives. However, there are still some contradictory conclusions among previous studies. Ozcan-Deniz et al. [11] found that the global warming potential (GWP) performance has a negative correlation with the duration of residential house construction, and it has positive relations with the cost performance. On the contrary, in another research project for highway construction projects [12], the project duration, cost, and greenhouse gas emissions presented positive correlations. In a tunnel construction case, Cheng and Tran [13] found that the environmental impacts have a negative relation with duration, but it is positive with the project cost. In light of no confirmed correlation among the environment, cost, and time, it is necessary to develop a proper method for contractors to take the environmental performance trade-off with other traditional objectives. The intelligent optimisation algorithms with efficient multi-objective optimisation, such as PSO [25], may address the issue by providing Pareto-optimal solutions.
The algorithm of PSO is an efficient searching method that is inspired by the movement of a bird flock or fish school to a desired destination [25,26]. Elbeltagi et al. [27] and Barraza et al. [28] demonstrated that when solving a construction trade-off problem, PSO generally performs better than genetic algorithms, memetic algorithms, ant colony optimisation and shuffled frog leaping in terms of success rate, optimum quality, and convergence speed. PSO may be especially suitable for multi-dimensional optimisation, mainly due to its high speed of convergence [29]. Therefore, this technique has been used to solve multi-objective problems, some of which can be found at Pulido and Coello [30], Zhang [31], and Xue et al. [32]. In addition to continuous problems [33], PSO is also suitable for discrete optimisation problems [27], which could represent most of the construction-related decisions.
Many previous studies have demonstrated the efficiency of PSO in AEC application. Xu and Feng [34] developed a PSO-based method to optimise the earth–rock transportation task during dam construction. Results show that 2.06% of the operational cost, 6.82% of the transport duration, and 9.35% of the total waste can be simultaneously reduced using optimised transport planning. Barraza et al. [28] compared the PSO-based optimisation with genetic algorithms to simultaneously minimise the structural weight, control the maximum inter-story drift, and satisfy strength requirements. The application of a three-story steel frame building shows that both PSO and genetic algorithms can achieve the research target, but that PSO obtained better solutions than the genetic algorithms. Li et al. [35] proposed an efficient optimisation method by combining PSO and the Kriging method. It was tested by optimising the HVAC (Heating, Ventilation and Air Conditioning) design of a typical office building in terms of thermal comfort, air quality, and energy consumption. Results show the proposed method can reduce 46.6% of computing time without sacrificing the optimization quality. More references can be referred at [36,37,38,39]. However, previous studies usually focus on time and cost objectives, rather than multi-objective optimisation, considering the environmental impact [21,22]. The way of a practical environment–time–cost optimisation tool for contractors have not been fully explored.
2.2. Discrete Event Simulation for the Construction Phase
Alternative scenarios, such as the re-configuration of equipment, labour resources, new construction technique etc., may propagate to others because of interaction and interdependence among construction processes [14]. DES thus has been applied to modelling the complex interaction among construction processes. In study of Lee et al. [17], a simulation method combining DES and system dynamics was established. The interactions between construction operation and context, such as the relation between total project duration with work errors and changes were revealed by proposed method. With a similar DES and system dynamics hybrid method, Li et al. [18] analysed the schedule risks of a six-day cycle prefabrication housing production. The results indicated that the most significant schedule risks included ambiguous labels on components, misplacement storage, crane breakdown or maintenance, slow quality inspection, and inefficient design data transition. Alvanchi et al. [19] proposed a simulation-based method for adjusting labour resources along with the construction progress. A case study of steel fabrication building demonstrated the project cost could be reduced by better labour management.
However, the DES method has not been widely applied in real construction practices [14]. At the construction planning stage, many alternative plans, such as the selection of construction techniques, equipment, schedule, and labour, are available for construction activity [6]. A widely-used approach to obtain optimal scenarios is to simulate the performance for every scenario, then to compare these alternatives in order to find out the optimal solution, which can be found at many previous study [14,16,40]. However, a high computing load is required for a complex simulation [41]. Therefore, the enumeration method can be only suitable for projects with several scenarios. This is time consuming for complex projects with numerous alternatives.
In construction field, the study of Cheng and Yan [42] and Zhang and Li [43] is the pilot study that proposed the integrated DES and optimisation algorithms to avoid enumerated comparison. However, the focused objectives are time and cost, without environment consideration. Therefore, it is interesting to explore the potentials of simulation–optimisation integrated method for an efficient environment–cost–time construction planning optimisation. In the study, DES is integrated with PSO through the iterative loop, in order to avoid time-consuming assessment for all of possible construction scenarios. The integrated method could remarkably reduce the efforts on optimal scenario searching, which seems to be extremely appealing when many scenarios are available.
3. Integrated Optimisation Method
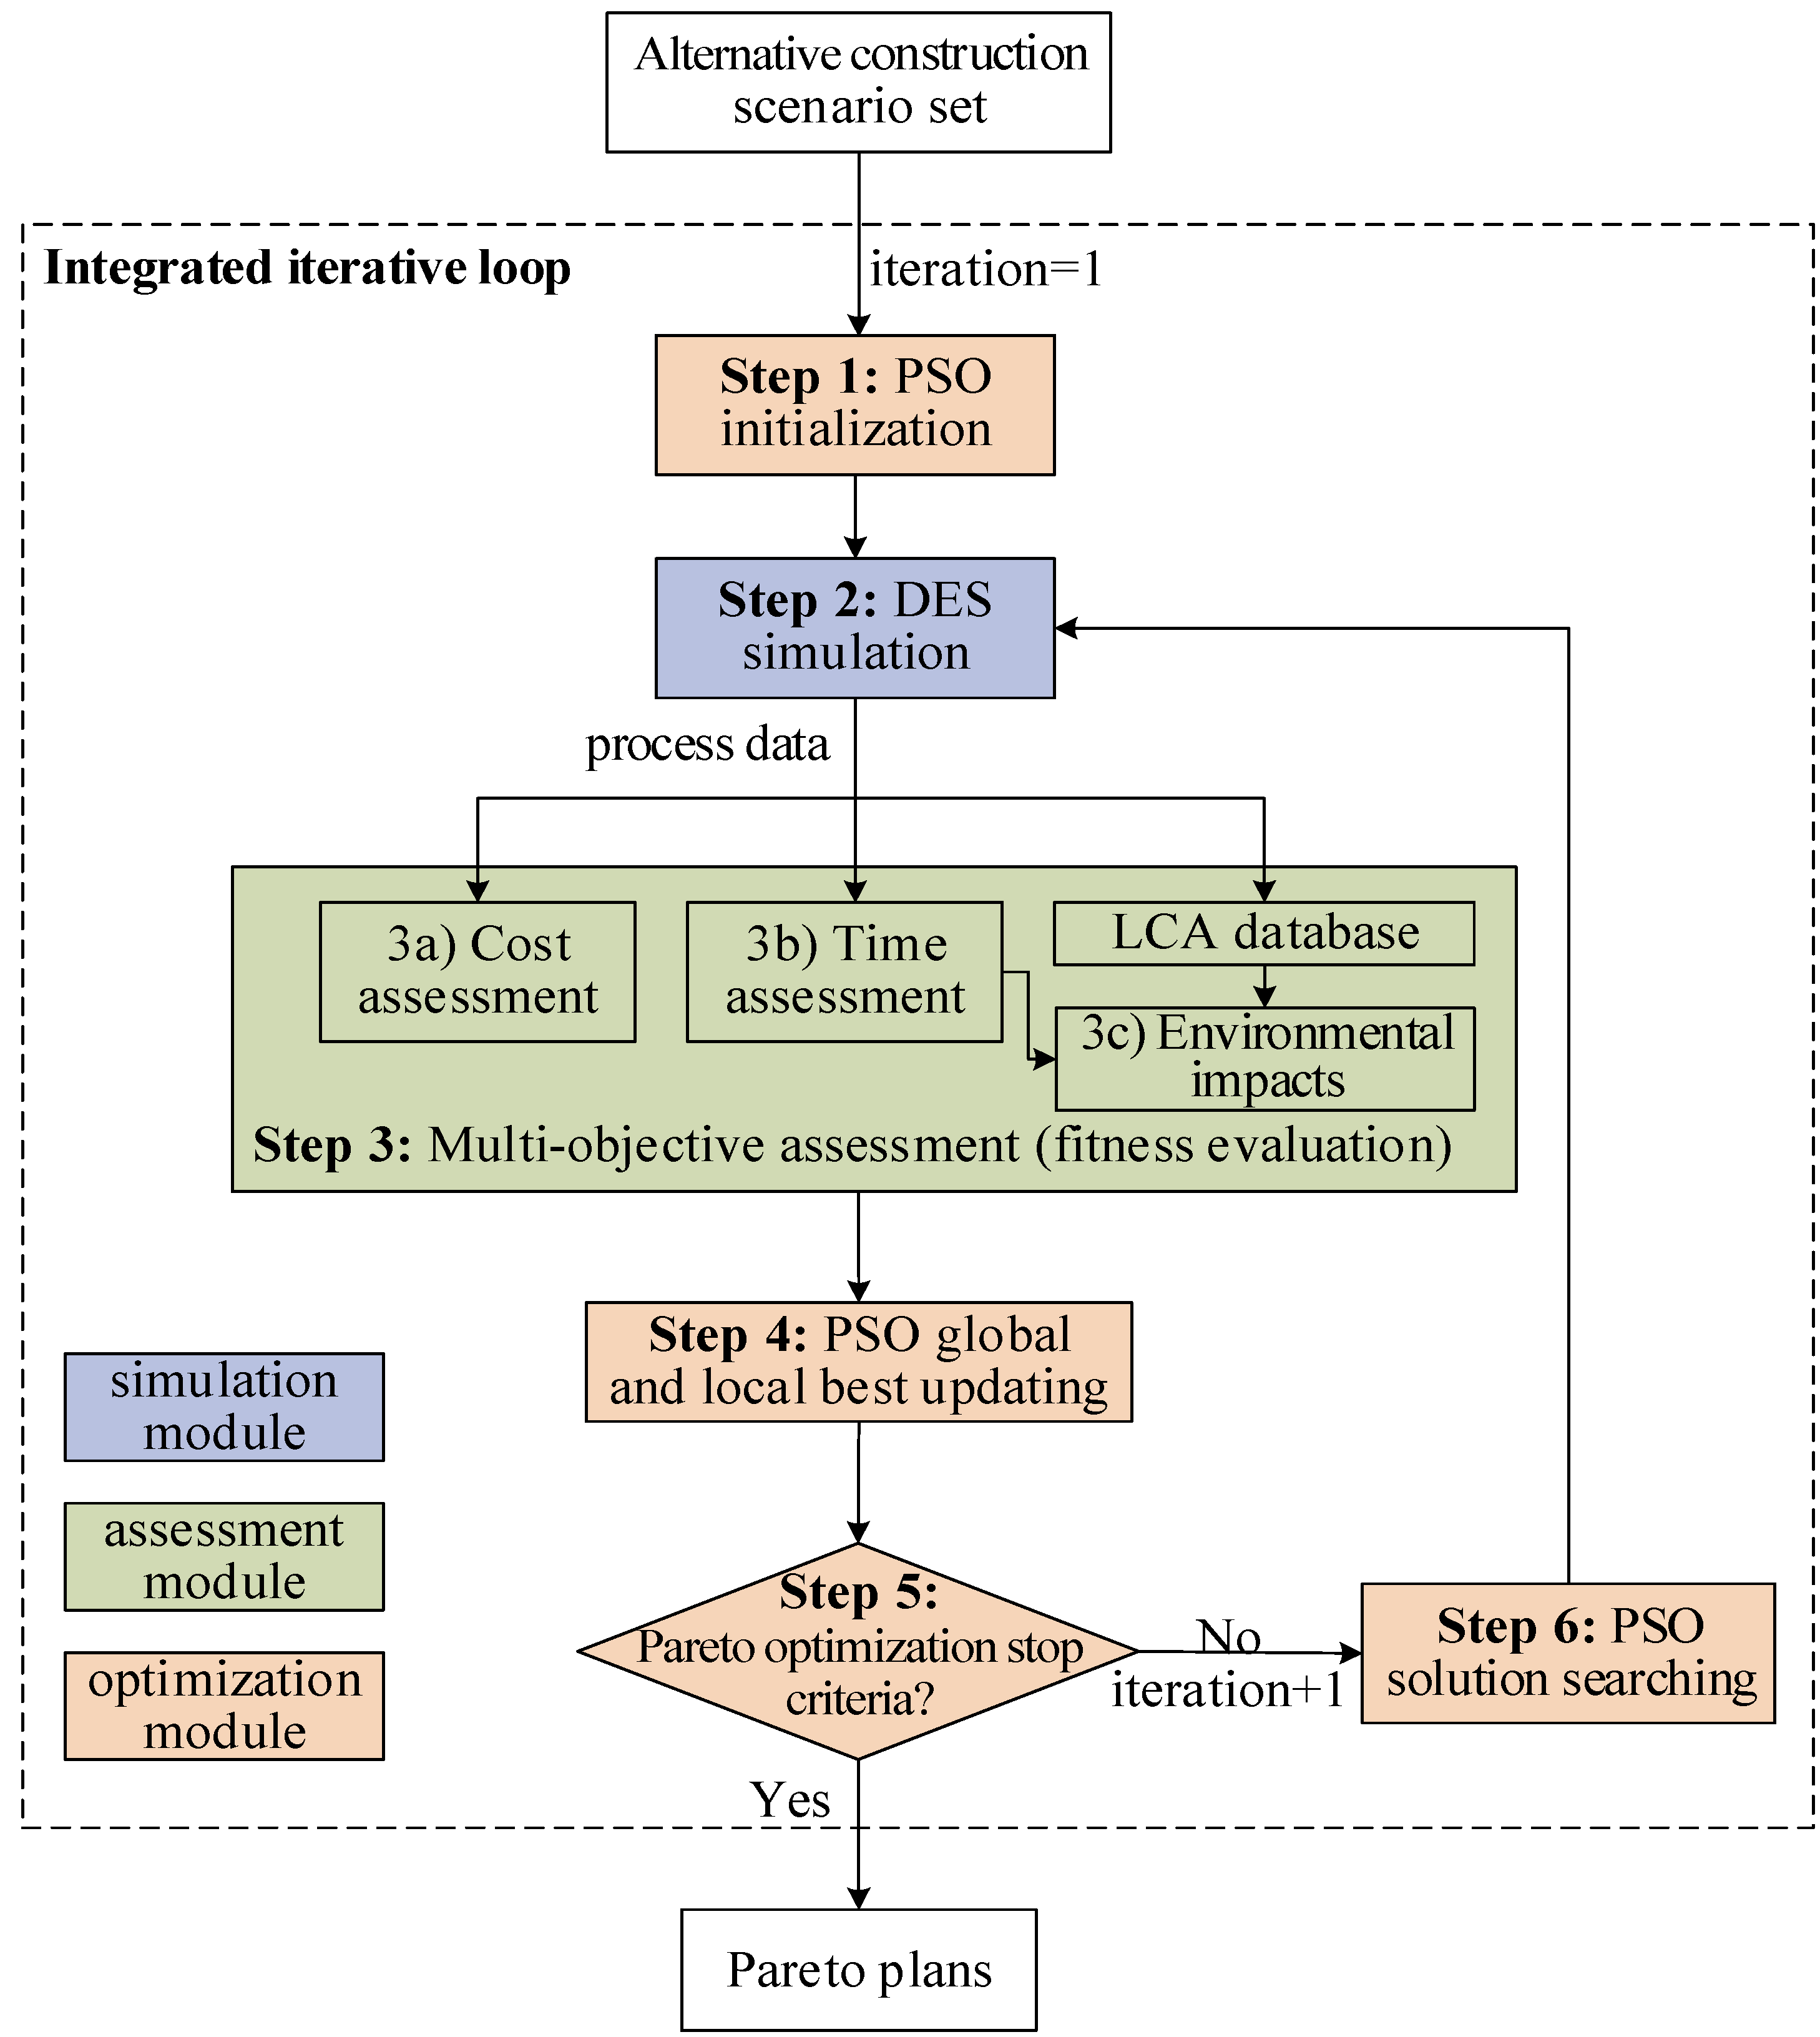
The overall integrated method follows six automatic interactive steps, as shown in Figure 1. Alternative scenarios could be extracted from an enterprise knowledge database and contractors’ interviews. The particles of PSO are initiated using a uniform randomly selection from possible construction scenarios, which are modelled and simulated by DES for each construction scenario. Then, the data from DES and the environmental database are automatically extracted to support multi-objective performance assessment, i.e., fitness evaluation at each optimisation iteration. The results of fitness evaluation will update the swarm’s global and local best information that are the basis of further solution searching. New solutions will be searched by PSO particles and the corresponding construction scenarios are simulated by DES, if the optimisation threshold or maximum iterations are not reached.
This integrated procedure will be executed in loop, and Pareto-optimal construction plans are obtained at the end of loop procedure. By this integration, the performance of construction scenarios alongside the optimisation pathway can be properly assessed, and multi-objective optimal plans can be quickly converged.
3.1. PSO Initialisation
In this study, the optimisation mechanism of PSO, originally formulated by Kennedy and Eberhart [25], is integrated with DES and the performance assessment to efficiently search multi-objective optimal plans in terms of environment, construction cost and duration. Each particle of PSO represents one possible construction scenario (X). The objective function of PSO is set as Equation (1), where X = {(1, x1) (2, x2) (3, x3) … (N, xN)} indicates that a series of construction tasks (from 1 to N) is constructed by related x alternative plan. The first iteration of the particle swarm is uniformly and randomly assigned from a defined possible construction scenario set, in order to ensure globally optimisation.
f(X) = min(Environment, Cost, Time)
3.2. DES Simulation
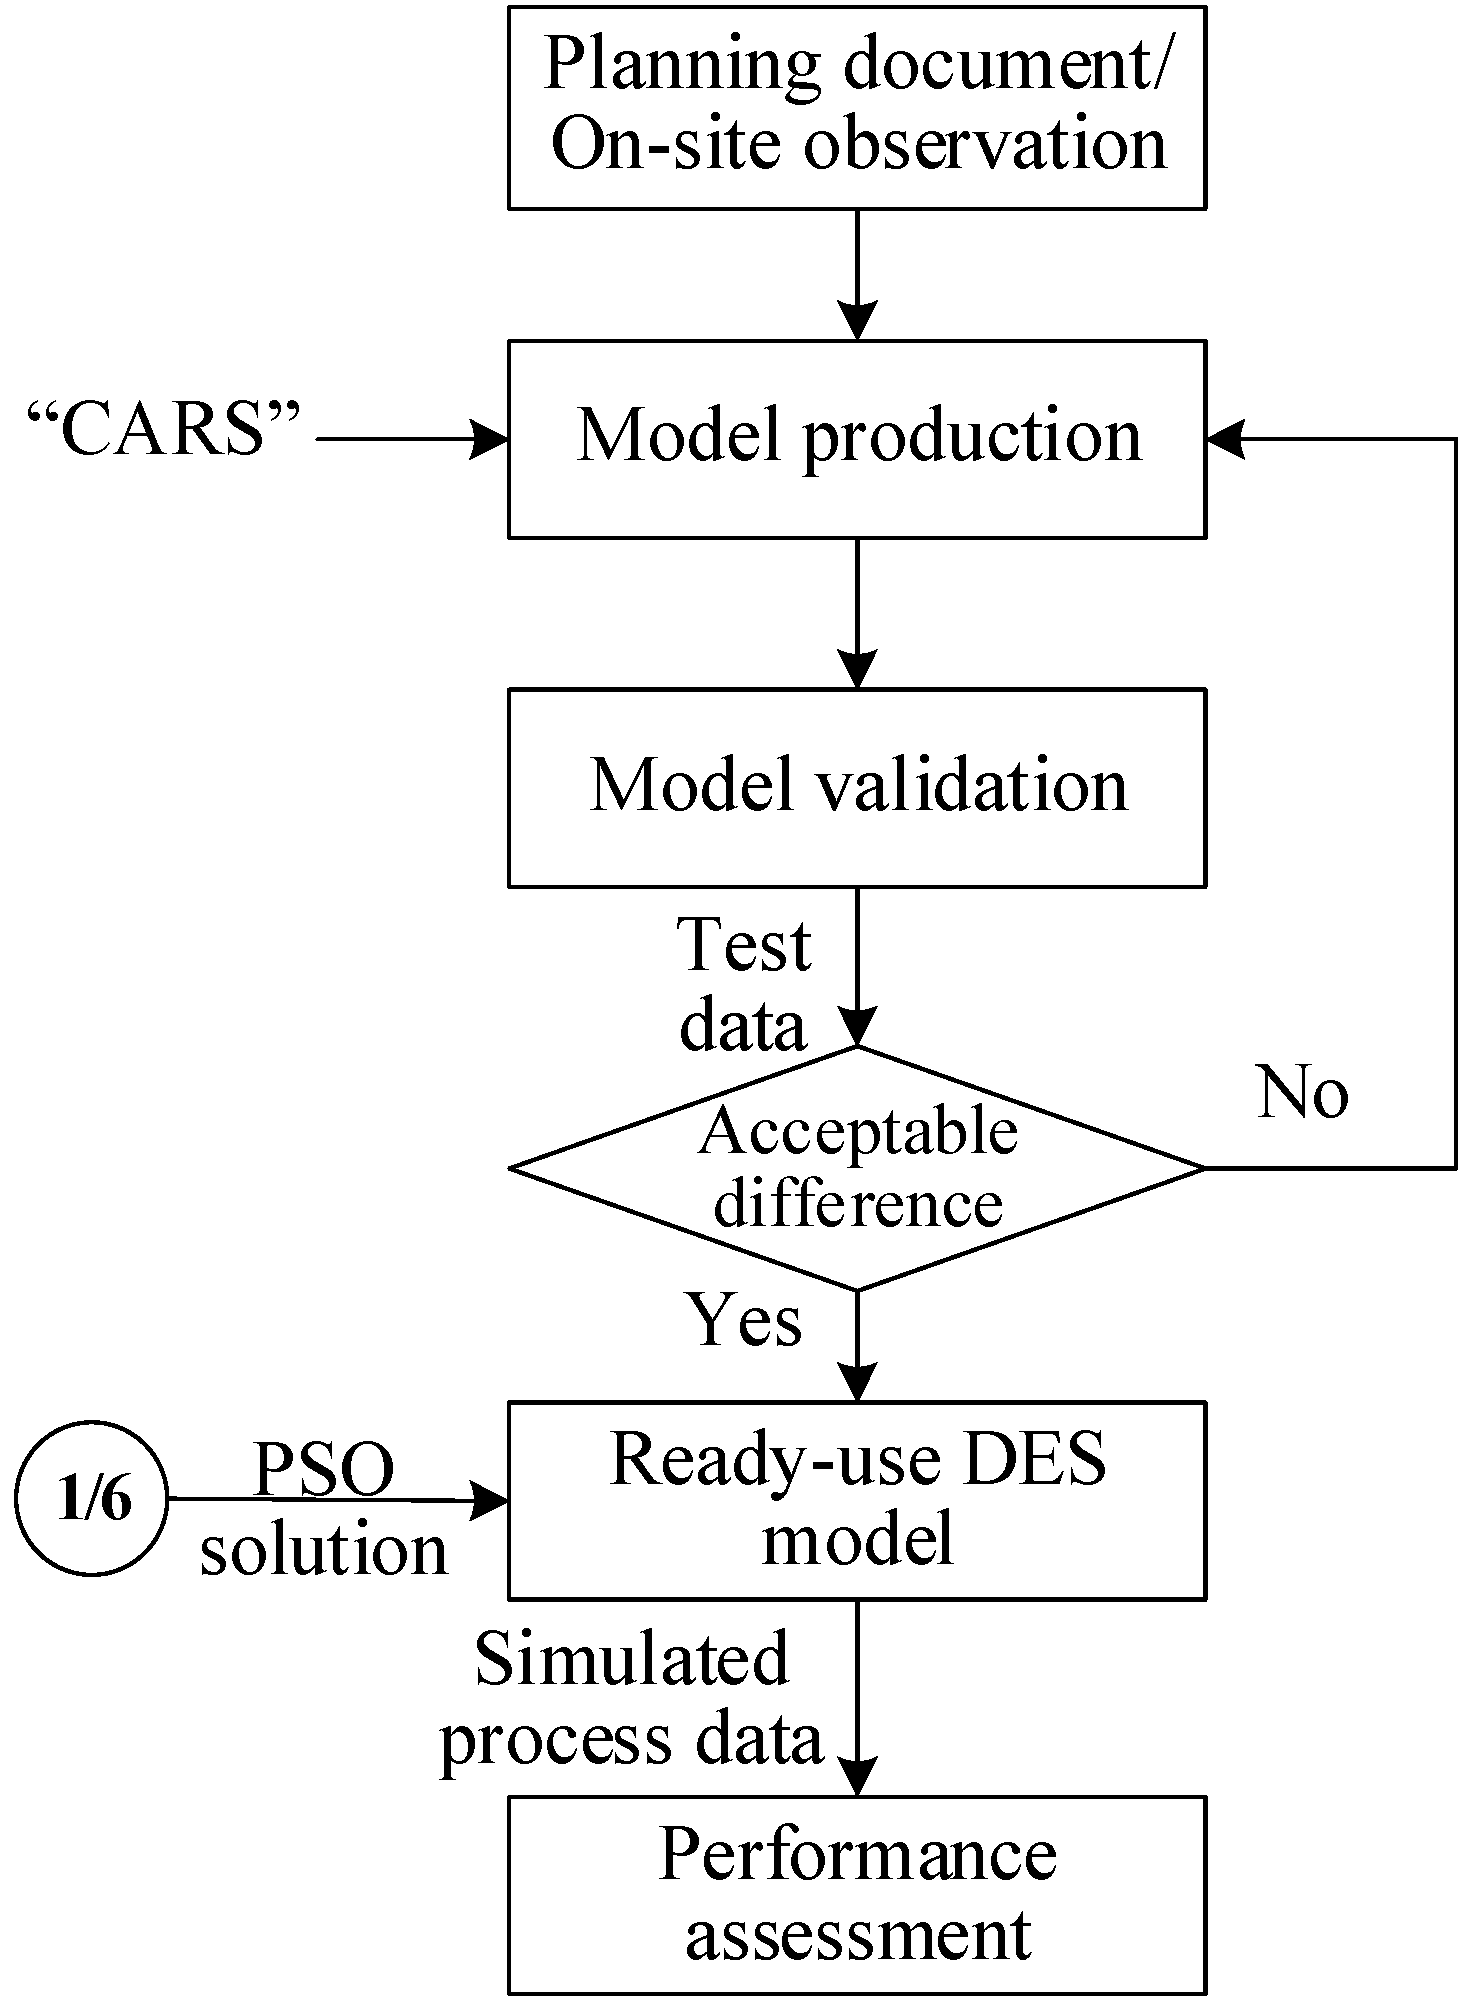
In the integrated framework, the DES is designed for a construction scenario simulation. The solutions that are represented by PSO particles are automatically input in the simulation model as parameters. After the simulation, it provides construction-process data for impacts assessment, cost estimation and directly duration simulation. The steps involved in the DES construction simulation are shown in Figure 2. Firstly, the construction DES model need to be developed. The construction planning documents and on-site observation are valuable information for model production. A construction conceptual model referred to as the Activity-Component-Resource-Action-Sequence (CARS), originally proposed by Fischer et al. [44], is used to collects the decentralised construction-related information into a unity model. It concepts the construction operation as four aspects, which are the constructed component, the required resource (materials, labour, and equipment), and series of required actions to construct the component, and the inherent work sequence, such as work predecessor and successor. Thus, the DES-based construction model can be developed with systematic information.
The established model should be validated before the scenario simulation performed [45]. In the planning stage of a construction project, the construction plan documents, such as a construction Gantt chart/network diagram and the cost document are valuable for validating the simulated process logic, entire duration and cost. If construction has already started, useful information for validation can be obtained from on-site observations and survey. After the information collection, the construction planning/observation can be compared with the output of the simulation. No or an acceptable difference validates the established simulation model; otherwise, the DES model must be further modified.
3.3. Performance Assessment
The simulated process data from DES, including the simulated working productivity, working time and idle time of each equipment and crew, and materials consumption provides detailed data for environment–cost–time performance assessment (see Figure 3). Firstly, the construction processes are simulated by the DES model. The impact sources, such as the materials used, equipment, and labour are obtained. The time performance is directly simulated, and the impacts and cost are assessed with impact sources. The results work as fitness for multi-objective optimisation, by which the PSO can perform information updating (step 4), and further Pareto solution searching.
This study attempts to search the environmentally friendly plan trade-off with project time and cost. The environmental assessment boundary follows the standard rules EN 15804:2012 + A1:2013 [46] and from a previous study [47]. It includes construction auxiliary materials from upstream extraction, processing, and production (A1–A3); major and auxiliary material off-site transportation (A4); and on-site equipment construction (A5). On the other hand, human labour will cause indirect environmental impact alongside a product [48]. Some construction tasks are naturally labour-intensive practices, and hence, the impacts caused by labour may influence assessment completeness and eventually bias the optimal decisions [48]. According to Cole [49], the transportation of different construction crews to task sites is a significant impact source. This study thus considers on-site everyday crew transportation. Thus, environmental improvement can be achieved by construction plans such as the selection of optimal materials, equipment type, and number, as well as crew sizes for each construction task.
Using simulation data, the impact assessment is then performed based on Equations (2)–(5), where Em, Ee1, Ee2 and Ew are the direct and indirect impacts from auxiliary materials, fossil fuel, electricity equipment, and crew transportation, respectively. According to research by Pechan [50], the actual energy consumption using fossil fuels can be calculated by Equation (3). For electrically-driven equipment on a construction site, the electricity consumption can be calculated using Equation (4); impact by crews is determined from Equation (5):
where Q is the quantity of consumed auxiliary materials, BSFC (lb·hp−1·h−1) is the brake-specific fuel consumption giving a measure of engine efficiency that can be referred to at the EPA database [50], EP is the engine power (hp), PD is the process duration of the task that is simulated by simulation that is determined by workload (Q) and work productivity (WP) of each task, LF is the load factor that reflects the level of equipment use for a specific operational scenario from [51]. P is the power rating of electrical equipment. em, ef, and ee are impact equivalents per unit of sources, which are equal to the emission factors of materials, fossils, and electricity energy multiply characterisation factors of different environmental impacts. N is the crew size for construction tasks, and TE is the transportation energy per person from the simulation.
Em = Q × em
Ee1 = BSFC × EP × PD × LF × ef
Ee2 = P × PD × ee
Ew = N × TE × ee
According to the China Construction Engineering Quota (CEQ) [52], the cost of auxiliary materials (Cm), construction equipment (Ce) and the salary for the crews (Cw) can be estimated as Equations (6) and (8). In Equations (6)–(8), cm, ce, and cw is the unit cost of material consumption, rented equipment, and employed crews, respectively. PD and ID are the equipment operational time and idle time by the DES model. The duration of construction is influenced by both the process interactions, logic, and the duration of each construction task. The DES model, which already includes the process logic and WP to describe these, is designed to directly estimate the construction duration.
Cm = cm × Q
Ce = ce × (PD + ID)
Cw = cw × PD
3.4. PSO Local and Global Best Updating
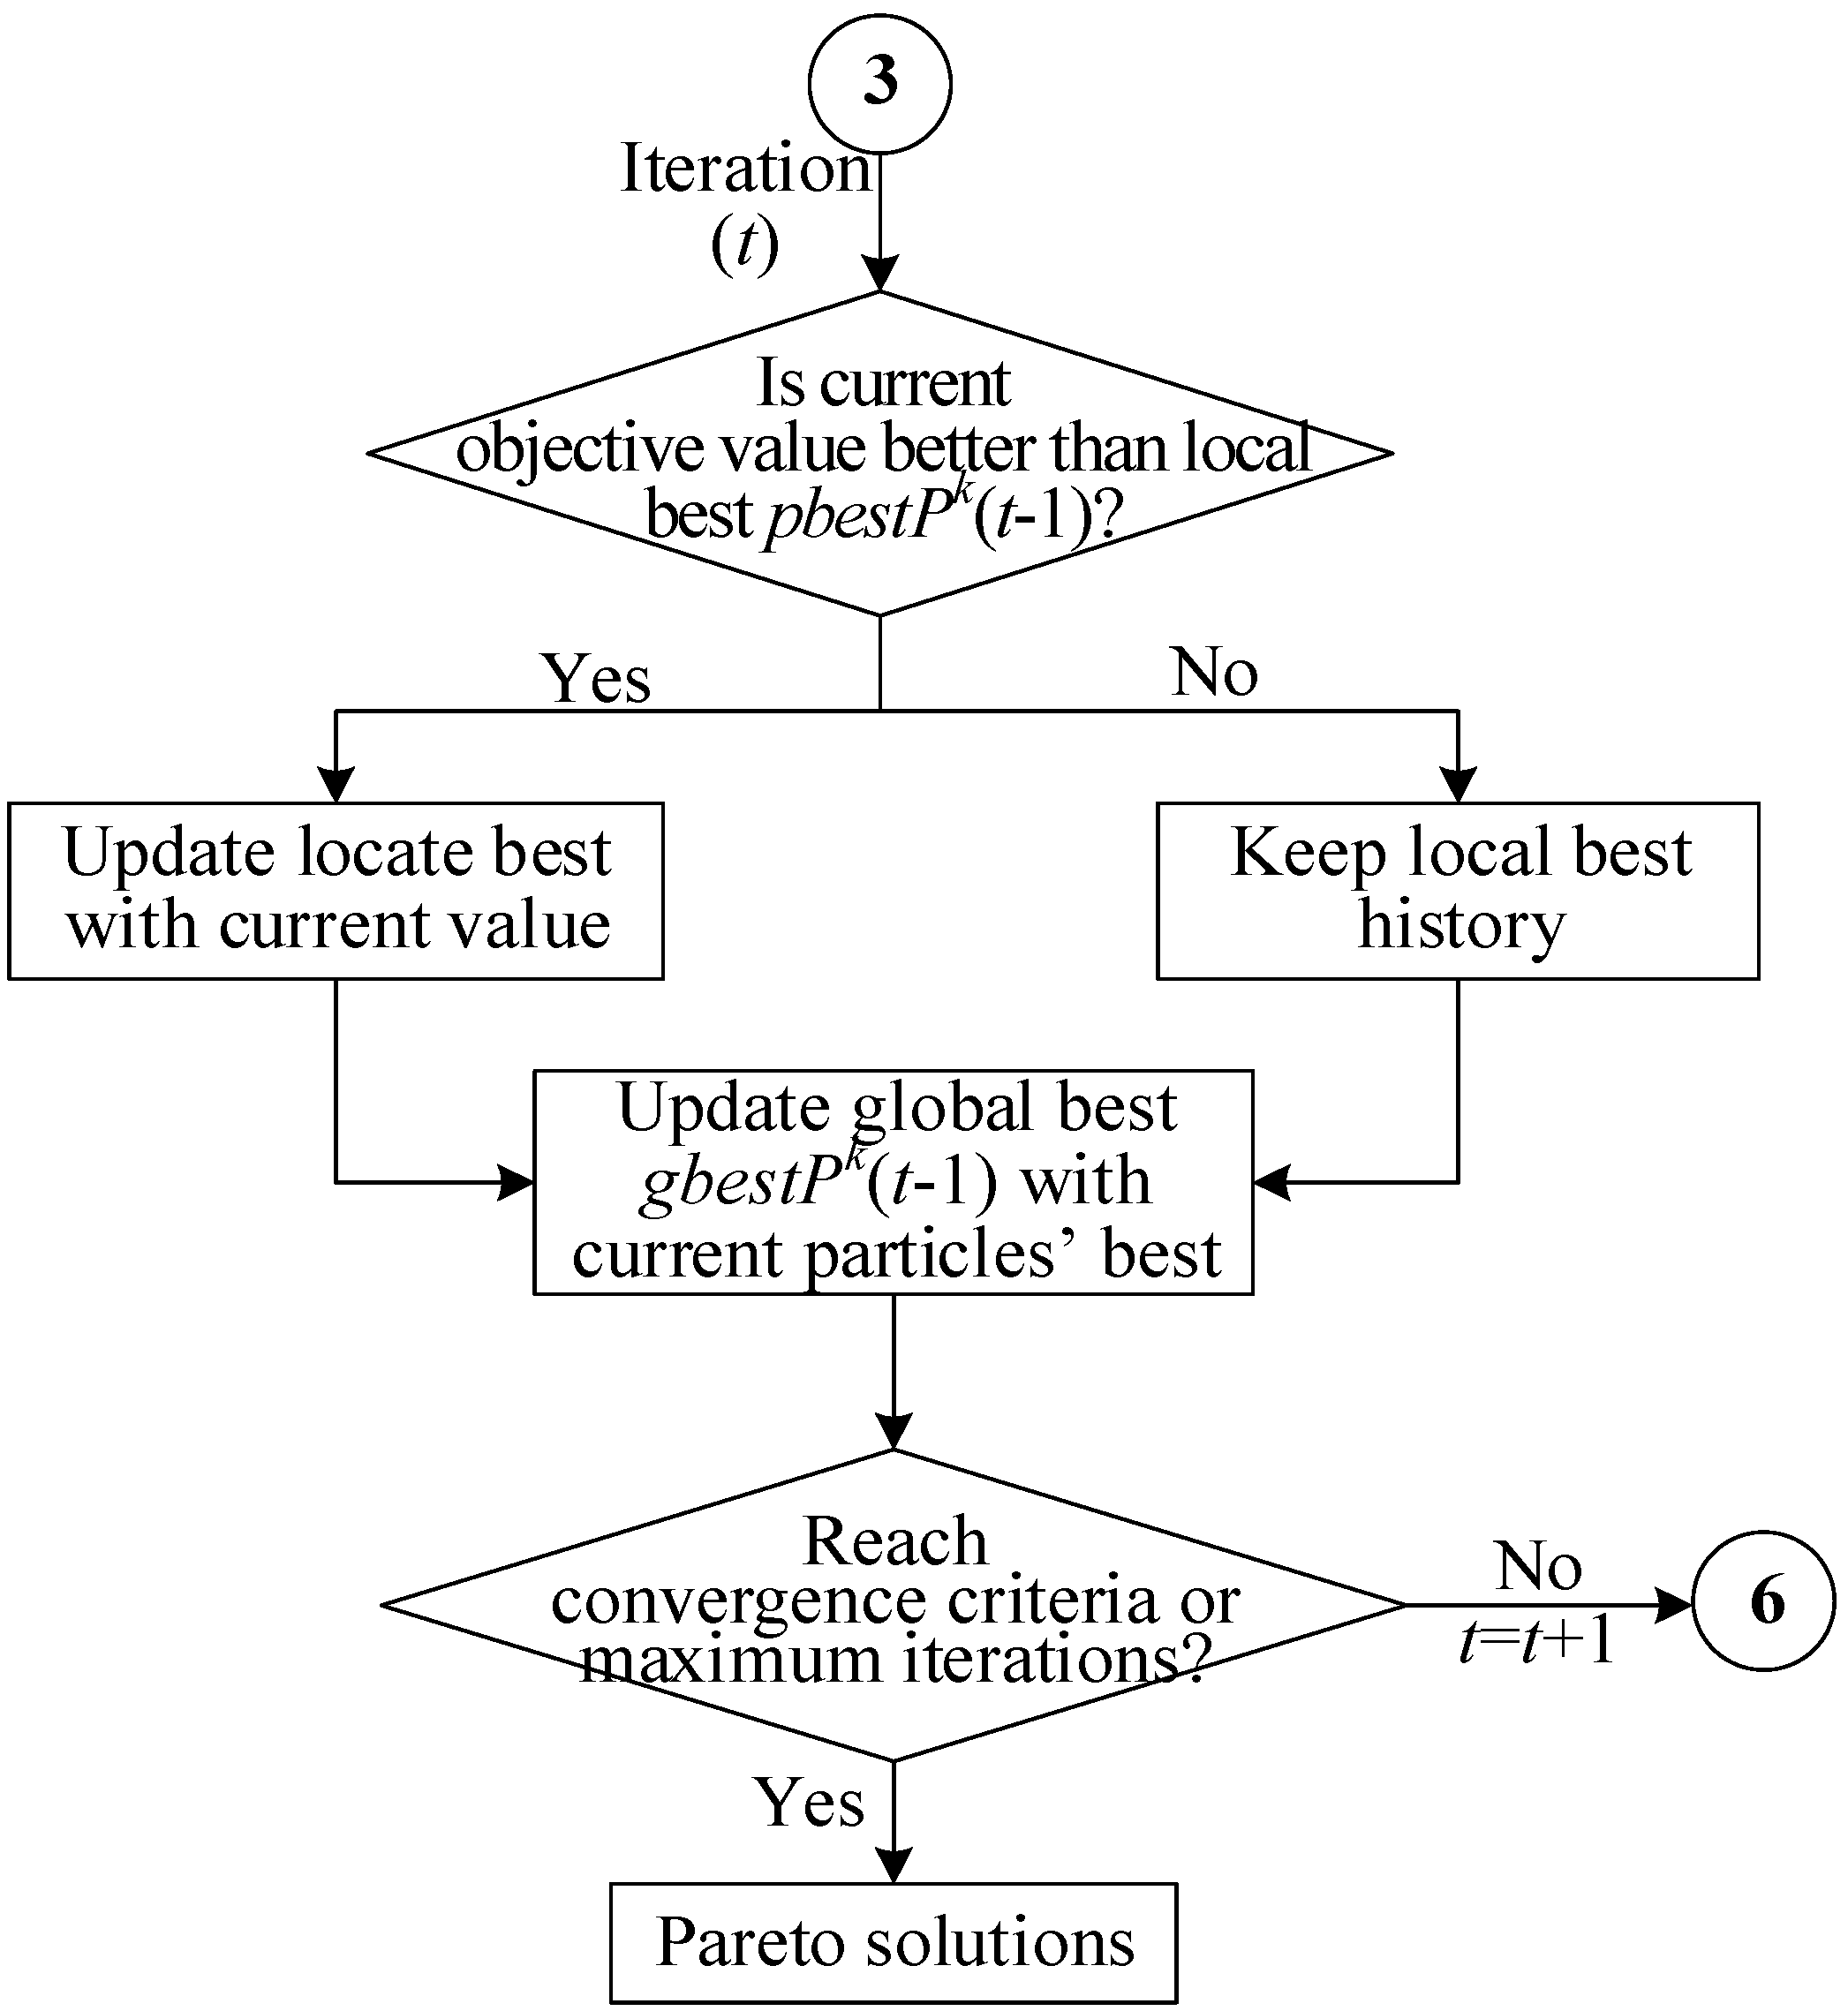
The particle of PSO moves to the optimal position alongside a trajectory that calculates the relation between the present position and their own previous best position (local best), as well as the best position of the swarm (global best) [33]. Therefore, it achieves a balance of exploration and exploitation by combining local and global searching [53]. Using the results of fitness evaluation (step 3), the local and global best positions are updated as Figure 4. Each particle has a list of its best position history, which is updated if the present position is better than previous best history; otherwise, it will be kept. In the same way, the global best position will be updated by present particle swarm. These global/local best information updates are the basis of further solution searching.
3.5. Pareto Optimisation Stop Criteria
The optimisation stop criteria are checked after PSO global/local best updating, as in Figure 4. In this study, the stop criteria are set as (1) the maximum number of iteration T, and; (2) the optimisation threshold for each objective. According to the previous study in construction [6], 200 iterations are acceptable for construction engineering. To ensure a robust result, the initial number of iterations (T) is set to 500 in this study. The threshold for the environment, cost, and duration is defined as one unit of environmental impact, 10 units of local currency, and one hour, respectively. The optimisation threshold is set to stop after certain periods (M) of iteration that continuously stay below threshold improvement or no change on Pareto solutions. To set a proper M for a specific case, a sensitivity analysis is required. The solution searching will continue to be performed (step 6), until the stop criteria are reached and the results are returned, i.e., of the Pareto plan combinations X = {(1, x1) (2, x2) (3, x3) … (N, xN)} for construction.
3.6. PSO Solution Searching
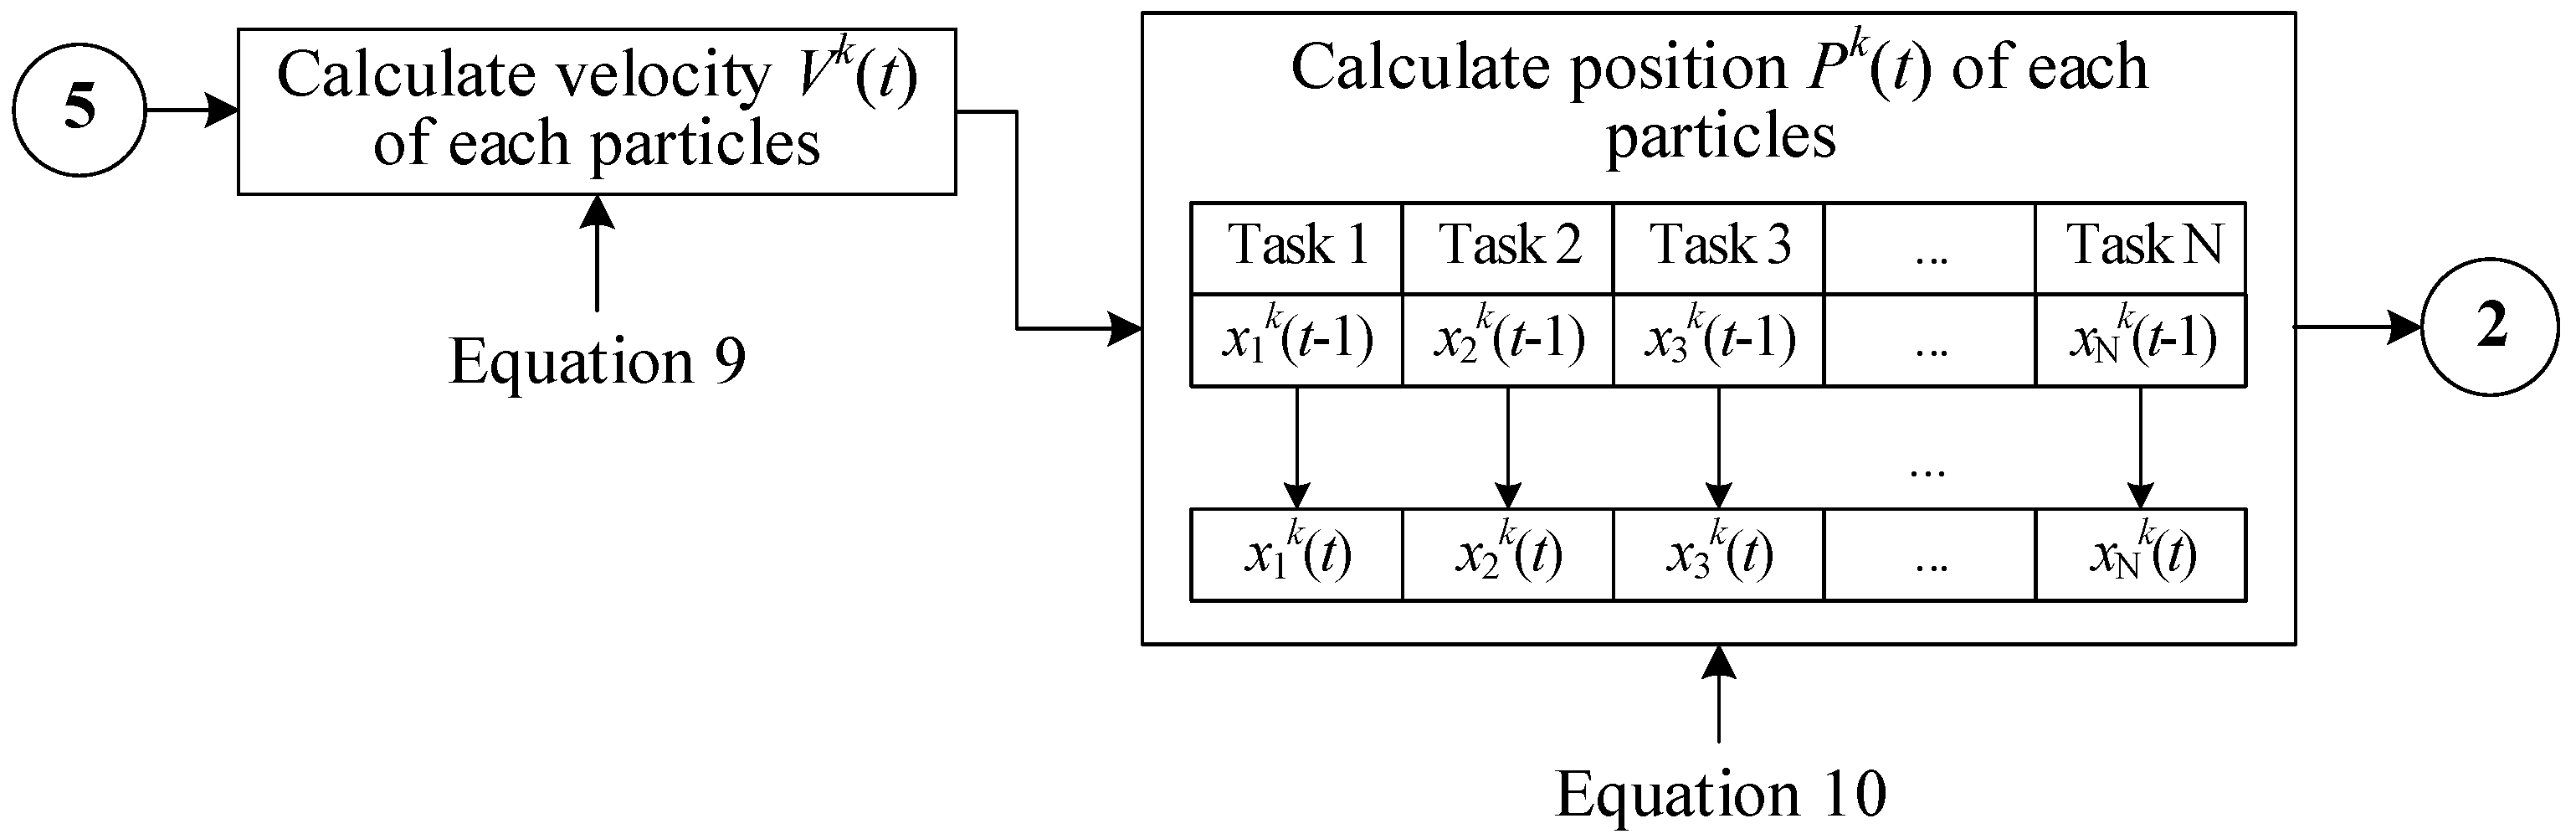
The particle of PSO will search new solutions by the movement of particle positions (P), as described by Equations (9) and (10) when stop criteria are not reached. As shown in Figure 5, based on the velocity updating mechanism (Equation (9)), the new velocities Vk(t) for each particle are calculated. Then, the position (plan) of each particle are calculated based on new velocity and their previous positions (Equation (10)). In this way, the searched new construction plans changes xn for each task n, in order to (1) move to other particles that have optimal performances, and; (2) to learn from their own optimal performance history. And these new construction plans will return to be simulated by DES (step 2) for further iteration.
where t = 1, 2, …, T denotes the iteration of PSO, whereas k = 1, 2, …, K denotes the specific particle of the swarm. According to Bratton and Kennedy’s [54] study, the proper size of particle swarm depends on nature of problem, but it only has a slight marginal influence on the optimisation quality. Thus this study initially set particle size as 30, and make modification if necessary; Pk(t) = {(1, x1k(t)) (2, x2k(t)) (3, x3k(t)) … (N, xNk(t))} denotes the position of the k-th particle in the t-th iteration, whereas Vk(t) represents the movement velocity on position; pbestPk(t − 1) and gbestPk(t − 1) describes the local and global best positions; inertia weight w(t) describes the inertia of velocity influencing the t-th iteration by the t-1th iteration, which was first introduced in Shi and Eberhart’s study [55]; c1, c2 are acceleration coefficients that weight the significance of the local best and the global best position, respectively, of the particles; r1 and r2 are random numbers ranging from 0 to 1.
Vk(t) = w(t) × Vk(t − 1) + c1 × r1 × (pbestPk(t − 1) − Pk(t − 1)) + c2 × r2 × (gbestPk(t − 1) − Pk(t − 1))
Pk(t) = Pk(t − 1) + Vk(t)
The parameter of a PSO method will influence the optimisation quality. According to Shi and Eberhart [55], Tuppadung and Kurutach [56], Chatterjee and Siarry [57], a decreasing form of inertia weight w(t) would yield an increased convergence speed and an improved search for multi-dimensional optimisation. An inertia weight is set as a decreased form (see Equation (11)), where {wmax, wmin, m} should be determined at fixed T for individual cases. Based on our study by Wang et al. [6], {wmax = 1.3, wmin = 0.1, m = 1} is acceptable for construction decisions:
w(t) = wmax + (wmax − wmin) × (T − t)m/Tm
The acceleration coefficients c1 and c2 will balance the influence of the particle individual best information and swarm best information. To make an equal consideration between the individual and the swarm, they can be set as an equal value [58]. The reasonable value can be varied between 0.5 and 2.5 [26]. But a proper value selection can be obtained by a sensitivity analysis for the studied problem.
4. Prototype and Application
4.1. Prototype Overview
The integrated method was programmed and developed as a prototype as Algorithm 1 (complete codes refer to supplementary materials). An object-based modelling platform SimioTM, capable of simulating discrete-event process, as well as having application programming interface (API) capability that is extended by outside environment, is employed as the DES production platform. The construction simulation are managed by five relational tables following the “CARS” conceptual model. Furthermore, the customised PSO are programming in the MatLab® platform, to achieve multi-objective optimisation. An established API connector by Dehghanimohammadabadi and Keyser [59] to link Simio and MatLab is extendedly programmed for this study to handle the simulation at each fitness evaluation of PSO, which also records the number of the DES model call. The performance assessment is built within Simio using its calculation ability.
| Algorithm 1. Prototype overview for the integration method (pseudocode). |
| procedure DES-PSO in MATLAB initialization particles velocity V, position P, iteration t = 1 global best position gbestP and particle best position pbestP while stop criteria: iteration t < maximum iteration T || below improvement threshold, do particle solution searching: V(t) = w(t) × V(t − 1) + c1 × r1 × (pbestP(t − 1) − P(t − 1)) + c2 × r2 × (gbestP(t − 1) − P(t − 1)) && P(t) = P(t − 1) + V(t) while k-th particle < total particles K, do run DES-based simulation for position of k-th particle in SIMIO with API evaluate cost, time, and environmental impact using Equations (2)–(6) and LCA database k<--k + 1 end update swarm gbestP and particle pbestP t<--t + 1 end |
4.2. Case Application
The proposed framework and prototype were implemented in the construction of a hotel building located in Heilongjiang province, China. This 36,000-m2 building is a reinforced-concrete frame structure, with 16 floors above ground and two floors at the basement level. The construction of 14 standard floors are optimised in this case study. This construction project is chosen as a case study because it has been completed. Thus detailed on-site observation records and the corresponding interview data were sufficient for validating the method.
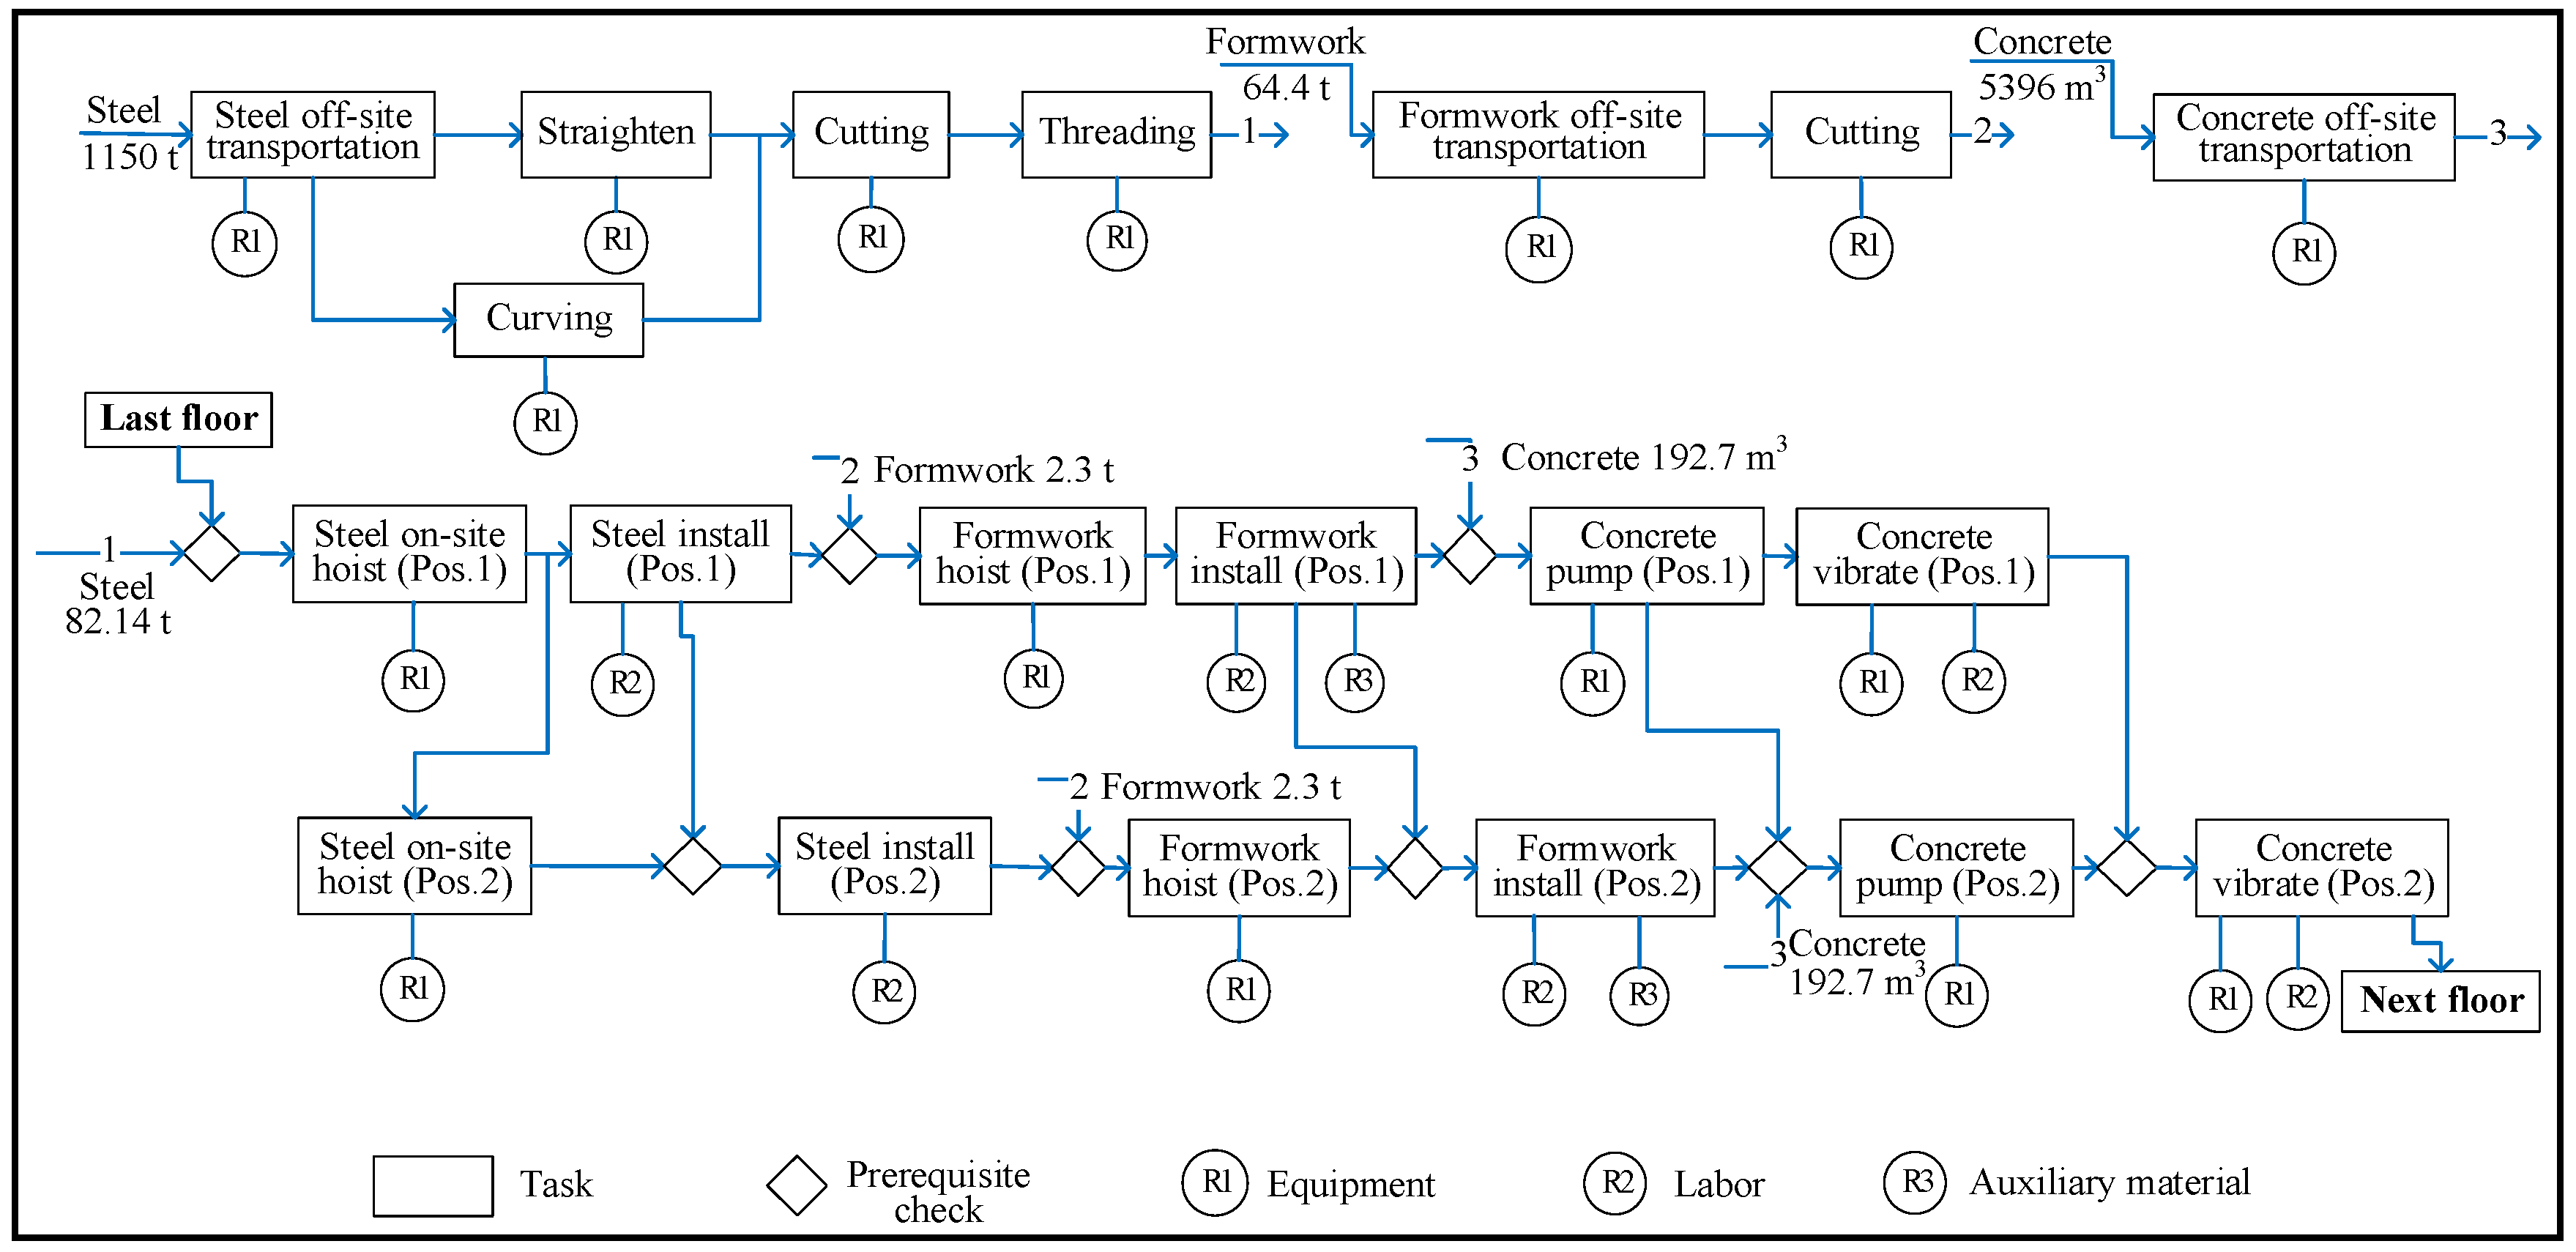
The construction of the frame structure for the standard floors started from 15 June 2014 and ended on 15 September 2014. The regular on-site working schedule was from 7:00 a.m. to 17:00 p.m., with a 2-h lunch break. Through on-site observations, the actual construction tasks and process logic of the frame structure thereof were surveyed (shown in Table 1 and Figure 6). The on-site space was divided into two sections. A flow construction process was performed on these two working spaces by each task team in sequence. In this construction method, each construction activity was influenced by the factors of prerequisite work, equipment, materials, labour resources, and working space. Thus, the real-time schedule of an activity will influence their succeeding tasks, and thus affect the entire project duration. The idle time due to prerequisite work being incomplete, unavailable resources, and unreached working space will also affect the total equipment rent cost.
With the increase of height of task location, the vertical transportation equipment, like the tower crane and construction lift will use more time and higher electricity usage to complete a unit construction task. At the same time, both the crew transportation and concrete pumping’s energy consumption will also change [60]. It requires moment analysis during the construction process. By DES model in the proposed integrated method, it provides a momentary simulation ability to assess the accumulated project time, cost, and environmental impacts.
In addition, supplementary information, such as the probability distribution of the working productivity (WP), is collected through an interview with the construction manager. According to the interview, the triangular distribution that represents the probability of activity to be minimum, most-likely, and maximum is suitable to describe the actual working productivity, which has also been validated by the previous study [61]. According to the manager’s empirical estimation for this construction project, 75% and 125% of the average productivity could be appropriate values for the minimum and maximum probability.
The contractor of the case project has established an enterprise database for construction techniques. After retrieving the enterprise database with project manager, possible alternative planning scenarios were selected, as shown in Table 2. Four types of mixer trucks, with volumes of 5, 6, 7, and 8 m3, are commonly used for premixed concrete in China. Similarly, four types of concrete pumps, with electric power of 80, 60, 45, and 30 kW, can be rented locally. In the original construction documents, 60 crews were designated for completing the manual steel installation during the heavy-workload period. The DES model compared the operational performance associated with different numbers of crews (from 1 to 80). In this case, this was the contractor employed crane tower ST60/15 and construction lift SCD200/200 V. Two other types of crane and lift were compared. The traditional formwork system in China is timber formwork system (TFS). Other types of formwork systems have obtained many discussions and some application. A steel formwork system (SFS) that is one promising alternative is selected to be compared in this case. A proper system of overtime work for some tight duration project is a popular strategy. It is assumed that two more hours than normal working hours (8 h) is acceptable. Proposed method will select the best overtime strategy in order to balance environment–time–cost performances.
The workload (Q) of each task were determined from building design and construction documents provided by the project contractor (see Figure 6). The price of the labour hour and equipment are collected from several local databases, and in the Construction Engineering Quota (CEQ) of Heilongjiang and at the China national level [60,62] (see Table 3). The case study employed global warming potential (GWP, eq. CO2 kg) as an environmental indicator. The data source for the emissions factors cited from the NDRC [63] and EMSD [64] based on Chinese energy production and local delivery modes; and the characterisation factors to GWP 100yr are from IPCC [65] (see Table 4).
5. Results Summary and Discussion
5.1. Model Validation and Optimisation Parameters Selection
According to proposed integrated method, firstly, the DES model was developed based on observed construction process logic as Figure 6. The DES model was validated by comparing the actual construction performance with the simulated performance. Using this original construction scenario, the duration of the simulation-based construction was 95.46 days (8 h/d), i.e., (95.46 − 93)/93 × 100% = a 2.65% difference compared with the actual construction time (93 days). The actual materials, equipment, and labour cost of original plan can be calculated by Equations (6)–(8), which is 2.27519 × 10⁶-CNY. The simulation value was 2.33630 × 10⁶ CNY, i.e., (2.27519 × 10⁶ − 2.33630 × 10⁶)/2.33630 × 106 × 100% = 2.69% difference. These time and cost differences were regarded as acceptable in this study.
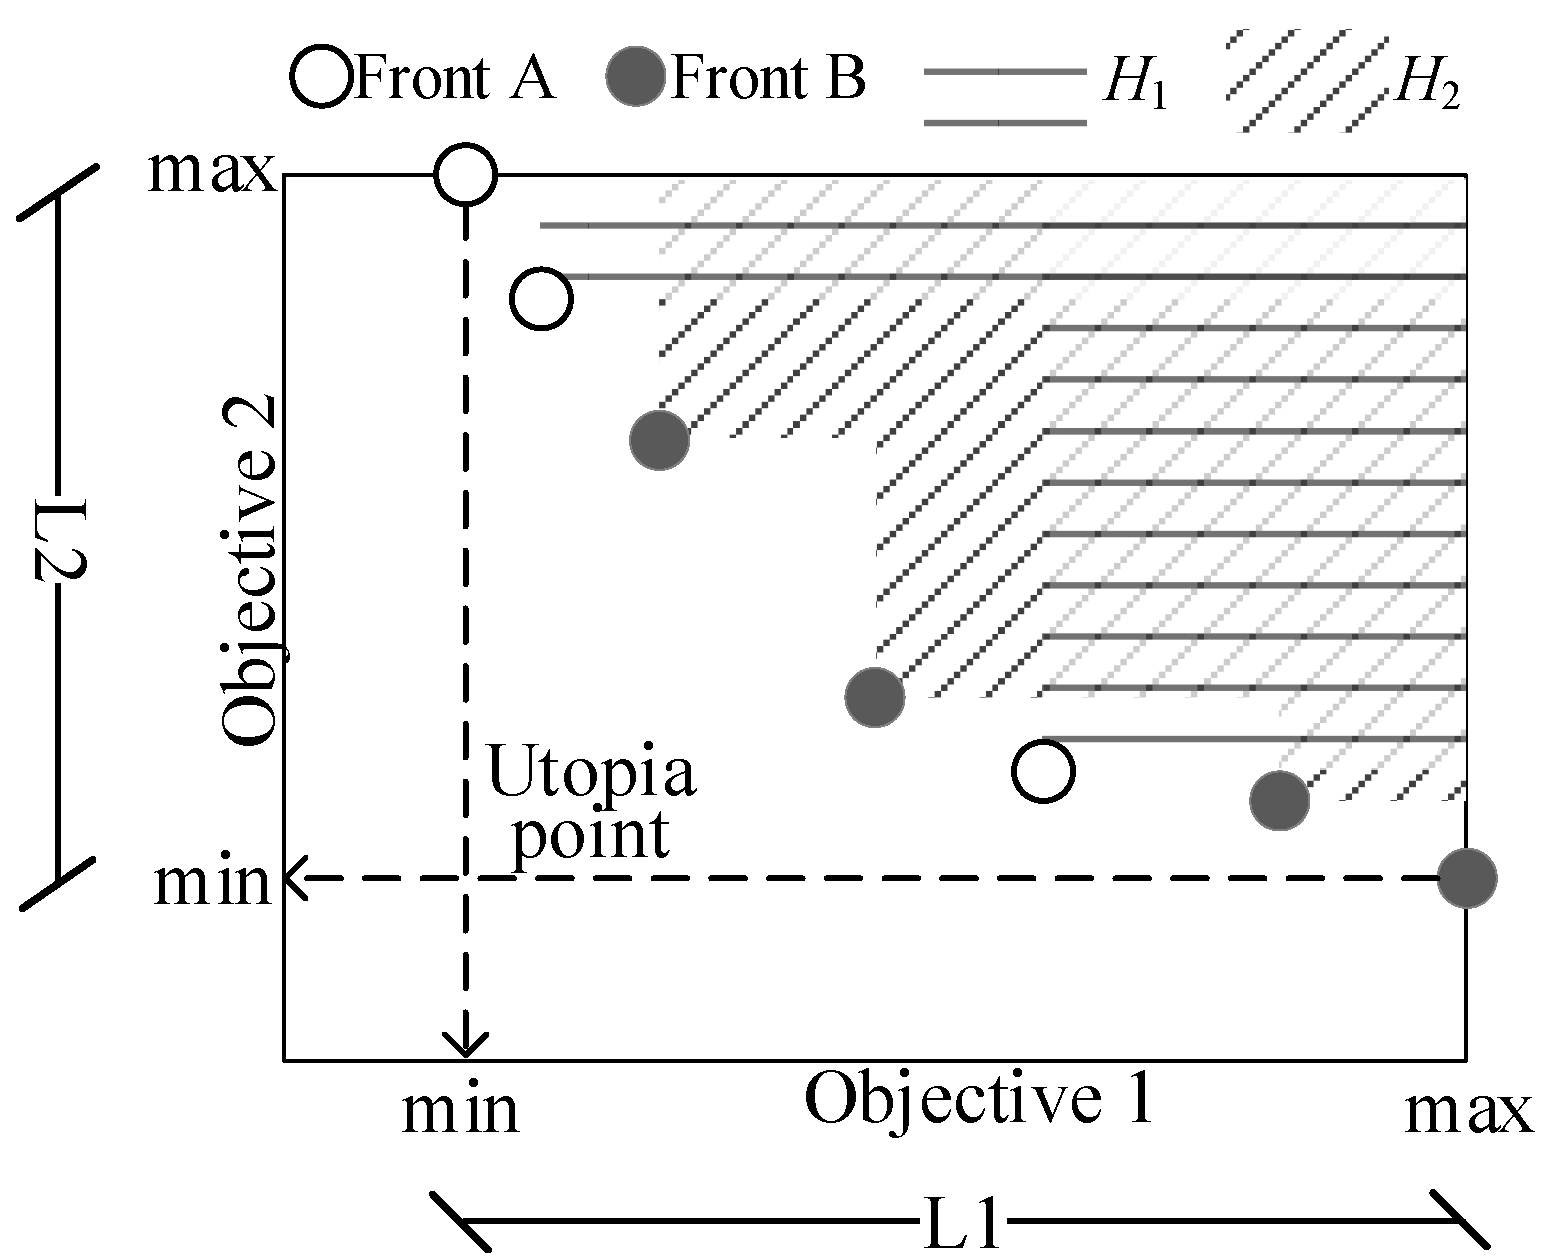
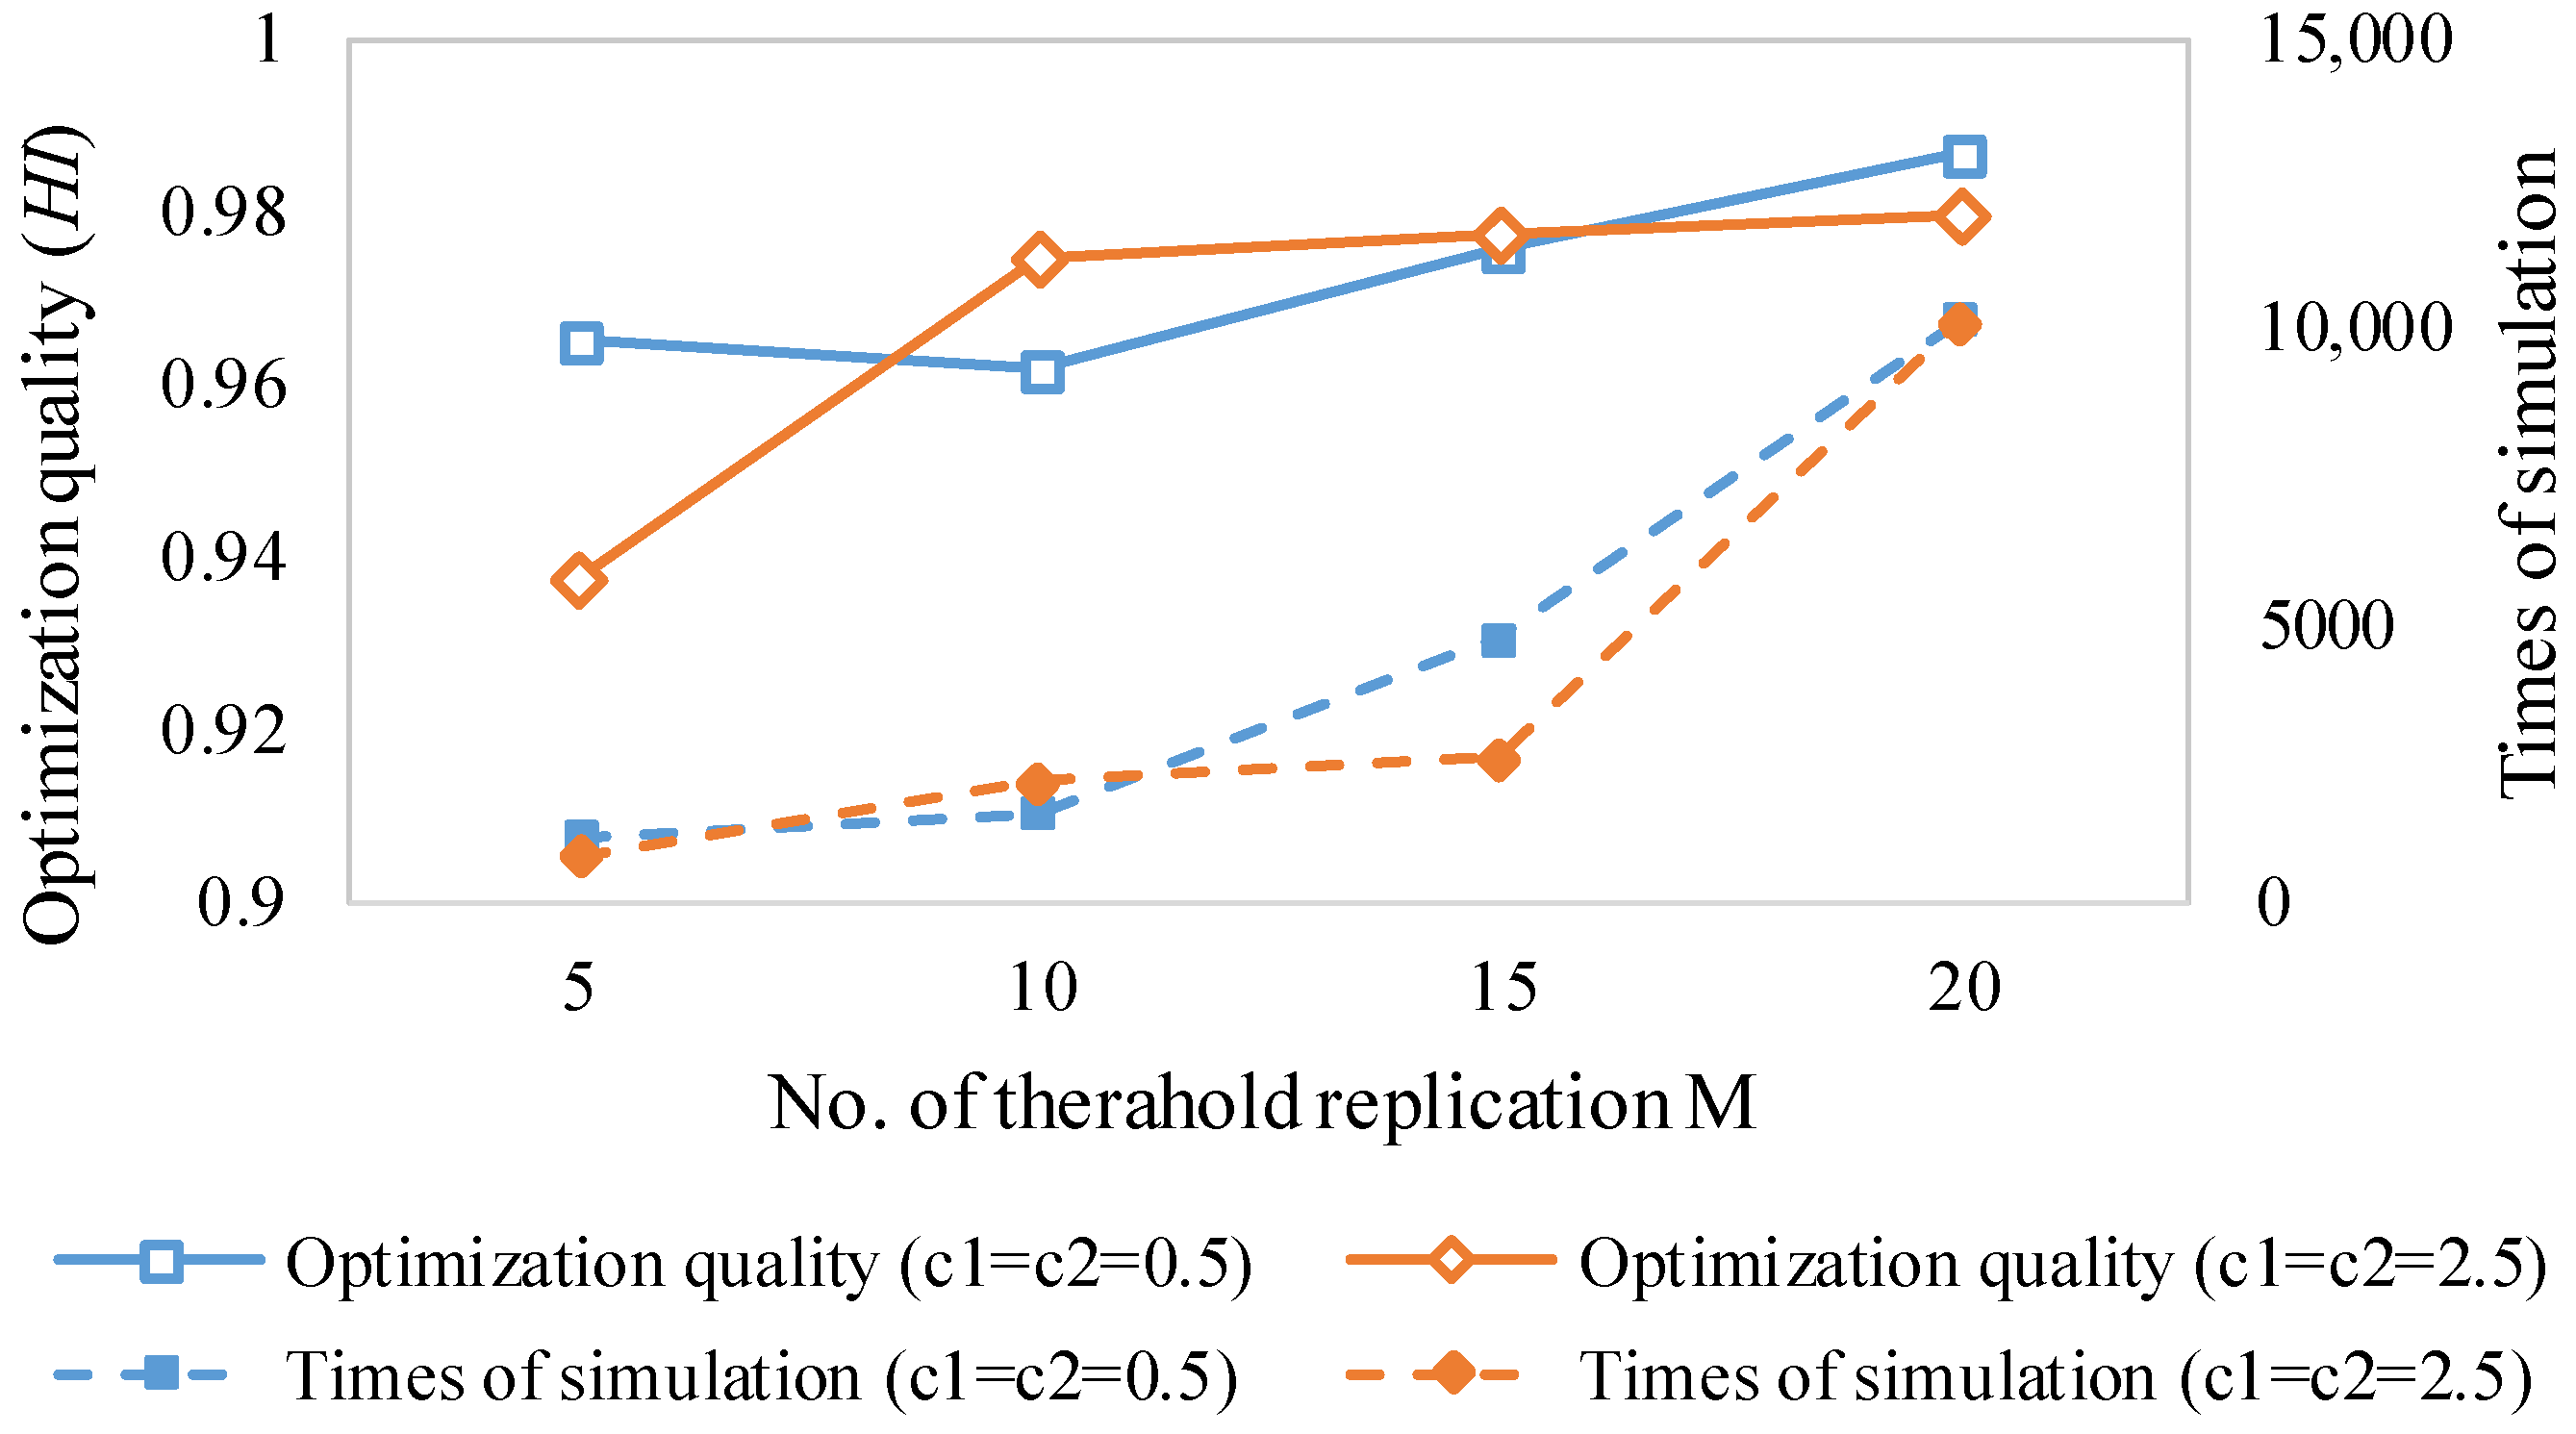
The proper parameters in PSO need to be selected to achieve a best optimisation, considering efficient computing loads. The inertia weight w is set as a dynamic value. Acceleration coefficients c1, c2, and the stop replication below the optimisation threshold M remain crucial parameters for PSO-based optimisation. As the optimisation quality for multi-dimension problems is not easily visualised, a popularly used indictor (hypervolume indictor) proposed by Zitzler et al. [69] is used to evaluate the quality of different Pareto fronts (see Figure 7, HI = H/(L1 × L2)). A sensitivity analysis was conducted to choose proper parameters, taking the balance of optimisation quality and computing loads (see Figure 8). Results show the optimisation quality receives an improvement when M increases from 5 to 20, and the acceleration coefficients c1 = c2 = 2.5 are better than c1 = c2 = 0.5 when M is higher than 10. Therefore, the c1 = c2 = 2.5 was chosen for this case. On the other hand, the optimisation improvement was less clear cut when M was over 10 for c1 = c2 = 2.5. Besides, the required simulation increases sharply when M reaches 20. Thus, replication M was set as 15, considering both the optimisation quality and the computing loads.
5.2. Application Results
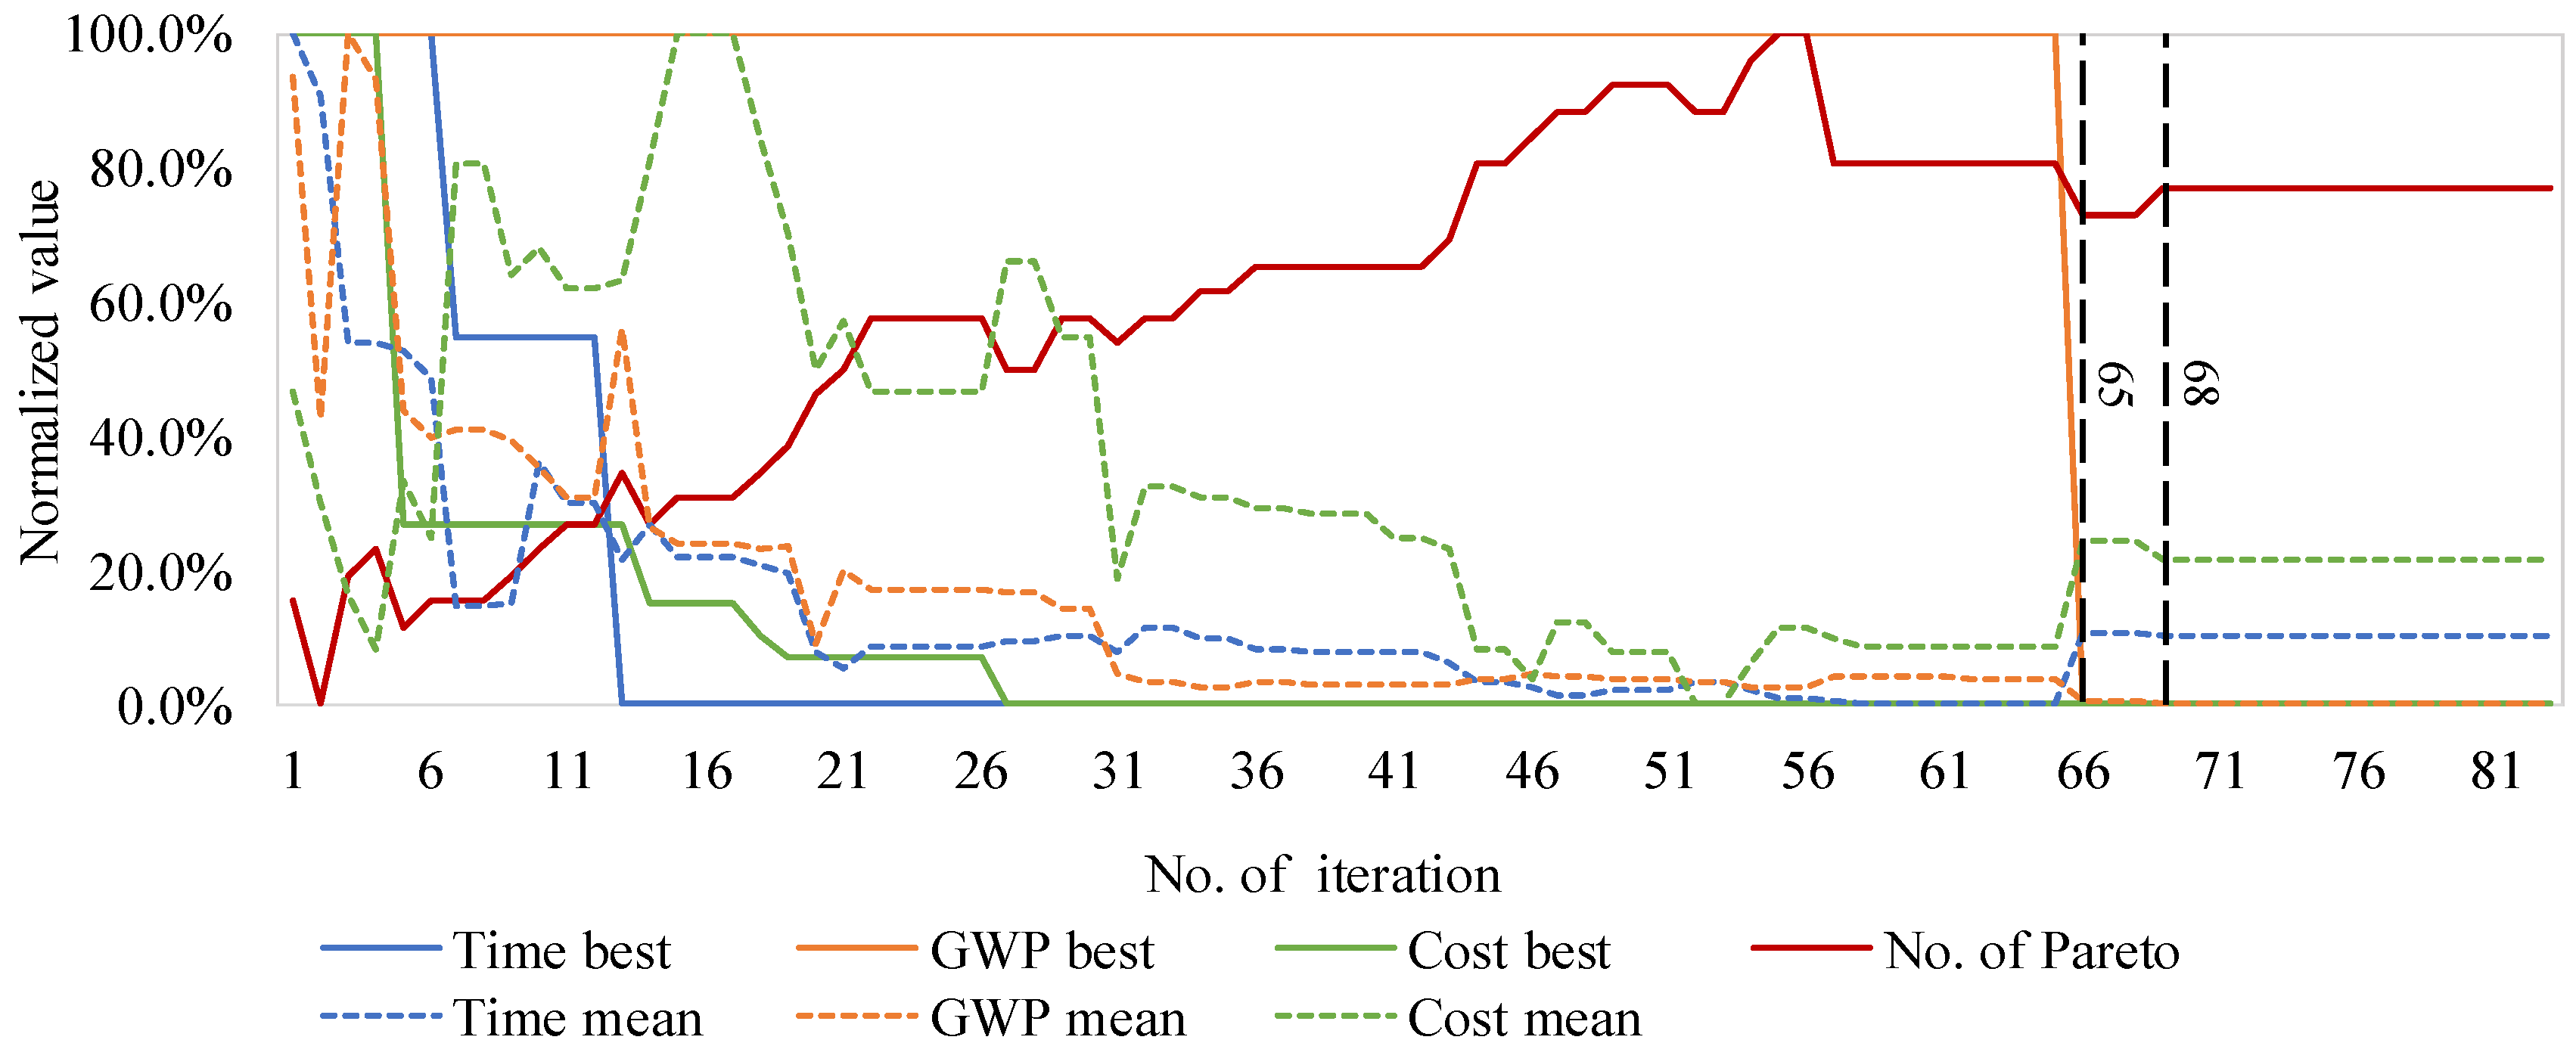
After the above preparation, the simulation-based optimisation algorithms (see Algorithm 1) were performed, and DES-based simulation and assessment were called at each step of particle fitness evaluation. The iteration stop criteria was reached at the 83th iteration (see Figure 9), and CPU (2.8 GHz, 4 cores) running time was 24,989 (s). At each iteration of integrated optimisation, the fitness of the global best particle, the swarm’s average values on three objectives, and searched the number of Pareto solutions were recorded, as in Figure 9. It shows that the global best values on construction cost, duration, and environmental impacts had a sustained reduction before the 65th iteration. However, the swarm’s average values on three objectives represented a trade-off relation on the objectives before the 68th iteration. The number of Pareto solutions show an increase tendency with fluctuation before the 68th iteration. After the 68th iteration, the average values on the objectives and the number of Pareto solutions became steady.
By enumeration method, the assessment of the environmental impact, construction cost, and duration, as well as making multi-objective decisions in large numbers of plans could be extremely challenging. If all scenarios are simulated in the solution space using the traditional method, in theory, more than 108 iterations of simulation are required. While, proposed integrated method recorded only 2520 iterations of simulation during the optimisation iteration. It means that a great number of simulations are reduced by integrated method. Taking advantage of the fast convergence of PSO, the proposed method avoids the time-consuming assessment for all of construction scenarios.
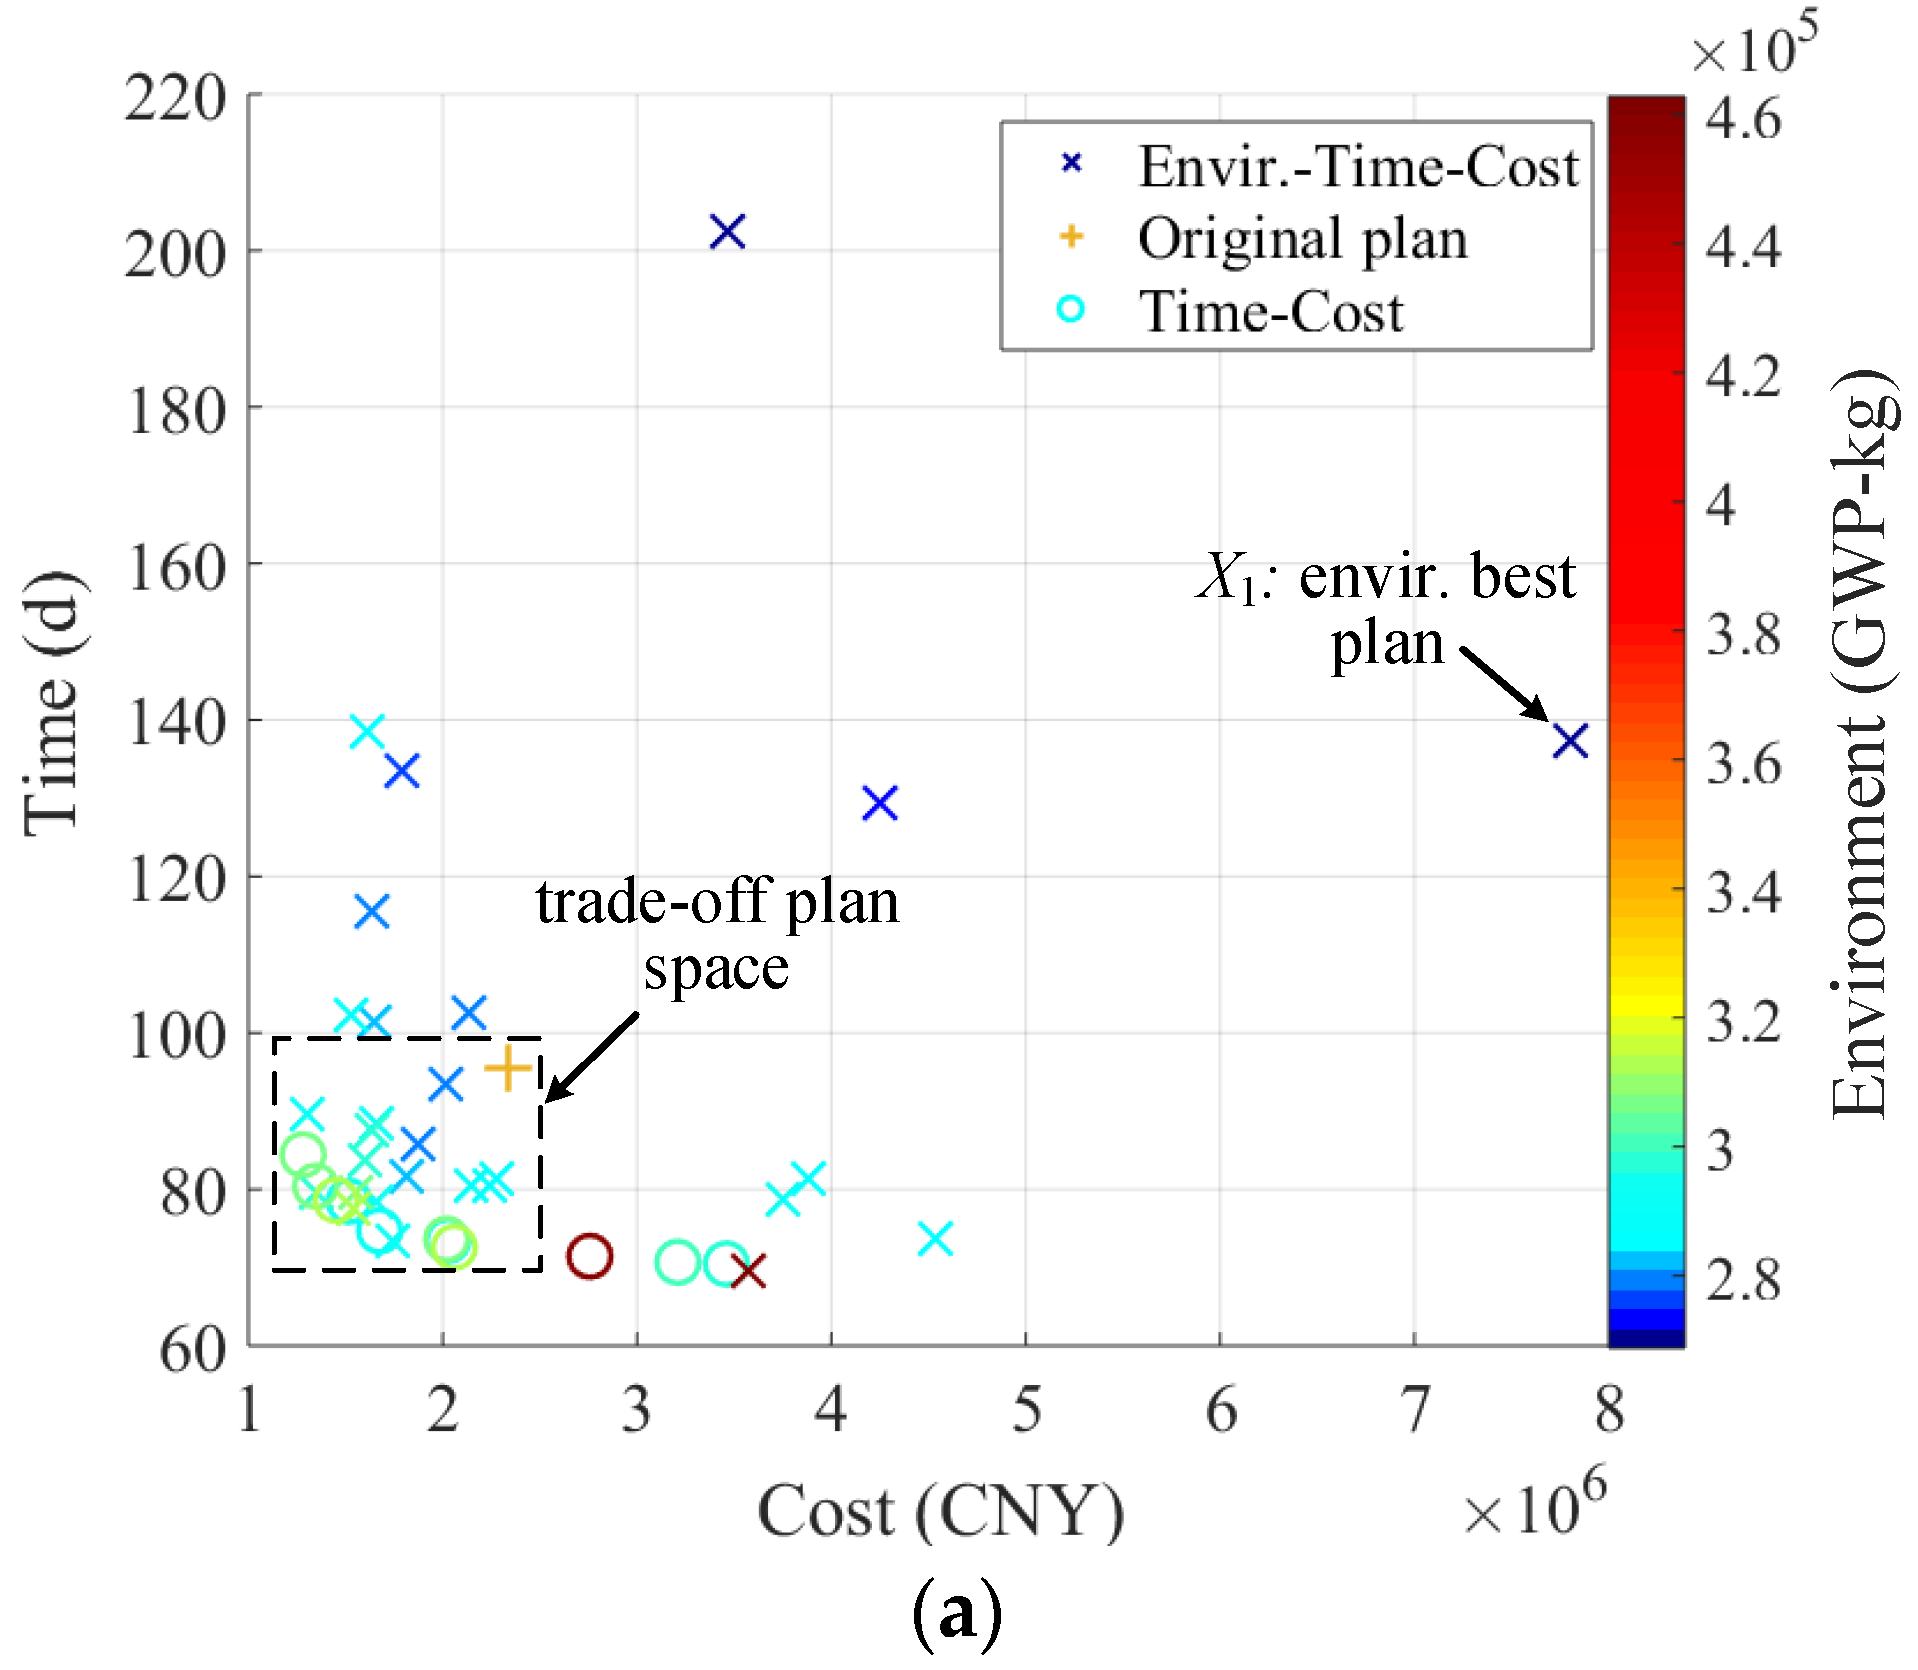
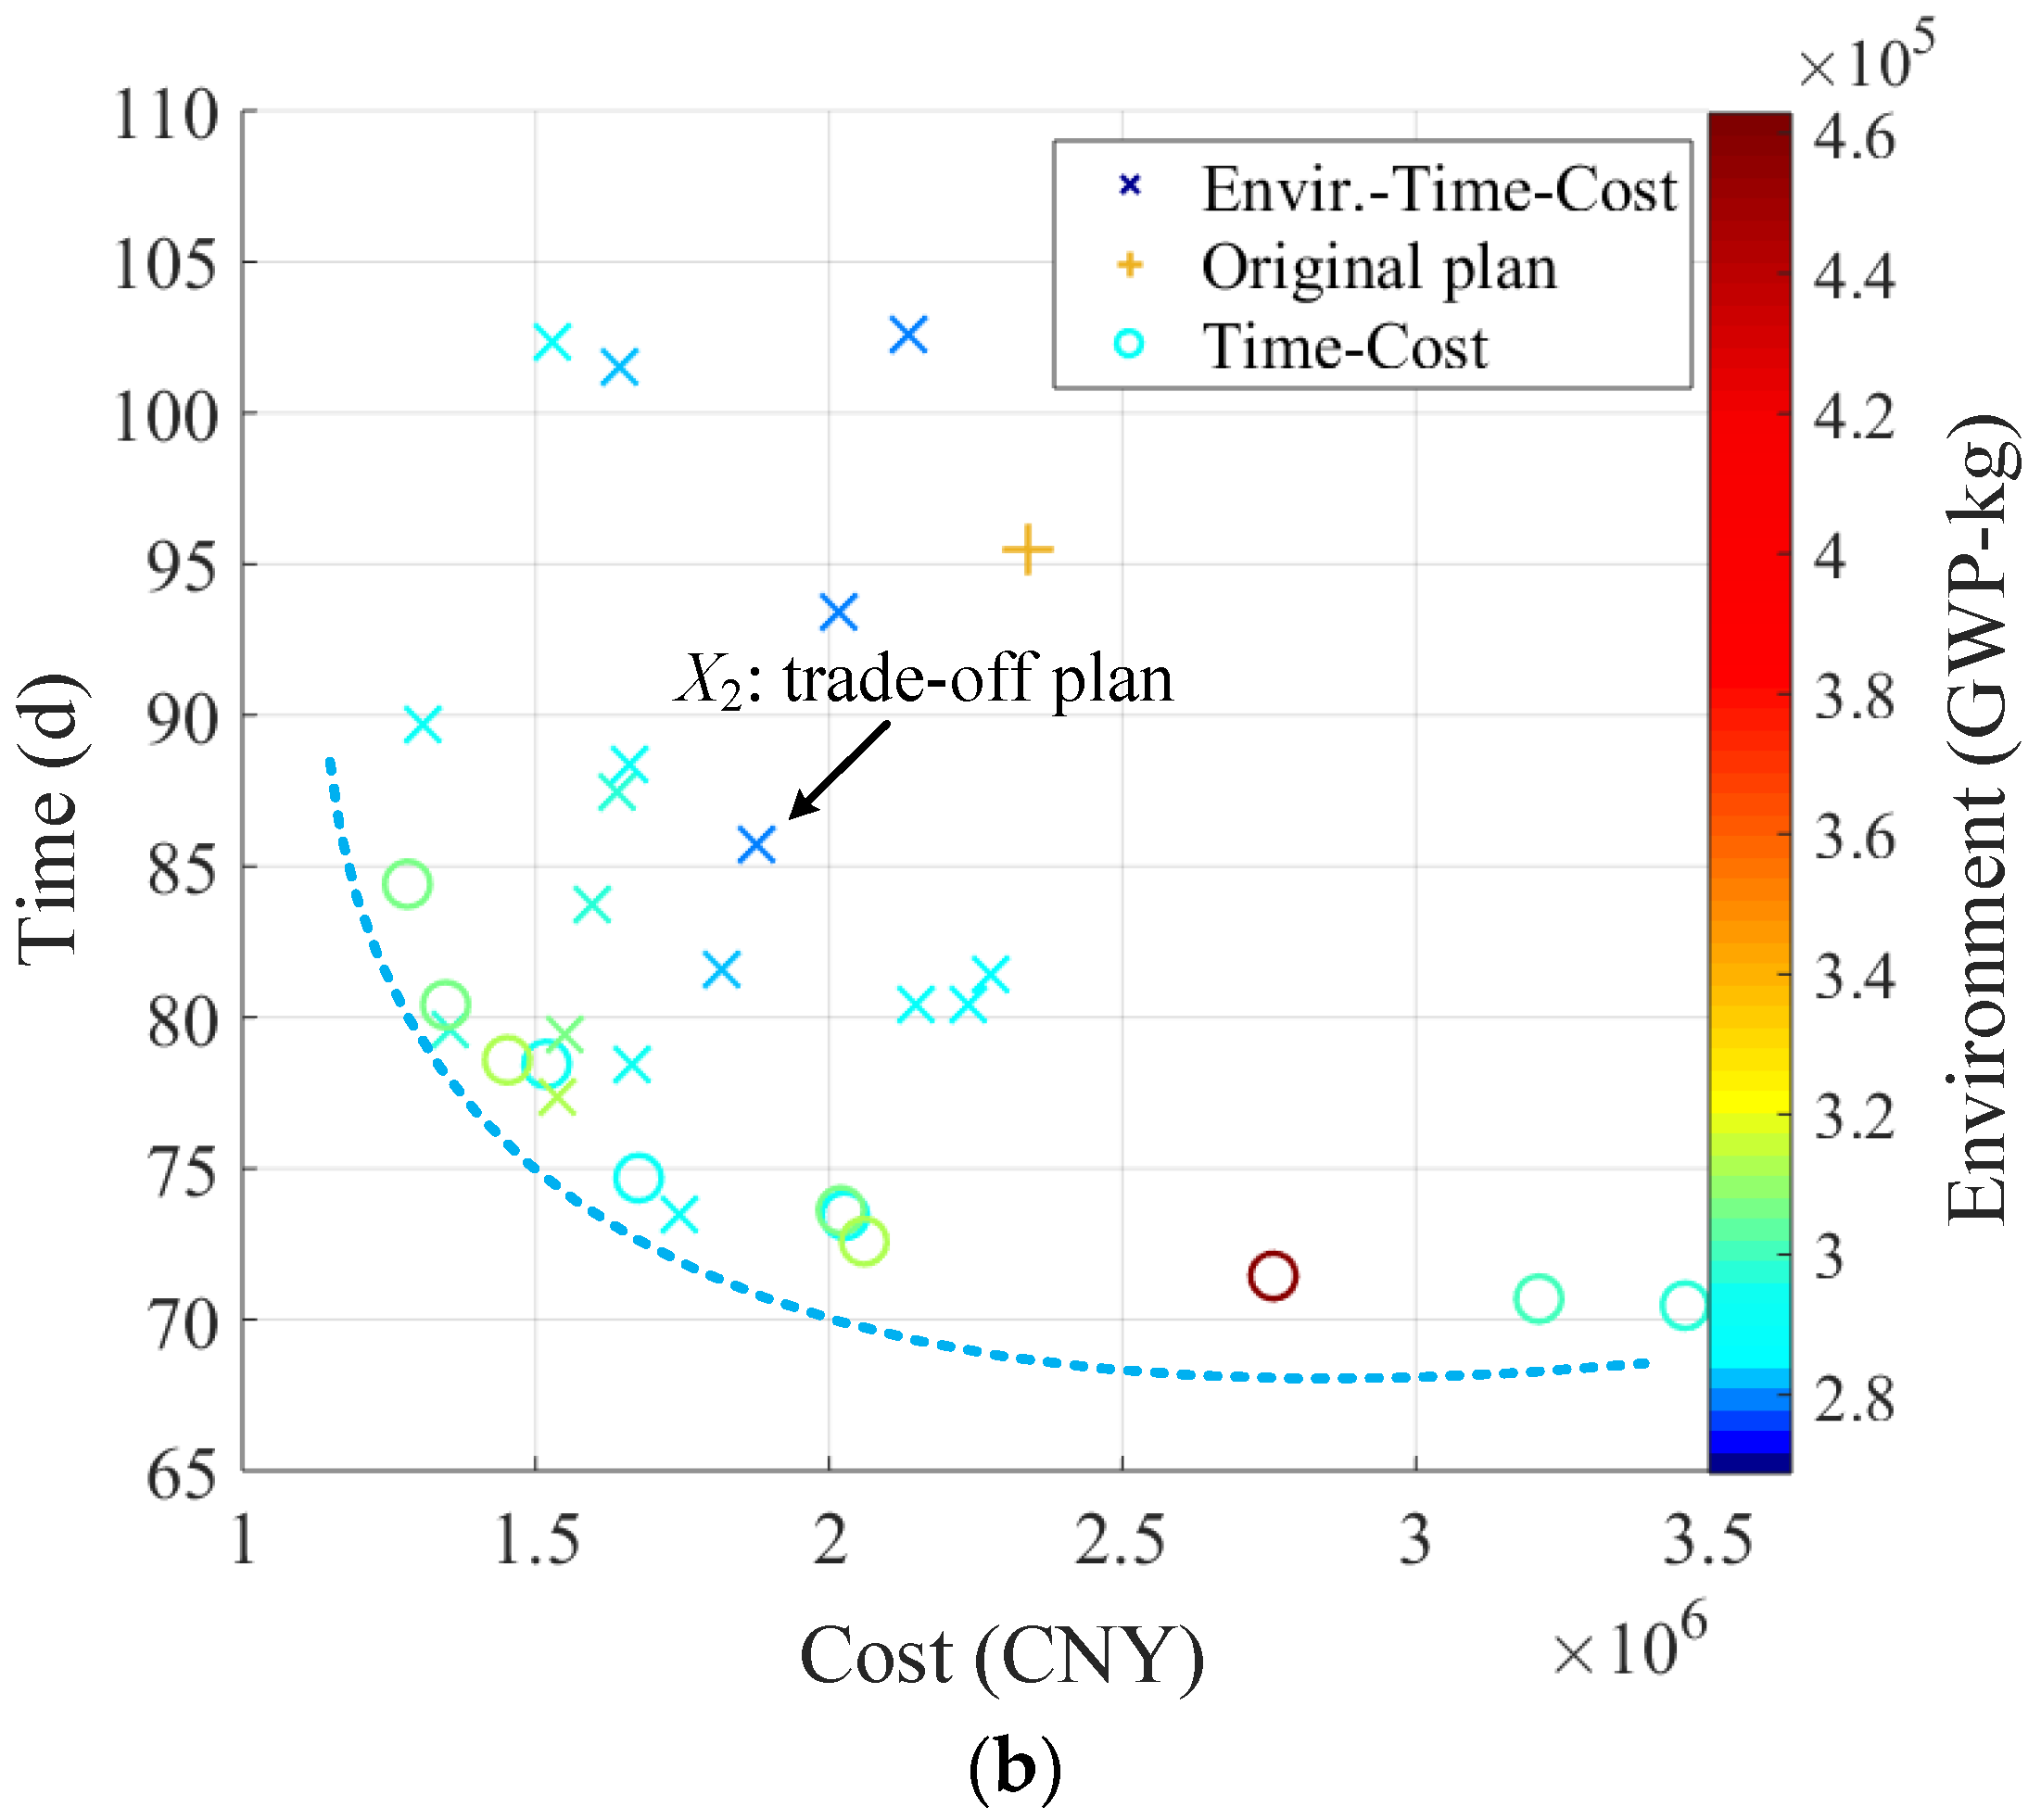
For this case study, a total of 28 Pareto construction scenarios were obtained by the proposed method (see Figure 10). Compared with the simulation of the original plan (GWP: 383,414-kg, cost: 2,336,300 CNY, time: 95.46 d), they at most lead to reductions of (383,414 − 268,788)/383,414 = 29.9% on the environmental impact, (2,336,300 − 1,306,245)/2,336,300 = 44.1% on construction cost, and (95.46 − 69.68)/95.46 = 27.0% on project duration, respectively, when choosing the single objective best solution. X1 = {(1,4) (2,1) (3,3) (4,70) (5,3) (6,1) (7,22) (8,2) (9,1) (10,8.67)} is the environment best plan in environment-cost-time Pareto solutions (see Figure 10a). While X2 = {(1,4) (2,4) (3,2) (4,66) (5,2) (6,1) (7,51) (8,2) (9,1) (10,8.00)} is a three objective trade-off plan, which improves the environment with non-worse times and cost performances, compared with the original plan (see Figure 10b). If the cost increase of the environment best plan X1 (7,808,526 − 2,336,300)/2,336,300 = 234.2% is not acceptable for contractors, there still are 15 trade-off plans in Pareto solutions having lower environmental impacts without sacrificing cost and duration. For instance, the plan X2 reduces (383,414 − 280,201)/383,414 = 26.9% of GWP impacts, (2,336,300 − 1,875,089)/2,336,300 = 19.7% of project cost, and (95.46 − 85.69)/95.46 = 10.2% of duration.
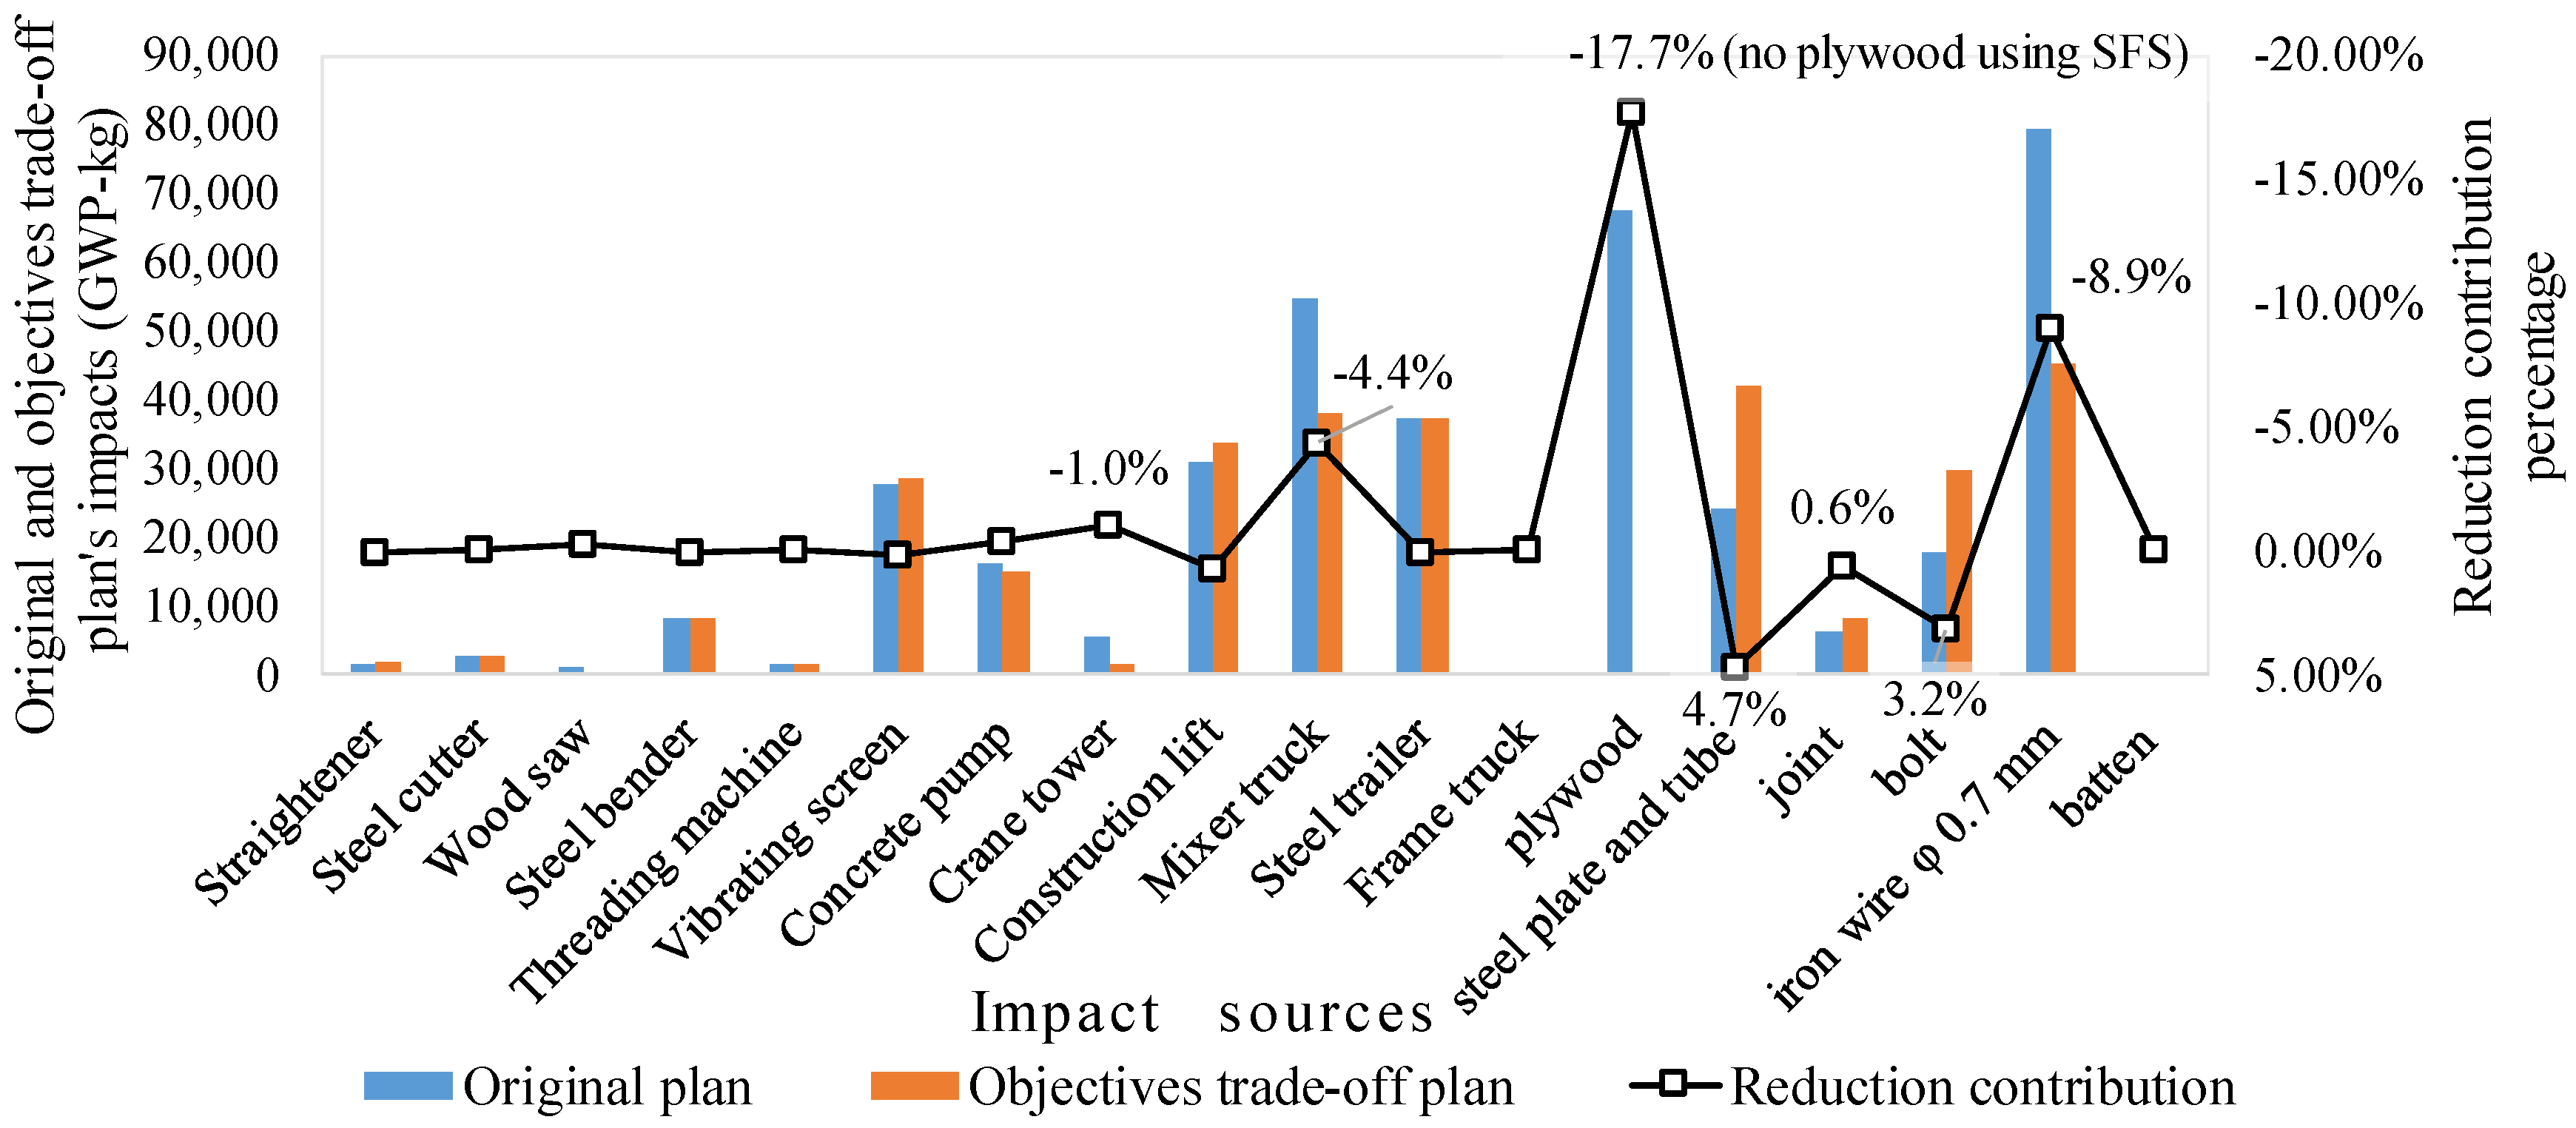
To analyse the reason of impact reduction in detail, the objectives trade-off solution, X2 and original construction plan are compared by impact sources as Figure 11. A value of 280,201 kg GWP is obtained by trade-off plan within Pareto solutions using X2. Compared with original construction plan, overall 26.9% of GWP impacts can be reduced by X2 using integrated method. In all of impact reduction, the total impact reduction contribution by sustainable material selection is 18.2% because of using SFS (steel formwork system) and annealed iron wire. As construction equipment, new type of mixer truck contributes 4.4% of GWP reduction, and the crane tower contributes 1.0%. According to the results of a case study, the iron wire and plywood are the two major contributors in terms of GWP impact as auxiliary materials. The concrete mixer truck, steel transport trailer, and the construction lift contribute the three major parts of GWP impact as equipment (see Figure 11). These results are consistent with previous studies by Feng et al. [40] and Bilec et al. [4], which demonstrated that construction-related iron wire, plywood, and transportation are the major sources of GWP impact.
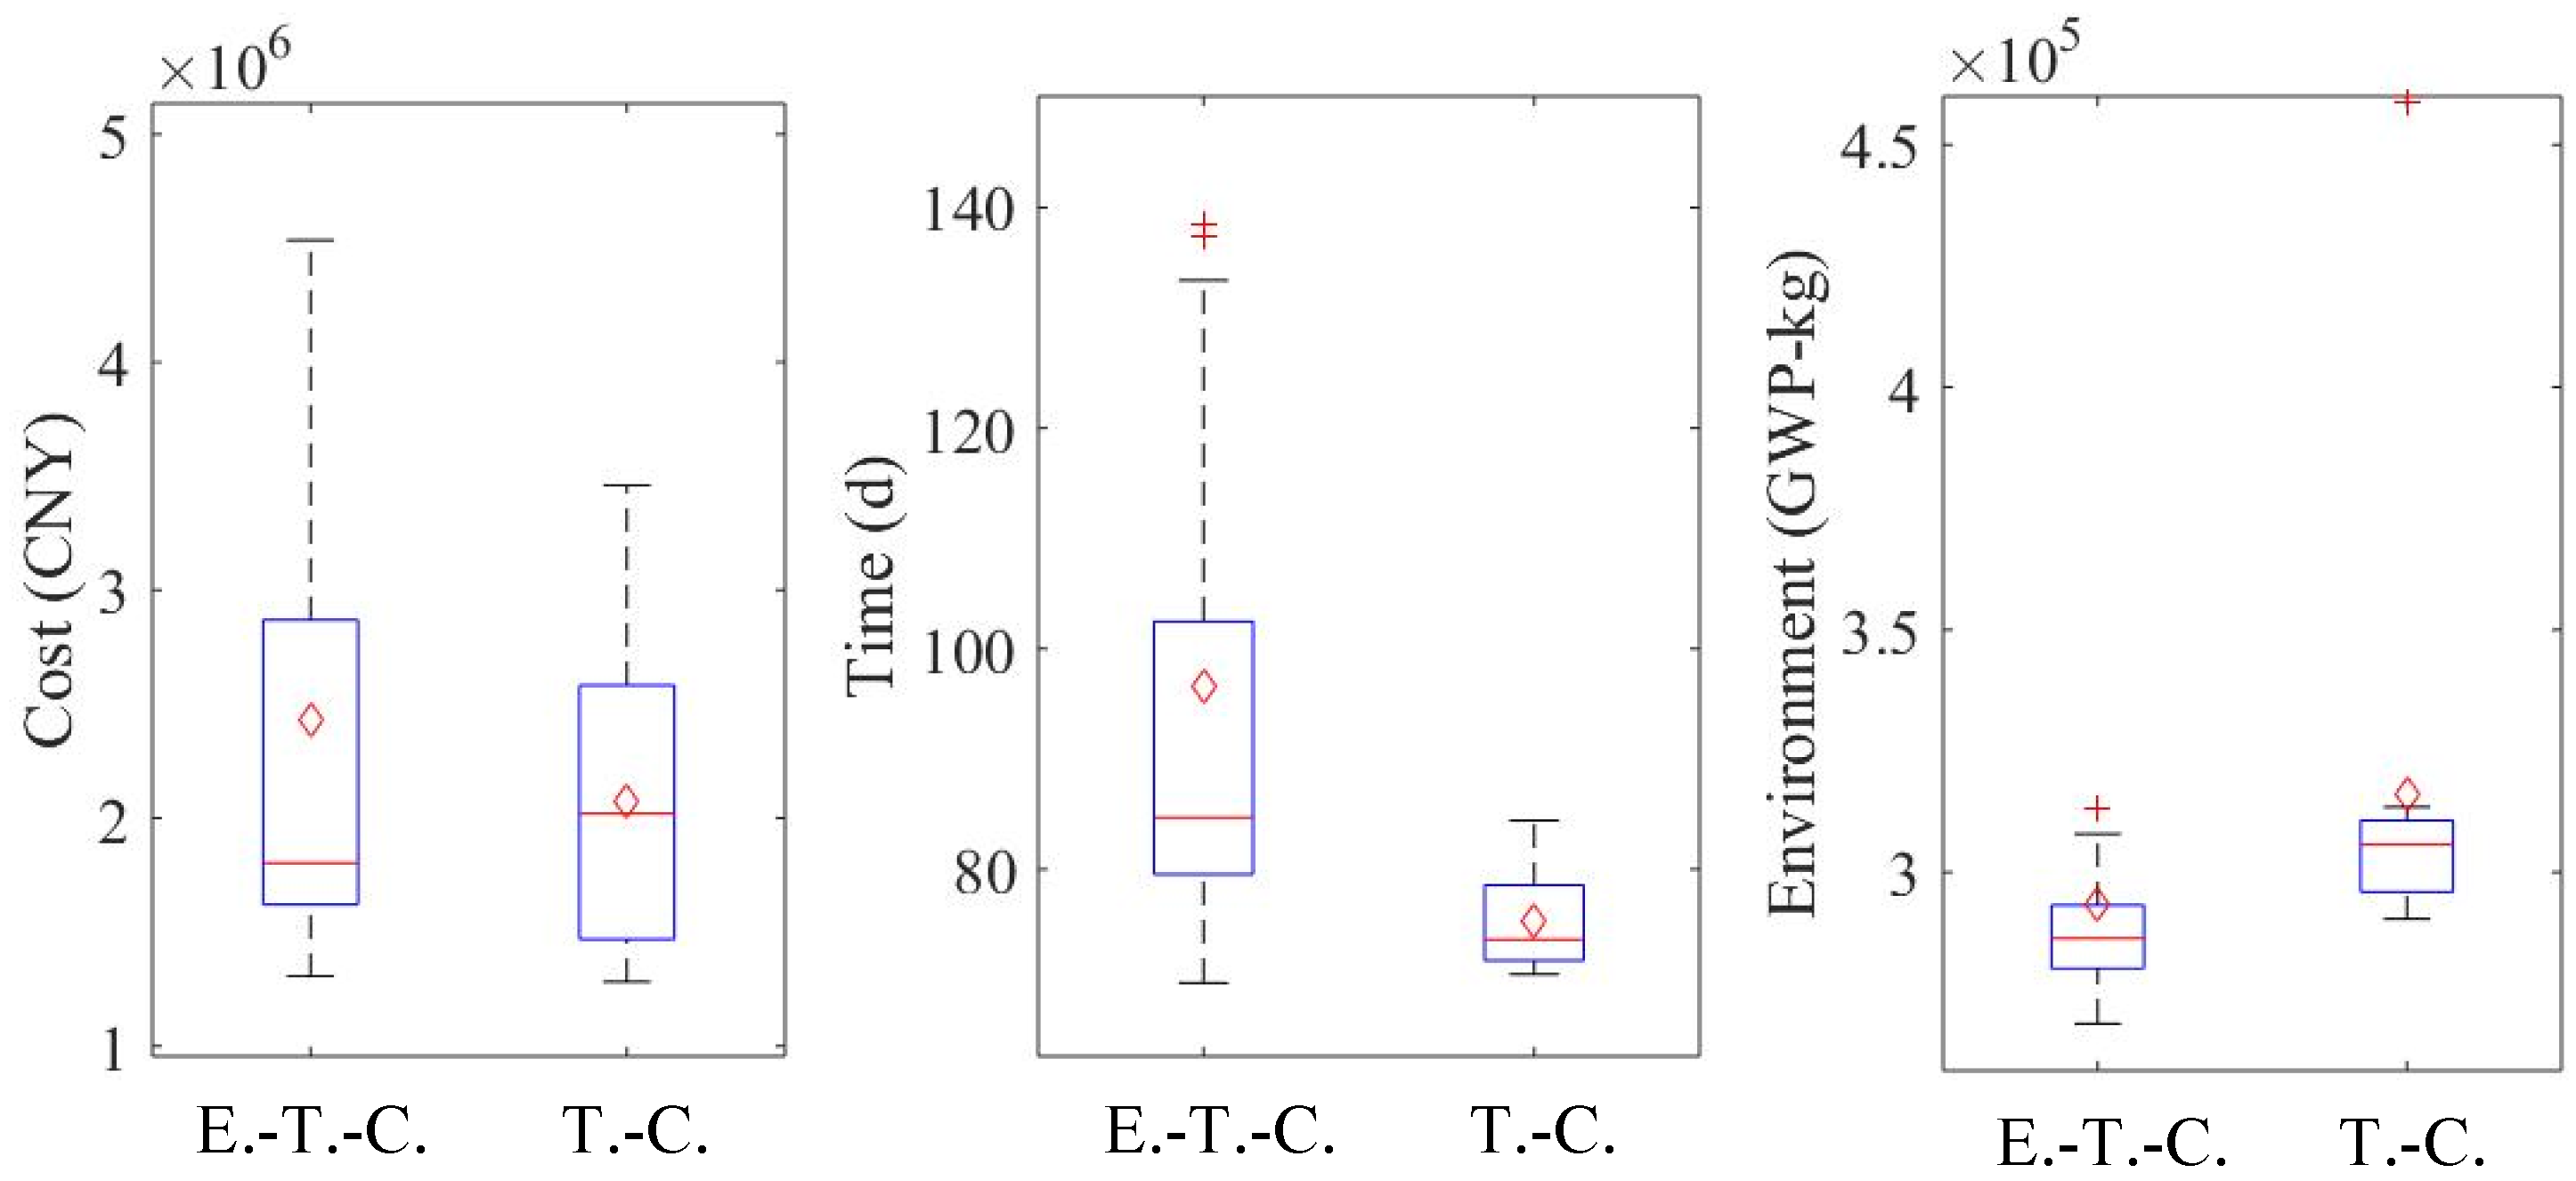
The construction duration and cost have been the most frequently studied construction objectives in the previous study. This study also sets the time–cost as objectives in the integrated method, which yields 11 Pareto solutions (see Figure 10). As Figure 10b shows, these time–cost Pareto solutions occur at the time–cost Pareto front. The Pareto solutions of environment–cost–time and time–cost settings show different performances on environmental impact, project cost, and duration, which can be seen as Figure 12. It shows proposed environment–time–cost provided better solutions associated with the environment (see Figure 12), which at most yielded more GWP reductions by (290,348 − 268,788)/290,348 = 7.4%, compared with a traditional time–cost trade-off. The missed solutions should have increased the opportunity for contractors improving the environmental performance. In addition, the Pareto scenarios searched out by the environment–cost–time optimisation yield best cost (1,306,245-CNY) is slightly (1.9%) worse than those obtained via the time-cost optimisation (see Figure 12). The shortest project duration is equal (70 d) to the time–cost optimisation.
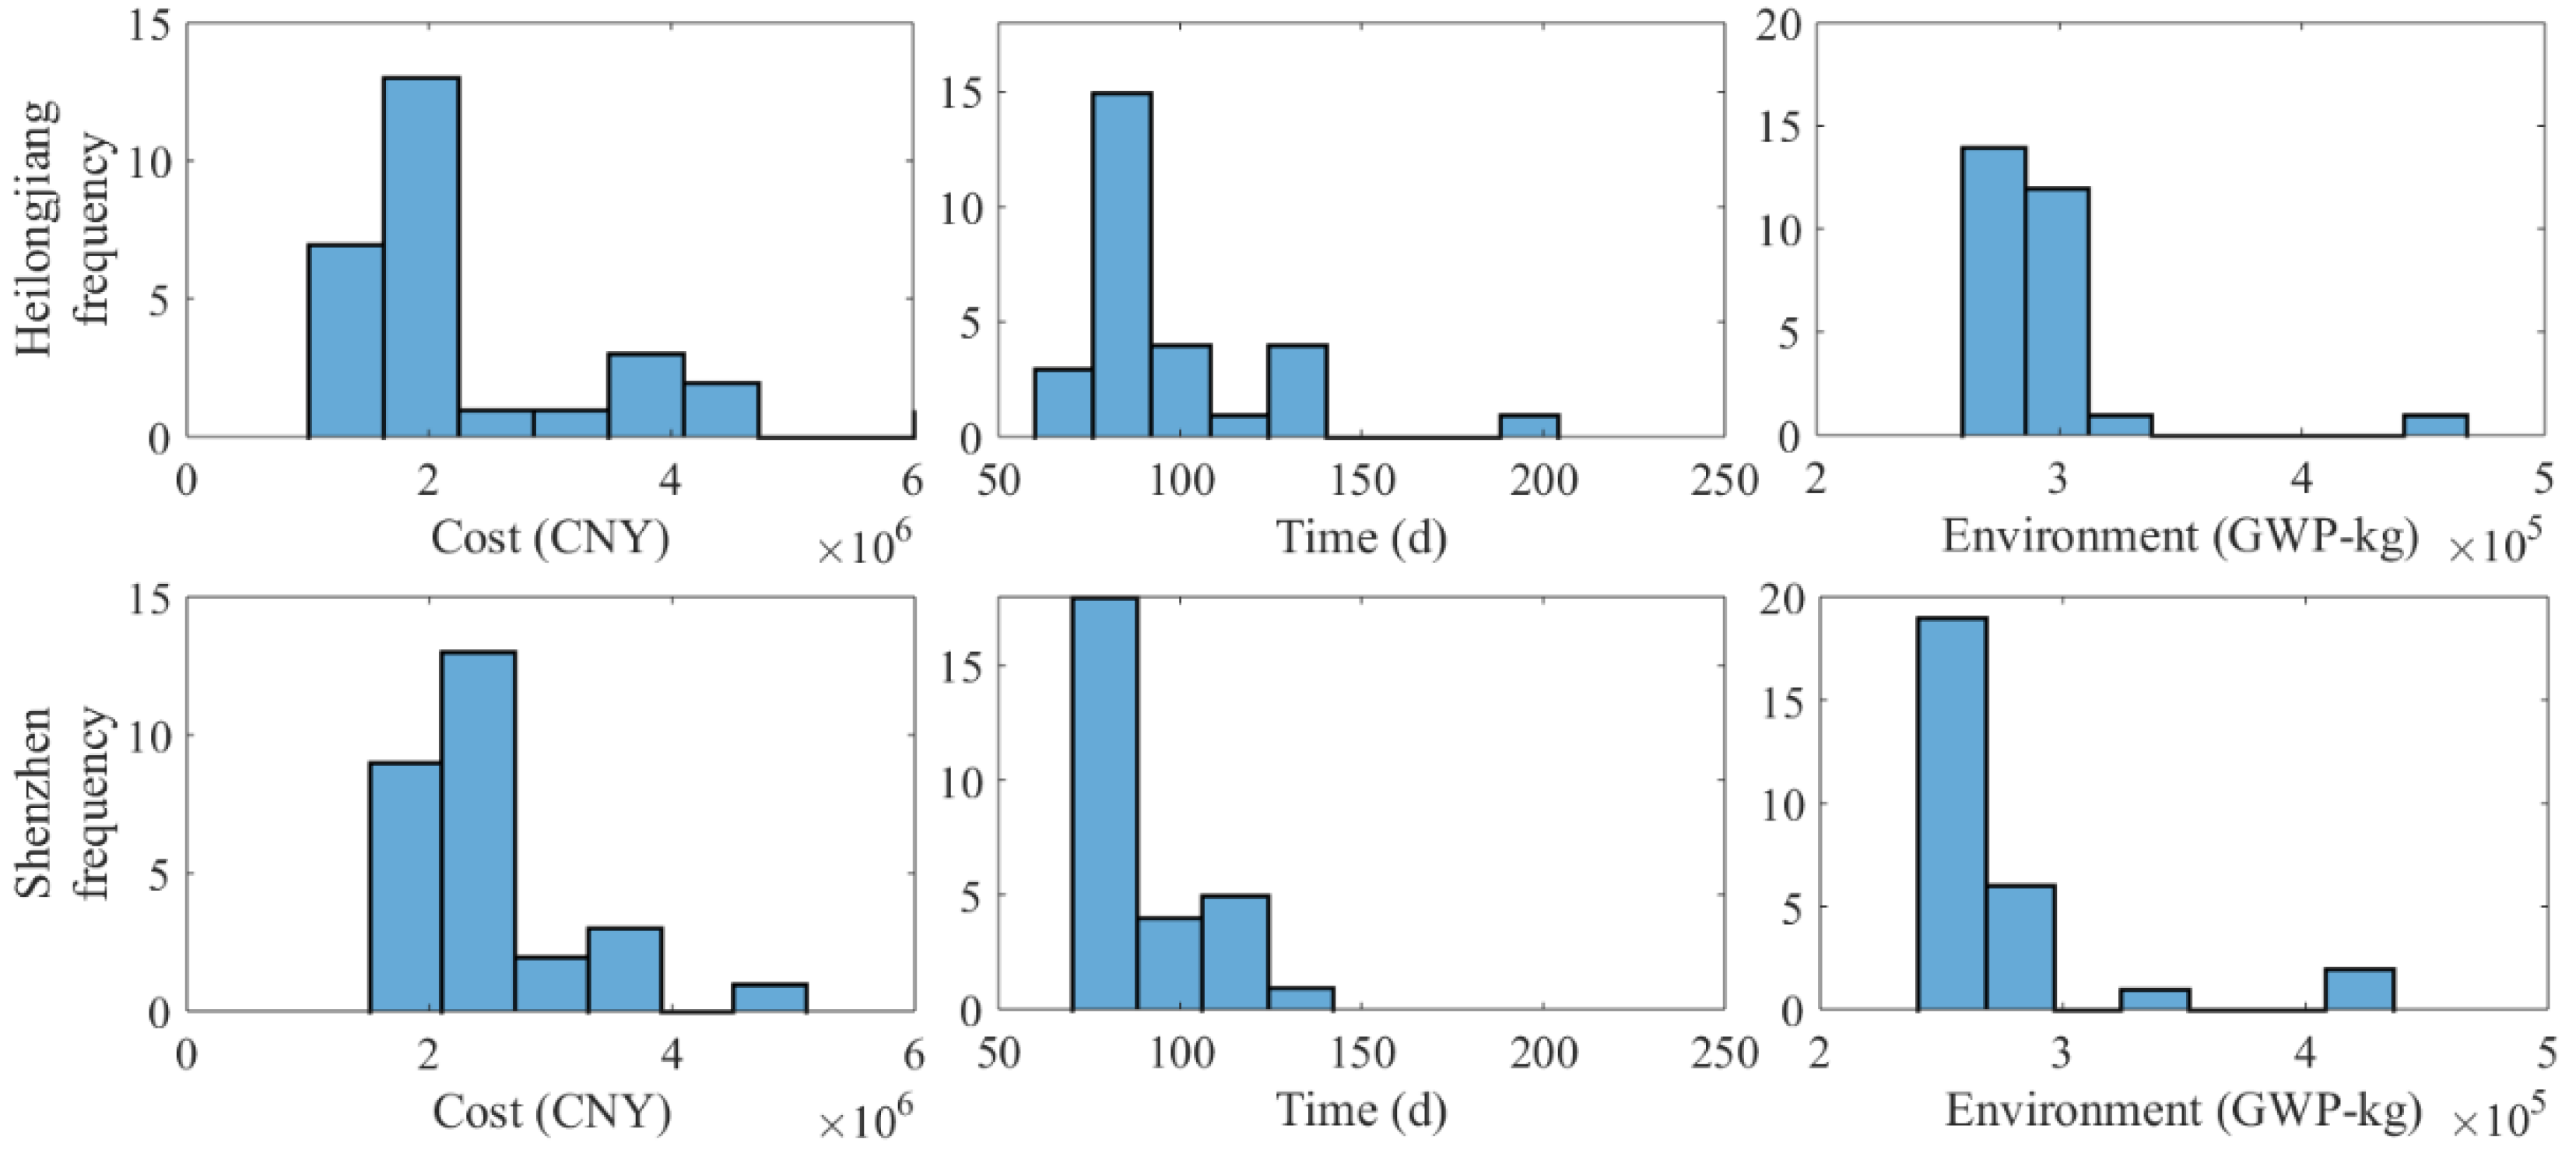
A comparison study was conducted to compare optimisation results of original construction location (Heilongjiang, North China) with an assumed location (Shenzhen, South China). The local price level and energy emission factors are different between two regions. The local cost for construction is based on Construction Engineering Quota (CEQ) of Heilongjiang [60] and Shenzhen [70], while the construction energy emissions are based on NDRC [63] of these two regions. A total of 28 Pareto plans are obtained when case building was constructed in Shenzhen. Performances are compared between these two locations with frequency distribution (see Figure 13). The final Pareto solutions of Shenzhen in average have higher construction costs than Heilongjiang, while the environmental impact is lower than Heilongjiang. According to CEQ of Heilongjiang and Shenzhen, the construction cost is higher at Shenzhen (South China) than Heilongjiang (North China), but the CO2 equivalents of electricity supply are lower in the south of China [63]. The Pareto solutions obtained by integrated method conform to these (see Figure 13).
For these two construction locations, the Pearson’s correlation is used to analyse the correlation between environment, cost, and project duration performances (see Table 5). The SPSS (Version 20) is used as statistical platform. The construction samples (100 for each) of these two locations are uniformly random generated. It shows that time and cost have high positive relations, environment and cost have negligible relations, and environment and time also have negligible correlations, based on the standards of Hinkle et al. [71]. The results indicate that it is hard to obtain a general conclusion on the correlation between the environment, with cost/time objectives. The negligible correlations between the environment and cost/time imply the possibility of environment–cost–time trade-off plans. These trade-off plans could reduce environmental impacts with limited or without cost and time compromises. The proposed integrated method is an approach to reach this possibility.
6. Conclusions
Making an environmentally friendly construction plan that simultaneously considers performances in multiple metrics is extremely difficult for the construction contractor. Many industry practitioners assume that other product performances will certainly suffer from the environmentally friendly strategy. This study proposes an innovative method that employs simulation, assessment, and optimisation integration to perform efficient environment–cost–time multi-objective optimisation, which may constitute a practical method for reducing environmental impacts with limited compromises on project cost and time performances. According to the case study, the obtained solutions not only reduce construction-related GWP impacts, but also could receive the same or even better cost and time performances. This method provides construction plans that enables contractors to take trade-offs on interested objectives, and help dispel the misgivings for further environmentally friendly applications.
This integrated method could be used in many types of applications. After adjusting the DES model and replacing assessment data sources, it could be used as a decision-making tool for contractors to plan a low-impact construction. In the construction planning stage, it can explore and identify several environment–cost–time Pareto solutions from numerous possible construction scenarios. Solutions that perform poorly on interested objectives are automatically excluded, thereby alleviating the difficulty of making multi-objective decisions. The contractor can make their final decisions based on their preferences and project characteristics. In addition to the decision-making ability on construction planning, proposed method is also a credible tool that shows the ability and responsibility of a contractor company. This method could be used for contractors to show that construction is conducted in an energy-efficient, cost-, and time-effective manner. In addition to the construction, the integration of simulation, assessment, and multi-objective optimisation could be implemented in other fields. This integration will be especially valuable for industries where several industrial objectives, many feasible options, and complex activity interactions need to be considered.
Although proposed method is an effective decision support tool of assessment and optimisation, this tool suffers from some limitations, which will be addressed in future work. The construction planning consists of auxiliary materials, equipment, and labour configuration in this case. Other planning aspects such as process logic and project schedule can be extended. Furthermore, it might be still subjective for contractors to select a preferred solution from several Pareto solutions. A further decision support after obtaining Pareto solutions can be valuable for future work.
Supplementary Materials
The following are available online at https://0-www-mdpi-com.brum.beds.ac.uk/2071-1050/10/11/4207/s1.
Author Contributions
Conceptualisation, K.F. and W.L.; Investigation, K.F. and S.C.; Methodology, K.F.; Supervision, Y.W.; Validation, W.L.; Writing—original draft, K.F.; Writing—review & editing, W.L.
Funding
This research was funded by the National Key Research and Development Program of China, grant number 2016YFC0701904, the Swedish Research Council for Environment, Agricultural Sciences and Spatial Planning (Formas), the Swedish Foundation for International Cooperation in Research and Higher Education (STINT), and the Modern Green Construction Technology and Management Research Center of Harbin Institute of Technology—China Construction Fourth Engineering Division Corp. Ltd.
Conflicts of Interest
The authors declare no conflict of interest.
References
- Hong, T.; Ji, C.; Jang, M.; Park, H. Assessment model for energy consumption and greenhouse gas emissions during building construction. J. Manag. Eng. 2013, 30, 226–235. [Google Scholar] [CrossRef]
- Cabeza, L.F.; Rincón, L.; Vilariño, V.; Pérez, G.; Castell, A. Life cycle assessment (LCA) and life cycle energy analysis (LCEA) of buildings and the building sector: A review. Renew. Sustain. Energy Rev. 2014, 29, 394–416. [Google Scholar] [CrossRef]
- Li, X.; Zhu, Y.; Zhang, Z. An LCA-based environmental impact assessment model for construction processes. Build. Environ. 2010, 45, 766–775. [Google Scholar] [CrossRef]
- Bilec, M.; Ries, R.; Matthews, H.S.; Sharrard, A.L. Example of a Hybrid Life-Cycle Assessment of Construction Processes. J. Infrastruct. Syst. 2006, 12, 207–215. [Google Scholar] [CrossRef]
- Devi, L.P.; Palaniappan, S. A study on energy use for excavation and transport of soil during building construction. J. Clean. Prod. 2017, 164, 543–556. [Google Scholar] [CrossRef]
- Wang, Y.; Feng, K.; Lu, W. An environmental assessment and optimization method for contractors. J. Clean. Prod. 2017, 142, 1877–1891. [Google Scholar] [CrossRef]
- Ding, G.K. Sustainable construction—The role of environmental assessment tools. J. Environ.Manag. 2008, 86, 451–464. [Google Scholar] [CrossRef] [PubMed] [Green Version]
- Sandanayake, M.; Zhang, G.; Setunge, S. A comparative method of air emission impact assessment for building construction activities. Environ. Impact Assess. Rev. 2018, 68, 1–9. [Google Scholar] [CrossRef]
- Davies, P.J.; Emmitt, S.; Firth, S.K. Challenges for capturing and assessing initial embodied energy: A contractor’s perspective. Constr. Manag. Econ. 2014, 32, 290–308. [Google Scholar] [CrossRef] [Green Version]
- Shi, Q.; Zuo, J.; Huang, R.; Huang, J.; Pullen, S. Identifying the critical factors for green construction—An empirical study in China. Habitat Int. 2013, 40, 1–8. [Google Scholar] [CrossRef]
- Ozcan-Deniz, G.; Zhu, Y.; Ceron, V. Time, cost, and environmental impact analysis on construction operation optimization using genetic algorithms. J. Manag. Eng. 2011, 28, 265–272. [Google Scholar] [CrossRef]
- Ozcan-Deniz, G.; Zhu, Y. Multi-objective optimization of greenhouse gas emissions in highway construction projects. Sustain. Cities Soc. 2017, 28, 162–171. [Google Scholar] [CrossRef] [Green Version]
- Cheng, M.-Y.; Tran, D.-H. Opposition-based multiple-objective differential evolution to solve the time–cost–environment impact trade-off problem in construction projects. J. Comput. Civ. Eng. 2014, 29, 04014074. [Google Scholar] [CrossRef]
- Lu, W.; Olofsson, T. Building information modeling and discrete event simulation: Towards an integrated framework. Autom. Constr. 2014, 44, 73–83. [Google Scholar] [CrossRef]
- Budgaga, W.; Malensek, M.; Pallickara, S.; Harvey, N.; Breidt, F.J.; Pallickara, S. Predictive analytics using statistical, learning, and ensemble methods to support real-time exploration of discrete event simulations. Future Gener. Comput. Syst. 2016, 56, 360–374. [Google Scholar] [CrossRef]
- Krantz, J.; Feng, K.; Larsson, J.; Olofsson, T. ‘Eco-Hauling’Principles to Reduce Carbon Emissions and the Costs of Earthmoving—A Case Study. J. Clean. Prod. 2018. [Google Scholar] [CrossRef]
- Lee, S.; Han, S.; Peña-Mora, F. Integrating construction operation and context in large-scale construction using hybrid computer simulation. J. Comput. Civ. Eng. 2009, 23, 75–83. [Google Scholar] [CrossRef]
- Li, C.Z.; Xu, X.; Shen, G.Q.; Fan, C.; Li, X.; Hong, J. A model for simulating schedule risks in prefabrication housing production: A case study of six-day cycle assembly activities in Hong Kong. J. Clean. Prod. 2018, 185, 366–381. [Google Scholar] [CrossRef]
- Alvanchi, A.; Lee, S.; AbouRizk, S.M. Dynamics of workforce skill evolution in construction projects. Can. J. Civ. Eng. 2012, 39, 1005–1017. [Google Scholar] [CrossRef]
- Larsson, J.; Lu, W.; Krantz, J.; Olofsson, T. Discrete event simulation analysis of product and process platforms: A bridge construction case study. J. Constr. Eng. Manag. 2015, 142, 04015097. [Google Scholar] [CrossRef]
- Eshtehardian, E.; Afshar, A.; Abbasnia, R. Fuzzy-based MOGA approach to stochastic time–cost trade-off problem. Autom. Constr. 2009, 18, 692–701. [Google Scholar] [CrossRef]
- Zhang, Y.; Thomas Ng, S. An ant colony system based decision support system for construction time-cost optimization. J. Civ. Eng. Manag. 2012, 18, 580–589. [Google Scholar] [CrossRef]
- El-Rayes, K.; Kandil, A. Time-cost-quality trade-off analysis for highway construction. J. Constr. Eng. Manag. 2005, 131, 477–486. [Google Scholar] [CrossRef]
- San Cristóbal, J.R. Time, cost, and quality in a road building project. J. Constr. Eng. Manag. 2009, 135, 1271–1274. [Google Scholar] [CrossRef]
- Eberhart, R.; Kennedy, J. A new optimizer using particle swarm theory. In Proceedings of the Sixth International Symposium on Micro Machine and Human Science (MHS’95), Nagoya, Japan, 4–6 October 1995; pp. 39–43. [Google Scholar]
- Ratnaweera, A.; Halgamuge, S.K.; Watson, H.C. Self-organizing hierarchical particle swarm optimizer with time-varying acceleration coefficients. IEEE Trans. Evol. Comput. 2004, 8, 240–255. [Google Scholar] [CrossRef] [Green Version]
- Elbeltagi, E.; Hegazy, T.; Grierson, D. Comparison among five evolutionary-based optimization algorithms. Adv. Eng. Inform. 2005, 19, 43–53. [Google Scholar] [CrossRef]
- Barraza, M.; Bojórquez, E.; Fernández-González, E.; Reyes-Salazar, A. Multi-objective optimization of structural steel buildings under earthquake loads using NSGA-II and PSO. KSCE J. Civ. Eng. 2017, 21, 488–500. [Google Scholar] [CrossRef]
- Kennedy, J.F.; Kennedy, J.; Eberhart, R.C.; Shi, Y. Swarm Intelligence; Morgan Kaufmann: Burlington, MA, USA, 2001. [Google Scholar]
- Pulido, G.; Coello Coello, C. Using clustering techniques to improve the performance of a multi-objective particle swarm optimizer. In Proceedings of the Genetic and Evolutionary Computation—GECCO 2004, Seattle, WA, USA, 26–30 June 2004; Springer: Berlin/Heidelberg, Germany, 2004; pp. 225–237. [Google Scholar]
- Zhang, G.; Shao, X.; Li, P.; Gao, L. An effective hybrid particle swarm optimization algorithm for multi-objective flexible job-shop scheduling problem. Comput. Ind. Eng. 2009, 56, 1309–1318. [Google Scholar] [CrossRef]
- Xue, B.; Zhang, M.; Browne, W.N. Particle swarm optimization for feature selection in classification: A multi-objective approach. IEEE Trans. Cybern. 2013, 43, 1656–1671. [Google Scholar] [CrossRef] [PubMed]
- Clerc, M.; Kennedy, J. The particle swarm-explosion, stability, and convergence in a multidimensional complex space. IEEE Trans. Evol. Comput. 2002, 6, 58–73. [Google Scholar] [CrossRef]
- Xu, J.; Feng, C. Two-stage based dynamic earth-rock transportation assignment problem under fuzzy random environment to earth-rock dam construction. J. Civ. Eng. Manag. 2015, 21, 775–797. [Google Scholar] [CrossRef]
- Li, N.; Cheung, S.C.; Li, X.; Tu, J. Multi-objective optimization of HVAC system using NSPSO and Kriging algorithms—A case study. Build. Simul. 2017, 10, 769–781. [Google Scholar] [CrossRef]
- Zhang, H.; Tam, C.; Li, H. Multimode project scheduling based on particle swarm optimization. Comput.-Aided Civ. Infrastruct. Eng. 2006, 21, 93–103. [Google Scholar] [CrossRef]
- Lu, M.; Lam, H.-C.; Dai, F. Resource-constrained critical path analysis based on discrete event simulation and particle swarm optimization. Autom. Constr. 2008, 17, 670–681. [Google Scholar] [CrossRef]
- Ashuri, B.; Tavakolan, M. Fuzzy enabled hybrid genetic algorithm–particle swarm optimization approach to solve TCRO problems in construction project planning. J. Constr. Eng. Manag. 2011, 138, 1065–1074. [Google Scholar] [CrossRef]
- Cheng, M.-Y.; Huang, K.-Y.; Hutomo, M. Multiobjective Dynamic-Guiding PSO for Optimizing Work Shift Schedules. J. Constr. Eng. Manag. 2018, 144, 04018089. [Google Scholar] [CrossRef]
- Feng, K.; Lu, W.; Olofsson, T.; Chen, S.; Yan, H.; Wang, Y. A Predictive Environmental Assessment Method for Construction Operations: Application to a Northeast China Case Study. Sustainability 2018, 10, 3868. [Google Scholar] [CrossRef]
- Fujimoto, R.M. Parallel discrete event simulation. Commun. ACM 1990, 33, 30–53. [Google Scholar] [CrossRef] [Green Version]
- Cheng, T.M.; Yan, R.Z. Integrating messy genetic algorithms and simulation to optimize resource utilization. Comput.-Aided Civ. Infrastruct. Eng. 2009, 24, 401–415. [Google Scholar] [CrossRef]
- Zhang, H.; Li, H. Simulation-based optimization for dynamic resource allocation. Autom. Constr. 2004, 13, 409–420. [Google Scholar] [CrossRef]
- Fischer, M.; Aalami, F.; Kuhne, C.; Ripberger, A. Cost-loaded production model for planning and control. In Durability of Building Materials and Components 8; Institute for Research in Construction: Ottawa, ON, Canada, 1999. [Google Scholar]
- Cheng, M.-Y.; Tran, D.-H. Integrating chaotic initialized opposition multiple-objective differential evolution and stochastic simulation to optimize ready-mixed concrete truck dispatch schedule. J. Manag. Eng. 2015, 32, 04015034. [Google Scholar] [CrossRef]
- European Committee for Standardization Brussels. EN 15804:2012+A1:2013. Sustainability of Construction Works–Environmental Product Declarations–Core rules for the Product Category of Construction Products; European Committee for Standardization Brussels: Brussels, Belgium, 2013. [Google Scholar]
- Gámez-García, D.; Gómez-Soberón, J.; Corral-Higuera, R.; Saldaña-Márquez, H.; Gómez-Soberón, M.; Arredondo-Rea, S. A cradle to handover life cycle assessment of external walls: Choice of materials and prognosis of elements. Sustainability 2018, 10, 2748. [Google Scholar] [CrossRef]
- Rocco, M.V.; Colombo, E. Internalization of human labor in embodied energy analysis: Definition and application of a novel approach based on Environmentally extended Input-Output analysis. Appl. Energy 2016, 182, 590–601. [Google Scholar] [CrossRef]
- Cole, R.J. Energy and greenhouse gas emissions associated with the construction of alternative structural systems. Build. Environ. 1998, 34, 335–348. [Google Scholar] [CrossRef]
- Pechan, E. Evaluation of Power Systems Research (PSR) Nonroad Population Data Base. Prepared for Office of Mobile Sources, US Environmental Protection Agency. Available online: http://citeseerx.ist.psu.edu/viewdoc/download?doi=10.1.1.360.4253&rep=rep1&type=pdf (accessed on 14 November 2018).
- EPA. Median Life, Annual Activity and Load Factor Values for Non-Road Engine Emissions Modeling; Report No. NR-005d; US Environmental Protection Agency: Washington, DC, USA, 2010. [Google Scholar]
- Department of Housing and Urban Rural Construction Heilongjiang. Explanation of Construction Cost, Supplement Quota and Related Questions of Construction Project of Heilongjiang Province in 2010; Heilongjiang Science and Technology Press: Harbin, China, 2012. (In Chinese) [Google Scholar]
- Salman, A.; Ahmad, I.; Al-Madani, S. Particle swarm optimization for task assignment problem. Microprocess. Microsyst. 2002, 26, 363–371. [Google Scholar] [CrossRef]
- Bratton, D.; Kennedy, J. Defining a standard for particle swarm optimization. In Proceedings of the Swarm Intelligence Symposium (SIS 2007), Honolulu, HI, USA, 1–5 April 2007; pp. 120–127. [Google Scholar]
- Shi, Y.; Eberhart, R. A modified particle swarm optimizer. In Proceedings of the 1998 IEEE International Conference on Evolutionary Computation Proceedings, IEEE World Congress on Computational Intelligence, Anchorage, AK, USA, 4–9 May 1998; pp. 69–73. [Google Scholar]
- Tuppadung, Y.; Kurutach, W. Comparing nonlinear inertia weights and constriction factors in particle swarm optimization. Int. J. Knowl.-Based Intell. Eng. Syst. 2011, 15, 65–70. [Google Scholar] [CrossRef]
- Chatterjee, A.; Siarry, P. Nonlinear inertia weight variation for dynamic adaptation in particle swarm optimization. Comput. Oper. Res. 2006, 33, 859–871. [Google Scholar] [CrossRef]
- Sengupta, S.; Basak, S.; Peters, R. Particle Swarm Optimization: A survey of historical and recent developments with hybridization perspectives. Mach. Learn. Knowl. Extr. 2018, 1, 157–191. [Google Scholar] [CrossRef]
- Dehghanimohammadabadi, M.; Keyser, T.K. Intelligent simulation: Integration of SIMIO and MATLAB to deploy decision support systems to simulation environment. Simul. Modell. Pract. Theory 2017, 71, 45–60. [Google Scholar] [CrossRef]
- Housing and Urban-Rural Development of Heilongjiang. Construction Engineering Quota of Heilongjiang (2010); Harbin Publishing House: Harbin, China, 2010. (In Chinese) [Google Scholar]
- Zhang, H. Discrete-event simulation for estimating emissions from construction processes. J. Manag. Eng. 2013, 31, 04014034. [Google Scholar] [CrossRef]
- MOHURD. Construction Equipment Engineering Quota of China (2012); MOHURD: Beijing, China, 2012. [Google Scholar]
- NDRC. Provincial Greenhouse Gas Inventory Guidelines; NDRC: Beijing, China, 2011. (In Chinese) [Google Scholar]
- EMSD. Guidelines to Account for and Report on Greenhouse Gas Emissions and Removals for Buildings (Commercial, Residential or Institutional Purposes); Electrical and Mechanical Services Department and Environmental Protection Department: Hong Kong, China, 2010. [Google Scholar]
- IPCC. The Fourth Assessment Report of the Intergovernmental Panel on Climate Change; IPCC: Geneva, Switzerland, 2007. [Google Scholar]
- Yan, P.; Yang, J. Quantitative assessment of the embodied environmental impact of wood products. J. Tsinghua Univ. (Sci. Technol.) 2008, 48, 15–18. (In Chinese) [Google Scholar]
- Gong, Z.; Zhang, Z. Quantitative assessment of the embodied environmental profile of building materials. J. Tsinghua Univ. (Sci. Technol.) 2004, 44, 1209–1213. (In Chinese) [Google Scholar]
- Seppälä, J.; Koskela, S.; Melanen, M.; Palperi, M. The Finnish metals industry and the environment. Resour. Conserv. Recycl. 2002, 35, 61–76. [Google Scholar] [CrossRef]
- Zitzler, E.; Thiele, L.; Laumanns, M.; Fonseca, C.M.; Da Fonseca, V.G. Performance assessment of multiobjective optimizers: An analysis and review. IEEE Trans. Evol. Comput. 2003, 7, 117–132. [Google Scholar] [CrossRef]
- Construction Engineering Cost Management Station Shenzhen. Construction Engineering Quota of Shenzhen; China Building Industry Press: Shenzhen, China, 2016. (In Chinese) [Google Scholar]
- Hinkle, D.E.; Wiersma, W.; Jurs, S.G. Applied Statistics for the Behavioral Sciences, 5th ed.; Houghton Mifflin: Boston, MA, USA, 2002. [Google Scholar]
Figure 1.
Integrated environment–cost–time optimisation method.

Figure 2.
Simulation model production and scenario simulation (1 and 6 indicate the inputs from steps 1 or 6, and the same hereafter).
Figure 2.
Simulation model production and scenario simulation (1 and 6 indicate the inputs from steps 1 or 6, and the same hereafter).

Figure 3.
Simulation and environmental database for performance assessment.

Figure 4.
Global and local best updating and stop criteria.

Figure 5.
Particle swarm optimisation (PSO) solution searching.

Figure 6.
Construction process logic for frame structure.

Figure 7.
Hypervolume example for 2-objective Pareto fronts.

Figure 8.
Parameters selection of PSO-based optimisation.

Figure 9.
Multi-objective performances and Pareto solutions at integration iteration. (Values are normalised as x’ = (x − min)/(max − min) × 100%).
Figure 9.
Multi-objective performances and Pareto solutions at integration iteration. (Values are normalised as x’ = (x − min)/(max − min) × 100%).

Figure 10.
Pareto construction plans by environment–time–cost and the time–cost optimisation, (a) full scale, (b) trade-off plan scale.
Figure 10.
Pareto construction plans by environment–time–cost and the time–cost optimisation, (a) full scale, (b) trade-off plan scale.


Figure 11.
Impact sources of original and environment best plan.

Figure 12.
Pareto multi-objective comparison between environment–time–cost (E.–TC.) and time–cost (T.–C.) optimisation (red diamond indicates average value).
Figure 12.
Pareto multi-objective comparison between environment–time–cost (E.–TC.) and time–cost (T.–C.) optimisation (red diamond indicates average value).

Figure 13.
Performance frequency distribution of Pareto solutions at the compared locations.


Table 1.
Frame structure construction tasks and related resources.
| Task Name | Resource | Quantity (Set for eq.) |
|---|---|---|
| C-off-site Transportation | mixer truck (7 m3) diesel (30 km) | 5 |
| C-pumping | concrete pump (80 kW) (HBT8018C-5)—electricity | 1 |
| C-vibration | vibrating screen (1.1 kW)—electricity | 20 |
| concrete crew | 20 | |
| S-off-site transportation | trailer (25 t)—electricity (183 km) | 5 |
| S-straightening | steel bar straightener (φ14)—electricity | 3 |
| S-curving | steel bar bender (φ40)—electricity | 8 |
| S-cutting-steel | steel bar cutter (φ40)—electricity | 3 (for HPB) |
| 6 (for HRB) | ||
| S-threading | die head threading machine (φ39)—electricity | 5 |
| S-on-site hoist | construction lift (SCD200/200 V)—electricity | 1 * |
| crane tower (ST60/15)—electricity | 1 * | |
| S-installation | steel crew | 60 |
| F-off-site transportation | formwork truck (15 t)—diesel | 1 |
| F-cutting | wood circular saw (φ500)—electricity | 4 |
| F-hoist | construction lift (SCD200/200 V)—electricity | 1 * |
| crane tower (ST60/15)—electricity | 1 * | |
| F-installation | formwork crew | 50 persons |
| plywood | 64.4 t | |
| steel tube | 6758.46 kg | |
| joint | 1695.57 kg | |
| bolt | 4959.22 kg | |
| iron wire φ 0.7 mm | 10,646.57 kg | |
| batten | 149.46 m3 |
Note: C-, S-, and F- denote concrete, steel, and formwork task, respectively; eq. stands for equipment; * means the both construction lift and crane tower can handle S-On-site and F-On-site Transportation jobs.
Table 2.
Alternative construction plans.
| (n, x) | Construction Task | Alternative Plan | Remarks |
|---|---|---|---|
| (1,1) | C-off-site transportation | mixer truck (8 m3) | 247 hp |
| (1,2) | mixer truck (7 m3) | 180 hp | |
| (1,3) | mixer truck (6 m3) | 180 hp | |
| (1,4) | mixer truck (5 m3) | 103 hp | |
| (2,1) | C-pumping | concrete pumper (80 kW) | 1 × 10⁴/(7.5 + H) m3/h |
| (2,2) | concrete pumper (60 kW) | 0.8 × 10⁴/(10 + H) m3/h | |
| (2,3) | concrete pumper (45 kW) | 0.8 × 10⁴/(20 + H) m3/h | |
| (2,4) | concrete pumper (30 kW) | 0.4 × 10⁴/(20 + H) m3/h [60] | |
| (3,1) | C-pumping | number of pumper 1 | |
| (3,2) | number of pumper 2 | ||
| (3,3) | number of pumper 3 | ||
| (4,1~4,80) | S-installation | size of crew 1~80 | restricted by work space |
| (5,1) | S-on-site/F-on-site transportation | crane ST60/15 | 41/4/8 kW, 45 m/min, 1.5 t |
| (5,2) | crane XGT8039-25 | 90/26.1/15 kW, 37.6 m/min, 8 t | |
| (5,3) | crane XGT8040-25 | 110/27/15 kW, 48.4 m/min, 7.6 t | |
| (6,1) | S-on-site/F-on-site transportation | construction lift SCD200-200V | 56 kW, 60 m/min, 4 t or 25 persons |
| (6,2) | construction lift SCD200-200E | 66 kW, 36 m/min, 4 t or 20 persons | |
| (6,3) | construction lift SCD200-200P | 60 kW, 23 m/min, 4 t or 20 persons | |
| (7,1~7,60) | F-installation | size of crew 1~60 | restricted by work space |
| (8,1) | F-installation | timber formwork system (TFS) | see Table 1 |
| (8,2) | steel formwork system (SFS) | steel plate and tube 11.739 t | |
| joint 2295.40 kg | |||
| bolt 8327.62 kg | |||
| iron wire 6047.71 kg | |||
| batten 121.46 m3 | |||
| (9,1) | F-installation | iron wire φ 0.7 mm | 10,646.57 kg |
| (9,2) | annealed iron wire φ 1.2 mm | 31,305.15 kg | |
| (10,x) | working schedule | working hours (8~10 h) | 1.5-fold overtime fees for labour working over 8 hr; additional light (6×3.5 kW) when time over 6mp. |
Note: X = {(1,1) (2,1) (3,1) (4,60) (5,1) (6,1) (7,50) (8,1) (9,1) (10,8)} is the original plan.
Table 3.
Price data for case construction.
| Sources | Unit | Unit Price | Sources | Unit | Unit Price |
|---|---|---|---|---|---|
| labour | CNY/h | 53 (North China); 100 (South China) | crane XGT8039-25 | CNY/d | 4335.66 |
| formwork cutter | CNY/d | 110.37 | crane XGT8040-25 | CNY/d | 4335.66 |
| steel straighter | CNY/d | 132.54 | lift SCD200-200V | CNY/d | 1094.64 |
| steel cutter | CNY/d | 161.4 | lift SCD200-200E | CNY/d | 1094.64 |
| steel bender | CNY/d | 89.07 | lift SCD200-200P | CNY/d | 1094.64 |
| steel threading | CNY/d | 128.79 | plywood | CNY/t | 2050 |
| vibrator | CNY/d | 131.4 | steel tube | CNY/kg | 5 |
| concrete pumper (80 kW) | CNY/h | 2060.13 | joint | CNY/kg | 5 |
| concrete pumper (60 kW) | CNY/h | 1573.66 | bolt | CNY/kg | 5 |
| concrete pumper (45 kW) | CNY/h | 1043.65 | iron wire | CNY/kg | 5 |
| concrete pumper (30 kW) | CNY/h | 716.03 | batten | CNY/m3 | 6.61 |
| crane ST60/15 | CNY/d | 480 | annealed iron wire | CNY/kg | 6.362 |
Table 4.
Global warming potential data source.
| Impact Sources | Unit | CO2 Equivalents * | Reference |
|---|---|---|---|
| electricity | kWh | 1.096 (North China); 0.714 (South China); | [63] |
| diesel | kg | 2.617 | [64,65] |
| plywood | kg | 1.049 | [66] |
| steel tube | kg | 3.589 | [67] |
| joint | kg | 3.589 | [67] |
| bolt | kg | 3.589 | [67] |
| iron wire | kg | 7.442 | [67] |
| batten | kg | 1.049 | [66] |
| annealed iron wire | kg | 6.362 | [68] |
Note: * the value is calculated by emission factors and characterisation factors, such as diesel: 2.614 (CO2) + 0.0239 × 21/1000 (CH4) + 0.0074 × 310/1000 (N2O).
Table 5.
Correlation among environment–cost–time performances (Pearson’s r).
| Location | Environment | Cost | Time | |
|---|---|---|---|---|
| Heilongjiang | Environment | 1 | ||
| Cost | 0.00 | 1 | ||
| Time | 0.22 | 0.66 | 1 | |
| Shenzhen | Environment | 1 | ||
| Cost | 0.10 | 1 | ||
| Time | 0.05 | 0.91 | 1 |
© 2018 by the authors. Licensee MDPI, Basel, Switzerland. This article is an open access article distributed under the terms and conditions of the Creative Commons Attribution (CC BY) license (http://creativecommons.org/licenses/by/4.0/).
Share and Cite
MDPI and ACS Style
Feng, K.; Lu, W.; Chen, S.; Wang, Y. An Integrated Environment–Cost–Time Optimisation Method for Construction Contractors Considering Global Warming. Sustainability 2018, 10, 4207. https://0-doi-org.brum.beds.ac.uk/10.3390/su10114207
AMA Style
Feng K, Lu W, Chen S, Wang Y. An Integrated Environment–Cost–Time Optimisation Method for Construction Contractors Considering Global Warming. Sustainability. 2018; 10(11):4207. https://0-doi-org.brum.beds.ac.uk/10.3390/su10114207
Chicago/Turabian StyleFeng, Kailun, Weizhuo Lu, Shiwei Chen, and Yaowu Wang. 2018. "An Integrated Environment–Cost–Time Optimisation Method for Construction Contractors Considering Global Warming" Sustainability 10, no. 11: 4207. https://0-doi-org.brum.beds.ac.uk/10.3390/su10114207
Note that from the first issue of 2016, this journal uses article numbers instead of page numbers. See further details here.