Assessment of Soil Liquefaction Potential in Kamra, Pakistan


1
State Key Laboratory of Coastal and Offshore Engineering, Dalian University of Technology, Dalian 116024, China
2
Department of Civil Engineering, University of Engineering and Technology Peshawar (Bannu Campus), Bannu 28100, Pakistan
3
China–Pakistan Economic Corridor Project, LIMAK-JV-ZKB, Pindigheb, Attock 43260, Pakistan
4
Department of Civil Engineering, King Fahd University of Petroleum and Minerals, Dhahran 31261, Saudi Arabia
*
Author to whom correspondence should be addressed.
Sustainability 2018, 10(11), 4223; https://0-doi-org.brum.beds.ac.uk/10.3390/su10114223
Submission received: 22 September 2018
/
Revised: 4 November 2018
/
Accepted: 13 November 2018
/
Published: 15 November 2018
Abstract
:In seismically active regions, soil liquefaction is a serious geotechnical engineering problem that mainly occurs in saturated granular soils with a shallow groundwater table. Significant seismic hazards are present in Kamra, Pakistan. With the rapid increase in construction in recent years, the evaluation of liquefaction is now considered to be more important for land use planning and development. The intent of this study is to highlight soil liquefaction susceptibility that will eventually support the national authorities in developing guidelines for sustainable development and the mitigation of liquefaction. The typical subsoil profile of Kamra consists of silty gravel (GM) overlain by silty sand (SM), poorly graded sand (SP), and fill layers. Kamra is close to the active Ranja–Khairabad fault with a peak ground acceleration of 0.24g. The river Sehat and the Ghazi Brotha canal pass through the study area. In this study, the soil liquefaction potential in Kamra was assessed at 10 different sites (50 boreholes) by using a stress-based procedure for calculating the factor of safety against soil liquefaction. The results revealed that the middle layers, i.e., poorly graded sand and silty sand in the subsoil profile, are extremely susceptible to liquefaction during earthquakes with magnitudes between 7.5 and 8.0 in Kamra. The correlation between the factor of safety and the equivalent clean-sand-corrected standard penetration test (SPT) blow counts according to the earthquake magnitudes was developed and can also be utilized for areas adjoining Kamra that have the same subsoil profile.
1. Introduction
During numerous earthquakes, soil liquefaction and associated hazards, i.e., lateral spread, ground cracking, ground settlement, or sand boils, have been widely observed. In seismic events, owing to the rapid loading of soil, the pore water pressure has insufficient time to dissipate through natural drainage, resulting in soil liquefaction. The increased pore water pressure due to rapid loading transfers the granular soils, i.e., poorly graded sand and silty sand, from a solid to a liquefied state, which eventually decreases the shear strength and stiffness of the soil deposit. Soil liquefaction has been observed for several decades but was brought to the notice of engineers after substantial damage from earthquakes in Niigata, Japan (1964) and Alaska, United States (1964), which had magnitudes of 7.5 and 9.2 on the Richter scale, respectively. It was observed from these investigations that, most commonly, soil liquefaction was primarily coupled with saturated poorly graded sand and low-plasticity silty sand [1].
Seismic parameters, field conditions, and soil parameters are collectively utilized for evaluating the soil liquefaction potential. Regarding seismic parameters, the greater the magnitude of the earthquake, the closer the epicenter is located, the longer the duration, and the higher the value of peak ground acceleration (PGA), the higher the resulting probability of liquefaction. For soil parameters, with different fines content (FC), soil liquefaction strength may also vary, and soil liquefaction strength decreases when the fines content increases up to 30%; however, when the fines content is more than 50%, the soil liquefaction strength decreases and the soil is then hardly liquefied [2]. In addition, the type of soil class consequently changes with the fines content. In Table 1, the Wang Chinese [3], Andrews and Martin [4], Seed et al. [5], and Bray and Sancio [6] criteria of soil liquefaction susceptibility are presented in detail. Pathak et al. [7] stated that the Bray and Sancio [6] proposed criteria of soil liquefaction susceptibility have a maximum success rate of 58% compared with Wang Chinese [3], Andrews and Martin [4], and Seed et al. [5] criteria for liquefaction cases.
There is less potential for soil liquefaction with larger average particle sizes (D50) because it is difficult to accumulate soil excess pore water pressure in the larger gaps of these particles which record higher values of standard penetration test (SPT) blow counts [2]. Numerous experiments on sand samples of variable grain sizes in well-graded and gap-graded distributions showed the greatest and least resistance to soil liquefaction against monotonic loading, respectively [8]. In field conditions, if a soil deposit is located at a greater depth, then the vertical effective stress value is greater. Consequently, it is very difficult for pore water pressure to overcome the vertical stress, so there is less susceptibility for liquefaction. In the engineering literature, there seems to be little or no consideration or documented observations of seismic liquefaction beyond depths of 30 m. Florin and Ivanov [9] concluded that liquefaction, even from very loose sand, is virtually impossible for an overburden in excess of 15 m. In addition, a shallow groundwater table (GWT) and thin soil layer can partly decrease the probability of soil liquefaction [2]. A preliminary assessment of the seismic liquefaction potential of a soil in a seismically active region can be made using the following indices which are characteristics of liquefiable soils [1]:
- ▪
- Mean grain size, D50 = 0.02–1.0 mm
- ▪
- Coefficient of uniformity < 10
- ▪
- Plastic index, PI < 10
- ▪
- Intensity of an earthquake > VI
- ▪
- Depth of soil deposit < 15 m
- ▪
- Relative density < 75%.
Structures resting on liquefied soils can experience catastrophic damage if proper geotechnical studies and designs are not considered. When a city or any development is located in a seismically active region and the soil deposit is susceptible to liquefaction, a thorough geotechnical study should be planned and conducted. Design or remedial measures, either geotechnical or structural, should be implemented to ensure sustainability and resiliency to achieve the “Make cities safe, resilient, and sustainable” goal.
To evaluate soil liquefaction potential, practicing engineers use three approaches: (1) energy-based, (2) stress-based, and (3) strain-based approaches. Empirical and semiempirical methods according to the stress-based approach are more popular among practicing engineers. The stress-based “simplified procedure” for soil liquefaction potential assessment was initiated by Seed and Idriss in 1971 [10]. The simplified procedure has been modified and updated periodically, primarily by Shibata (1981), Tokimatsu and Yoshimi (1983), Seed et al. (1985), the National Research Council (1985), Robertson and Wride (1998), Youd et al. (2001), Cetin et al. (2004), and Idriss and Boulanger (2004, 2008) [11,12,13,14,15,16,17,18,19]. To assess the liquefaction potential, the simplified procedure [20], as adopted by various researchers, compares the seismic-induced cyclic stress ratios (CSR) of the soil with the cyclic resistance ratios (CRR). In this study, the stress-based procedure developed by Youd et al. [16] was used to determine the factor of safety (FS) against liquefaction of soils in Kamra, Pakistan. Youd et al.’s [16] method was developed by Professors T. L. Youd and I. M. Idriss along with 20 experts in a workshop sponsored by the National Center for Earthquake Engineering Research (NCEER) in 1996.
Investigations in the study area consisted of two stages: laboratory testing for site characterization and preliminary screening of susceptible soils followed by SPT-based field investigation for soil liquefaction evaluation. The SPT was carried out at 10 different sites (50 boreholes) across the study area to ascertain the subsoil properties in order to develop a subsoil profile. Tectonic and seismic zoning maps of the study area were modified from a geological survey of Pakistan (2006) and data from the National Engineering Services of Pakistan (2010), respectively. The soil liquefaction potential in the study area, which has a peak ground acceleration of 0.24g and earthquake magnitudes between 6.5 and 8.0, was estimated for when the groundwater table rises from 3.3 to 1.2 m depth during an earthquake. The correlation between factor of safety and the equivalent clean-sand-corrected SPT blow counts according to the earthquake magnitudes was developed and can also be utilized for areas adjoining Kamra that have the same subsoil profile.
The paper is organized into seven sections. Liquefaction’s effect on sustainable urban areas and the relevant mitigation measures are presented in Section 2. Section 3 describes the geology and seismic tectonic setting of the study area, Kamra. Section 4 illustrates the geotechnical site characterization. Section 5 discusses the evaluation procedure of seismic soil liquefaction. Section 6 presents the main results and discussion. Finally, Section 7 presents the conclusions and a discussion of future work.
2. Liquefaction—Effects on Sustainable Urban Areas and Mitigation Measures
The loss of shear strength due to liquefaction occurs because of the seismically induced pore water pressure in saturated loose sandy soils. Consequently, any structure resting on such soil experiences catastrophic damage if proper geotechnical studies and designs are not considered. When a city or any development is located in a seismically active region and the soil deposit is susceptible to liquefaction, a thorough geotechnical study should be planned and conducted. Design or remedial measures, either geotechnical or structural, should be implemented for the associated cases to avoid instability and to ensure sustainability and resiliency. Liquefaction may damage buildings and structures in addition to underground facilities and lifelines. The latter might sometimes be more destructive if gas pipelines are involved in the underground lifelines of the city. Therefore, prior to any decision on development, a comprehensive geotechnical investigation and design of liquefaction is essential. During the initial site investigation, the engineer should determine the seismic liquefaction potential. Seismic soil-liquefaction-induced hazards may be mitigated by the implementation of containment structures, removal or treatment of liquefiable soils, modification of site geometry, or drainage to lower the groundwater table. Implementation of mitigation measures should be designed by the national authorities to provide guidelines to either eliminate all liquefaction potential or to allow partial improvement of the soils.
3. Geology and Seismic Tectonic Setting
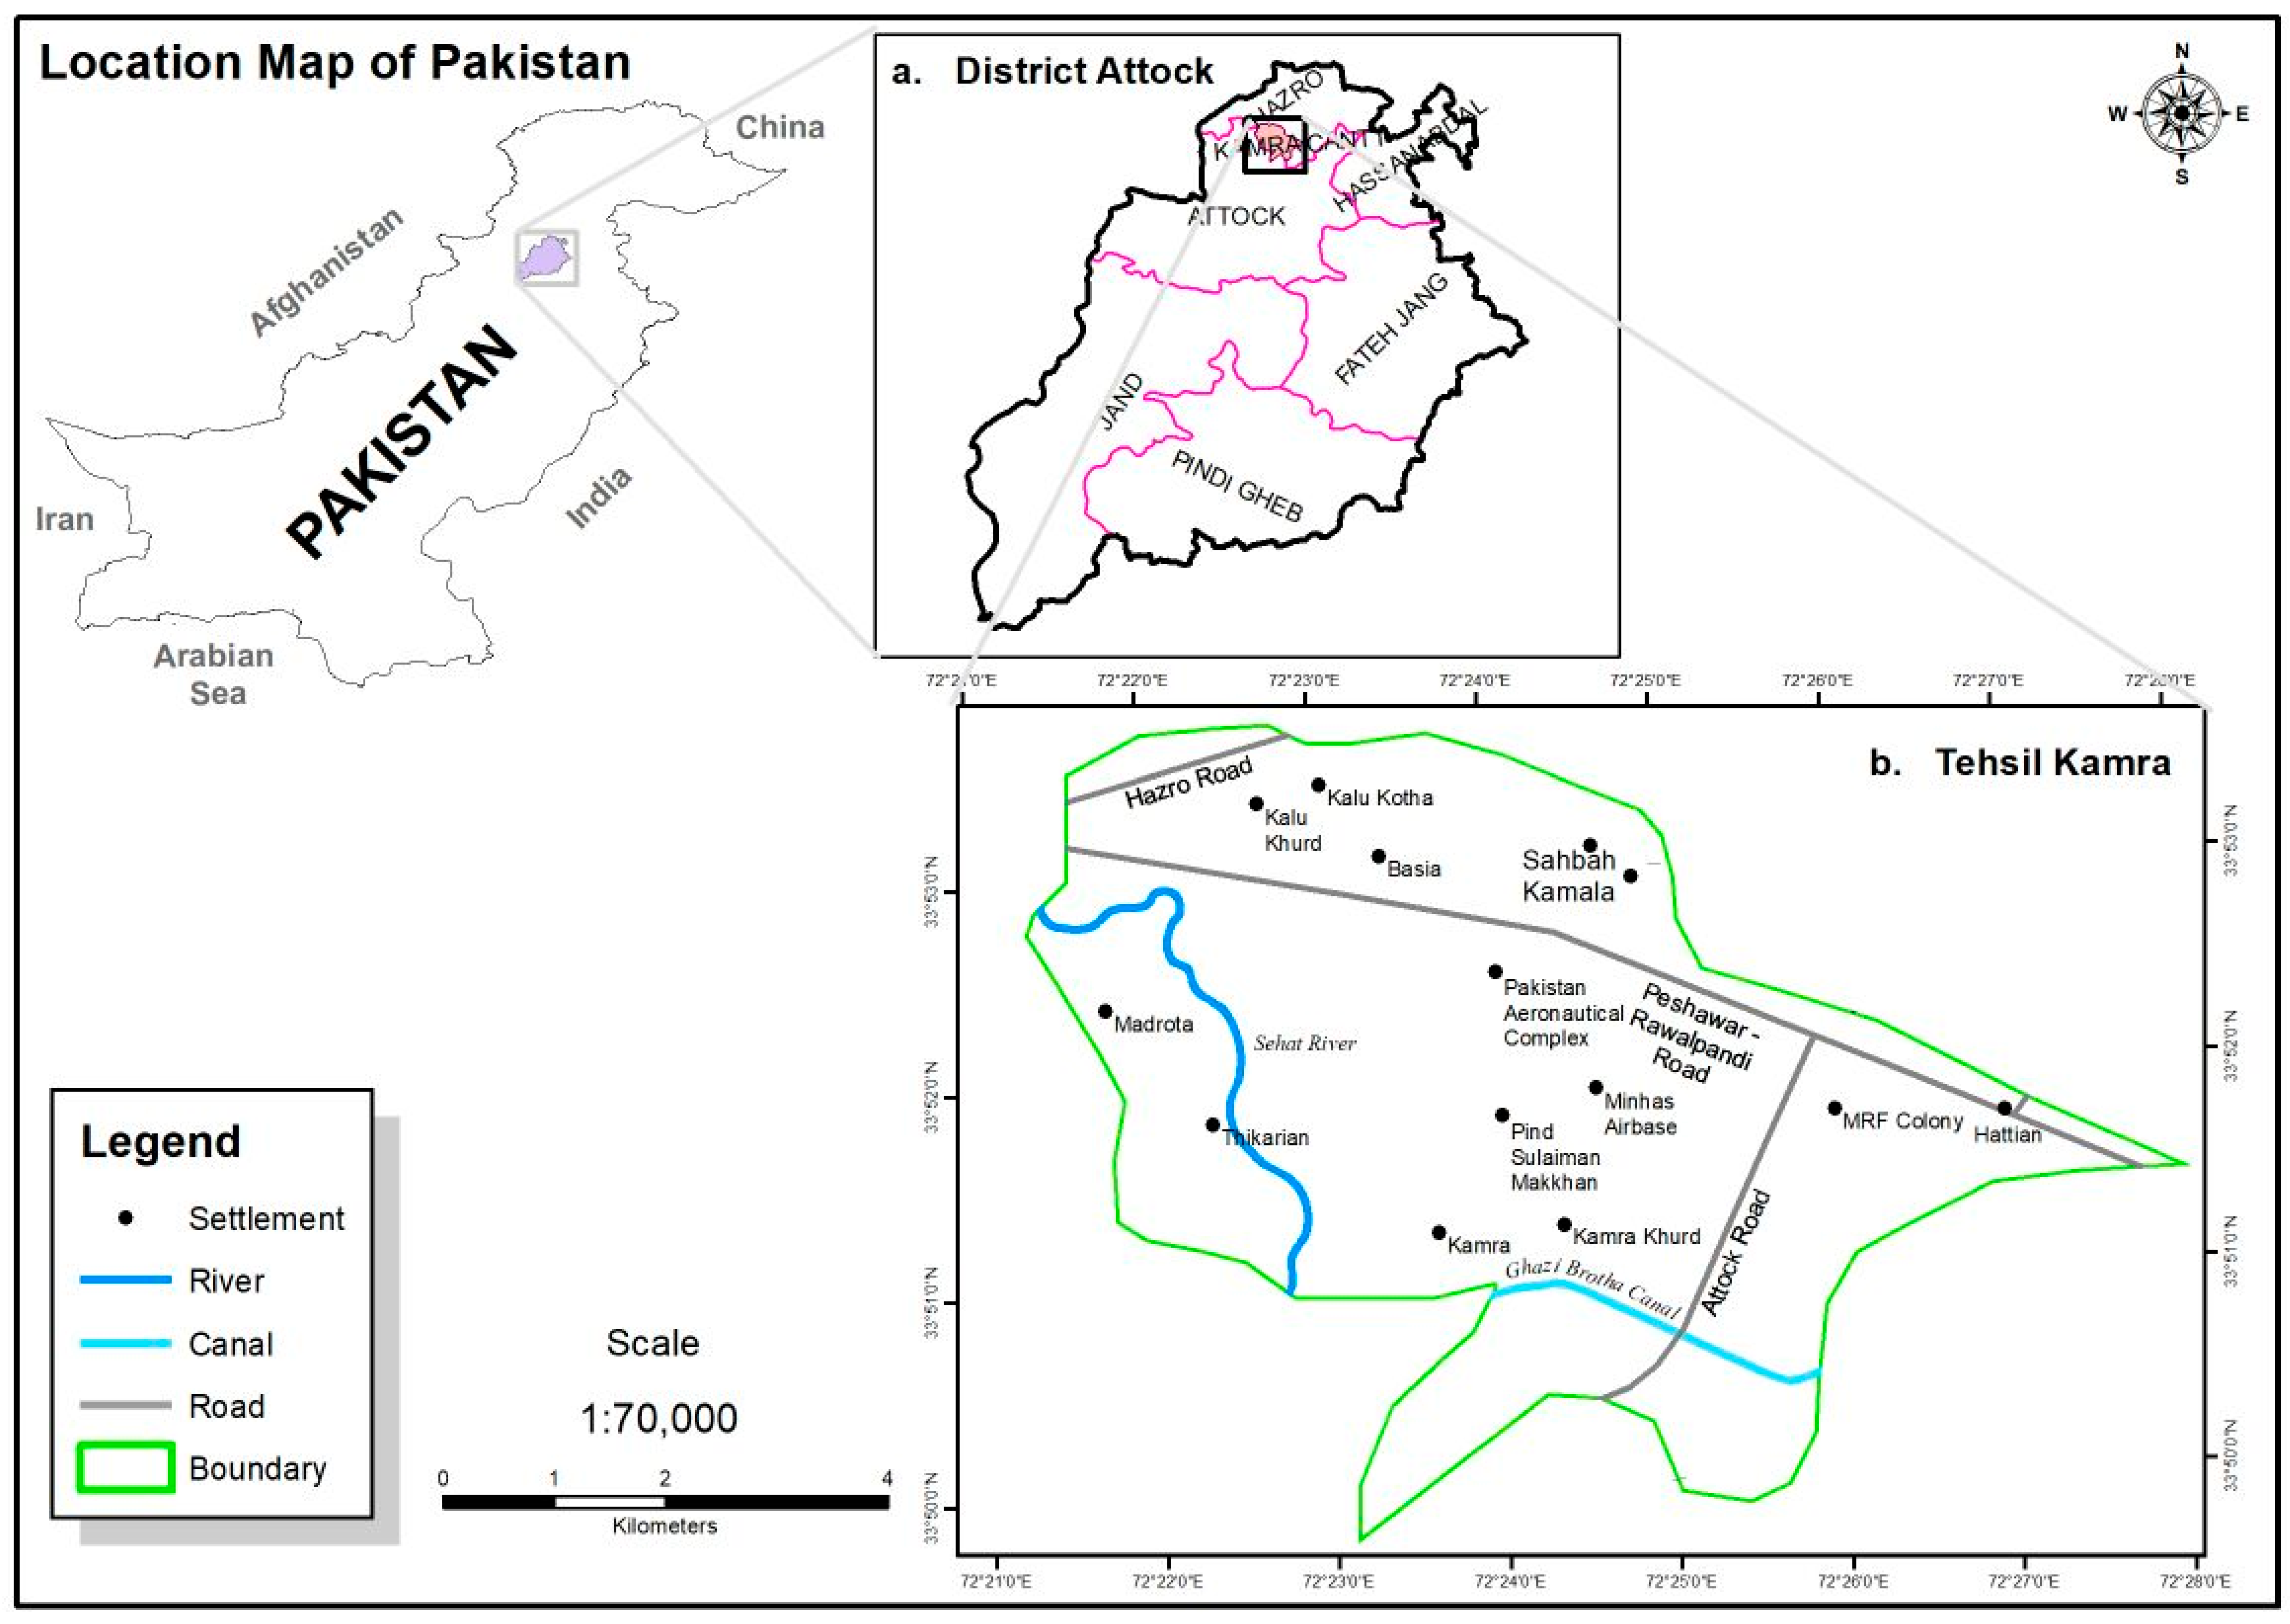
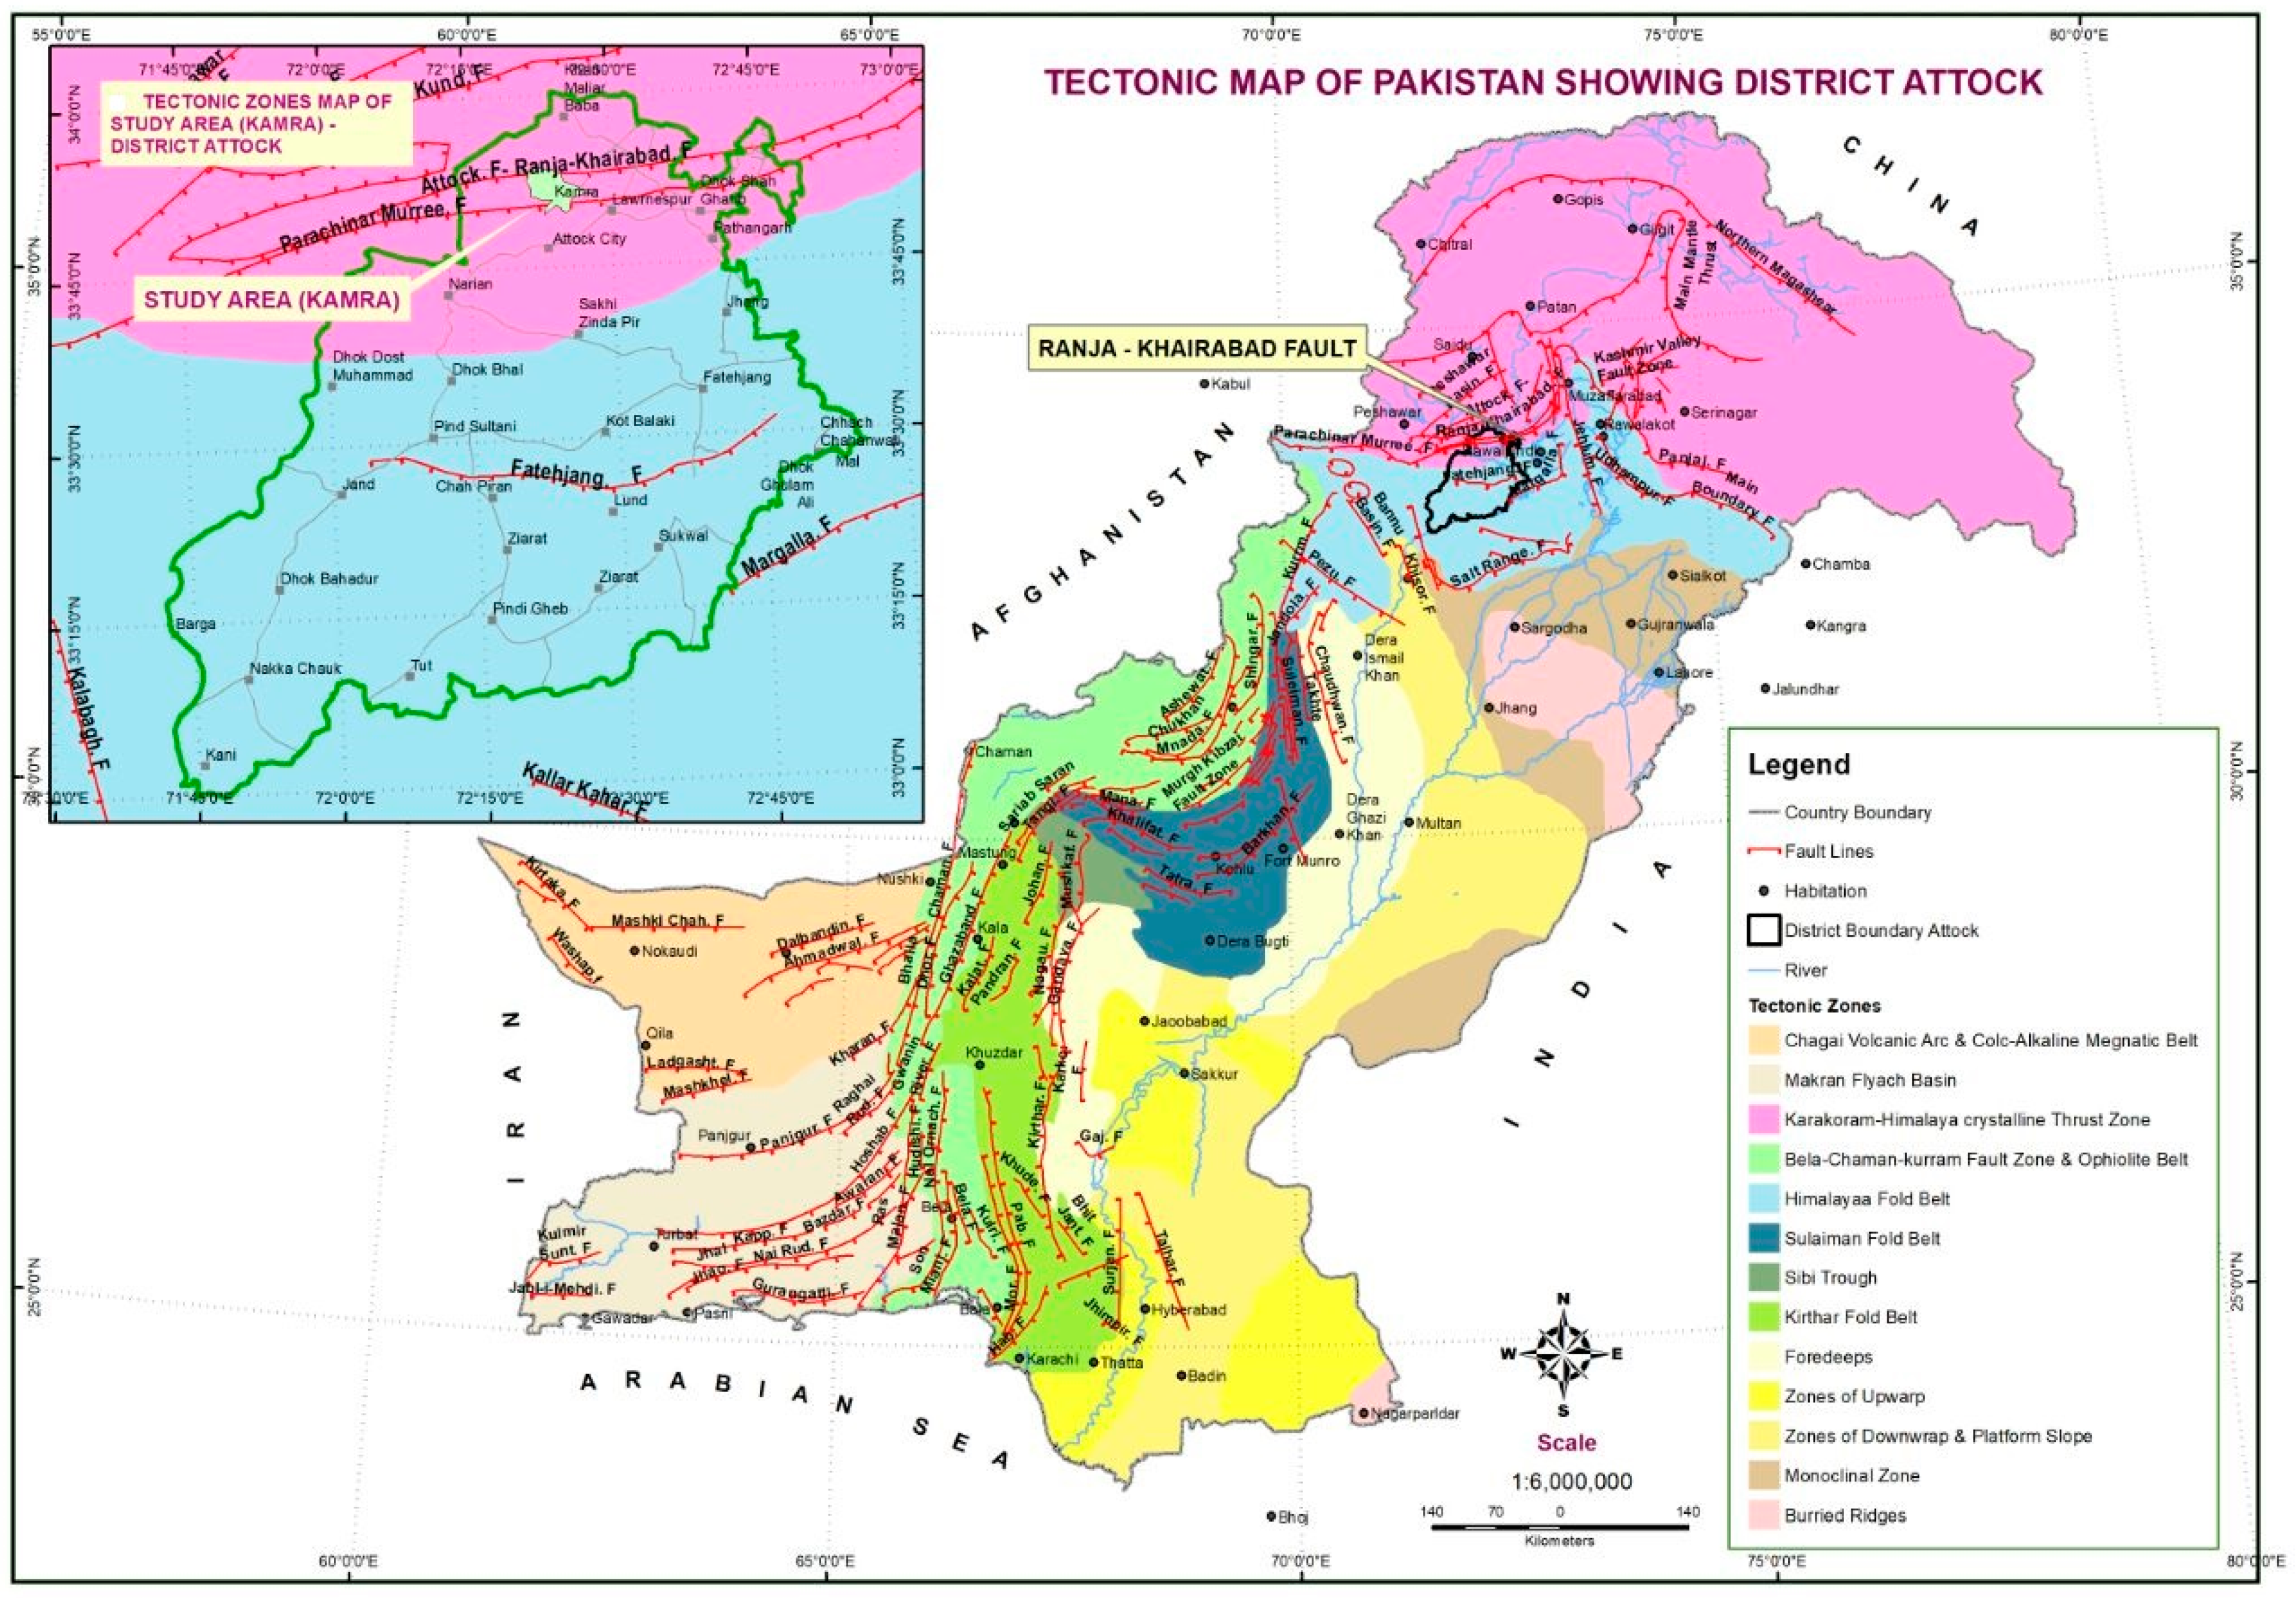
Kamra is located in the mountainous north of Punjab province, Pakistan, at 33°45′0″ N latitude and 73°31′0″ E longitude [21]. Air Weapon Complex (AWC) and Pakistan Aeronautical Complex (PAC) are the military corporations located in Kamra, which is the aviation city of Pakistan. Figure 1a shows the location map of the Attock district and Figure 1b shows the location map of the study area. In the tectonic map of Pakistan, Kamra is located in the Karakoram–Himalaya crystalline thrust zone close to the northwest of Pakistan (see Figure 2).
Kamra is in a seismically active zone and had a recent seismic event in October 2015 (M = 7.5) near the Pakistan–Afghanistan border, which triggered a series of aftershocks with magnitudes greater than 6.5 [22]. The river Sehat and the Ghazi Brotha canal pass through the study area, and the rivers Kabul and Indus both pass near to Kamra, which may increase the probability of soil liquefaction. Soil liquefaction easily occurs near ponds, rivers, lakes, and the sea due to the abundance of water, but it is difficult to quantify this index [23].
Kamra city is at a distance of 3 km from the Ranja–Khairabad fault, which has a length of 370 km, as shown in Figure 3. This fault is thrust in nature and forms a loop around the Hazara–Kashmir syntaxis. This fault follows the trend of main boundary thrust with a dip in the north. Analysis of satellite imagery and digital elevation models shows that the fault is still active and has deformed many quaternary deposits in the region.
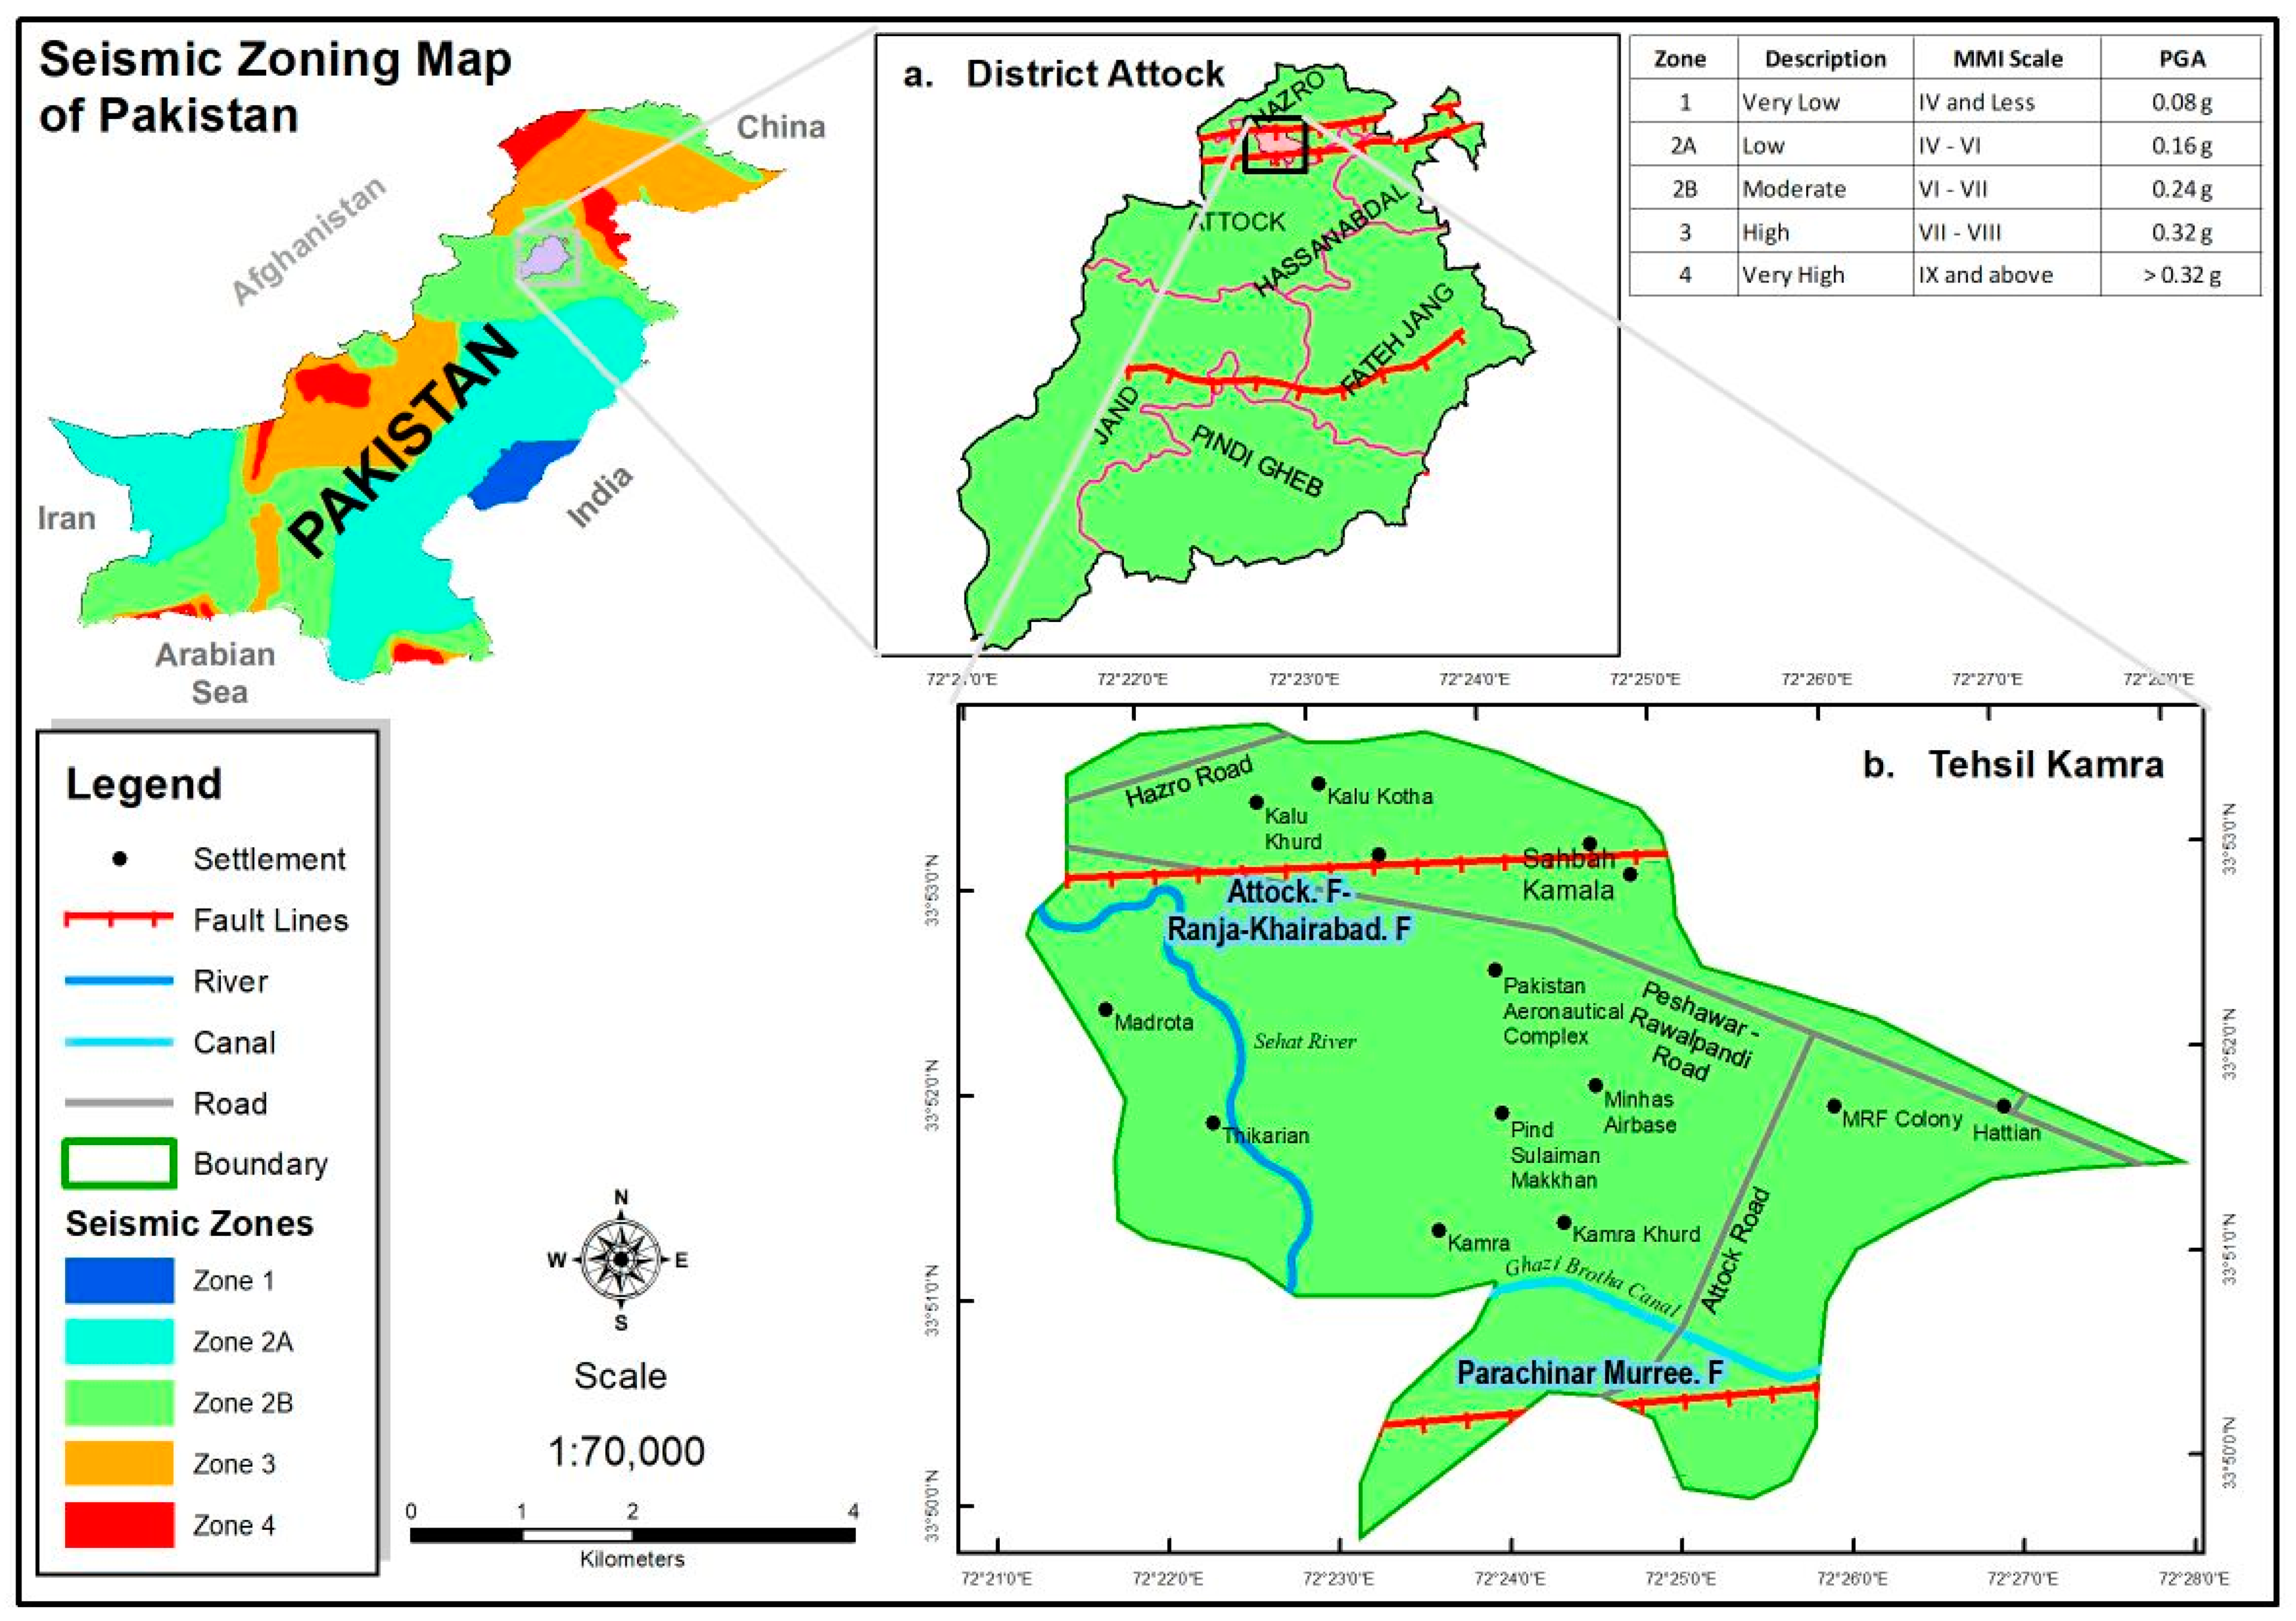
The seismic zoning map of Pakistan (see Figure 3), published in 2010 by the National Engineering Services of Pakistan (NESPAK) by considering the Building Code of Pakistan (BCP, 2007), shows five seismic zones as per expected ground motion. The study area is in zone 2B and has a peak ground acceleration of 0.24g. The BCP is the reference code that was adopted and developed with the aid of the Uniform Building Code (UBC, 97) [24,25].
Earthquake magnitude is calculated from the fault length equation given by Tocher [26] as follows:
where L is the fault length and M is the earthquake magnitude. So, an earthquake of magnitude M ≤ 8.0 can hit the study area. In this study, earthquake magnitudes between 6.5 and 8.0 were used in the calculations.
4. Geotechnical Site Characterization
4.1. Subsoil Profile
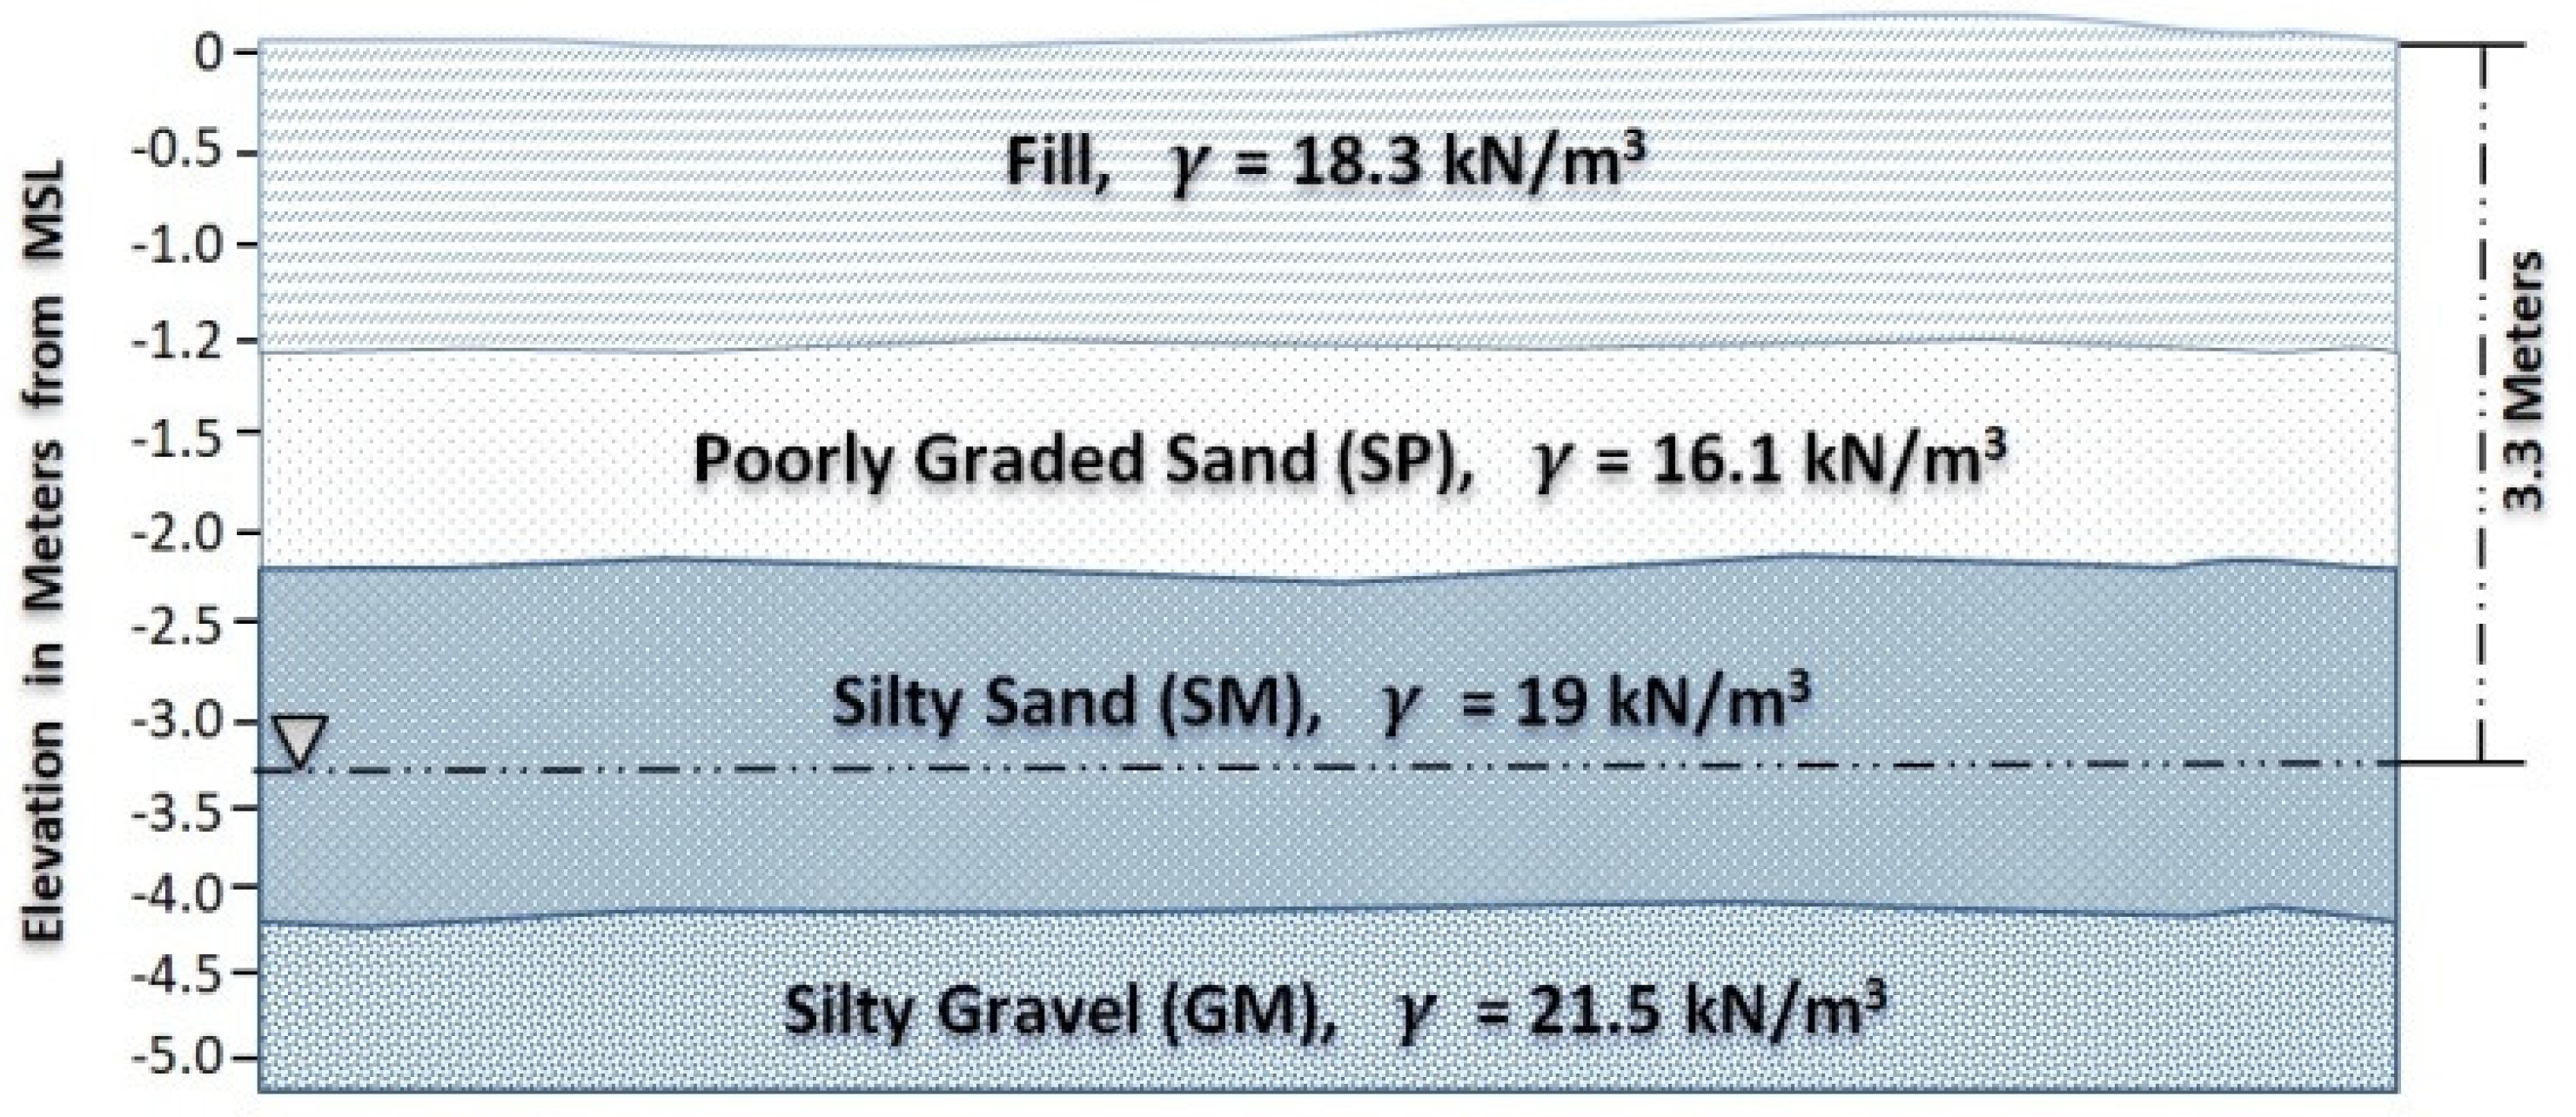
The typical subsoil profile of Kamra consists of silty gravel overlain by silty sand, poorly graded sand, and fill layers. The groundwater table depth is 3.3 m, as shown in Figure 4. The groundwater table influences liquefaction susceptibility, as a rise in the groundwater table can principally weaken the liquefaction resistance of soil. In particular, when the groundwater table rises above 2 m, its influence on liquefaction susceptibility is stronger [27].
The SPT borehole measurements comprised soil type, measured SPT blow counts (Nm), fines content percentage, unit weight (γ), and vertical and effective stress, as shown in Table 2. The laboratory results indicated a reasonable degree of homogeneity of the sand deposits in Kamra.
4.2. Grain Size Analysis
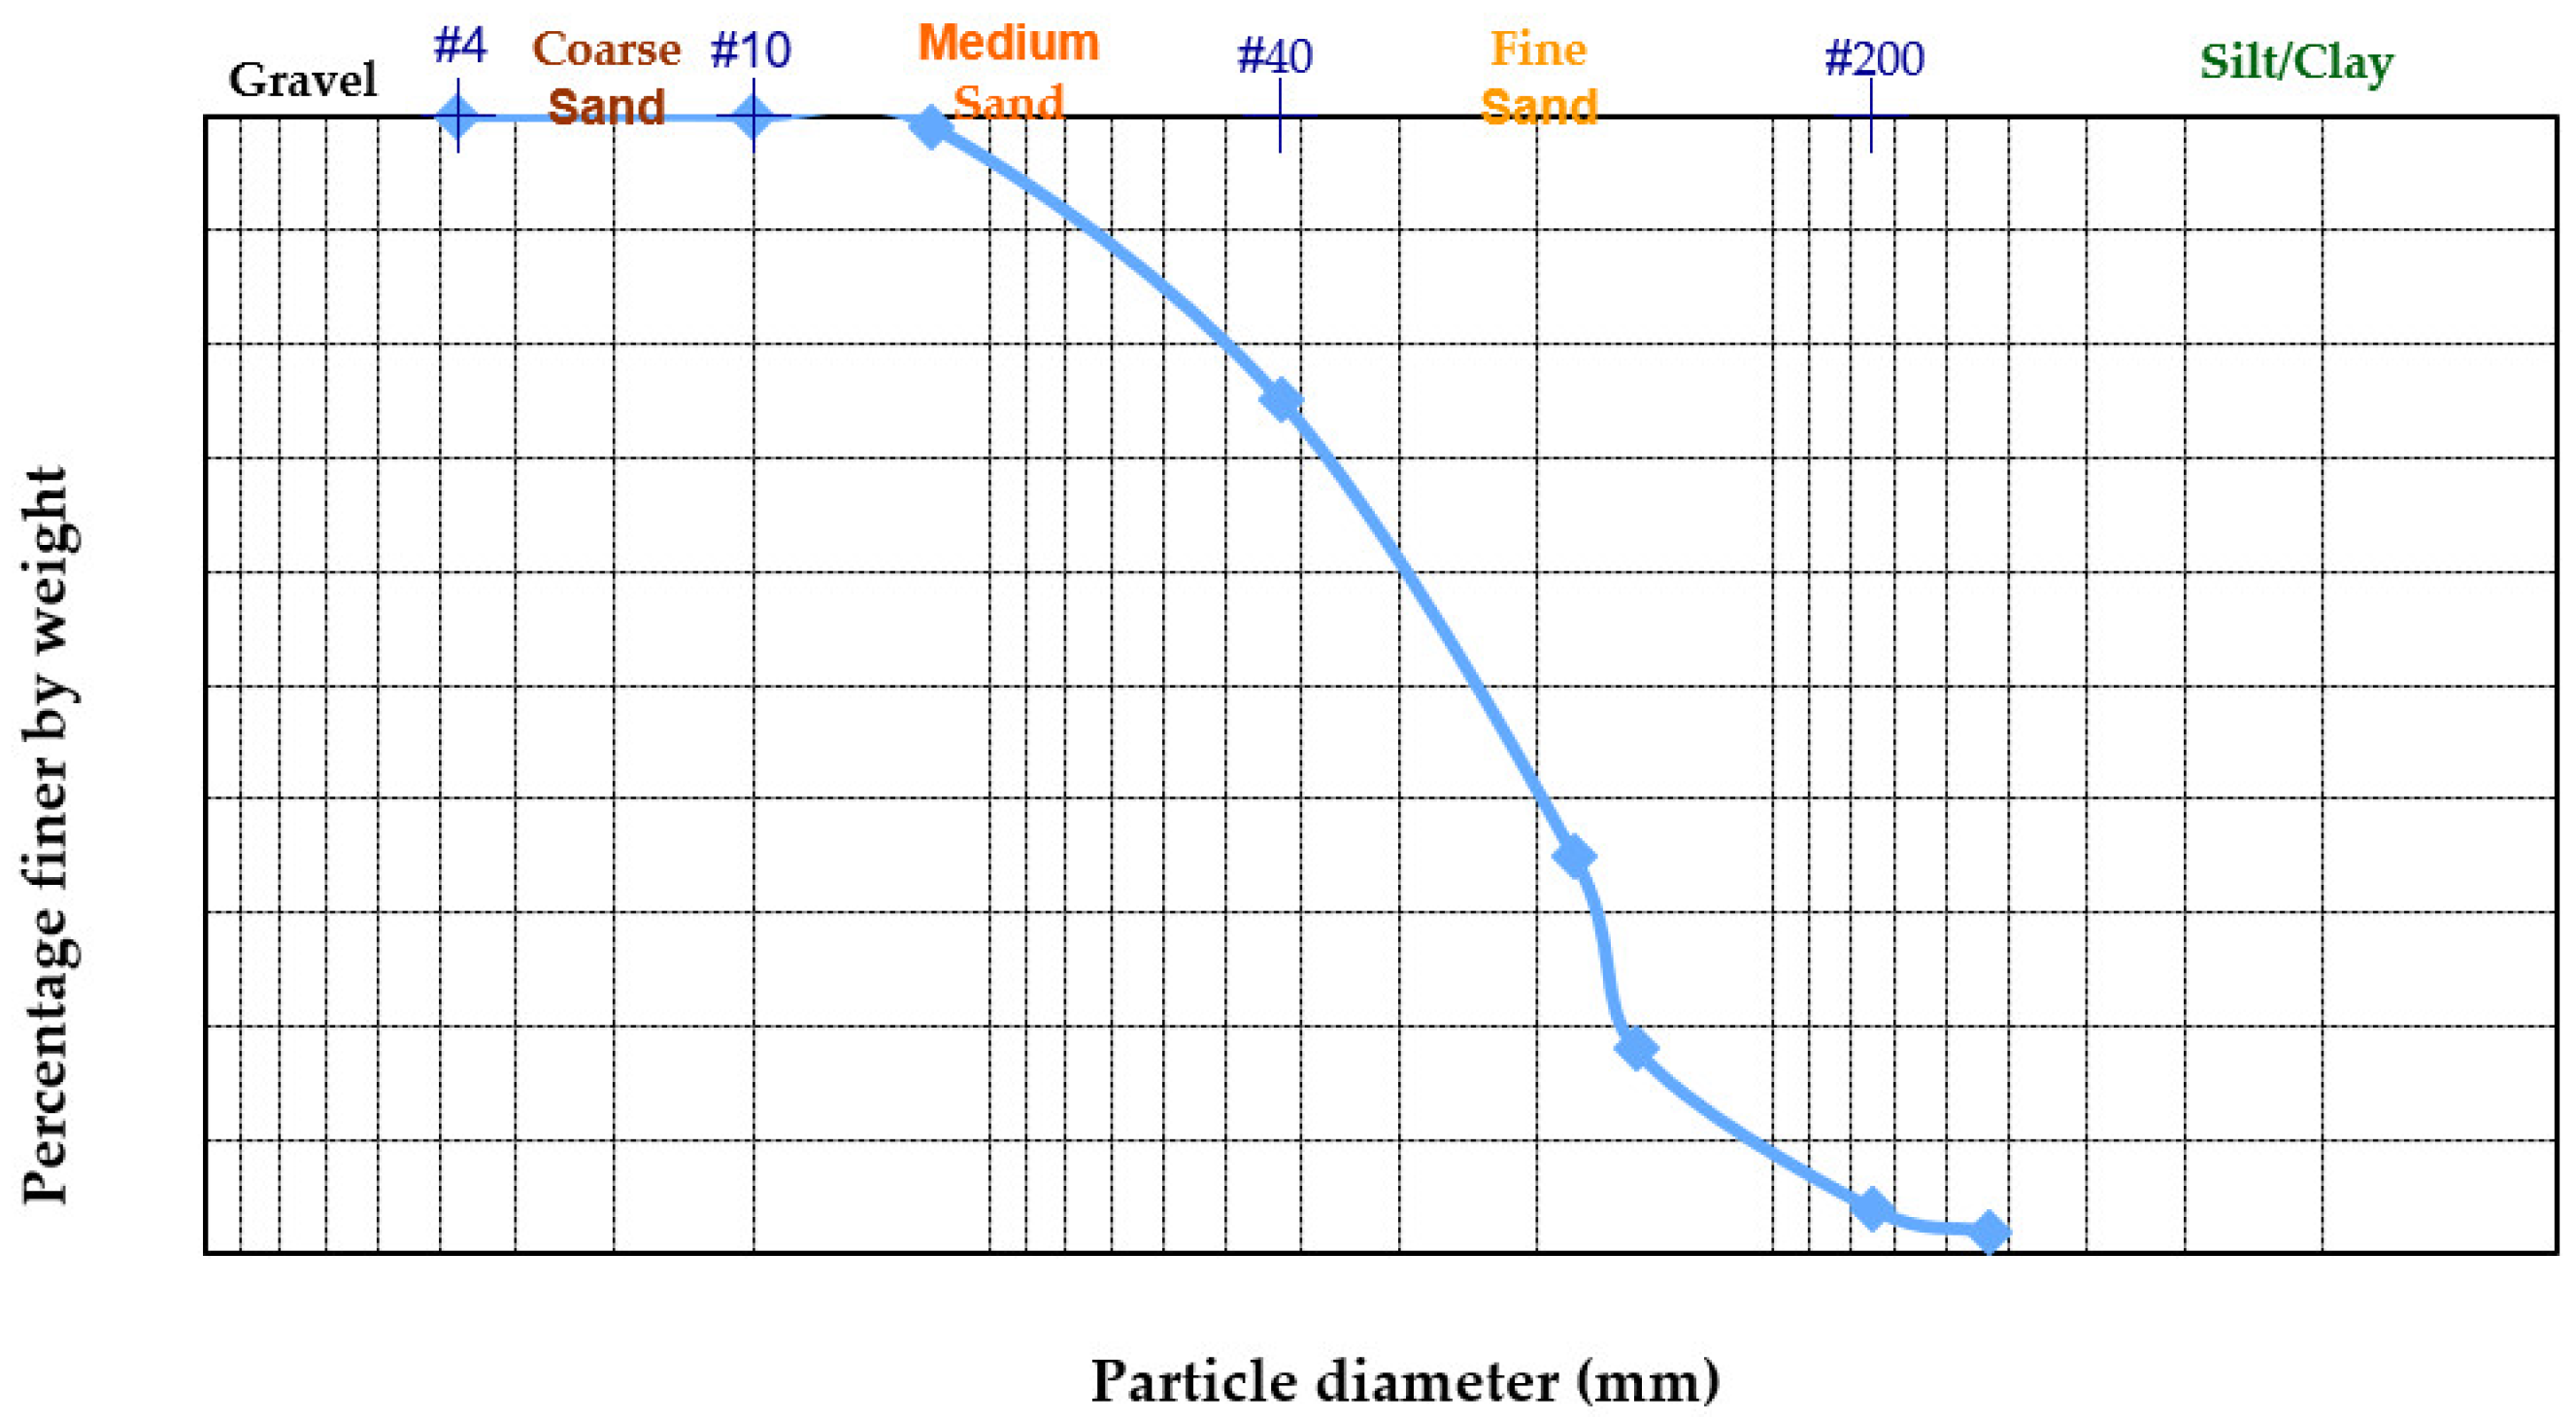
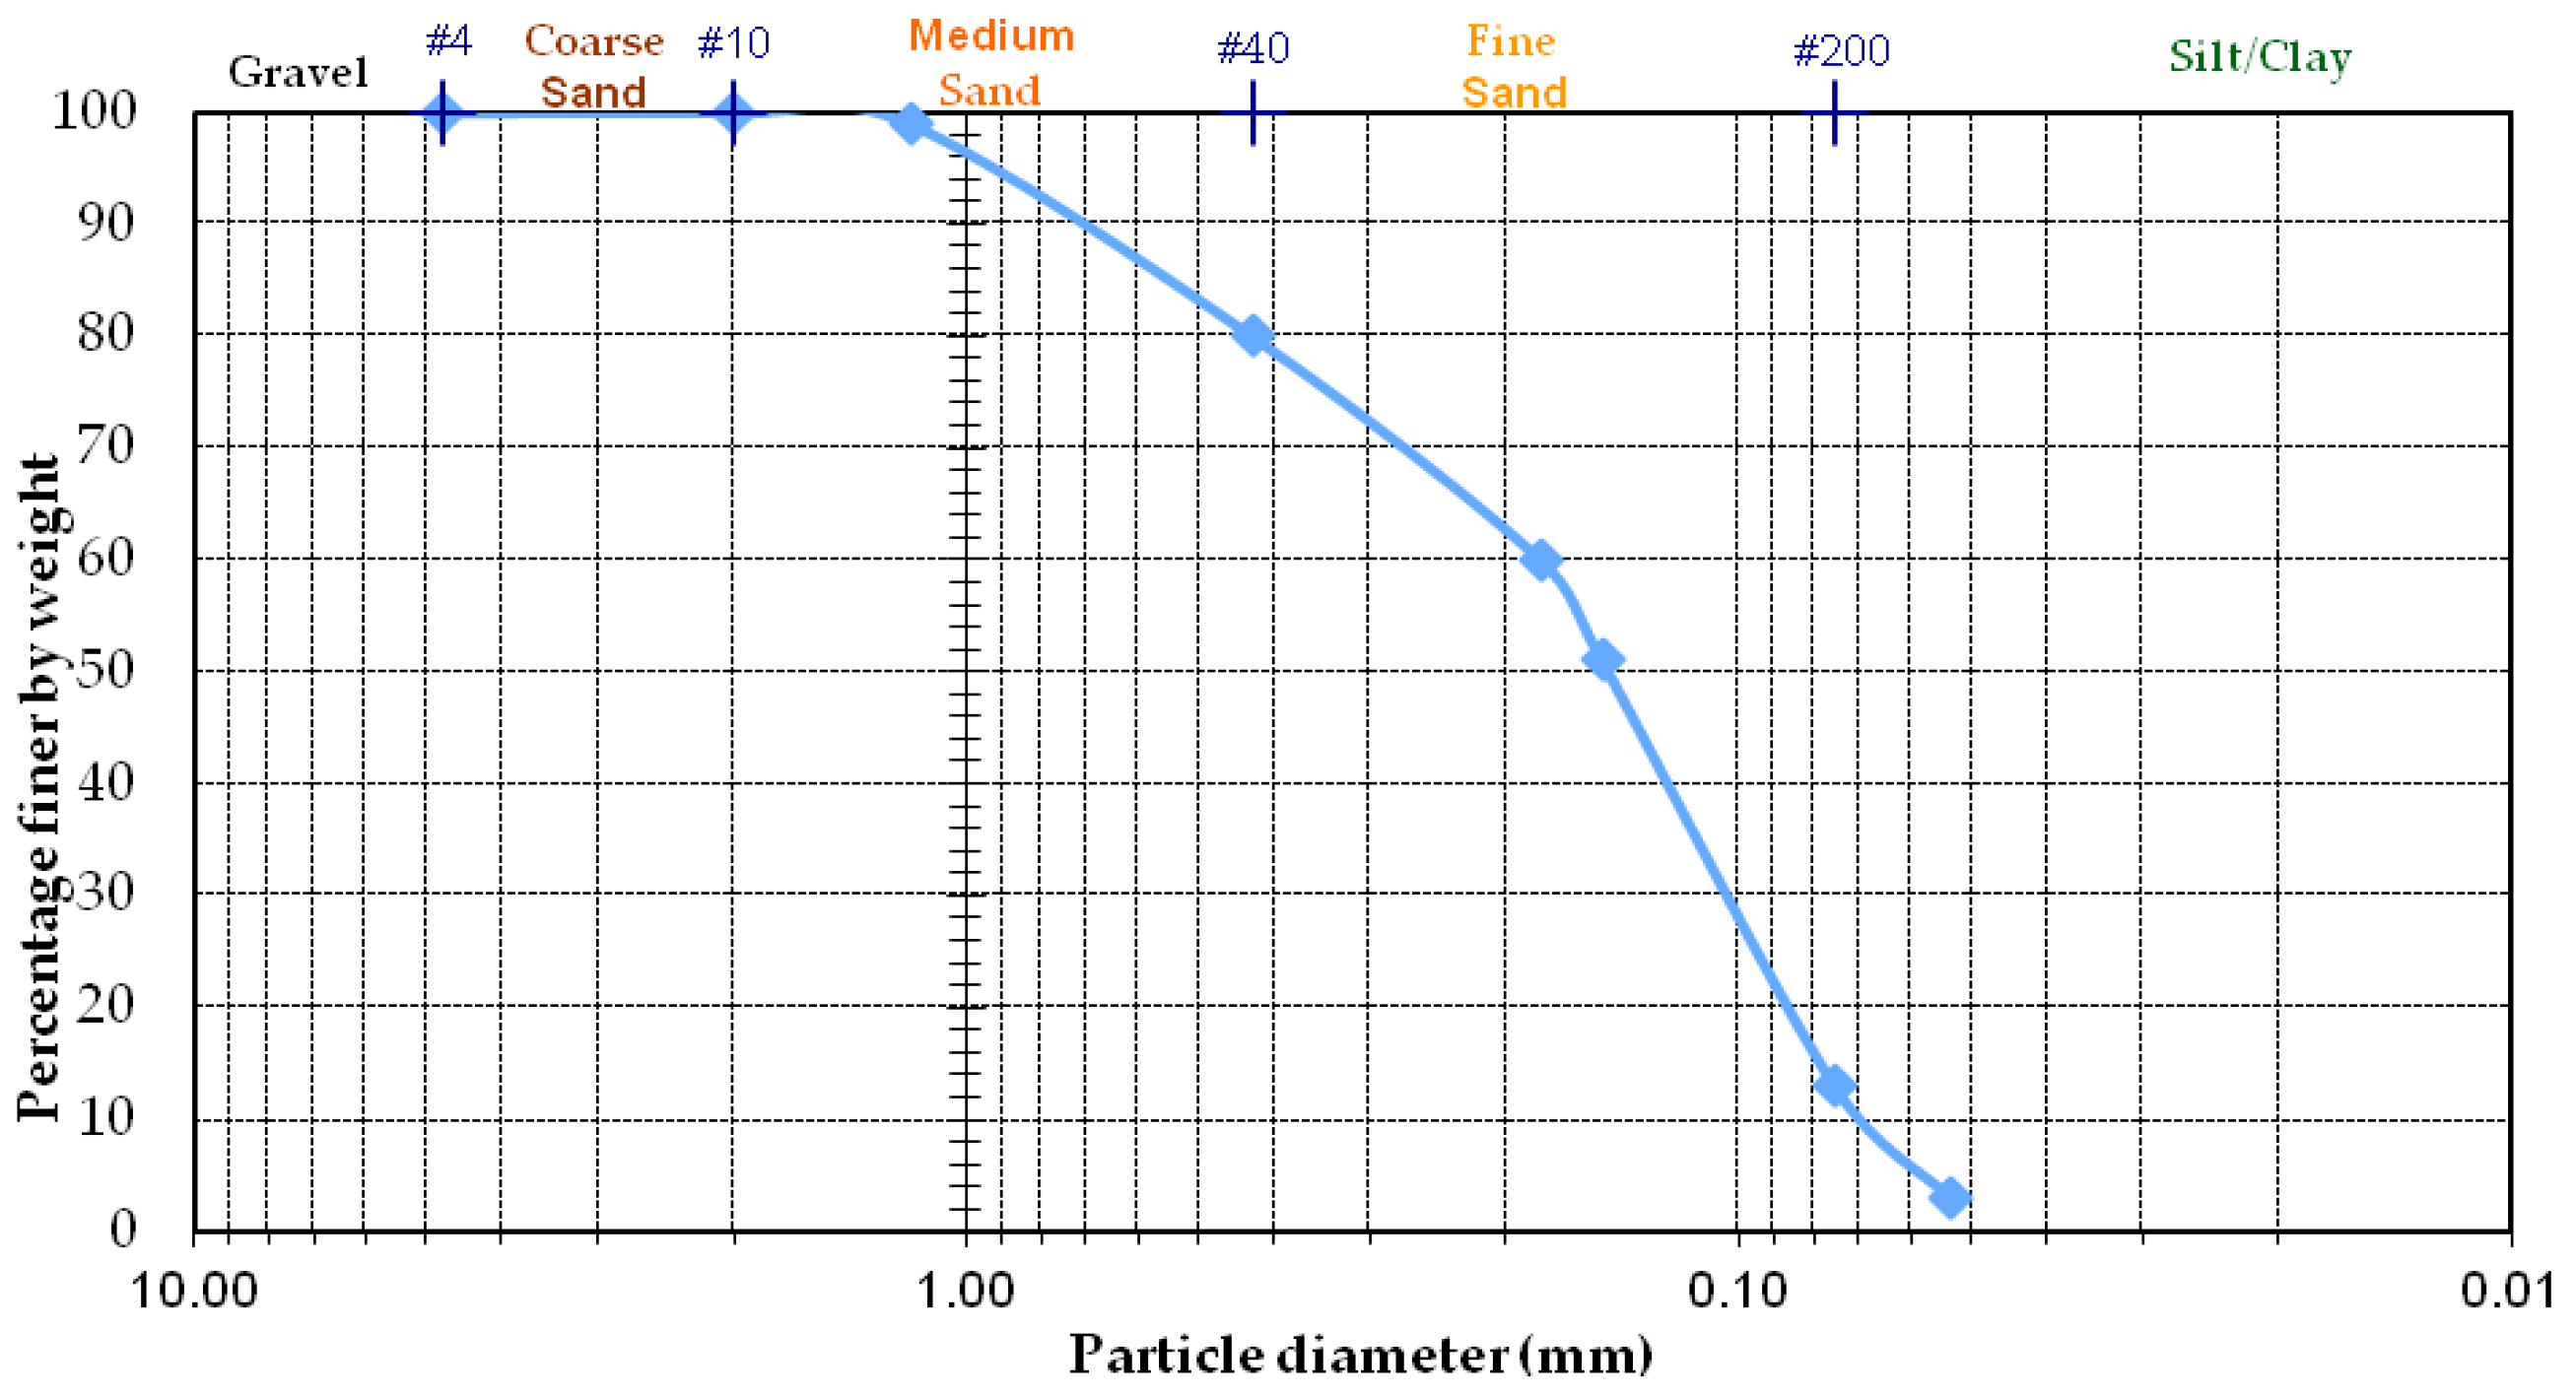
The American Society for Testing and Materials standard (ASTM D422-63) [28] was used for the grain size analysis. This procedure reveals the size and sand class. The soil gradation curves showed that the sands from all sites were categorized as poorly graded sand (SP) and silty sand (SM), as per the Unified Soil Classification System (USCS). The coefficient of curvature (Cc) and coefficient of uniformity (Cu) of the poorly graded sand from all sites ranged from 0.61 to 0.99 and from 1.8 to 2.65, respectively, which complement the USCS criteria of a coefficient of curvature (Cc) less than 1 and a coefficient of uniformity (Cu) less than 6 for poorly graded sand classes. Typical representative gradation curves of poorly graded sand and silty sand are shown in Figure 5 and Figure 6, respectively. The grain size relationship of silty sand at all sites showed that the percent finer than sieve no. 200 (F200) was greater than 12% and the plastic index (PI) was greater than 4, so the USCS guide values were complementary and the sand class was silty sands.
Poorly graded sand and silty sand from all sites had uniformity coefficients less than 10, which supported the preliminary screening liquefaction susceptibility criteria [1].
4.3. Atterberg Limits
The Atterberg limits test was performed to determine the nature of the soil (plastic or non plastic) and PI as per the ASTM D4318-10 standard [29]. Soil with substantial plastic fines content should be appraised using the Atterberg limits for susceptibility to soil liquefaction [30]. The results of the laboratory experiments showed that the poorly graded sand and silty sand PIs supported the preliminary screening liquefaction susceptibility criteria [1].
4.4. Mean Grain Size, D50
The mean grain sizes of poorly graded sand and silty sand ranged from 0.20 to 0.28 and from 0.10 to 0.18 mm, respectively, which satisfied the proposed criteria [1] of the preliminary assessment of the liquefaction potential of a soil deposit in a seismically active region like Kamra.
4.5. Fines Content (FC)
5. Evaluation of Soil Liquefaction Potential
In situ testing is widely used for the quantitative assessment of soil liquefaction potential in common engineering practice. The cyclic stress ratio (CSR) is defined as the seismic demand on a soil layer and the cyclic resistance ratio (CRR) is defined as the capacity of the soil to resist liquefaction. These two variables are used to find the factor of safety (FS) against soil liquefaction. The use of cyclic laboratory testing for evaluating soil liquefaction potential is complex owing to the difficulties associated with sample disturbance during both sampling and reconsolidation. According to Ansal and Tonuk [31], the empirical stress-based SPT approach has gained wide popularity in engineering codes as well as in engineering practice. The FS against soil liquefaction potential is given in Equation (2):
where CRR7.5 is the cyclic resistance ratio for an earthquake of magnitude 7.5, Kσ is the overburden correction factor, Kα is the sloping ground correction, and MSF is the magnitude scaling factor. Here, FS values were calculated at different depths within the subsoil profile of the study area.
5.1. Estimation of Cyclic Stress Ratio (CSR)
For evaluating the cyclic stress ratio, Youd et al. [16] recommend the simplified equation proposed by Seed and Idriss [10], given by Equation (3) as follows:
where is the peak horizontal acceleration on the ground surface, is the gravity acceleration, and are the total and effective vertical overburden stresses, and is a stress reduction factor for depth which represents the flexibility of the soil profile (e.g., for rigid body supposition, ). The stress reduction factor is calculated from Equations (4a) and (4b), as proposed by Liao and Whitman (1986) [32]:
where z is the depth in meters below the ground surface.
5.2. Estimation of Cyclic Resistance Ratio (CRR)
The CRR has been used by various researchers to estimate liquefaction potential. The following well-known approaches for liquefaction potential evaluation were used on the SPT dataset:
- Liquefaction potential evaluation procedures produced by Youd et al. [16] in the National Center for Earthquake Engineering Research (NCEER) and National Science Foundation (NSF) workshops;
- Liquefaction potential evaluation procedures by Cetin et al. [17], with their recommendation that the 15% probability of liquefaction (PL) for (N1)60cs ≤ 32 should be equal to their curve for deterministic analysis;
The reasons for choosing these well-known approaches were examined by Idriss and Boulanger [33]:
- ▪
- The main reasons for the differences in the liquefaction evaluation correlation for M = 7.5 and = 1 atm have been found to be the interpretations and treatment of 8 of 11 key case histories, with vertical effective stress ranging from 0.65 to 1.5 atm in the Cetin et al. [17] database. This included having four key case histories being utilized as “liquefaction” cases despite the original investigators stating that there was “no liquefaction” based on field observations and geologic interpretations.
- ▪
- Significant numerical errors between the rd values, then eventual misclassifications and errors, stemmed from the regression of an overly steep Kσ relation and overly low liquefaction triggering curve.
Idriss and Boulanger [33] concluded that the approaches of Youd et al. [16] and Idriss and Boulager (2004, 2008) [18,19] are reasonable methods for depths less than 12 m for seismic soil liquefaction evaluation. Based on these cited potential significance observations, Idriss and Balunger [33] recommended that the Cetin et al. [17] procedure should not be used until these issues have been addressed and corrected.
In a recently published paper, Cetin et al. [34] highlighted the uncertainty of the Kσ, which was less conservative in the triggering relationship and also lacked documentation and transparency in the relationship given by Idriss and Boulanger [18,19,35], leading to their work not being properly evaluated and fully checked. Improved documentation was ultimately provided by Idriss and Boulanger [33], but independent checking of the remaining 129 field case histories remains difficult to impossible.
Bearing in mind the above points by Idriss and Boulanger [33] and Cetin et al. [34], the authors used the procedures in Youd et al. [16], which were produced by Professors T. L. Youd and I. M. Idriss with 20 experts in the workshop sponsored by the National Center for Earthquake Engineering Research (NCEER) in 1996. Youd et al.’s approach [16] was determined to be reasonable by Idriss and Boulanger [33].
In the method proposed by Youd et al. [16], the cyclic resistance ratio requires the correction of the fines content and the value of (N1)60 to an equivalent clean sand value, (N1)60cs. A. F. Rauch (personal communication to T. L. Youd, 1998) approximated the equation of the clean sand curve for an earthquake magnitude of 7.5 using liquefaction case histories data (modified from Seed et al., 1985 [13]):
Equation (5) is valid for (N1)60cs < 30. For (N1)60cs ≥ 30, clean granular soils are too dense to liquefy and are classed as non liquefiable.
5.2.1. SPT Blow Counts Correction
SPT samplings were done as per the standard test method (ASTM D1586-11) [36] in order to avoid, or at least reduce, some of the major sources of error. Rotary boring and, more specifically, the United States automatic trip rod and pulley were used. All SPT samplers were standard, i.e., CS = 1, and the automatic trip energy ratio (ER) was 55% to 83%.
The measured SPT blow counts (Nm) were corrected to a standard value of (N1)60 and normalized for the effective overburden stress at the depth of the test.
The corrected SPT blow counts (N1)60 were calculated using Equation (6):
where Nm is the measured standard penetration resistance, and CN, CE, CB, CR, and CS are the correction factors for effective overburden stress, hammer energy ratio (ER), borehole diameter, rod length, and samplers with or without liners, respectively. CN was calculated from Equation (7), which was developed by Seed and Idriss [37] and endorsed by Youd et al. [16]:
where CN normalizes the measured blow counts to an equivalent value under one unit of atmospheric pressure ( = 1 atm) of effective overburden stress ().
The correction factor CE used to correct the measured SPT blow counts for the level of energy delivered by the SPT hammer is given in Equation (8):
5.2.2. Fines Content Correction
Fines content correction was initially developed by Seed et al. [13]. I. M. Idriss, with the assistance of R. B. Seed, developed the correction of (N1)60 to an equivalent clean sand value, (N1)60cs. Equation (9) incorporates this correction:
where α and β are coefficients determined from the following equations:
5.3. Overburden Correction, Kσ
Seed developed the original overburden correction factor, Kσ [39]. Hynes and Olsen [40] compiled and analyzed an enlarged dataset to formulate the Kσ value, which is given by Equation (12) and is reflected in Youd et al.’s [16] method:
where is the effective overburden stress, is the atmospheric pressure approximated by 100 kPa (1 Tons per Square Foot), and f is the function of site conditions, including stress history, aging, over consolidation ratio, and relative density. For relative densities between 40% and 60%, f = 0.7–0.8; for relative densities between 60% and 80%, f = 0.6–0.7. Hynes and Olsen [40] recommended these values as minimal or conservative estimates of Kσ for use in engineering practice for both clean and silty sands and for gravels.
5.4. Sloping Ground Correction, Kα
Sloping ground correction was initially proposed by Seed [39]. For horizontal surfaces, i.e., α = 0, the sloping ground correction is considered to be unity. In this study, the ground surface was more or less flat, so Kα was considered to be unity.
5.5. Magnitude Scaling Factor (MSF)
The magnitude scaling factor (MSF) can be used to scale up or down the CRR value depending upon the earthquake magnitude. Idriss (personal communication to T. L. Youd, 1997) developed a revised magnitude scaling factor set given by Equation (13):
where Mw represents the magnitude of an earthquake.
6. Results and Discussion
Considering its high importance for Kamra, this study attempted to evaluate the factors of safety against liquefaction for various seismic magnitudes using the SPT-based Youd et al. [16] procedure. In this study, the soil liquefaction potential at 10 different sites (50 bore holes) across the study area for earthquake magnitudes between M = 6.5 and 8.0 with a peak ground acceleration level of 0.24g was assessed. Two basic definitions of the factor of safety for soil liquefaction potential were used in this study: liquefiable (FS ≤ 1.0) and non liquefiable (FS > 1.0). The typical subsoil profile of the study area consists of silty gravels overlain by silty sand, poorly graded sand, and fill layers. The type of soil most susceptible to liquefaction is one in which the resistance to deformation is mobilized by friction between particles. Generally, the coefficient of uniformity and coefficient of curvature are used to represent grain composition. The lesser the value of the coefficient of uniformity, the worse the soil liquefaction resistance. The poorly graded sand and silty sand deposits had coefficients of uniformity less than 10, which supports the liquefaction susceptibility criteria [1]. The groundwater table was at a depth of 3.3 m. The groundwater table influences liquefaction susceptibility, and, eventually, a rise in the groundwater table can principally weaken the liquefaction resistance of soil. Calculations of the factor of safety were made for when the groundwater table rose from 3.3 to 1.2 m during an earthquake. It was observed that SPT blow counts for the given soils did not exceed 11, which means that the poorly graded sand and silty sand layers were of loose-to-medium density. The results and variations of the SPT samples and factors of safety against soil liquefaction potential are summarized in Table 3. The factor of safety against soil liquefaction potential with an earthquake of magnitude M = 6.5 suggests that there were only two zones of potential liquefaction in the poorly graded sand layer at depths of 1.6 and 2.0 m in the subsoil profile, as the factor of safety was less than 1. Consequently, for an earthquake of magnitude M = 7.0, at depths of 3.6 and 4.0 m, the silty sand layer did not liquify because the soil liquefaction layer had FS > 1 (see Table 3). The soil layers of poorly graded sand and silty sand were completely in the zone of potential liquefaction for earthquakes of magnitude M = 7.5 and 8.0. The soil liquefaction potential results revealed that the degree of soil liquefaction varies with different seismic earthquake magnitudes. The results revealed that soil liquefaction probability increases when the magnitude of an earthquake is more than 7, whereas the bigger the seismic magnitude, the greater the liquefaction potential and the more damage it causes. In Kamra, the middle layers (SP and SM in the subsoil profile) are highly vulnerable to liquefaction during an earthquake with a magnitude between 7.5 and 8.0.
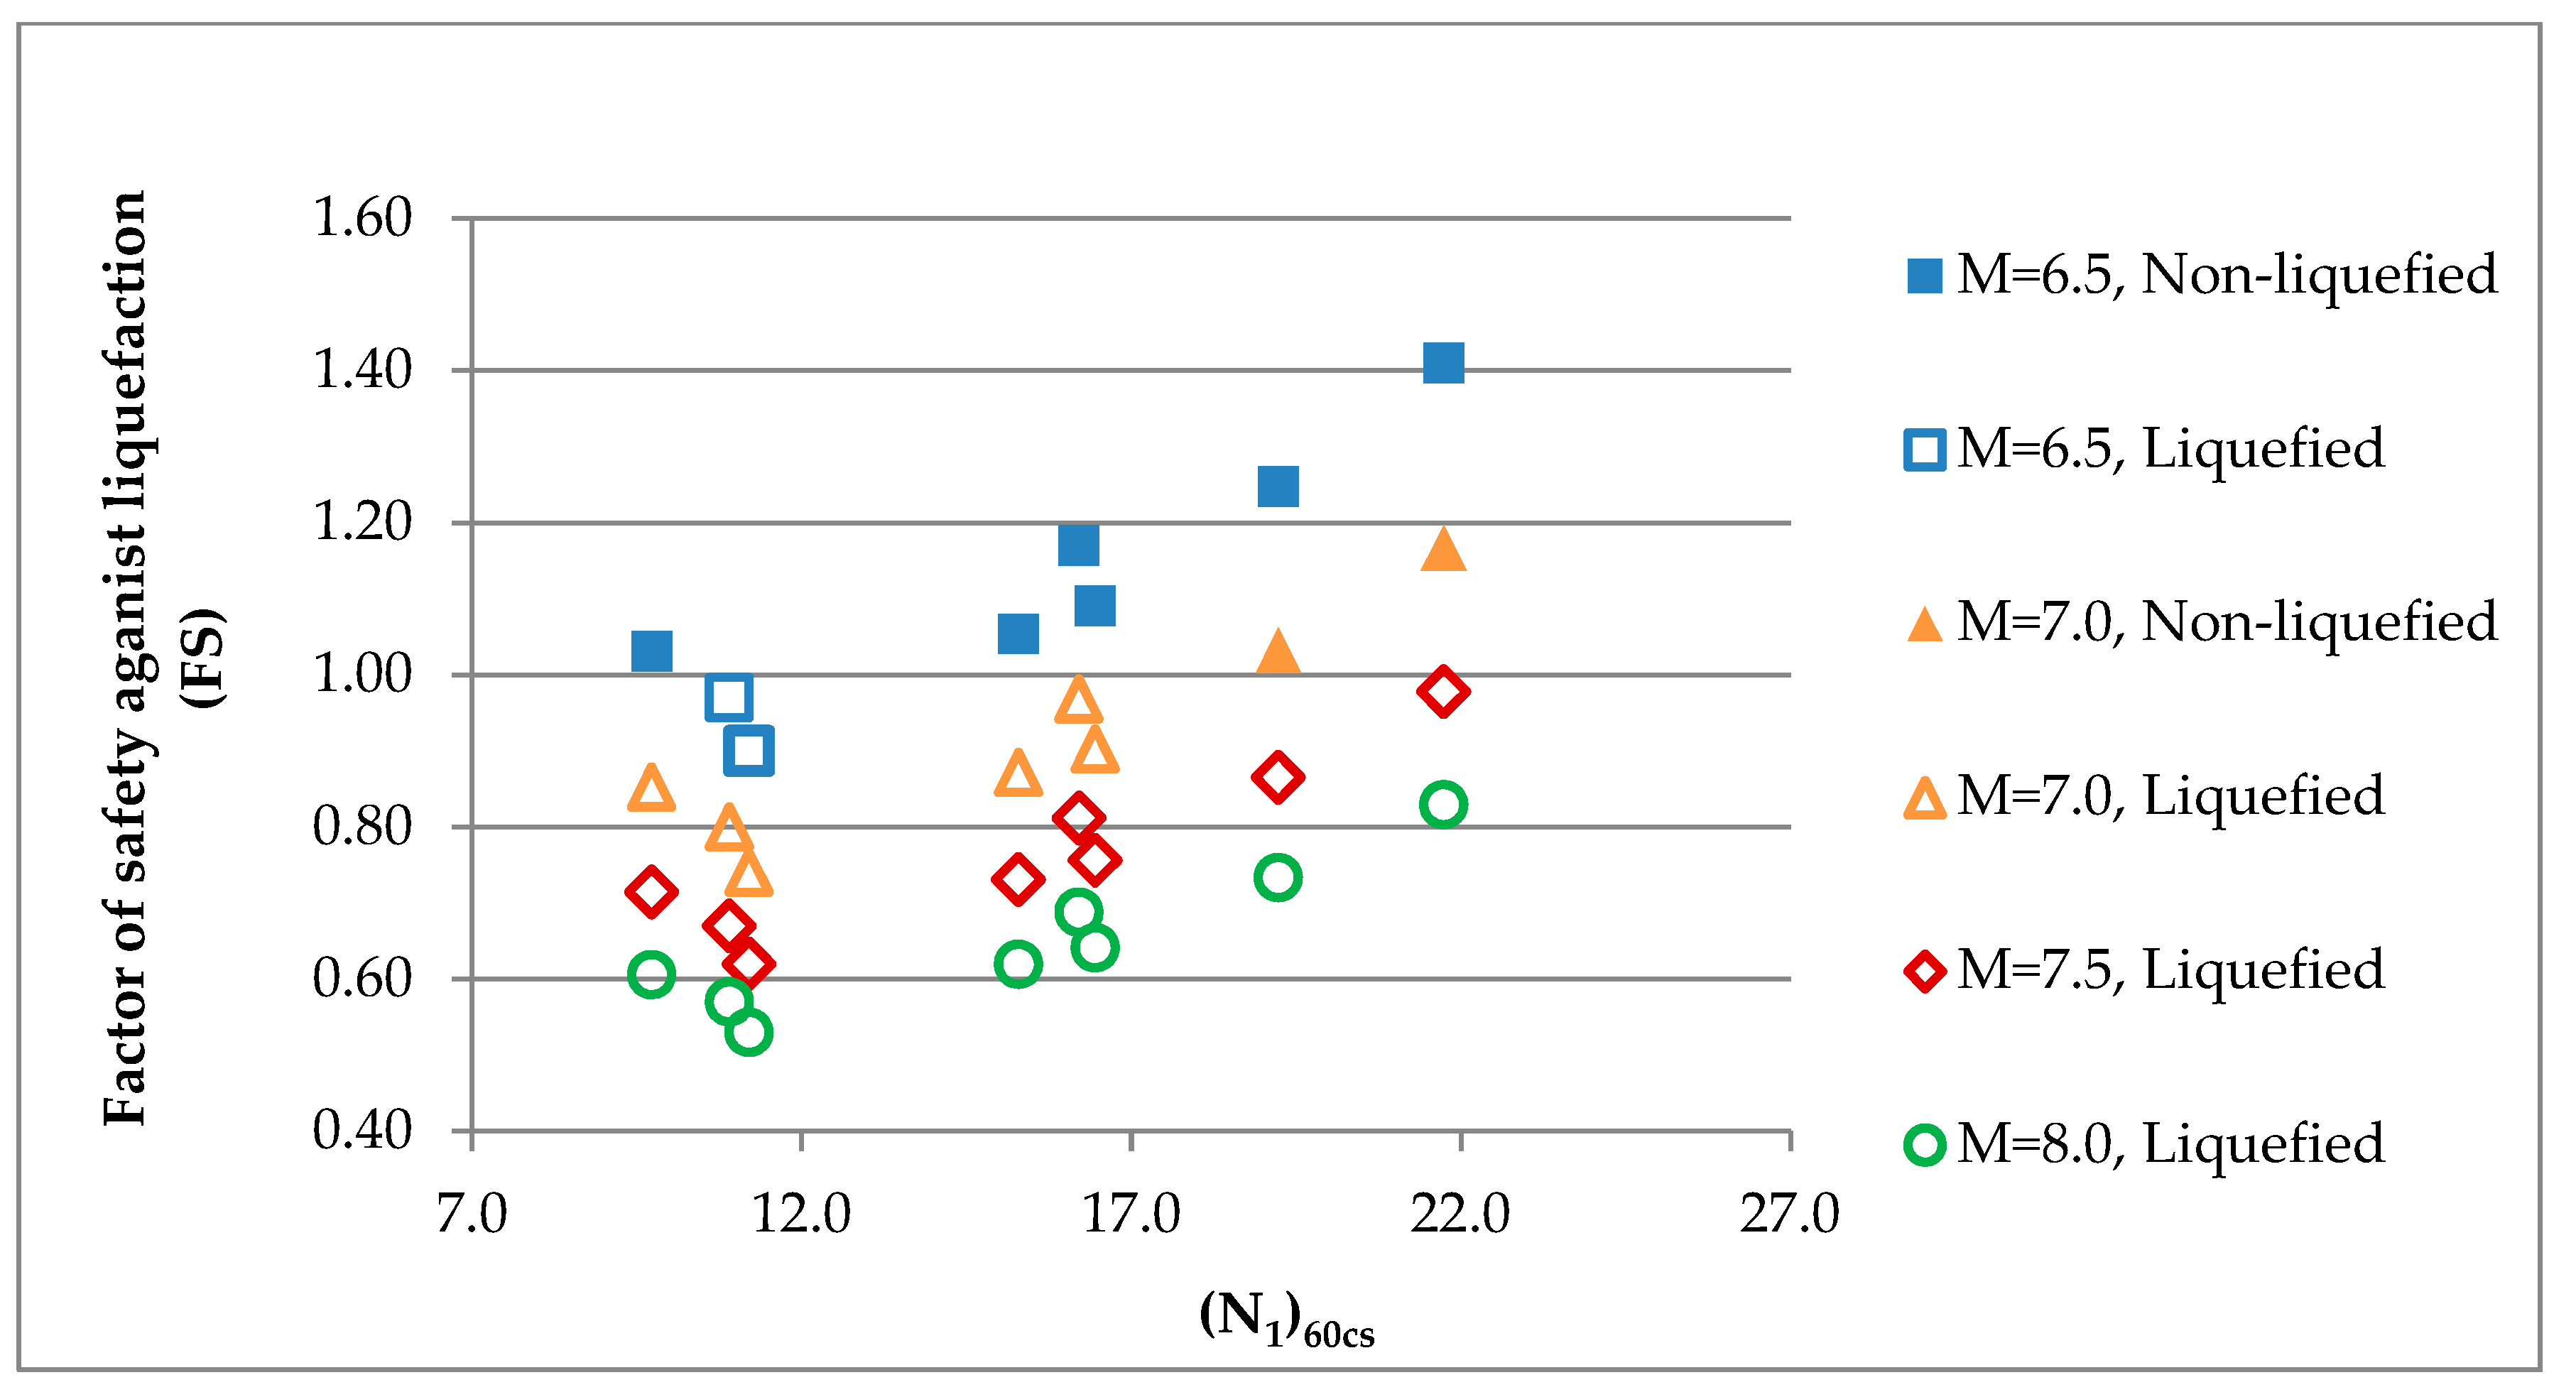
The factor of safety against liquefaction and the equivalent clean-sand-corrected SPT blow count (N1)60cs correlation for the earthquake magnitudes M = 6.5, 7.0, 7.5, and 8.0 from the data in Table 3 is shown in Figure 7 and represented in Equation (14):
where FS is the factor of safety against liquefaction, and the values of a, b, and (N1)60cs (the equivalent clean-sand-corrected SPT blow counts) are shown in Table 4.
The coefficients of determination—R2 values—in these cases are greater than 75%, which shows that there is a good correlation between the FS and (N1)60cs. Equation (14) from Figure 7 could be used to evaluate the soil liquefaction potential in adjoining areas that share the same characteristics as Kamra’s subsoil profile.
The results revealed the fact that Kamra is located within a liquefaction hazard zone and there is significant potential of soil liquefaction. In 2012, 17 sustainable development goals were developed through Rio+20 [41]. One goal—Sustainable Goal 11—has a focus on resilience and sustainability. The goal is to “make cities safe, resilient, and sustainable”. To ensure that this goal is met, geotechnical or structural remedial measures should be implemented in the associated cases to avoid instability due to liquefaction.
Perhaps the most effective mitigation strategy for avoiding damage associated with liquefaction is to avoid building on liquefiable soil altogether. However, as the population of Kamra is steadily increasing, this strategy is not feasible. So, mitigation techniques need to be applied. Densification methods, modifications leading to improving the cohesive properties of the soil (hardening or mixing), removal and replacement, or permanent dewatering can reduce or eliminate the liquefaction potential. Shallow or deep foundations may also be designed to work with partial ground improvement techniques in order to reduce cost while achieving an acceptable level of risk.
7. Conclusions
In Kamra, poorly graded sand (SP) and silty sand (SM) layers are highly susceptible to soil liquefaction when the peak ground acceleration is equal to 0.24g or higher and the groundwater table rises up to 1.2 m, which eventually saturates the SM and SP layers. The preliminary screening of the soil liquefaction assessment also revealed that the SP and SM coefficient of uniformity lies in the liquefaction susceptible zone. The results of the SPT-based liquefaction evaluation showed that the middle layers, i.e., SP and SM in the subsoil profile, are highly vulnerable to liquefaction during earthquakes with magnitude between 7.5 and 8.0 in Kamra. A shallow groundwater table depth along with the SP and SM may contribute to liquefaction. The data show that the measured SPT blow counts (Nm) did not exceed 11; the fines content is in line with the Wang Chinese (1979), Seed et al. (2003), and Bray and Sancio (2006) criteria for liquefaction triggering; and the depth of the soil deposit was less than 15 m, which additionally contributes to the probability of soil liquefaction in Kamra during any perceptible seismic event. Consequently, civil construction and geotechnical design work in Kamra must consider soil liquefaction when planning and designing projects, particularly in areas adjacent to the Peshawar–Rawalpindi road, the Gulberg Town Kamra Cantt, and the Pakistan Aeronautical Complex. From this study, it was found that Kamra is in a liquefaction-susceptible area, indicating the possibility of damage during an earthquake. So, mitigation techniques such as densification methods, modification of site geometry, or drainage to lower the groundwater table need to be applied; guidelines should also be implemented for sustainable development to achieve an acceptable level of risk and should be reflected in a revised building code for Pakistan. Finally, a correlation between factor of safety and equivalent clean-sand-corrected SPT blow counts according to the earthquake magnitudes was developed that can also be utilized for areas adjoining Kamra that have the same subsoil characteristics.
In the future, the creation of soil liquefaction zonation maps at the Pakistan level will be the first step toward highlighting the soil liquefaction problem in seismically active regions and will help achieve an acceptable level of risk by contributing to the revision of the building code of Pakistan.
Author Contributions
This paper received individual contributions from each author as specified: M.A. and X.-W.T. conceived of and designed the research; M.A. developed the research, led data collection and analysis, and wrote the paper. F.A. and A.J. reviewed and made corrections to improve the paper. All authors read the full paper and agreed to its publication.
Funding
The work presented in this paper was part of research funded by the Key Program of National Natural Science Foundation of China under Grant No. 51639002 and National Key Research and Development Plan of China under Grant No. 2016YFE0200100.
Acknowledgments
The authors would like to thank the anonymous reviewers for their valuable comments and suggestions to improve the quality of the paper. We also gratefully acknowledge the National Engineering Services of Pakistan (NESPAK) and Geological Survey of Pakistan.
Conflicts of Interest
The authors declare that there are no conflict of interest regarding this publication.
References
- Satyam, N. Review on liquefaction hazard assessment. In Advances in Geotechnical Earthquake Engineering—Soil Liquefaction and Seismic Safety of Dams and Monuments; Moustafa, A., Ed.; InTech: Hyderabad, India, 2012; pp. 63–82. ISBN 978-953-51-0025-6. [Google Scholar]
- Tang, X.; Bai, X.; Jiangnan, Q.; Jilei, H. Risk assessment of liquefaction-induced hazards using Bayesian network based on standard penetration test data. Nat. Hazards Earth Syst. Sci. 2018, 18, 1451–1468. [Google Scholar] [CrossRef]
- Wang, W. Some Findings in Soil Liquefaction; Water Conservancy and Hydroelectric Power Scientific Research Institute: Beijing, China, 1979. [Google Scholar]
- Andrews, C.A.; Martin, G.R. Criteria for liquefaction of silty soils. In Proceedings of the 12th World Conference on Earthquake Engineering, Auckland, New Zealand, 30 January–4 February 2000. [Google Scholar]
- Seed, R.B.; Cetin, K.O.; Moss, R.E.S.; Kammerer, A.M.; Wu, J.; Pestana, J.M.; Riemer, M.F.; Sancio, R.B.; Bray, J.D.; Kayen, R.E.; et al. Recent Advances in Soil Liquefaction Engineering: A Unified and Consistent Framework; EERC-2003-06; Earthquake Engineering Research Institute: Berkeley, CA, USA, 2003. [Google Scholar]
- Bray, J.D.; Sancio, R.B. Assessment of the liquefaction susceptibility of fine-grained soils. J. Geotech. Geoenviron. Eng. 2006, 132, 1165–1177. [Google Scholar] [CrossRef]
- Pathak, S.R.; Purandare, A.S. Liquefaction susceptibility criterion of fine grained soil. Int. J. Geotech. Eng. 2016, 10, 445–459. [Google Scholar] [CrossRef]
- Igwe, O.; Sassa, K.; Fukuoka, H. Liquefaction potential of granular materials using differently graded sandy soils. Disaster Prev. Res. Inst. Annu. 2004, 47B, 893–902. [Google Scholar]
- Florin, V.A.; Ivanov, P.L. Liquefaction of Saturated Sandy Soils. In Proceedings of the 5th International Conference on Soil Mechanics and Foundation Engineering, Paris, France, 17–22 July 1961; pp. 291–311. [Google Scholar]
- Seed, H.B.; Idriss, I.M. Simplified procedure for evaluating soil liquefaction potential. J. Geotech. Eng. Div. 1971, 97, 1249–1273. [Google Scholar]
- Shibata, T. Relations between N-value and liquefaction potential of sand deposits. In Proceedings of the 16th Annual Convention of the Japanese Society of Soil Mechanics and Foundation Engineering, Tokyo, Japan, 1981; pp. 621–624. (In Japanese). [Google Scholar]
- Tokimatsu, K.; Yoshimi, Y. Empirical correlation of soil liquefaction based on SPT N-value and fines content. Soil Found. 1983, 23, 56–74. [Google Scholar] [CrossRef]
- Seed, H.B.; Tokimatsu, K.; Harder, L.F.; Chung, R.M. The influence of SPT procedures in soil liquefaction resistance evaluations. J. Geotech. Eng. Div. 1985, 111, 1425–1445. [Google Scholar] [CrossRef]
- National Research Council. Liquefaction of Soils during Earthquakes; National Academy Press: Washington, DC, USA, 1985. [Google Scholar]
- Robertson, P.K.; Wride, C.E. Evaluation cyclic liquefaction potential using the cone penetration test. Can. Geotech. J. 1998, 35, 442–459. [Google Scholar] [CrossRef]
- Youd, T.L.; Idriss, I.M. Liquefaction resistance of soils: Summary Report from the 1996 NCEER and 1998 NCEER/NSF Workshops on evaluation of liquefaction resistance of Soils. J. Geotech. Geoenviron. Eng. 2001, 127, 297–313. [Google Scholar] [CrossRef]
- Cetin, K.O.; Seed, R.B.; Der, K.A.; Tokimatsu, K.; Harder, L.F.; Kayen, R.E.; Moss, R.E.S. Standard penetration test-based probabilistic and deterministic assessment of seismic soil liquefaction potential. J. Geotech. Geoenviron. Eng. 2004, 130, 1314–1340. [Google Scholar] [CrossRef]
- Idriss, I.M.; Boulanger, R.W. Semi-empirical procedures for evaluating liquefaction potential during earthquakes. Soil Dyn. Earthq. Eng. 2006, 26, 115–130. [Google Scholar] [CrossRef]
- Idriss, I.M.; Boulanger, R.W. Soil Liquefaction during Earthquakes; Monograph MNO-12; Earthquake Engineering Research Institute: Oakland, CA, USA, 2008. [Google Scholar]
- Finn, W.D.L. State of the art for the evaluation of seismic liquefaction potential. Comput. Geotech. 2002, 29, 329–341. [Google Scholar] [CrossRef]
- Kamra. Available online: https://tools.wmflabs.org/geohack/geohack.php?pagename= Kamra¶ms=33_45_N_72_24_E_region:PK_type:city (accessed on 21 April 2018).
- Qadri, S.M.T.; Islam, M.A.; Shalaby, M.R.; Khattak, K.R.; Sajjad, S.H. Characterization site response in the Attock Basin, Pakistan, using micro tremor measurement analysis. Arab. J. Geosci. 2017, 10, 267. [Google Scholar] [CrossRef]
- Tang, X.; Hu, J.; Qiu, J. Identifying Significant Influence Factors of Seismic Soil Liquefaction and Analyzing Their Structural Relationship. Korean Soc. Civ. Eng. J. Civ. Eng. 2016, 20, 2655–2663. [Google Scholar] [CrossRef]
- Building Code of Pakistan (BCP). Building Code of Pakistan (Seismic Provisions—2007); Ministry of Housing and Works: Islamabad, Pakistan, 2007.
- International Conference of Building Officials. Uniform Building Code; International Conference of Building Officials, Ed.; International Conference of Building Officials: Whittier, AK, USA, 1997. [Google Scholar]
- Tocher, D. Earthquake energy and ground breakage. Bull. Seismol. Soc. Am. 1958, 48, 147–153. [Google Scholar]
- Hannich, D.; Hoetzl, H.; Ehret, D. Liquefaction probability in Bucharest and influencing factors. In Proceedings of the International Symposium on Strong Vrancea Earthquake and Risk Mitigation, Bucharest, Romania, 4–6 October 2007; pp. 205–222. [Google Scholar]
- ASTM D422-63 (Reapproved 1998). Standard Test Method for Particle-Size Analysis of Soils. 1998. Available online: https://compass.astm.org/Standards/HISTORICAL/D422-63R98.htm (accessed on 20 August 2018).
- ASTM D4318-10 Standard Test Methods for Liquid Limit, Plastic Limit, and Plasticity Index of the Soils. 2010. Available online: https://compass.astm.org/Standards/HISTORICAL/D4318-10.htm (accessed on 22 August 2018).
- Seed, H.B.; Idriss, I.M.; Arango, I. Evaluation of liquefaction potential using field performance data. J. Geotech. Eng. 1983, 109, 458–482. [Google Scholar] [CrossRef]
- Ansal, A.; Tonuk, G. Source and site effects for micro zonation. In Geotechnical, Geological and Earthquake Engineering; Pitilakis, K., Ed.; Springer Nature Customer Service Center LLC: New York, NY, USA, 2007; Chapter 4; pp. 73–92. ISBN 978-94-017-7663-9. [Google Scholar]
- Liao, S.S.C.; Whitman, R.V. Overburden correction factors for SPT in sand. J. Geotech. Eng. Div. 1986, 112, 373–377. [Google Scholar] [CrossRef]
- Idriss, I.M.; Boulanger, R.W. SPT-Based Liquefaction Triggering Procedures; Report No. UCD/CGM-10/02; Center for Geotechnical Modeling, Department of Civil and Environmental Engineering, University of California: Davis, CA, USA, 2010; p. 126-A12. [Google Scholar]
- Cetin, K.O.; Seed, R.B.; Kayen, R.E.; Moss, R.E.S.; Bilge, H.T.; Ilgac, M.; Chowdhury, K. Examination of differences between three SPT-based seismic soil liquefaction triggering relationships. Soil Dyn. Earthq. Eng. 2018, 113, 75–86. [Google Scholar] [CrossRef]
- Montgomery, J.; Boulanger, R.W.; Harder, L.F., Jr. Examination of the Kσ overburden correction factor on liquefaction resistance. J. Geotech. Geoenviron. Eng. 2014, 140, 04014066. [Google Scholar] [CrossRef]
- ASTM D1586-11. Standard Test Method Standard Penetration Test (SPT) Split-Barrel Sampling. 2014. Available online: https://www.astm.org/Standards/D1586.htm (accessed on 20 July 2018). [CrossRef]
- Seed, H.B.; Idriss, I.M. Ground Motions and Soil Liquefaction during Earthquakes; Earthquake Engineering Research Institute Monograph: Oakland, CA, USA, 1982. [Google Scholar]
- Skempton, A.K. Standard penetration test procedures and the effects in sands of overburden pressure, relative density, particle size, aging, and over consolidation. Géotechnique 1986, 36, 425–447. [Google Scholar] [CrossRef]
- Seed, H.B. Earthquake-resistance design of earth dams. In Proceedings of the Symposium Seismic Design of Earth Dams and Caverns (ASCE), New York, NY, USA, 16–20 May 1983; pp. 41–64. [Google Scholar]
- Hynes, M.E.; Olsen, R.S. Influence of confining stress on liquefaction resistance. In Proceedings of the International Workshop on the Physics and Mechanics of Soil Liquefaction, Baltimore, MD, USA, 10–11 September 1998; Edited by P.V. Lade and J.A. Yamamuro. A.A. Balkema, Rotterdam, the Netherlands. pp. 145–152. [Google Scholar]
- UN Division for Sustainable Development. Open Working Group proposal for Sustainable Development Goals. Available online: http://sustainabledevelopment.un.org/sdgsproposal.html (accessed on 4 September 2018).
Figure 1.
Location map of (a) the Attock district and (b) the study area, Kamra.

Figure 2.
Tectonic map of the study area, Kamra (modified from a geological survey of Pakistan, 2006).
Figure 2.
Tectonic map of the study area, Kamra (modified from a geological survey of Pakistan, 2006).

Figure 3.
Seismic zoning map of the Attock district and study area, Kamra (modified from National Engineering Services of Pakistan (NESPAK), 2010).
Figure 3.
Seismic zoning map of the Attock district and study area, Kamra (modified from National Engineering Services of Pakistan (NESPAK), 2010).

Figure 4.
Typical subsoil profile of the study area, Kamra.

Figure 5.
Grain size distribution curve of poorly graded sand (SP).

Figure 6.
Grain size distribution curve of silty sand (SM).

Figure 7.
Correlation between FS and (N1)60cs corresponding to earthquake magnitudes M = 6.5, 7.0, 7.5, and 8.0.
Figure 7.
Correlation between FS and (N1)60cs corresponding to earthquake magnitudes M = 6.5, 7.0, 7.5, and 8.0.


Table 1.
Details of liquefaction susceptibility criteria.
| S. No | Criteria | Liquefaction Susceptibility | Laboratory Testing | No Liquefaction |
|---|---|---|---|---|
| 1 | Wang Chinese criteria [3] |
| Conditions satisfied | If any one of the conditions is not satisfied |
| 2 | Andrews and Martin [4] |
| - | If both conditions are not satisfied |
| 3 | Seed et al. [5] |
| Conditions satisfied | Out of limits |
| 4 | Bray and Sancio [6] |
| Conditions satisfied | If both conditions are not satisfied |
Moderate susceptibilities are
|
Table 2.
Standard penetration test (SPT) sample data in the study area, Kamra.
| Depth (m) | Soil Type | Nm | Fines Content (FC) % | γ (kN/m3) | σv (kPa) | (kPa) |
|---|---|---|---|---|---|---|
| 1.2 | Fill | 6 | 8 | 18.30 | 21.96 | 21.96 |
| 1.6 | Poorly graded sand | 7 | 4 | 16.10 | 28.40 | 24.48 |
| 2.0 | Poorly graded sand | 7 | 4 | 16.10 | 34.84 | 26.99 |
| 2.4 | Silty sand | 8 | 14 | 19.00 | 42.44 | 30.67 |
| 2.8 | Silty sand | 8 | 13 | 19.00 | 50.04 | 34.34 |
| 3.2 | Silty sand | 8 | 14 | 19.00 | 57.64 | 38.02 |
| 3.6 | Silty sand | 10 | 13 | 19.00 | 65.24 | 41.70 |
| 4.0 | Silty sand | 11 | 14 | 19.00 | 72.84 | 45.37 |
Table 3.
Summary of SPT samples and factors of safety (FS) against soil liquefaction potential results.
Table 3.
Summary of SPT samples and factors of safety (FS) against soil liquefaction potential results.
| Depth (m) | Nm | (N1)60cs | rd | CSR | CRRM = 7.5 | Kσ | Kα | FS | |||
|---|---|---|---|---|---|---|---|---|---|---|---|
| M = 6.5 | M = 7.0 | M = 7.5 | M = 8.0 | ||||||||
| 1.2 | 6 | 9.7 | 0.993 | 0.155 | 0.111 | 1 | 1 | 1.03 | 0.85 | 0.71 | 0.61 |
| 1.6 | 7 | 10.9 | 0.990 | 0.179 | 0.121 | 1 | 1 | 0.97 | 0.80 | 0.67 | 0.57 |
| 2.0 | 7 | 11.2 | 0.987 | 0.199 | 0.123 | 1 | 1 | 0.90 | 0.74 | 0.62 | 0.53 |
| 2.4 | 8 | 16.2 | 0.984 | 0.212 | 0.172 | 1 | 1 | 1.17 | 0.97 | 0.81 | 0.69 |
| 2.8 | 8 | 15.3 | 0.981 | 0.223 | 0.163 | 1 | 1 | 1.05 | 0.87 | 0.73 | 0.62 |
| 3.2 | 8 | 16.5 | 0.978 | 0.231 | 0.175 | 1 | 1 | 1.09 | 0.90 | 0.76 | 0.64 |
| 3.6 | 10 | 19.2 | 0.975 | 0.238 | 0.206 | 1 | 1 | 1.25 | 1.03 | 0.87 | 0.73 |
| 4.0 | 11 | 21.7 | 0.973 | 0.244 | 0.238 | 1 | 1 | 1.41 | 1.17 | 0.98 | 0.83 |
Table 4.
Values of a, b, and R2 corresponding to earthquake magnitudes M = 6.5, 7.0, 7.5, and 8.0.
| Earthquake Magnitude | a | b | Coefficient of Determination, R2 |
|---|---|---|---|
| 6.5 | 0.3423 | 0.4356 | 0.7665 |
| 7.0 | 0.2832 | 0.4356 | 0.7665 |
| 7.5 | 0.2373 | 0.4356 | 0.7665 |
| 8.0 | 0.2012 | 0.4356 | 0.7665 |
© 2018 by the authors. Licensee MDPI, Basel, Switzerland. This article is an open access article distributed under the terms and conditions of the Creative Commons Attribution (CC BY) license (http://creativecommons.org/licenses/by/4.0/).
Share and Cite
MDPI and ACS Style
Ahmad, M.; Tang, X.-W.; Ahmad, F.; Jamal, A. Assessment of Soil Liquefaction Potential in Kamra, Pakistan. Sustainability 2018, 10, 4223. https://0-doi-org.brum.beds.ac.uk/10.3390/su10114223
AMA Style
Ahmad M, Tang X-W, Ahmad F, Jamal A. Assessment of Soil Liquefaction Potential in Kamra, Pakistan. Sustainability. 2018; 10(11):4223. https://0-doi-org.brum.beds.ac.uk/10.3390/su10114223
Chicago/Turabian StyleAhmad, Mahmood, Xiao-Wei Tang, Feezan Ahmad, and Arshad Jamal. 2018. "Assessment of Soil Liquefaction Potential in Kamra, Pakistan" Sustainability 10, no. 11: 4223. https://0-doi-org.brum.beds.ac.uk/10.3390/su10114223
Note that from the first issue of 2016, this journal uses article numbers instead of page numbers. See further details here.