Key Factors of Sustainability for Smartphones Based on Taiwanese Consumers’ Perceived Values

Graduate School of Design, National Yunlin University of Science and Technology, Yunlin 64002, Taiwan
*
Author to whom correspondence should be addressed.
Sustainability 2018, 10(12), 4446; https://0-doi-org.brum.beds.ac.uk/10.3390/su10124446
Submission received: 19 October 2018
/
Revised: 18 November 2018
/
Accepted: 20 November 2018
/
Published: 27 November 2018
(This article belongs to the Special Issue Selected Papers from 2nd Eurasian Conference on Educational Innovation 2019)
Abstract
:The rapid growth of smartphones over recent decades has brought a large amount of e-waste as well as an increased carbon footprint. Facing severe environmental issues, sustainable development of smartphones has become a particularly important public concern. The main aim of this study was to clarify the key factor of sustainability for smartphones based on Taiwanese consumers’ perceived values. Apple’s iPhone was taken as an example. First, key factors of perception that smartphone consumers valued the most in terms of sustainable practice were extracted through a factor analysis. Second, demographic differences related to these key factors were investigated through t-test and one-way ANOVA analyses; demographic variables were gender, age, education level, occupation, and income level. The results were as follows: (1) the key factors were “recognition”, “brand advantage”, “service quality”, “usage period”, and “perceived price”; (2) there was a significant difference between genders on the key factors of perceived value (“recognition”, “brand advantage”, and “perceived price”). Specifically, females have higher perceived values of “recognition”, “brand advantage”, and “perceived price” than males; (3) there was a significant effect of income level on the key factor (“perceived price”) of perceived value. Specifically, respondents with an income level of NTD15,001–30,000 had a higher perceived value of “perceived price” than respondents earning NTD30,001–45,000. Among the five key factors, “recognition” and “brand advantage” are primary factors influencing purchase motivation; “recognition”, “brand advantage”, and “service quality” are primary factors that could influence brand loyalty; “perceived price” is the primary factor that affects purchase intention. This study contributes to the green market segmentation of smartphones. The limitations of the study relate to the size and distribution of the samples.
1. Introduction
1.1. Research Background
Since the beginning of the 21st century, science and technology has developed rapidly, accompanied by the emergence of various electronic devices, which have gradually but significantly changed people’s daily lives. With the economic growth in many Asian countries, increasing numbers of people now have the ability to purchase electronic devices. Among these, smartphones are recognized as the most common and popular device. The majority of people in industrialized Asian countries are using smartphones for private and business activities, promoting the rapid development of smartphones. Facing a large profitable market, brands constantly innovate and promote new products, which has led to a rising trend in smartphone sales. From 2009 to 2014, the annual growth rate of smartphones was more than 25% [1]. According to Gartner, an international research institute that collects the global market statistics of smartphones, in the first quarter of 2018, the global sales of smartphones exceed 300 million, reaching a growth rate of 1.3% compared with the same period last year [2].
However, the development of the smartphone industry has a strong impact on the environment. While consumers are immersed in the freshness of ever-updating smartphones and sellers are celebrating rich market returns, our living environment continues to deteriorate. The steady growth of personal portable electronic devices over recent decades has considerably increased the related carbon footprint [3]. Furthermore, the lifecycle of smartphones is limited due to function improvements and people’s changing preferences. Most abandoned smartphones end up as e-waste—a burden to the environment and a threat to people’s health. In 2016, the amount of global e-waste increased by 8% compared with 2014, a maximum increase among all types of waste [4]. E-waste contains many toxic substances, such as lead, mercury, cadmium, and lithium. If not treated appropriately, such e-waste could result in severe adverse environmental and human health impacts [5].
Accordingly, green consumption is gaining an increasing amount of attention. It forms part of a healthy lifestyle as well as being associated with social responsibility [6]. Green marketing has evolved in line with an increase in consumer concern for the environment [7], with green development and green consumption becoming the trends of the times. Increasing public attention on social responsibility and sustainability calls for responsible consumer choices [8]. Concern about environmental degradation has led to a new segment of consumers who care about green, ecological issues [9]. Consumers are willing to take the environmental impact into consideration when purchasing a product or choosing a brand. They are more inclined to pay for the products or services with the least environmental impacts.
This perceived value of sustainability is highlighted and promoted under contemporary social and environmental backgrounds. Perceived value occurs at various stages of the purchase process, including the pre-purchase stage [10]. Users’ sustainable perceived values toward smartphones are a complicated combination of emotional bond, personal values, usage experience, cultural background, personalization, social status, and anticipation, all of which are important aspects of achieving more sustainable development for both industries and the environment. Personal perception, environmental attitude, and green purchasing behavior are closely connected, and personal values can effectively influence green purchasing behavior [11]. Sustainable perceived value is a key indicator for market segmentation because it offers valuable information on target groups. Therefore, it is crucial to find the key factors of perception that smartphone users value the most in terms of sustainable practice.
1.2. Research Purpose
In the last decade, although sustainability in electronic industries has been a widely researched topic, little attention has been paid to the factors that favor sustainable development from the point of view of users. In the context of environmental concern and social responsibility, it is imperative to study the sustainability of smartphones while catering to consumer needs. To achieve this goal, the first step is to determine the real attitudes and expectations of consumers toward sustainable smartphones, summarize the key factors, and then make corresponding changes and strategies. However, differences in purchasing preference, which are unpredictable, exist for every consumer. If the sustainable key factors of smartphones could be summarized and then transformed into appropriate marketing strategies, this would likely contribute to harmonious development among consumers, smartphone brands, and the environment. Thus, the main aim of this study is to identify the key factors that users perceive toward smartphones, which could contribute to the environment and sustainability of green marketing. In view of the reasons mentioned above, the key objectives of this study are as follows:
- (1)
- Extract key factors of smartphones from the consumer perspective;
- (2)
- Find and compare demographic differences in key factors;
- (3)
- Clarify associations between key factors and the sustainability of smartphones.
1.3. Research Scope
This paper focuses on smartphone users in Taiwan as the targeted group. As one of the “Four Asian Tigers” (four affluent areas in Asia), Taiwan has had a world-wide reputation for electronic production since the last century [12]. In the past four decades, an electronic industry ecological chain has been established [13]. Taiwan’s electronic devices have had an important role in the global market (see Table 1). In 2016, out of the 1850 listed companies in Taiwan, 830 companies were related to electronic industries [14]. However, the large amount of production has led to environmental concern. In 2015, the e-waste production per person in Taiwan was approximately 19 kilograms [15], while the total garbage production per Taiwanese person was about 310 kilograms in the same year [16].
Some smartphone brands have maintained a relatively stable reputation among consumers in Taiwan. This paper selected Apple’s iPhone (Cupertino, CA, USA) as an example, because the iPhone has the largest market share compared with other brands in Taiwan. Huang, Su, and Zhou (2017) carried out a study on customer satisfaction and usage time of smartphones in Taiwan to determine the four most popular smartphone brands in Taiwan according to customer satisfaction [17]. Apple’s iPhone ranked first, followed by Samsung (Seoul, Korea), Sony (Tokyo, Japan), and HTC (New Taipei City, Taiwan). Statistics showed a high level of loyalty to Apple: 79.3% of the consumers would still purchase an iPhone if their previous smartphones were also iPhones, illustrating a much higher loyalty than other brands. Further, the purchasing transfer rate from other brands to Apple was quite high. More than 20% of consumers transferred their choices from Samsung or HTC to Apple. Regarding the satisfaction level, Apple’s iPhone had an obvious advantage as compared with HTC, Sony, and Samsung. Besides gaining popularity among Taiwanese consumers, Apple also maintained good cooperation with Taiwan’s electronic enterprises; Taiwan’s electronic enterprises play a key role in Apple’s supply chain system. According to Apple’s latest released top 200 global supply chain lists, the number of Taiwan enterprises increased from 39 in 2017 to 42 in 2018 [18].
The concept of sustainability is constantly being expanded and enriched. In this study, “sustainability of smartphones” has two meanings: (1) the sustainable development of smartphone brands; (2) sustainable purchasing by consumers.
2. Literature Review
2.1. Perceived Value of Consumers
A focus on value for customers emerged as an important marketing concept, particularly during the 1990s [19]. Perceived value was once regarded as a balance between benefit and sacrifice, and it originated from transaction utility theory [20]. This theory took the position that consumer behavior not only depends on price or service but is also determined by consumer perception and mental awareness [21]. Monroe and Krishnan (1985) proposed that perceived value influences the willingness to purchase [22]. If some product or service is highly evaluated, the consumers’ perceived value of it was relatively high. Zeithaml (1988) studied the relationship between price, perceived quality, and perceived value, and defined perceived value as “the consumer’s overall assessment of the utility of a product based on perceptions of what is received and what is given. Though what is received varies across consumers (i.e., some may want volume, others high quality, still others convenience) and what is given varies (i.e., some are concerned only with money expended, others with time and effort), value represents a tradeoff of the salient give and get components” [23] (p. 14). A similar opinion is that perceived value is the ratio or trade-off between quality and price, a money-related conceptualization agreed upon by some other researchers [24]. Researchers in the 1990s forecasted that perceived value would still be an important imperative for producers and retailers in the 21st century [10,25].
Later, more emotional and social considerations were accounted for. Perceived value turned into a social, economic, and emotional multi-conceptual combination constructed from multiple dimensions. Sweeney and Soutar (2001) developed a multiple item scale of consumers’ perceived value in a retail purchase situation and termed the four dimensions emotional, social, quality/performance, and price/value for money [26]. These dimensions were found to be efficient in explaining consumer attitudes and behaviors. Parasuraman and Grewal (2000) summarized four different types of perceived value that have been identified in the literature: acquisition value, transaction value, in-use value, and redemption value [27]. They also considered perceived value to be a dynamic construct in that the relative emphasis on each component may change over time. Cengiz and Kirkbir (2007) analyzed the dimensionality of the concept of perceived value in the health sector, incorporating valuations of functional and affective aspects and obtaining an overall quantification of the value perceived by the patient [28]. Perceived value was found to be a multidimensional construct composed of dimensions including functional value (installation, service quality, price, and professionalism), emotional value (novelty, control, and hedonics), and social value. Sheth, Newman, and Gross (1991) developed a theory to explain why consumers make the choices they do [29]. This theory identified five consumption values that could influence consumer choice behavior associated with social, emotional, functional, epistemic, and conditional factors. Sánchez et al. (2006) developed a scale of measurement of the perceived value for the purchase of a tourism product, with 24 items being grouped into six dimensions: functional value of the travel agency (installations), functional value of the contact personnel of the travel agency (professionalism), functional value of the tourism package purchased (quality), functional value price, emotional value, and social value [30]. Some multi-dimensions of perceived value determined by researchers are listed in Table 2.
Recently, Quade and Leimstoll (2017) studied the perceived value of smartphones and tablets for mobile business in small and medium enterprises and developed a model to identify the impact that perceived value has on the productive business processes of companies [35]. Different from the business-oriented purpose of Quade and Leimstoll’s research [35], this study attempts to determine how perceived value contributes to the sustainable development of smartphone enterprises when environmental considerations are highly valued. Regarding the use phase, consumers’ perceived value was found to be influential. Some studies determined that such perceived value may have a positive impact on satisfaction, which is a key determinant for market share [36]. Ralston (2003) investigated the effects of customer service quality, brand-advertising expenditure, and real price competitiveness on customer value among residential local telephone customers [37]. Wang (2010) studied the moderating effect of environmental attitude on personal values and green purchasing behavior, finding that personal values and environmental attitude have significantly positive effects on green purchasing behavior [11]. Therefore, consumers’ perceived value should be a key focal point and receive sufficient attention.
2.2. Sustainability of Electronic Devices
In 2005, in order to outline the sustainable growth of the world-wide electronics industry, the International Electronics Manufacturing Initiative issued an authoritative guideline—the 2004 iNEMI Environmentally Conscious Electronics Roadmap—to identify future research, development, and implementation needs. This roadmap focused on five key areas: design, energy, recycling, materials, and sustainability. Among the five areas, sustainability was identified as a new topic of focus to guide electronics industry practice [38]. In 2015, United Nations members and leading development institutions established the Sustainable Development Goals (SDGs) as a global development framework, which appealed for sustainable consumption and production patterns as well as urgent actions to combat climate change and its impacts [39].
The issue of sustainability has also received significant academic attention. Surrounding this highly debated topic, relevant studies have been published, particularly in the last decade. Some research relating to sustainability discussion has focused on the use phase of a product’s lifecycle because this phase is important for the sustainability of smartphones. Scharnhorst et al. (2005) analyzed three lifecycle phases (production, use, and end-of-life treatment) of second-generation mobile phone networks, with results indicating that “the environmental impacts attributable to the use phase dominated the environmental impacts incurred over the entire life cycle of the network” [40] (p. 540). Paiano et al. (2013) also considered that the behavioral patterns of the users would influence the sustainability of mobile phones [41]. Other studies have focused on the sustainable business model of smartphones, for example, Schneider et al. (2018) proposed a sustainable smartphone business approach by combining product modularity, product-service systems, and design [42]. They argued that this approach would reduce the environmental impact of the smartphone during the production phase, which accounts for most of the emissions throughout a smartphone’s life cycle. They also discussed the impact of users’ behaviors through emotional bonds, personalization, and technology appropriation, which act as predictors of attachment to products and can even lead to an extended lifespan of smartphones. There have also been related studies that aimed to identify the key indicators related to environmental management. Saura, Reyes-Menendez, and Alvarez-Alonso (2018) highlighted the key factors related to environmental management detected by travelers during their stays in hotels and found that these factors were meaningful as they allowed hotel managers to improve their services as well as enhancing the value of sustainability pursuit [43]. In terms of the industry’s response to sustainable practice, Moyle et al. (2018) concluded that the tourism industry was more actively committed to sustainable environmental practices [44].
In the modern world, environmental demand by consumers has led to the emergence of green markets, and environmental concerns have begun to be displayed in purchasing patterns, with so-called environmentally friendly products gaining increasing preference [45]. Environmental needs of consumers are being recognized by the market, including the electronics industry. Liao (2003) conducted a study investigating consumers’ recognition of green products in Taiwan. The results indicated that 78% of the consumers had heard of “green products” and 73% of them had grasped some related knowledge [46]. However, the study only provided an overview of Taiwanese opinion and awareness toward green products without identifying the smartphone area. Studies focusing on electronic devices have primarily analyzed strategy from an industry perspective, for example, how to minimize energy consumption [47], how to develop an efficient sustainable system [48], and approaches for recycling e-waste [49]. Some of these studies focused on smartphones but lacked discussion about users’ perspectives.
3. Conceptual Framework and Hypothesis Development
Gender, age, education, occupation, and income are five common demographic variables that were used as bases for segmenting and profiling green consumers in previous studies [50,51,52].
Some of these studies found that males and females had different responses towards environmental issues. Males were more environmentally knowledgeable than females [53,54], while the latter were more ecologically conscious and engaged in eco-conscious behaviors [51,52,55,56]. Based on previous research, we propose the following hypotheses:
Hypothesis 1.
Gender will have a significant effect on the key factor of perceived value related to sustainability.
The relationship between age and environmental consciousness has proven to be more consistent [7]. Some studies presented a significantly negative relationship between age and environmental knowledge, attitude, and behavior [51,53]. However, younger people are more concerned with the deterioration of the environmental [57], and older consumers tend to engage in more ecologically conscious behaviors [58]. Based on previous research, we propose the following hypothesis:
Hypothesis 2.
Age will have a significant effect on the key factor of perceived value related to sustainability.
Some studies have shown that education is positively correlated with environmental knowledge, attitude, and behavior [51,58]. A few studies, however, have found that education is not a good predictor of environmental concern or purchasing behaviors [58,59]. Based on previous research, we propose the following hypothesis:
Hypothesis 3.
Education level will have a significant effect on the key factor of perceived value related to sustainability.
Previous studies regarding the influence of occupation on environmental consciousness have yielded inconsistent results [7]. While some studies reported a significant relationship between occupation and environmental attitude [60], other works have noted no such relationship [59,61]. Based on previous research, we propose the following hypothesis:
Hypothesis 4.
Occupation will have a significant effect on the key factor of perceived value related to sustainability.
Some studies have shown that income level is positively related to ecologically conscious behaviors, based on the belief that people with a higher income level can afford the higher costs associated with green products and the support of green causes [52,62]. However, other studies noted an insignificant or even negative relationship between income and environmental knowledge, attitude, and behavior [58,59,61]. Based on previous research, we propose the following hypothesis:
Hypothesis 5.
Income level will have a significant effect on the key factor of perceived value related to sustainability.
4. Research Method and Process
4.1. Development of Questionnaire
After the discussion and integration of literature, this study took the results of integration as the structure of questions for the interviews and survey, and then conducted in-depth interviews with four experts from specific professions relating to the study. They were three professors from three top universities in Taiwan and one senior designer from ASUS, one of the leading electronics brands in Taiwan. Their background information is listed below (see Table 3).
A 40-min interview outline was drafted for each of the four experts. The key contents of the interview comprised four parts: correlations between product design and consumer behavior, consumers’ different perceived values, correlations between consumption behavior and environmental influences, and the sustainable development of smartphones. The four experts were invited to share their knowledge, experience, and opinions regarding the topic, and follow-up questions were involved as supplements. The data were collected by recording and were then converted into words. Through open, axial, and selective coding processes, the interview transcripts were summarized, and the core information was extracted as follows: (1) consumers’ perceived value and sustainability awareness should be highly valued in a smartphone’s R & D process; (2) consumers’ perceived value is closely connected with the design, marketing, and service quality of smartphones; (3) if perceived value was considered in product design process, a smartphone’s market competitiveness would increase while consumers’ usage experience would be enhanced; (4) the sustainability endeavor and practice of smartphones could contribute to loyalty to brands.
The formal questionnaire was composed of three parts:
(1) “Basic data”—comprising five items: gender, age, education level, occupation, and income level. Respondents were asked to check the given options.
(2) “Preference order of iPhone”, which was a combination of five questions set to acquire the current usage situation of iPhone and consumers’ sustainable awareness. The questions were as follows: Q1: What are the reasons to buy an iPhone? Q2: What are the reasons to be an iPhone follower? Q3: What are the reasons preventing you from buying an iPhone? Q4: How do you deal with an outdated iPhone? Q5: What is the average usage time for your iPhone? Q1–Q4 were multiple choice questions, while Q5 was a single choice question.
(3) “Consumers’ perceived value and sustainability of iPhone”, which was constructed based on the literature review and expert interviews. This section comprised 37 questions, which were intentionally designed to be related to the sustainability issue. An overall reliability analysis of the 37 questions was conducted to test the reliability and validity of the questionnaire. When the Cronbach’s Alpha is higher than 0.7, the factor being analyzed can be said to be of high reliability [63]. The overall reliability of the questionnaire in this study was 0.976, which indicates that the questionnaire in this study is reliable. These 37 questions were measured on a 5-point Likert scale, ranging from 1 (extremely disagree) to 5 (extremely agree).
4.2. Data Collection
In order to collect data regarding the perceived value of Taiwanese consumers toward Apple’s iPhone, an online questionnaire survey was conducted. Firstly, a pre-test involving 30 volunteers was carried out to test the drafted questionnaire. Then, the modified questionnaire was used for formal testing with 522 participants. Since this study took Apple’s iPhone as an example, the questionnaire was intentionally designed so that participants were required to have had an iPhone usage experience, otherwise some items in the questionnaire could not be successfully answered. Therefore, the final sample size was 522.
4.3. Data Analysis
4.3.1. Factor Analysis
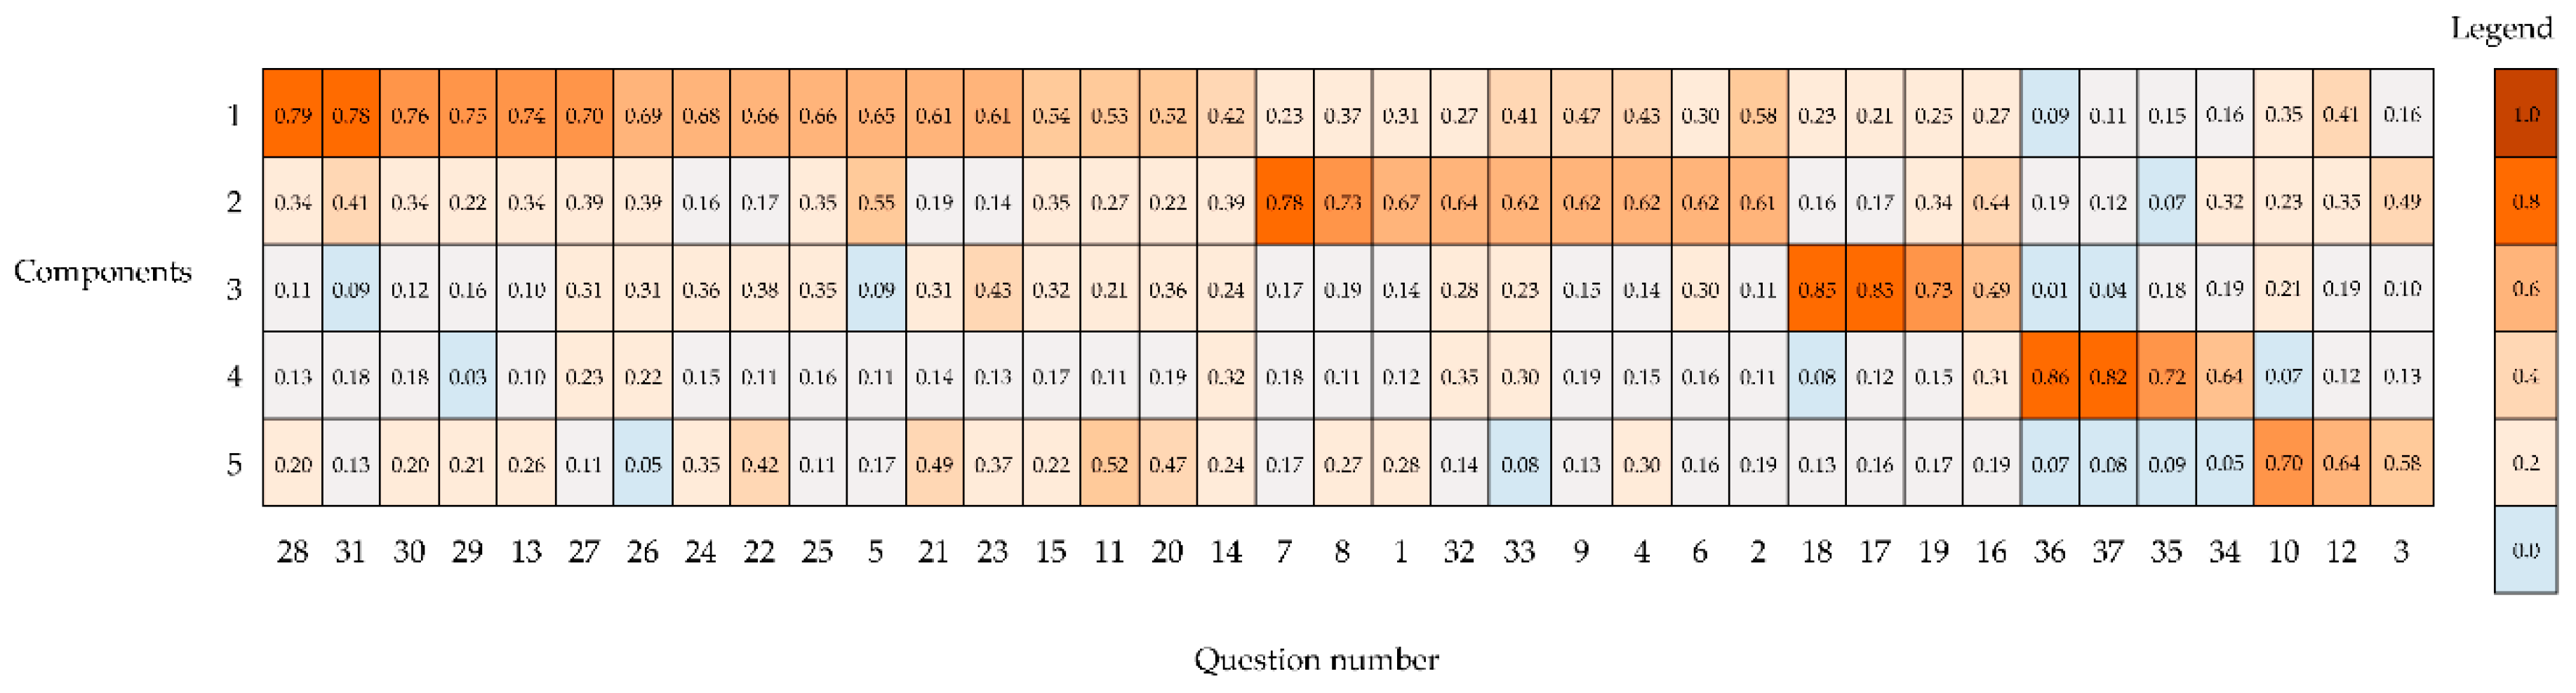
Factor analysis is a scientific method to reduce the complicated dimensions of variables while maintaining most of the original information. Before conducting the extraction process through factor analysis, KMO (Kaiser–Meyer–Olkin) sampling adequacy detection and Bartlett’s tests were conducted to judge whether factor analysis was applicable to the data. As for KMO detection, Kaiser—the inventor—suggests that the value should be between 0 and 1, and the larger the value is, the more common the factors between variables are and the more applicable it is to conduct a factor analysis [64]. The KMO value of the formal questionnaire was 0.971, and the significance by Bartlett’s testing was 0.000. Therefore, factor analysis was applicable to the data. Next, a principal component analysis (PCA) in factor analysis was used to extract common factors out of the 37 variables. Principal component analysis (PCA) is a multivariate technique that analyzes a data table in which observations are described by several inter-correlated quantitative dependent variables [65], and in this study, it could reduce the number of variables considerably while still retaining much of the information in the original data set. Rotation by Varimax was applied for the purpose of satisfying the simple structure and ultimately the factorial invariance criterion [66]. The value after rotation by Varimax was selected as the total variance, and the sum of an eigenvalue greater than 1 was the screening condition. Finally, five factor components were extracted, and the total variance was 71.946% (see Table 4).
4.3.2. Variance Analysis
An independent samples t-test (t-test) and Analysis of Variance (ANOVA) were applied. The t-test is used to compare two groups of samples, while ANOVA is normally used to compare samples with more than two groups. In this study, the t-test was applied to compare the differences between “genders” on the key factor (Hypothesis 1), while one-way ANOVA was applied to compare the differences among “ages”, “education levels”, “occupations”, and “income levels” on the key factor (Hypotheses 2, 3, 4, and 5 respectively).
5. Research Results
5.1. Summarization of Demographic Statistics
The basic demographic data of respondents from the online questionnaire survey was summarized by frequency distribution in the statistical analysis (see Table 5). The results of the numerical analysis and data specifications were as follows:
- With respect to the frequency distribution result of “gender”, most respondents were female, 321 persons in total, accounting for 61%.
- Regarding “age”, the majority of respondents were young people or middle-aged—in total these two groups accounted for almost 90%. They were mostly aged between 21–30 years old, followed by people aged under 20 years old; these two groups accounted for 53% and 34%, respectively. Respondents aged above 50 years were the least common, only accounting for 2%.
- Regarding the “education level”, individuals with university/college degrees made up the largest proportion of the sample, accounting for 76% of respondents; followed by master’s and doctoral degrees, accounting for 14%. Therefore, most respondents were well educated.
- Regarding “occupation”, students took up the largest proportion of the sample in the questionnaire, with 360 persons in total, accounting for 69% of respondents.
- Regarding the “income level”, since most respondents were students, the highest proportion of individuals were earning NTD15,000 and below, accounting for 60% in total; the highest income level, NTD105,001 and above, only accounted for 2% of respondents.
5.2. Consumers’ Basic Perception toward the iPhone
Multiple choice questions were applied to gather consumers’ preference order relevant to iPhone usage sustainability. The results are listed in Table 6.
- In terms of the reasons to buy an iPhone, most confirmed that “it is easy to handle”, which was followed by “attractive appearance”, “fashionable style”, “influenced by surrounding people”, “symbol of status”, “good marketing”, and “good quality”.
- Regarding the reasons to continuously purchase an iPhone, “good quality” was the first consideration, which was followed by “personal preference”, “brand popularity”, “reliable to use”, “good service”, and “compatible with Mac”.
- Regarding the reasons preventing the purchase behavior, the main reason was “economic consideration”, which was followed by “not satisfied with the brand”, “curious to try new brands”, “not get used to the design”, “support native brand”, and “not get used to the system”.
- Regarding the disposal of old iPhones, most respondents chose the response “leave it at home”, which was followed by “give it to others”, “sell it”, “hand to the recycling institution”, and “use as a spare”.
- Regarding the average period to change a new iPhone, most respondents responded “2–4 years”, followed by “1–2 years”, “within one year”, “4–5 years”, and “as long as possible”.
5.3. Factor Analysis of Consumer’s Perceived Value of the iPhone
Five factors were extracted from the consumers’ usage experiences. According to the contents contained, this study named them “recognition” (α = 0.970), “brand advantage” (α = 0.943), “service quality” (α = 0.885), “usage period” (α = 0.816), and “perceived price” (α = 0.798). The following are descriptions of the implications of the five factors (see Table 7):
- Recognition: this factor includes 17 items, covering different aspects of consumers’ instinct comprehensive preferences when purchasing an iPhone. Consumers stated that they are willing to purchase an iPhone at a high price, even though they know it is more expensive than with other brands. They noted that the iPhone deserves the money spent and they will be loyal iPhone followers. They are satisfied with their usage experience and are glad to recommend this particular phone to family and friends. They commented that purchasing an iPhone is a good decision, and they are willing to pay for good service. They noted that this brand considers their needs and is very attractive to them. These items show strong subjective and sentimental preferences towards the iPhone, a heartfelt recognition without any doubt.
- Brand advantage: this factor includes nine items, covering brand advantage through comparisons. Consumers stated that the iPhone has a longer lifecycle, better function and quality, a more recyclable design, a safer system, and improved usage experience. They noted that the brand’s advantages are very important considerations when purchasing.
- Service quality: this factor includes four items, covering service considerations from objective services to mental safety senses. Respondents stated that this brand can offer the required service and fulfill promises in time. They felt assured after purchasing and consider the iPhone to be reliable.
- Usage period: this factor also includes four items, reflecting consumers’ anticipation of a longer usage period. Usage period was shown to be an important consideration, even when purchasing an iPhone. Respondents commented that it is important to use a smartphone for more than two years and that the usage time of smartphones could be prolonged. If an iPhone is broken within two years, they consider its lifetime to be short.
- Perceived price: this factor comprises three items, reflecting consumers’ perception toward price. Some stated that the price of an iPhone is fair, others noted that this phone’s price is worthy of its value, and some even consider that the iPhone should be more expensive to match its perceived high value.
5.4. t-Test and One-Way ANOVA on the Key Factor
Based on the demographic variables and key factors found in previous phases, this study investigated the scoring differences among five variables (gender, age, education level, occupation, and income level) on the key factor. A t-test was used to test the scoring differences between genders on the key factor, and one-way ANOVA was used to test the scoring differences among other variables on the key factor. For the ANOVA, if the F-value is significant, a post hoc Scheffe test was used to find the source of the difference. Statistical significance was set as 0.05.
As shown in Table 8, the scores sorted by gender reached a significance level for “recognition”, “brand advantage”, and “perceived price”, as judged by a p-value of less than 0.05. It was concluded that gender had significant effects on “recognition” (t = −2.602), “brand advantage” (t = −2.365), and “perceived price” (t = −2.336). Females (f) had a higher mean score (M) than males (m) for all three factors, M (f) = 3.35, 3.97, 3.50 and M (m) = 3.16, 3.78, 3.32, respectively. Regarding the “service quality” and “usage period”, the scores did not reach significance levels (p > 0.05), and thus respondents of different genders were not shown to have significantly different perceived values for “service quality” and “usage period”. This result shows that gender significantly influences the key factor (“recognition”, “brand advantage” and “perceived price”) of perceived value. Thus, Hypothesis 1 was supported.
With respect to the influence of age, none of the five age groups (20 years and below, 21–30 years, 31–40 years, 41–50 years, 51 years and above) reached a significance level on the key factor (p > 0.05); hence, no matter how old the respondents were, they did not have significantly different perceived values toward “recognition”, “brand advantage”, “service quality”, “usage period”, or “perceived price” (see Table 9). This result shows that age had no significant effect on the key factor. Thus, Hypothesis 2 was not supported.
Regarding the scores of respondents with different education levels (junior high school, senior high school, university/college, master’s/doctoral), they still did not reach significance (p > 0.05) (see Table 10). Thus, irrespective of the respondents being well educated or not, they did not have significantly different perceived values toward the five key factors. This result shows that education level did not significantly affect the key factor. Thus, Hypothesis 3 was not supported.
As for respondents with different occupations (student, public service, manufacturing, agriculture, commerce, service industry, medical industry, and others), their scores for the five key factors still did not reach significance (p > 0.05) (see Table 11). Thus, respondents with different jobs did not have varying perceived values towards the five key factors. This result shows that occupation had no significant effect on the key factor. Thus, Hypothesis 4 was not supported.
Regarding respondents with different income levels (NTD0–15,000, NTD15,001–30,000, NTD30,001–45,000, NTD45,001–60,000, NTD60,001–75,000, NTD75,001–90,000, NTD90,l001–105,000, NTD105,001 and above), only the score for “perceived price” reached significance (p < 0.05, F = 2.048) (see Table 12). To further find the source of difference, a post hoc Scheffe test was applied. It was found that respondents with an income level of NTD15,001–30,000 (M = 3.44) had a higher perception of “perceived price” than respondents with an income level of NTD30,001–45,000 (M = 3.28). Income levels had a significant effect on the key factor (“perceived price”) of perceived value. Thus, Hypothesis 5 was supported.
6. Discussion
Based on previous work and expert interviews, consumers’ perceived values were extracted and analyzed to aid in the sustainable development of smartphones. Environmental items were taken into consideration. From that, this paper proposes a more sustainable set of perceived values compared with previous dimensions of perceived value.
The key factors are related to previous discovered dimensions of perceived value. Regarding “recognition”, its subjective feature is similar to “emotional value” (see Table 2), but the connotation is richer, covering more diversified considerations, such as quality, price, function, and design of the product. As for “brand advantage”, it describes a sense of superiority based on comparisons with other brands. In this way, this factor is similar to “social value” (see Table 2) because both of them involve making a good impression on other people through comparisons. As for “service quality”, it is similar to “functional value” (see Table 2) because they both put service into an important position. However, “service quality” in this study extends service measurements into reliability and trust-related scales. As for “usage period”, it is connected with “quality value” (see Table 2) in the usage performance of a product. With respect to “perceived price”, it is similar to “price value” (see Table 2), which is measured as the “reasonable price”, “offers value for money”, and “be economical”. However, in this study, “perceived price” not only focuses on economic considerations, but also includes feelings and expectations.
In the second part of the formal questionnaire, we tested “preference orders toward iPhone”, which was a combination of questions used to gather consumers’ basic perceptions toward the iPhone. When comparing the items of “preference order of iPhone” with five extracted key factors, some similarities were found. It was observed that “recognition” and “brand advantage” contained items that are key reasons to purchase an iPhone; “recognition”, “brand advantage”, and “service quality” contained items that are key reasons to be an iPhone follower; and “perceived price” contained items that are key reasons to prevent consumers from buying an iPhone. It can be inferred that “recognition” and “brand advantage” are primary influential factors in purchase motivation; “recognition”, “brand advantage”, and “service quality” are primary influential factors in brand loyalty; “perceived price” is the primary influential factor in purchase intention.
We believe that all five key factors could contribute to the sustainability of smartphones. With “recognition”, consumers would attach to the brand willingly in a sustained status, a key factor for the sustainable development of smartphone brands. It is the hardest, but most rewarding factor for brands to achieve. “Brand advantage” is the result of constant comparisons among brands from the consumer perspective; thus, this factor is a driver for brands to develop. Because social and environmental responsibilities are also used in consumers’ judgments when performing a comparison, sustainable development is an indispensable consideration for brands. As for “service quality”, it is influential on both the sustainable development of smartphone brands as well as the sustainable purchasing mode of consumers, because this factor has been found to be important for consumers in terms of being a brand follower. “Usage period” directly influences the purchasing frequency, and therefore, this element is more connected to the sustainable purchasing mode. “Perceived price” was the most commonly provided reason related to the prevention of consumption and is therefore also a factor that influences consumers’ purchasing modes.
Gender had a significant influence on the key factor of perceived value related to sustainability. Specifically, responses to “recognition”, “brand advantage”, and “perceived price” were significantly different between genders, and females had higher scores than males in all three key factors. This result indicated that males and females have different perceived values toward the iPhone, and that females are more sensitive than males to “recognition”, “brand advantage”, and “perceived price”. This result may be due to sensibility and rationality differences between genders, or “gender role differences” mentioned in previous work [51,52,53,54,55,56].
Income level also significantly affected the key factor of perceived value related to sustainability. Specifically, respondents with low income level (NTD15,001–30,000) had a higher score than respondents with personal income of NTD30,001–45,000 for “perceived price”, which indicates that the price of products is highly valued by low-income-level respondents. This result may be because respondents with a low-income level are more sensitive to price and deliberate more when spending a limited amount of money.
This study found that age, education level, and occupation did not significantly affect the key factor of perceived value related to sustainability. This result may be due to the sample distribution. Most of the respondents were aged below 30-year-old students with a university education level. Therefore, the difference of perceived value toward sustainability of smartphones may not have been obvious due to the limited number of groups.
As for the variability of the factors, “recognition” explained half of it, and the others only explained a few percent. The result may be due to the different features of the items contained in the five key factors. Items in “recognition” were more sophisticated and emotional, while those in the other factors were more direct and rational. Therefore, “recognition” is a comprehensive combination of respondents’ perceived value compared with “brand advantage”, “service quality”, “usage period”, and “perceived price”. This result may relate to the inherent feature of consumers’ perceived value, which contains both emotional and rational factors, while emotional factors have a primary role.
The one-way ANOVA results showed a low degree of difference, partly because the variable categories of perceived value were not distinctive enough to allow clear separations from each other, and they were determined by the vague and unstable feature of perceived value mentioned previously. Therefore, the limited differences found for the result should be highly valued and properly applied.
Some demographic samples had a limited number, such as participants with a junior high school background, in an agricultural occupation, or with an income level of NTD90,001–105,000. With respect to the original data, we still presented these samples in the paper to present an objective and complete analysis.
6.1. Implications
The results indicate that some demographic factors may impact consumers’ perceived value towards the sustainable development of smartphones. This finding may contribute to green market segmentation by smartphone companies by leading to appropriate sustainable marketing strategies. Green market segmentation refers to the process of classifying consumers into segments based on their level of environmental awareness, concerns for, and emotional attachment to the environment [7]. It enables firms to better understand people who care for the environment and to design suitable targeting strategies to attract customers [52,68,69]. Because gender has an impact on “recognition”, “brand advantage”, and “perceived price”, smartphone marketers may make corresponding strategies to satisfy target gender preferences. Females were more easily affected by perceptual factors such as appearance, purchasing experience, and subjective recognition. If their anticipation is satisfied, they are more willing to buy an iPhone, even at a high price, and consider the purchase to be a good deal. Therefore, sentimental purchasing characteristics, such as feelings of well-being, happiness, and satisfaction, should be primary considerations for a green marketing strategy. This result supports the finding of Phau and Ong (2007) that environmentally conscious consumers anticipate intrinsic rewards when they participate in activities that could benefit the environment [70]. Future environmental strategies could focus on how smartphone companies effectively convey such emotional benefits to female consumers.
It was also shown that females tend to make decisions through multiple comparisons, and they enjoy perceived superiority over other brands. Focused on this mentality, companies may consider a market strategy that delivers detailed comparisons on environmentally beneficial product attributes or practices, such as a longer usage period, better recyclable mechanism, or stronger environmental endeavor, to effectively convey a green image and stimulate a favorable perception to females.
Participants with relatively low incomes had more concern regarding the price, and they expected the product to be worthy of its value. It is recommended that smartphone companies highlight the hidden environmental value of the product through green marketing to make consumers perceive the added value from the money spent contributing to environmental protection.
Further, because respondents are used to leaving their outdated cellphones at home after an average 2–4 year usage period, a certain amount of e-waste is gradually generated. Thus, family-based recycle mechanisms could be considered through cooperation of related parties including government, smartphone companies, and communities.
6.2. Limitations
The sample, which was acquired through online questionnaires, had an uneven demographic distribution, with most respondents being students in university aged under 30 years. Thus, the findings may be more suitable to be generalized to the student group. Nonetheless, young people are often highly targeted in consumption contexts due to their growth potential and lifetime value as customers [71]. Moreover, the younger generation may offer significant potential to change marketing practices and consumption habits [72]. Our findings may provide insight into young consumers’ perceptions toward the sustainability of smartphones. A possible direction for expansion of this study is replication with larger samples and more even demographics.
7. Conclusions
Effective green market segmentation is crucial to a successful green marketing. The importance of this study lies in providing approaches and factors which could contribute to the green market segmentation of smartphones by clarifying demographic differences in the key factor of perceived value related to Apple’s iPhone.
Five key factors were extracted based on respondents’ usage experiences with the iPhone—“recognition”, “brand advantage”, “service quality”, “usage period”, and “perceived price”. Based on these previously defined dimensions, the five key factors further complement the meaning and scope of perceived value. “Recognition” is the comprehensive heartfelt preference toward this particular phone brand, a very sentimental and subjective combination factor compared with other factors; “brand advantage” represents the advantage of the brand, implying perceived superiority over other brands; “service quality” is the guarantee that assures consumers and promotes them to continue to use the iPhone, a source of trust and good brand image; “usage period” involves a relatively objective perception toward the iPhone because utility is still a major consideration; “perceived price” is a mental perception and even involves anticipation of the price of the iPhone, an area which is beyond economic concern.
Regarding Hypothesis 1, our results demonstrate that gender has a significant influence on the key factor (“recognition”, “brand advantage”, and “perceived price”) of perceived value related to sustainability. Females have higher perceived values of “recognition”, “brand advantage”, and “perceived price” than males.
However, our results do not support Hypotheses 2, 3, and 4, which means that age, education level, and occupation do not significantly affect the key factor of perceived value related to sustainability.
With regard to Hypothesis 5, our results confirm that income level also significantly affects the key factor (“perceived price”) of perceived value related to sustainability. Respondents with an income level of NTD15,001–30,000 have a higher perceived value of “perceived price” than respondents earning NTD30,001–45,000.
Among the five key factors, “recognition” and “brand advantage” are influential factors on purchase motivation; “recognition”, “brand advantage”, and “service quality” are primary influential factors on brand loyalty; and “perceived price” is an influential factor on purchase intention.
Smartphone marketers are encouraged to make full use of these findings to develop better strategies and decisions with respect to green marketing in Taiwan for sustainable development.
Author Contributions
All authors contributed to the paper. S.-Y.H. collected and organized data, X.-Y.Z. wrote the manuscript with the supervision from J.-C.T., and X.-Y.Z. acted as the corresponding author.
Funding
This research received no external funding.
Acknowledgments
We thank the anonymous reviewers for their valuable comments which significantly improved this manuscript. We also thank Milica Adamović and the editing team of Sustainability for assistance in the publish process.
Conflicts of Interest
The authors declare no conflict of interest.
References
- Wei, Y.P.; Zhu, Y.; Zhuang, Y.X.; Long, G.X. The recycle system for wasted cellphones based on supply chain: Take Nanning city as an example. Tax Paying 2018, 17, 149–151. [Google Scholar]
- The Global Smartphone Investigation by Gartner. Available online: https://www.inside.com.tw/2018/05/31/gartner-smartphone (accessed on 3 October 2018).
- Fehske, A.; Fettweis, G.; Malmodin, J.; Biczok, G. The global footprint of mobile communications: The ecological and economic perspective. IEEE Commun. Mag. 2011, 49, 55–62. [Google Scholar] [CrossRef]
- E-Waste: Environment Killer. Available online: https://www.businesstoday.com.tw/article/category/80394/post/201801150010/ (accessed on 4 October 2018).
- Cui, J.; Zhang, L. Metallurgical recovery of metals from electronic waste: A review. J. Hazard. Mater. 2008, 158, 228–256. [Google Scholar] [CrossRef] [PubMed]
- Wang, J.; Yang, F. Discussions on environmental awareness and consumption behavior. Eng. Technol. Mag. 2016, 9, 242. [Google Scholar]
- Chen, F.Y.; Tu, S.L.; Wang, H.E. Green market segmentation: A case of airline customers in Taiwan. J. Sustain. Dev. 2016, 9, 99–109. [Google Scholar] [CrossRef]
- Adams, M.; Raisborough, J. Making a difference: Ethical consumption and the everyday. Br. J. Sociol. 2010, 61, 256–274. [Google Scholar] [CrossRef] [PubMed]
- Finisterra do Paço, A.M.; Raposo, M.L.B. Green consumer market segmentation: Empirical findings from Portugal. Int. J. Consum. Stud. 2010, 34, 429–436. [Google Scholar] [CrossRef]
- Woodruff, R.B. Customer value: The next source for competitive advantage. J. Acad. Mark. Sci. 1997, 25, 139–153. [Google Scholar] [CrossRef]
- Wang, G.M.; Li, J.X.; Liao, S.X. An empirical analysis of the relationship between personal values, environmental attitude and consumer’s green purchasing behavior. Soft Sci. 2010, 4, 135–140. [Google Scholar]
- Tao, R. The Future of Taiwan’s Electronics Industry. Electron. Eng. Prod. World 2010, 17, 2–4. [Google Scholar]
- The Past and Future of Taiwan Electronic Industry. Available online: https://www.itri.org.tw/chi/Content/NewsLetter/Contents.aspx?&SiteID=1&MmmID=5000&MSID=621302513530161363&PageID=1 (accessed on 11 November 2018).
- News. Available online: https://www.xianjichina.com/news/details_27355.html (accessed on 12 November 2018).
- Children Will Live in a World Full of Garbage. Available online: https://buzzorange.com/techorange/2017/01/16/levels-of-ewaste-soar-in-asia/ (accessed on 12 October 2018).
- Garbage Statistics in Taiwan. Available online: https://stat.epa.gov.tw (accessed on 11 November 2018).
- Huang, Y.F.; Su, Y.; Zhou, J.Z. A research on customer satisfaction and usage time of smartphones. J. Glob. Bus. Oper. Manag. 2017, 9, 37–44. [Google Scholar]
- Top 200 Enterprises in Apple’s Supply Chain. Available online: https://finance.technews.tw/2018/03/09/newest-top-200-apple-suppliers/ (accessed on 12 November 2018).
- Grönroos, C. Value-driven relational marketing: From products to resources and competencies. J. Mark. Manag. 1997, 13, 407–419. [Google Scholar] [CrossRef]
- Zeng, X.Q. A Study on the Impact of Brand Image, Brand Relationship Quality and Customer Perceived Value to Customer Satisfaction and Brand Loyalty—In the Case of HTC Brand Smart Phones. Master’s Thesis, National Cheng Kung University, Tainan, Taiwan, 2010. [Google Scholar]
- Thaler, R. Transaction utility theory. Adv. Consum. Res. 1983, 10, 229–232. [Google Scholar]
- Monroe, K.B.; Krishnan, R. The Effect of Price on Subjective Product Evaluations. In Perceived Quality; Jacoby, J., Olson, J., Eds.; Lexington Books: Lexington, MA, USA, 1985; pp. 209–232. [Google Scholar]
- Zeithaml, V.A. Consumer perceptions of price, quality and value: A means-end model and synthesis of evidence. J. Mark. 1988, 52, 2–22. [Google Scholar] [CrossRef]
- Cravens, D.W.; Holland, C.W.; Lamb, C.W., Jr.; Moncrieff, W.C., III. Marketing’s role in product and service quality. Ind. Mark. Manag. 1988, 17, 285–304. [Google Scholar] [CrossRef]
- Vantrappen, H. Creating customer value by streamlining business processes. Long Range Plan. 1992, 25, 53–62. [Google Scholar] [CrossRef]
- Sweeney, J.C.; Soutar, G.N. Customer perceived value: The development of a multiple item scale. J. Retail. 2001, 77, 203–220. [Google Scholar] [CrossRef]
- Parasuraman, A.; Grewal, D. The impact of technology on the quality-value-loyalty chain: A research agenda. Acad. Mark. Sci. J. 2000, 28, 168–174. [Google Scholar] [CrossRef]
- Cengiz, E.; Kirkbir, F. Customer perceived value: The development of a multiple item scale in hospitals. Probl. Perspect. Manag. 2007, 5, 252–267. [Google Scholar]
- Sheth, J.N.; Newman, B.I.; Gross, B.L. Why we buy what we buy: A theory of consumption values. J. Bus. Res. 1991, 22, 159–170. [Google Scholar] [CrossRef]
- Sánchez, J.; Callarisa, L.; Rodríguez, R.M.; Moliner, M.A. Perceived value of the purchase of a tourism product. Tour. Manag. 2006, 27, 394–409. [Google Scholar] [CrossRef]
- De Ruyter, K.; Wetzels, M.; Lemmink, J.; Mattson, J. The dynamics of the service delivery process: A value-based approach. Int. J. Res. Mark. 1997, 14, 231–243. [Google Scholar] [CrossRef]
- Otto, J.E.; Ritchie, J.R.B. The service experience in tourism. Tour. Manag. 1996, 17, 165–174. [Google Scholar] [CrossRef]
- Otto, J.E. The Role of the Affective Experience in the Service Experience Chain. Ph.D. Thesis, University of Calgary, Calgary, AB, Canada, 1997, unpublished. [Google Scholar]
- Gallarza, M.G.; Gil Saura, I. Value dimensions, perceived value, satisfaction and loyalty: An investigation of university students’ travel behaviour. Tour. Manag. 2006, 27, 437–452. [Google Scholar] [CrossRef]
- Quade, M.; Leimstoll, U. Perceived value of smartphones and tablets for mobile business in small and medium enterprises. Int. J. Netw. Virtual Org. 2017, 17, 317. [Google Scholar] [CrossRef]
- McNeill, L.S.; Fam, K.S.; Chung, K. Applying transaction utility theory to sales promotion—The impact of culture on consumer satisfaction. Int. Rev. Retail Dis. Consum. Res. 2014, 24, 166–185. [Google Scholar] [CrossRef]
- Ralston, R.W. The effects of customer service, branding, and price on the perceived value of local telephone service. J. Bus. Res. 2003, 56, 201–213. [Google Scholar] [CrossRef]
- Newton, M.; Johnson, J.; Pfahl, R.C., Jr. Results from the 2004 iNEMI Environmentally Conscious Electronics (ECE) roadmap. In Proceedings of the 2005 IEEE International Symposium on Electronics and the Environment, New Orleans, LA, USA, 16–19 May 2005. [Google Scholar]
- Sustainable Development Goals. Available online: https://sustainabledevelopment.un.org/sdgs (accessed on 12 October 2017).
- Scharnhorst, W.; Althaus, H.J.; Classen, M.; Jolliet, O.; Hilty, L.M. The end of life treatment of second generation mobile phone networks: Strategies to reduce the environmental impact. Environ. Impact Assess. 2005, 25, 540–566. [Google Scholar] [CrossRef]
- Paiano, A.; Lagioia, G.; Cataldo, A. A critical analysis of the sustainability of mobile phone use. Resour. Conserv. Recycl. 2013, 73, 162–171. [Google Scholar] [CrossRef]
- Schneider, A.F.; Matinfar, S.; Grua, E.M.; Casado-Mansilla, D.; Cordewener, L. Towards a sustainable business model for smartphones: Combining product-service systems with modularity. In EPiC Series in Computing, Proceedings of 5th International Conference on Information and Communication Technology for Sustainability, Toronto, Canada, 14–18 May 2018; Penzenstadler, B., Easterbrook, S., Venters, C., Ahmed, S.I., Eds.; MORElab: Bilbao, Spain; Volume 52, pp. 82–99.
- Saura, J.; Reyes-Menendez, A.; Alvarez-Alonso, C. Do online comments affect environmental management? Identifying factors related to environmental management and sustainability of hotels. Sustainability 2018, 10, 3016. [Google Scholar] [CrossRef]
- Moyle, C.; Moyle, B.; Ruhanen, L.; Bec, A.; Weiler, B. Business sustainability: How does tourism compare? Sustainability 2018, 10, 968. [Google Scholar] [CrossRef]
- Finisterra Do Paço, A.M.; Raposo, M.L.B.; Filho, W.L. Identifying the green consumer: A segmentation study. J. Target. Meas. Anal. Mark. 2009, 17, 17–25. [Google Scholar] [CrossRef] [Green Version]
- Liao, J.X. An Investigative Study of Consumers’ Cognition of Green Products and Consumption Behaviors in Taiwan. Master’s Thesis, National Kaohsiung Normal University, Kaohsiung, Taiwan, 2003. [Google Scholar]
- Durand, S.; Marchand, N. Fully discrete control scheme of the energy-performance tradeoff in embedded electronic devices. In Proceedings of the 18th IFAC World Congress, Milan, Italy, 28 August–2 September 2011. [Google Scholar]
- Falvo, M.C.; Foiadelli, F. Preliminary analysis for the design of an energy-efficient and environmental sustainable integrated mobility system. In Proceedings of the IEEE PES General Meeting, Providence, RI, USA, 25–29 July 2010. [Google Scholar]
- McCarthy, J.E. Recycling Computers and Electronic Equipment: Legislative and Regulatory Approaches for “E-Waste”; Congressional Research Service Reports; Library of Congress, Congressional Research Service: Washington, DC, USA, 2002. [Google Scholar]
- Jain, S.K.; Kaur, G. Role of socio-demographics in segmenting and profiling green consumers: An exploratory study of consumers in India. J. Int. Consum. Mark. 2006, 18, 107–146. [Google Scholar] [CrossRef]
- Diamantopoulos, A.; Schlegelmilch, B.B.; Sinkovics, R.R.; Bohlen, G.M. Can socio-demographics still play a role in profiling green consumers? A review of the evidence and an empirical investigation. J. Bus. Res. 2003, 56, 465–480. [Google Scholar] [CrossRef]
- Straughan, R.O.; Roberts, J.A. Environmental segmentation alternatives: A look at green consumer behavior in the new millennium. J. Consum. Mark. 1999, 16, 558–575. [Google Scholar] [CrossRef]
- Arcury, T.A.; Scollay, S.J.; Johnson, T.P. Sex differences in environmental concern and knowledge: The case of acid rain. Sex Roles 1987, 16, 463–472. [Google Scholar] [CrossRef]
- Zelezny, L.C.; Chua, P.P.; Aldrich, C. Elaborating on gender differences in environmentalism. J. Soc. Issues 2000, 56, 443–457. [Google Scholar] [CrossRef]
- Lee, K. Making environmental communications meaningful to female adolescents—A study in Hong Kong. Sci. Commun. 2008, 30, 147–176. [Google Scholar] [CrossRef]
- Shrum, L.J.; McCarthy, J.A.; Lowrey, T.M. Buyer characteristics of the green consumers and their implications for advertising strategy. J. Advert. 1995, 24, 71–90. [Google Scholar] [CrossRef]
- Lee, K. Opportunities for green marketing: Young consumers. Mark. Intell. Plan. 2008, 26, 573–586. [Google Scholar] [CrossRef]
- Roberts, J.A. Green consumers in the 1990s: Profile and implications for advertising. J. Bus. Res. 1996, 36, 217–231. [Google Scholar] [CrossRef]
- Samdahl, M.D.; Robertson, R. Social determinants of environmental concern: Specification and test of the model. Environ. Behav. 1989, 21, 57–81. [Google Scholar] [CrossRef]
- Balderjahn, I. Personality variables and environmental attitudes as predictors of ecologically responsible consumption patterns. J. Bus. Res. 1988, 17, 51–56. [Google Scholar] [CrossRef]
- Van Liere, K.D.; Dunlap, R.E. Environmental concern: Does it make a difference how it’s measured? Environ. Behav. 1981, 13, 651–676. [Google Scholar] [CrossRef]
- Chan, K. Market segmentation of green consumers in Hong Kong. J. Int. Consum. Market. 1999, 12, 7–24. [Google Scholar] [CrossRef]
- Guilford, J.P. Psychometric Methods, 2nd ed.; McGraw-Hill Book Company: New York, NY, USA, 1954; ISBN 9781462524778. [Google Scholar]
- Kaiser, H.F. An index of factorial simplicity. Psychometrika 1974, 39, 31–36. [Google Scholar] [CrossRef]
- Abdi, H.; Williams, L.J. Principal component analysis. Wiley Interdiscip. Rev. Comput. Stat. 2010, 2, 433–459. [Google Scholar] [CrossRef] [Green Version]
- Kaiser, H.F. The varimax criterion for analytic rotation in factor analysis. Psychometrika 1958, 23, 187–200. [Google Scholar] [CrossRef]
- Hair, J.F.; Anderson, R.E.; Tatham, R.L.; Black, W.C. Multivariate Data Analysis, 5th ed.; Macmillan: New York, NY, USA, 1998; ISBN 978-0138948580. [Google Scholar]
- Paço, A.; Raposo, M. “Green” segmentation: An application to the Portuguese consumer market. Mark. Intell. Plan. 2009, 27, 364–379. [Google Scholar] [CrossRef]
- Laroche, M.; Bergeron, J.; Barbaro-Forleo, G. Targeting consumers who are willing to pay more for environmentally friendly products. J. Consum. Mark. 2001, 18, 503–520. [Google Scholar] [CrossRef]
- Phau, I.; Ong, D. An investigation of the effects of environmental claims in promotional messages for clothing brands. Mark. Intell. Plan. 2007, 25, 772–788. [Google Scholar] [CrossRef]
- Kim, Y.J.; Yoon, H.J. Predicting green advertising attitude and behavioral intention in South Korea. Soc. Behav. Personal. 2017, 45, 1345–1364. [Google Scholar] [CrossRef]
- Five Tips for Marketing to College Students. Available online: https://bit.ly/2eW7yV2 (accessed on 16 November 2018).
Figure 1.
Heatmap after rotation of the Principal Component Analysis (PCA) of the questionnaire.


Table 1.
World ranking of Taiwan’s electronic devices 1.
| Item | Output Value 2 | World Ranking | World Market Share |
|---|---|---|---|
| Laptop | 573.1 | 1 | 92% |
| Large liquid crystal display screen | 301.6 | 2 | 42% |
| Liquid crystal display | 164.8 | 1 | 69% |
| Wafer foundry | 141.9 | 1 | 69% |
| Integrated circuit design | 119 | 1 | 28% |
| Integrated circuit packaging test | 101 | 1 | 51% |
| Printed circuit board | 97.5 | 1 | 24% |
| Small liquid crystal display screen | 49.1 | 2 | 24% |
| Dynamic random-access memory | 49 | 2 | 20% |
| Mother board | 46.1 | 1 | 94% |
| Digital camera | 34 | 1 | 40% |
1 The information was presented in 2010; 2 Unit: hundred million US dollars (Source: [12]).
Table 2.
Multi-dimensions of perceived value.
| Dimensions | Definition | Measurements |
|---|---|---|
| Quality value | The utility derived from the perceived quality and expected performance of the product. | It has consistent quality; it is well made; it has an acceptable standard of quality; it would perform consistently. |
| Emotional value | The utility derived from the feelings or affective states that a product generates; the utility acquired from an alternative’s capacity to arouse feelings or affective states. | It would make me want to use it; it is one that I would feel relaxed about using; it would make me feel good; it would give me pleasure; it is something new and different; I want to share the experience with others afterwards. |
| Price value | The utility derived from the product due to the reduction of its perceived short and longer-term costs. | It is reasonably priced; it offers value for money; it is a good product for the price; it would be economical. |
| Social value | The utility derived from the product’s ability to enhance social self-concept; the utility acquired from an alternative’s association with one or more specific social groups. | It would help me to feel acceptable; it would improve the way I am perceived; it would make a good impression on other people; it would give its owner social approval. |
| Functional value | The perceived utility acquired from an alternative’s capacity for functional, utilitarian, or physical performance. | It has good functions; it is serviced in a timely manner; it has approachable, courteous, and polite employees, who are easy to contact. |
Table 3.
Background information of the experts.
| Code | Name | Professional Background | Specialty |
|---|---|---|---|
| P-Y | Professor Y | PhD, professor at the National Taiwan University of Science and Technology | Environmental engineering study |
| P-H | Professor H | PhD, professor at the National Taipei University of Technology | Enterprise sustainable management study |
| P-Z | Professor Z | PhD, professor at the National Yunlin University of Science and Technology | Brand development study |
| D-X | Designer X | Senior designer at ASUS | Electronics design practice |
Table 4.
Total variance explained.
| Component | Extraction Sums of Squared Loadings | ||
|---|---|---|---|
| Total | % of Variance | Cumulative % | |
| 1 | 20.145 | 54.446 | 54.446 |
| 2 | 2.296 | 6.205 | 60.651 |
| 3 | 1.781 | 4.814 | 65.465 |
| 4 | 1.376 | 3.719 | 69.184 |
| 5 | 1.022 | 2.762 | 71.946 |
Extraction Method: Principal Component Analysis.
Table 5.
Basic demographic data of respondents.
| Demographic Variables | Number | Percent | Cumulative Percent | |
|---|---|---|---|---|
| Gender | Female | 321 | 61.49% | 61.49% |
| Male | 201 | 38.51% | 100.00% | |
| Age | 20 years and below | 179 | 34.29% | 34.29% |
| 21–30 years | 279 | 53.45% | 87.74% | |
| 31–40 years | 35 | 6.70% | 94.44% | |
| 41–50 years | 17 | 3.26% | 97.70% | |
| 51 years and above | 12 | 2.30% | 100.00% | |
| Education level | Junior high school | 3 | 0.57% | 0.57% |
| Senior high school | 47 | 9.00% | 9.58% | |
| University/college | 397 | 76.05% | 85.63% | |
| Master’s and doctoral | 75 | 14.37% | 100.00% | |
| Occupation | Student | 360 | 68.97% | 68.97% |
| Public service | 24 | 4.60% | 73.56% | |
| Manufacturing | 45 | 8.62% | 82.18% | |
| Agriculture | 2 | 0.38% | 82.57% | |
| Commerce | 23 | 4.41% | 86.97% | |
| Service industry | 44 | 8.43% | 95.40% | |
| Medical industry | 9 | 1.72% | 97.13% | |
| Others | 15 | 2.87% | 100.00% | |
| Income level (NTD/per person/per month) | 0–15,000 | 312 | 59.77% | 59.77% |
| 15,001–30,000 | 99 | 18.97% | 78.74% | |
| 30,001–45,000 | 59 | 11.30% | 90.04% | |
| 45,001–60,000 | 24 | 4.60% | 94.64% | |
| 60,001–75,000 | 13 | 2.49% | 97.13% | |
| 75,001–90,000 | 5 | 0.96% | 98.08% | |
| 90,001–105,000 | 2 | 0.38% | 98.47% | |
| 105,001 and above | 8 | 1.53% | 100.00% | |
Table 6.
Basic perceptions of the iPhone.
| Questions | Ranking and Votes Number | ||||||
|---|---|---|---|---|---|---|---|
| 1 | 2 | 3 | 4 | 5 | 6 | 7 | |
| What are the reasons to buy an iPhone? * | Easy to handle (330) | Attractive appearance (207) | Fashionable style (118) | Influenced by surrounding people (100) | A symbol of status (68) | Good marketing (62) | Good quality (25) |
| What are the reasons to be an iPhone follower? * | Good quality (398) | Personal preference (199) | Brand popularity (174) | Reliable to use (173) | Good service (115) | Compatible with Mac (3) | |
| What are the reasons preventing you from buying an iPhone? * | Economic consideration (538) | Not satisfied with the brand (132) | Curious to try new brands (21) | Not used to the design (15) | Support native brand (2) | Not used to the system (2) | |
| How do you deal with an outdated iPhone? * | Leave it at home (355) | Give it to others (228) | Sell it (171) | Hand to the recycling institution (119) | Use as a spare (12) | ||
| What is the average usage time for your iPhone? | 2–4 years (277) | 1–2 years (125) | Within one year (67) | 4–5 years (36) | As long as possible (17) | ||
Note: * multiple choice question.
Table 7.
Factor loadings of five factors.
| Factor | Name | Contents | Factor Loadings |
|---|---|---|---|
| 1 | Recognition (Cronbach’s α = 0.970) | 28. I am glad to buy an iPhone at a high price | 0.794 |
| 31. I will purchase the iPhone again in the future | 0.781 | ||
| 30. I will recommend the iPhone to my family and friends | 0.761 | ||
| 29. I am a loyal customer of the Apple brand | 0.749 | ||
| 13. I would still choose an iPhone even if it was more expensive than other brands | 0.744 | ||
| 27. I always think purchasing an iPhone is a good decision | 0.704 | ||
| 26. I am satisfied with the iPhone’s usage experience | 0.687 | ||
| 24. I think devotion to the iPhone is worthwhile | 0.677 | ||
| 22. I consider the iPhone to be worthy of its price | 0.662 | ||
| 25. I enjoy the purchasing experience | 0.660 | ||
| 5. I am willing to buy another iPhone when the old one is broken | 0.654 | ||
| 21. I think it is worth buying an iPhone | 0.613 | ||
| 23. I believe it is acceptable to wait for the new type of iPhone for a long period | 0.609 | ||
| 15. I think the iPhone considers my needs | 0.537 | ||
| 11. I am willing to pay for good service | 0.531 | ||
| 20. I think the iPhone is worth more than its price | 0.521 | ||
| 14. I think the iPhone is attractive | 0.424 | ||
| 2 | Brand advantage (Cronbach’s α = 0.943) | 7. I think the iPhone has a longer lifetime than other brands | 0.781 |
| 8. I consider that the function of the iPhone to be better than other brands | 0.726 | ||
| 1. I think the quality of iPhones is better than that of other brands | 0.670 | ||
| 32. I believe that iPhones are more recyclable than other brands | 0.643 | ||
| 33. I feel that I will use an iPhone longer than other brands | 0.620 | ||
| 9. I would still choose an iPhone if price was not a consideration | 0.619 | ||
| 4. I think the design of the iPhone is better than other brands | 0.616 | ||
| 6. I think iPhones have a safer system | 0.615 | ||
| 2. I consider that the iPhone provides a better usage experience | 0.607 | ||
| 3 | Service quality (Cronbach’s α = 0.885) | 18. I think Apple could provide an in-time service | 0.852 |
| 17. I believe that Apple is committed to its promises | 0.830 | ||
| 19. I think Apple products are safer to use | 0.727 | ||
| 16. I consider iPhones to be reliable | 0.485 | ||
| 4 | Usage period (Cronbach’s α = 0.816) | 36. I think it is important to use a phone for more than two years | 0.864 |
| 37. I believe that the usage time of smartphones could be prolonged | 0.822 | ||
| 35. I consider that a smartphone’s lifetime is short if it is broken within two years | 0.716 | ||
| 34. I think usage period is an important consideration | 0.638 | ||
| 5 | Perceived price (Cronbach’s α = 0.798) | 10. I consider the price of iPhones to be fair | 0.696 |
| 12. I believe that the iPhone’s price is worthy of its value | 0.635 | ||
| 3. I think the iPhone should be more expensive than other brands | 0.578 |
Table 8.
t-test of gender on key factors.
| Factors | Gender | Number (N) | Mean (M) | Standard Deviation (SD) | T-Value | p-Value |
|---|---|---|---|---|---|---|
| Recognition | Male | 201 | 3.1572 | 0.8849 | −2.602 * | 0.010 |
| Female | 321 | 3.3507 | 0.7253 | |||
| Brand advantage | Male | 201 | 3.7805 | 0.9820 | −2.365 * | 0.019 |
| Female | 321 | 3.9720 | 0.7499 | |||
| Service quality | Male | 201 | 3.7164 | 0.8477 | −0.638 | 0.524 |
| Female | 321 | 3.7617 | 0.6830 | |||
| Usage period | Male | 201 | 4.0920 | 0.6993 | −0.368 | 0.716 |
| Female | 321 | 4.1153 | 0.7038 | |||
| Perceived price | Male | 201 | 3.3217 | 0.9518 | −2.336 * | 0.020 |
| Female | 321 | 3.5016 | 0.6745 |
Note: * p < 0.05.
Table 9.
ANOVA of age on key factors.
| Factors | Age | N | M | SD | F-Value | p-Value |
|---|---|---|---|---|---|---|
| Recognition | (1) 20 years and below | 179 | 3.2688 | 0.8222 | 0.458 | 0.766 |
| (2) 21–30 years | 279 | 3.2745 | 0.7903 | |||
| (3) 31–40 years | 35 | 3.3899 | 0.6938 | |||
| (4) 41–50 years | 17 | 3.0865 | 0.7205 | |||
| (5) 51 years and above | 12 | 3.3627 | 0.9431 | |||
| Brand advantage | (1) 20 years and below | 179 | 3.9162 | 0.8272 | 0.881 | 0.475 |
| (2) 21–30 years | 279 | 3.8678 | 0.8850 | |||
| (3) 31–40 years | 35 | 4.1333 | 0.6655 | |||
| (4) 41–50 years | 17 | 3.8105 | 0.8125 | |||
| (5) 51 years and above | 12 | 3.7778 | 0.9368 | |||
| Service quality | (1) 20 years and below | 179 | 3.7709 | 0.7625 | 1.839 | 0.120 |
| (2) 21–30 years | 279 | 3.7518 | 0.7290 | |||
| (3) 31–40 years | 35 | 3.7571 | 0.8100 | |||
| (4) 41–50 years | 17 | 3.2647 | 0.8075 | |||
| (5) 51 years and above | 12 | 3.8125 | 0.6836 | |||
| Usage period | (1) 20 years and below | 179 | 4.0782 | 0.7525 | 1.396 | 0.234 |
| (2) 21–30 years | 279 | 4.0923 | 0.6767 | |||
| (3) 31–40 years | 35 | 4.2857 | 0.6158 | |||
| (4) 41–50 years | 17 | 4.0294 | 0.8191 | |||
| (5) 51 years and above | 12 | 4.4375 | 0.4146 | |||
| Perceived price | (1) 20 years and below | 179 | 3.4376 | 0.8105 | 0.536 | 0.709 |
| (2) 21–30 years | 279 | 3.4158 | 0.8194 | |||
| (3) 31–40 years | 35 | 3.5619 | 0.4767 | |||
| (4) 41–50 years | 17 | 3.2745 | 0.7568 | |||
| (5) 51 years and above | 12 | 3.5833 | 0.9003 |
Table 10.
ANOVA of education level on key factors.
| Factors | Education Level | N | M | SD | F-Value | p-Value |
|---|---|---|---|---|---|---|
| Recognition | (1) Junior high school | 3 | 3.1961 | 1.3379 | 0.927 | 0.427 |
| (2) Senior high school | 47 | 3.2303 | 0.8546 | |||
| (3) University/College | 397 | 3.2557 | 0.8089 | |||
| (4) Master’s and doctoral | 75 | 3.4165 | 0.6526 | |||
| Brand advantage | (1) Junior high school | 3 | 3.7037 | 1.5126 | 2.059 | 0.105 |
| (2) Senior high school | 47 | 3.8747 | 0.7991 | |||
| (3) University/College | 397 | 3.8603 | 0.8842 | |||
| (4) Master’s and doctoral | 75 | 4.1215 | 0.6299 | |||
| Service quality | (1) Junior high school | 3 | 3.5000 | 1.8028 | 0.748 | 0.524 |
| (2) Senior high school | 47 | 3.8723 | 0.7624 | |||
| (3) University/College | 397 | 3.7229 | 0.7528 | |||
| (4) Master’s and doctoral | 75 | 3.7867 | 0.6812 | |||
| Usage period | (1) Junior high school | 3 | 3.7500 | 1.5207 | 1.506 | 0.212 |
| (2) Senior high school | 47 | 4.1223 | 0.8240 | |||
| (3) University/College | 397 | 4.0800 | 0.6893 | |||
| (4) Master’s and doctoral | 75 | 4.2500 | 0.6380 | |||
| Perceived price | (1) Junior high school | 3 | 3.2222 | 1.6443 | 2.243 | 0.082 |
| (2) Senior high school | 47 | 3.3688 | 0.8023 | |||
| (3) University/College | 397 | 3.4005 | 0.8179 | |||
| (4) Master’s and doctoral | 75 | 3.6489 | 0.6000 |
Table 11.
ANOVA of occupation on the key factor.
| Factors | Occupation | N | M | SD | F Value | p Value |
|---|---|---|---|---|---|---|
| Recognition | (1) Student | 360 | 3.2938 | 0.8058 | 0.426 | 0.886 |
| (2) Public service | 24 | 3.1887 | 0.9539 | |||
| (3) Manufacturing | 45 | 3.1399 | 0.6942 | |||
| (4) Agriculture | 2 | 3.3529 | 0.5823 | |||
| (5) Commerce | 23 | 3.2839 | 0.8350 | |||
| (6) Service industry | 44 | 3.2995 | 0.7529 | |||
| (7) Medical industry | 9 | 3.5229 | 0.4756 | |||
| (8) Others | 15 | 3.1647 | 0.8706 | |||
| Brand advantage | (1) Student | 360 | 3.8917 | 0.8880 | 0.495 | 0.839 |
| (2) Public service | 24 | 3.6574 | 0.9708 | |||
| (3) Manufacturing | 45 | 3.9407 | 0.6773 | |||
| (4) Agriculture | 2 | 3.8333 | 0.2357 | |||
| (5) Commerce | 23 | 3.8937 | 0.8372 | |||
| (6) Service industry | 44 | 3.9773 | 0.6297 | |||
| (7) Medical industry | 9 | 4.1852 | 0.6597 | |||
| (8) Others | 15 | 3.9259 | 0.9953 | |||
| Service quality | (1) Student | 360 | 3.7764 | 0.7559 | 1.063 | 0.386 |
| (2) Public service | 24 | 3.7188 | 0.8448 | |||
| (3) Manufacturing | 45 | 3.4611 | 0.7150 | |||
| (4) Agriculture | 2 | 3.7500 | 0.3536 | |||
| (5) Commerce | 23 | 3.7500 | 0.7111 | |||
| (6) Service industry | 44 | 3.7500 | 0.7606 | |||
| (7) Medical industry | 9 | 3.8889 | 0.6264 | |||
| (8) Others | 15 | 3.7500 | 0.6409 | |||
| Usage period | (1) Student | 360 | 4.0931 | 0.7215 | 0.565 | 0.330 |
| (2) Public service | 24 | 4.1146 | 0.8109 | |||
| (3) Manufacturing | 45 | 4.0667 | 0.6427 | |||
| (4) Agriculture | 2 | 3.0000 | 1.4142 | |||
| (5) Commerce | 23 | 4.0761 | 0.6503 | |||
| (6) Service industry | 44 | 4.2273 | 0.5494 | |||
| (7) Medical industry | 9 | 4.3333 | 0.5303 | |||
| (8) Others | 15 | 4.2333 | 0.6371 | |||
| Perceived price | (1) Student | 360 | 3.4593 | 0.8124 | 0.586 | 0.489 |
| (2) Public service | 24 | 3.1667 | 0.9428 | |||
| (3) Manufacturing | 45 | 3.3481 | 0.7070 | |||
| (4) Agriculture | 2 | 3.1667 | 0.7071 | |||
| (5) Commerce | 23 | 3.6087 | 0.7010 | |||
| (6) Service industry | 44 | 3.3864 | 0.7807 | |||
| (7) Medical industry | 9 | 3.6296 | 0.6550 | |||
| (8) Others | 15 | 3.2444 | 0.6722 |
Table 12.
ANOVA of income level on key factors.
| Factors | Income Level (NTD/per Person/per Month) | N | M | SD | F-Value | p-Value | Post Hoc |
|---|---|---|---|---|---|---|---|
| Recognition | (1) 0–15,000 | 312 | 3.2291 | 0.7849 | 1.424 | 0.193 | |
| (2) 15,001–30,000 | 99 | 3.3607 | 0.8134 | ||||
| (3) 30,001–45,000 | 59 | 3.2443 | 0.8460 | ||||
| (4) 45,001–60,000 | 24 | 3.4926 | 0.7720 | ||||
| (5) 60,001–75,000 | 13 | 3.1448 | 0.7353 | ||||
| (6) 75,001–90,000 | 5 | 3.9059 | 0.6676 | ||||
| (7) 90,001–105,000 | 2 | 2.7353 | 0.2912 | ||||
| (8) 105,001 and above | 8 | 3.6103 | 0.6888 | ||||
| Brand advantage | (1) 0–15,000 | 312 | 3.8486 | 0.8624 | 1.312 | 0.242 | |
| (2) 15,001–30,000 | 99 | 3.9315 | 0.7942 | ||||
| (3) 30,001–45,000 | 59 | 3.9134 | 0.9262 | ||||
| (4) 45,001–60,000 | 24 | 4.1343 | 0.8822 | ||||
| (5) 60,001–75,000 | 13 | 3.9402 | 0.6948 | ||||
| (6) 75,001–90,000 | 5 | 4.5778 | 0.4932 | ||||
| (7) 90,001–105,000 | 2 | 3.2222 | 0.1571 | ||||
| (8) 105,001 and above | 8 | 4.2778 | 0.6719 | ||||
| Service quality | (1) 0–15,000 | 312 | 3.7508 | 0.6967 | 1.496 | 0.166 | |
| (2) 15,001–30,000 | 99 | 3.7778 | 0.7929 | ||||
| (3) 30,001–45,000 | 59 | 3.5975 | 0.9389 | ||||
| (4) 45,001–60,000 | 24 | 3.7292 | 0.6912 | ||||
| (5) 60,001–75,000 | 13 | 3.5577 | 0.8111 | ||||
| (6) 75,001–90,000 | 5 | 4.6000 | 0.5184 | ||||
| (7) 90,001–105,000 | 2 | 4.0000 | 0.0000 | ||||
| (8) 105,001 and above | 8 | 3.9063 | 0.7312 | ||||
| Usage period | (1) 0–15,000 | 312 | 4.0761 | 0.7276 | 0.989 | 0.438 | |
| (2) 15,001–30,000 | 99 | 4.0556 | 0.6715 | ||||
| (3) 30,001–45,000 | 59 | 4.1780 | 0.7223 | ||||
| (4) 45,001–60,000 | 24 | 4.3750 | 0.5161 | ||||
| (5) 60,001–75,000 | 13 | 4.3462 | 0.5998 | ||||
| (6) 75,001–90,000 | 5 | 4.1500 | 0.7826 | ||||
| (7) 90,001–105,000 | 2 | 4.0000 | 0.0000 | ||||
| (8) 105,001 and above | 8 | 4.1875 | 0.3720 | ||||
| Perceived price | (1) 0–15,000 | 312 | 3.4199 | 0.7775 | 2.048 * | 0.048 | 2 > 3 |
| (2) 15,001–30,000 | 99 | 3.4444 | 0.8330 | ||||
| (3) 30,001–45,000 | 59 | 3.2825 | 0.8550 | ||||
| (4) 45,001–60,000 | 24 | 3.8056 | 0.7218 | ||||
| (5) 60,001–75,000 | 13 | 3.3846 | 0.7051 | ||||
| (6) 75,001–90,000 | 5 | 4.2000 | 0.5055 | ||||
| (7) 90,001–105,000 | 2 | 2.6667 | 0.4714 | ||||
| (8) 105,001 and above | 8 | 3.5417 | 0.7754 |
Note: * p < 0.05.
© 2018 by the authors. Licensee MDPI, Basel, Switzerland. This article is an open access article distributed under the terms and conditions of the Creative Commons Attribution (CC BY) license (http://creativecommons.org/licenses/by/4.0/).
Share and Cite
MDPI and ACS Style
Tu, J.-C.; Zhang, X.-Y.; Huang, S.-Y. Key Factors of Sustainability for Smartphones Based on Taiwanese Consumers’ Perceived Values. Sustainability 2018, 10, 4446. https://0-doi-org.brum.beds.ac.uk/10.3390/su10124446
AMA Style
Tu J-C, Zhang X-Y, Huang S-Y. Key Factors of Sustainability for Smartphones Based on Taiwanese Consumers’ Perceived Values. Sustainability. 2018; 10(12):4446. https://0-doi-org.brum.beds.ac.uk/10.3390/su10124446
Chicago/Turabian StyleTu, Jui-Che, Xiu-Yue Zhang, and Sin-Yi Huang. 2018. "Key Factors of Sustainability for Smartphones Based on Taiwanese Consumers’ Perceived Values" Sustainability 10, no. 12: 4446. https://0-doi-org.brum.beds.ac.uk/10.3390/su10124446
Note that from the first issue of 2016, this journal uses article numbers instead of page numbers. See further details here.