Article

Towards Sustainable Urban Communities: A Composite Spatial Accessibility Assessment for Residential Suitability Based on Network Big Data

1
Key Laboratory of Urban Environment and Health, the Institute of the Urban Environment, Chinese Academy of Sciences, Xiamen 361021, China
2
University of Chinese Academy of Sciences, Beijing 100049, China
3
School of Architecture, Huaqiao University, Xiamen 361021, China
*
Authors to whom correspondence should be addressed.
Sustainability 2018, 10(12), 4767; https://0-doi-org.brum.beds.ac.uk/10.3390/su10124767
Submission received: 22 October 2018 / Revised: 8 December 2018 / Accepted: 10 December 2018 / Published: 13 December 2018
(This article belongs to the Special Issue Big Data Research for Social Sciences and Social Impact)

Abstract

:
Suitable allocation of residential public services is vital to realizing sustainable communities and cities. By combining network big data and spatial analysis, we developed a composite spatial accessibility assessment method for residential suitability of urban public services covering healthcare, leisure, commerce, transportation, and education services. Xiamen City, China is the test site. We found that although most facilities were concentrated on Xiamen Island, there were shortages in the per capita transportation and education service supplements compared with the average performance of Xiamen City because of the high local population. Meanwhile, Tong’an had advantages in the amount of public facilities due to its long history of regional development. However, high-quality facilities were deficient there as well as in other off-island districts. The residential communities surrounding transportation, commerce, and healthcare facilities had a similar allocation pattern in Xiamen City, whereas the residential accessibility of education and leisure services showed regional differences. Due to unbalanced regional development, evident inequality could be witnessed by comparing the composite assessment results of residential suitability between the communities on Xiamen Island and those in the off-island Areas. Our study hopes to provide dedicated support for designing sustainable communities and cities, especially for those in developing countries.

1. Introduction

Dramatic urbanization has resulted in the rapid centralization of the population and uneven distribution of resources that sustain human well-being in urban areas, especially in developing countries [1]. Nowadays, along with a growing awareness of “spatial justice” (“spatial justice” refers to fair treatment and justice being afforded to residents in terms of spatial production and spatial allocation of resources) [2], the suitability of urban human settlements has also attracted considerable attentions in contemporary studies [3]. In urban areas, human settlements are chiefly influenced by the amount and the spatial layout of the surrounding public facilities, which are urban infrastructures distributed in a dotted pattern which provide services to the public [4]. To what extent the local public services could satisfy the residents’ demand inevitably influences their sense of belonging and identification to the city [5]. Moreover, eliminating disparities in residents’ accessibility to those public products is also central to the Sustainable Development Goals (SDGs) set out by the United Nations in 2015 [6]. Therefore, sufficiently, ideally, and equitably accessible residential public facilities (services) are critical indicators not only for the residential suitability, but also for the sustainability of communities and cities.
The essential meaning of “residential suitability” is the suitability of an area for residential livability and development. As for the perspective of “Livability”, the World Health Organization (WHO) firstly proposed the concept of “Living environment” by summarizing the basic conditions for meeting the living demand of human beings in 1961, which holds “convenience and amenity” as the fundamental guidelines of the residential livability evaluation [7]. In the 1990s, “new-urbanism” emerged. The principle of creating walkable neighborhoods containing a wide range of housing and job types became one of the primary criteria for urban planning and judging the residential livability in the 21st century [8,9,10,11]. Since the strategy of “sustainable development” was first proposed in “Our Common Future” by United Nations in 1987 [12], the meaning and necessity of the new development pattern have generally been recognized globally [13]. With a growing number of people living in cities, there has been an ongoing debate about what kind of urban area is suitable for residential development, and particularly, for their sustainable development [14,15,16]. In 2015, the United Nations adopted a far-reaching and people-centered set of universal and transformative goals and targets for sustainable development by 2030. One particular goal, to “Make cities and human settlements inclusive, safe, resilient and sustainable,” also set “to ensure access for all to adequate, safe and affordable housing and basic services “as one of the critical targets for future residential sustainable development [17]. Therefore, the residential suitability of urban human settlement is chiefly influenced by the surrounding public services (facilities) [4]. Numerous studies have been dedicated to urban residential suitability assessments from the view of the service efficiency and the spatial layout of public facilities (services), which also has a profound impact on urban study and planning in China [18,19]. However, most of the studies focused primarily on the suitability of a single type of public facilities, such as education, healthcare, green spaces, etc. [19,20,21,22,23,24,25,26,27,28,29] Composite spatial accessibility assessments for residential suitability have still seldom been published. The reason is that the timeliness and advancement of assessment methods in recent studies, mainly based on traditional social and field surveys, have failed to meet the requirements of contemporary urban studies, which call for full coverage and accurate spatial data for the analysis of larger spatial units and a low updating cost in future studies [30,31,32,33].
The technological advancement of big data mining and Geographical Information Systems provide new supports for the data and methods of urban residential suitability studies. Electronic maps of the points of interest (POIs), as a series of point-like data describing the geographical location of urban facilities, have become a research hotspot, and have particularly advanced the study of residents’ space-time behavior, urban planning, and public evaluation [34,35,36,37,38]. Meanwhile, increasingly accurate points of interest (POIs) data also provide the possibility for a more comprehensive evaluation of urban residential public services [39,40,41]. What is more, other plentiful sourced big data also make it possible for realistic assessments to be undertaken on the various types of residential public services. For example, the country’s education authorities require that public schools enroll pupils from designated areas in China. A detailed “school district” boundary could bring great benefits to residential education assessment. Moreover, the surrounding natural landscape data also provide the possibility for a comprehensive evaluation of residential leisure services.
Combining network big data and spatial analysis techniques, we developed a composite spatial accessibility assessment method for residential suitability, and demonstrated it in Xiamen City, a rapidly urbanizing city in China, from the views of regional “service supplement” and “residential accessibility” of the communities surrounding public facilities. The assessment involved 1756 urban residential communities and covered five essential types of public services (facilities), i.e., healthcare, commerce, leisure, education, and transportation. We hope this new method could improve the general understanding of urban residential suitability and provide support for sustainable community and city planning.

2. Materials and Methods
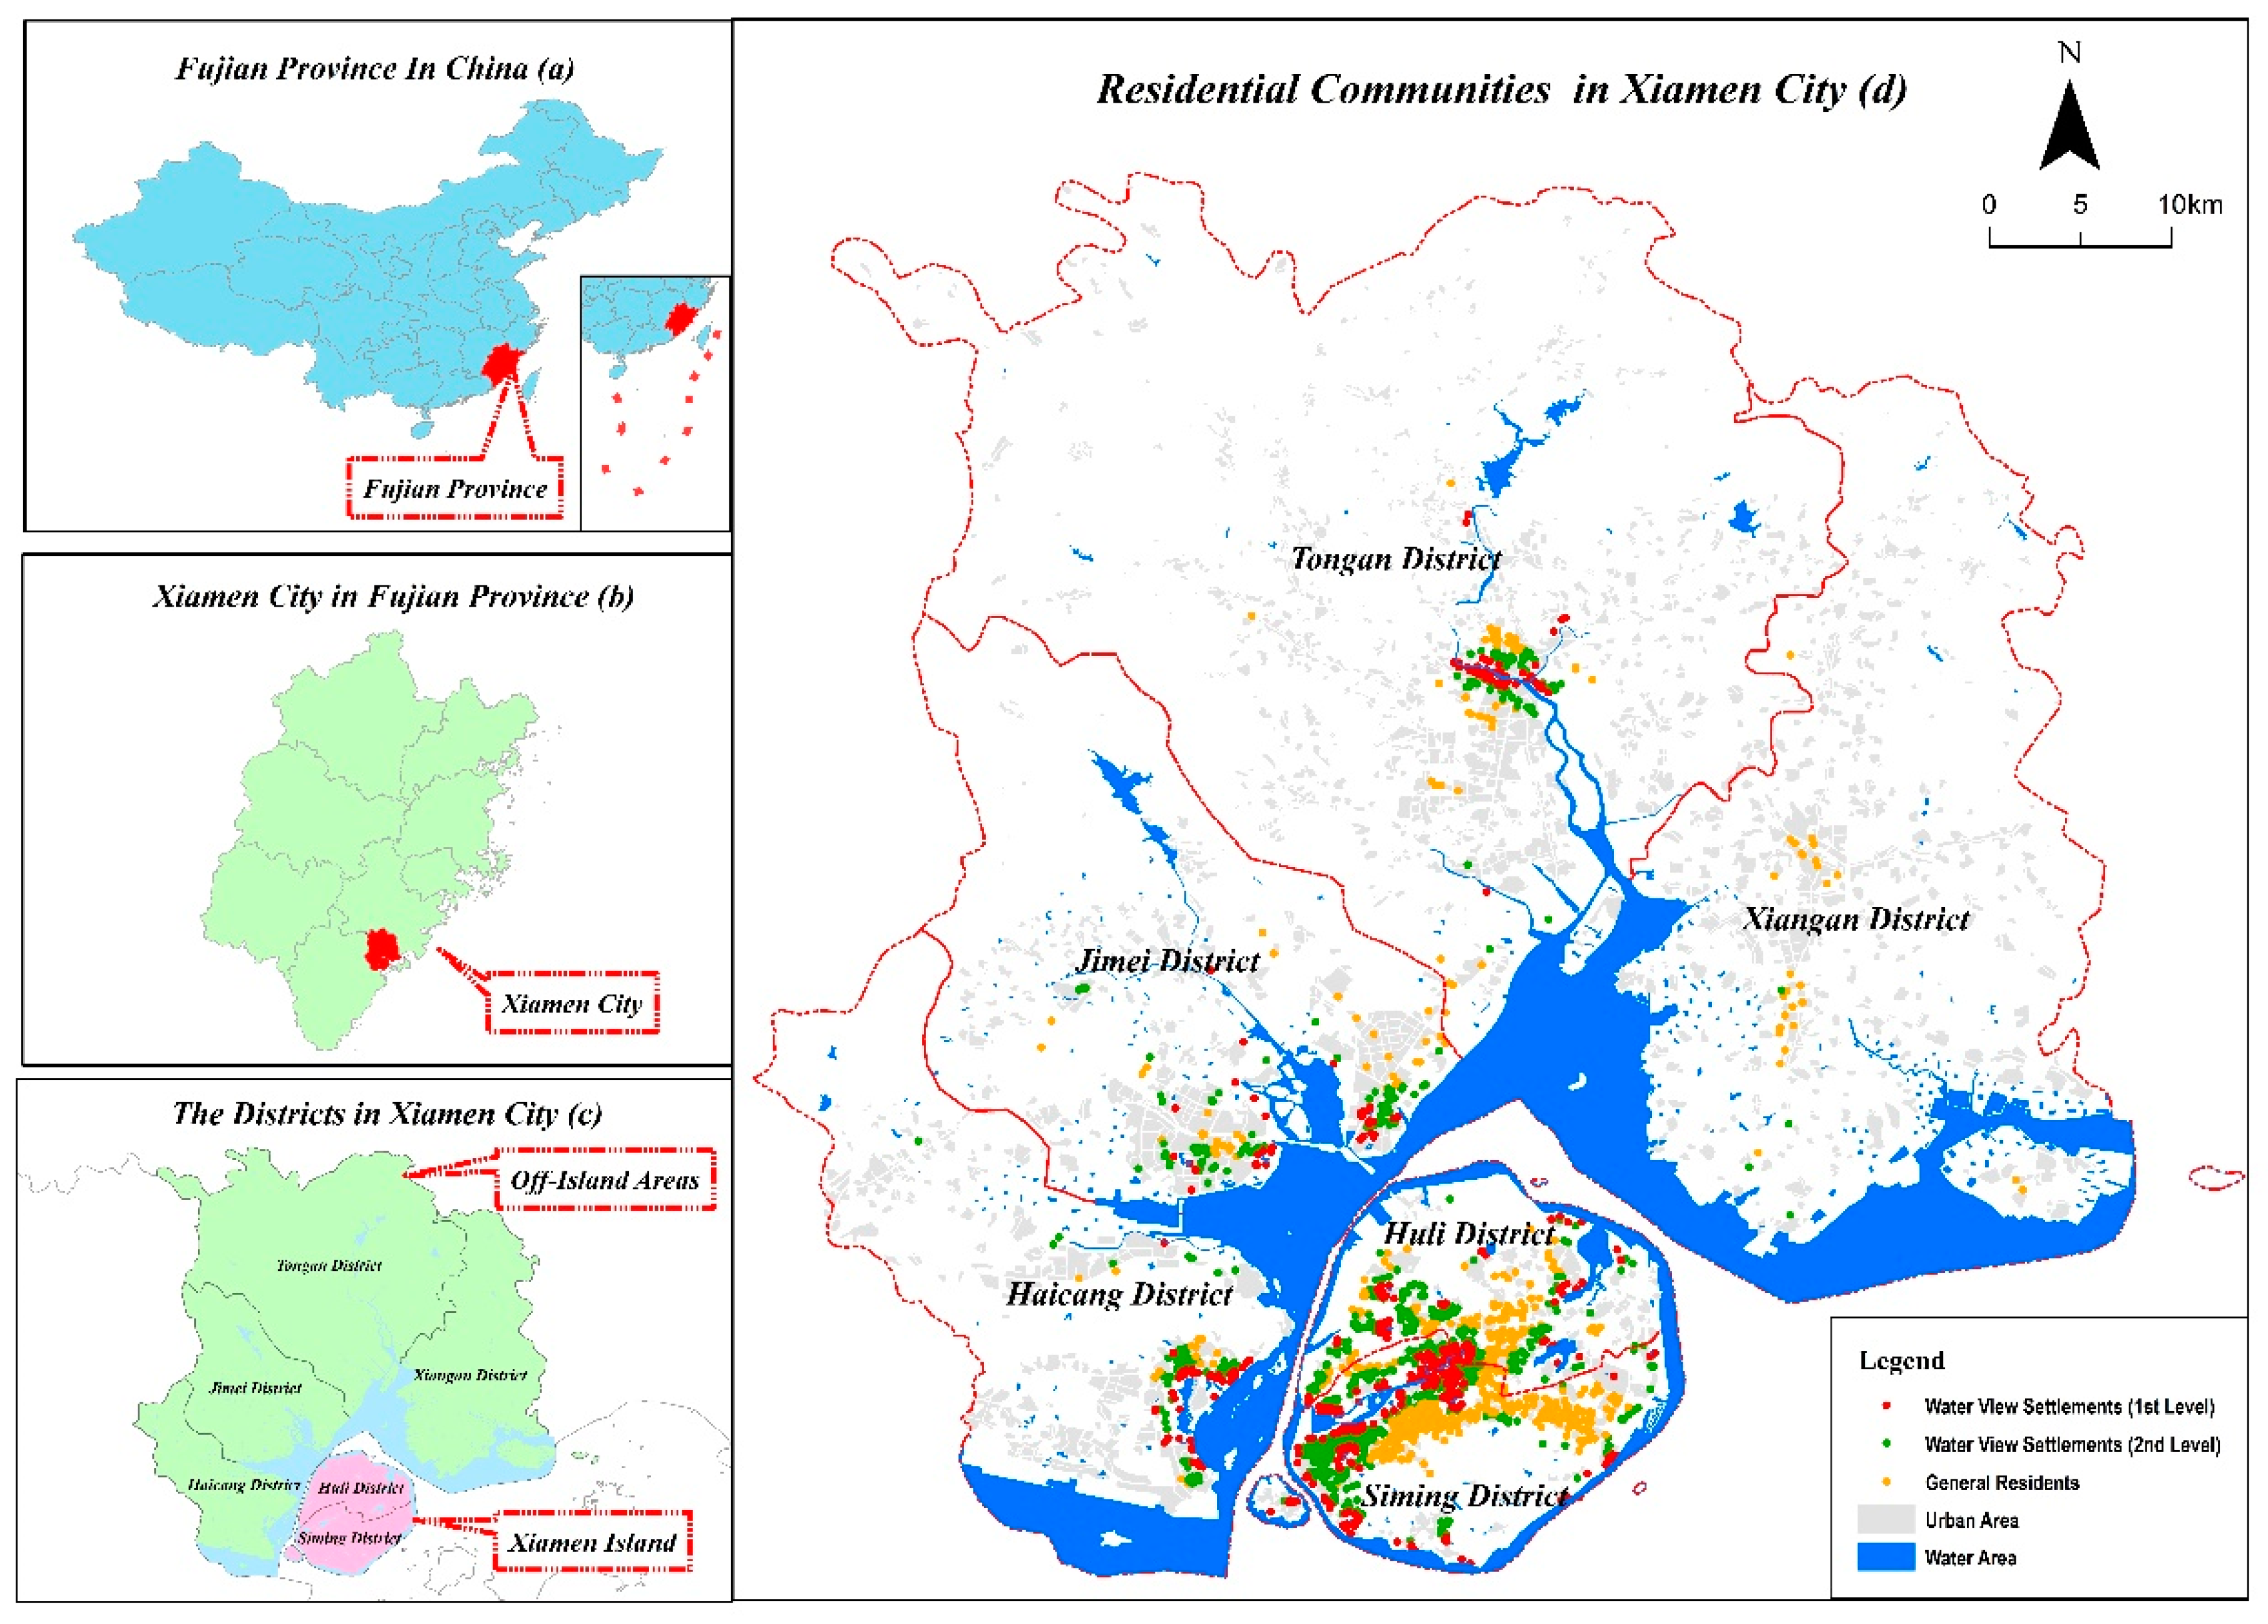
2.1. Study Area

Xiamen City is a coastal city located on the southeast coast of China (24°23′ N–24°54′ N, 117°53′ E–118°26′ E). As one of the five fastest-growing special economic zones in China, it serves not only as one of the most prominent international trading ports, but also as the chief economic mainstay of Fujian Province [42]. Benefiting from a renowned reputation due to the coastal water view landscape and fast economic development, Xiamen City has been listed as one of the top 10 most livable cities in China [43]. As for 2016, the total population was 3.92 million, with an urbanization rate of 89%. The completed infrastructure investment was 79.235 billion yuan, which accounted for 36.69% of the total fixed asset investment in Xiamen City [44]. Xiamen City can be divided into two parts: Xiamen Island, which includes Siming and Huli districts, and the off-island area, which consists of 4 districts: Haicang, Jimei, Tong’an, and Xiang’an, from west to east. The Siming and Huli districts are the downtown area. Tong’an is the oldest inhabited area with a long-term regional development history (Table 1). The Haicang, Jimei, and Xiang’an districts are new urban areas for technological and economic development [45]. Until 2016, 1756 residential communities were distributed in Xiamen City. According to the relevant regulation in the real estate industry, 425 of them were defined as first level water view settlements, with a distance between water and community of less than 300 m, 553 of them were secondary water view settlements, with a gap between water and the settlement of about 300–800 m, and the others were ordinary settlements (Figure 1).

2.2. Materials

The spatial datasets of residential communities and public facilities (including roads, hospitals, primary schools, etc.) were derived from the point of interests (POIs) of the Baidu and Gaode Map in 2016. To assess the residential education service, we also mapped the Xiamen education resource division and the school districts according to division regulations from the Xiamen Education Bureau. After projection, spatial adjustment, and field verification, 1756 residential communities and 5953 public facilities points were introduced into the study.
Our study used the point-like data to reflect the residential communities in Xiamen. The centroid points in every residential boundary were chosen as the foothold of our assessment with the assumption that the population is concentrated in these areas. The public facilities were classified into five essential types according to the “Code of urban residential areas planning and design (2016)” (GB50180-93) [46]: commerce, transportation, leisure, healthcare, and education services, and covering 17 kinds of public facilities. Then, we graded them according to local planning and facilities authorities. The scores of each facility were also the general reflections of their service capacities. For example, the process of commerce facilities grading and scoring mainly took the urban planning and facility-scale into consideration. As for the transportation efficiency, we considered that the performance of subway was better than that of the Bus Rapid Transportation system (BRT) in Xiamen City. And the bus stop scores were based on the numbers of routes stopping at the site. The facilities’ service boundary was the evaluation standard for grading and scoring the leisure facilities. Moreover, the distance between water and residential communities was the other criterion for the scoring of the settlement’s surrounding leisure capacity. Regarding the healthcare facilities, we firstly graded them depending on the hospital level, then separately scored them according to the hospital beds and health care quality. Finally, in terms of the education facilities, as we mainly focused on the primary schools in Xiamen City, we first classified them into several groups based on the level classification of primary school from Xiamen Education Bureau. Then, we marked the service capacity relying on the school’s scale and reputation. Details are shown in Table 2. Moreover, to more clearly define the travel behavior of the Xiamen citizens, we also applied the Delphi Methodology in our study. The panel of experts consisted of 18 people drawn from both inside and outside of the relevant field of urban planning, including three academic professors, three urban planners, three government officials, and nine representative Xiamen citizens. After several rounds of expert scoring with the precise knowledge of the study targets and facilities capacities, we finally received the relevant parameters of circle radiuses and weights of distinct demand buffers regarding the diverse types of public services in Xiamen City (Table 3).

2.3. Methodology

2.3.1. Location Quotient (LQ)

Location quotient (LQ) can be used to quantify the concentration of a particular industry, cluster, occupation, or demographic group in a region. Here, we used LQ as an indicator to reflect the relative matching degree of regional public facility capacity with the local population scale, indicating the regional disparity of per capita service supplement in each district of Xiamen City.
LQ j k = ( n j k / p k ) / ( N j / P )
where LQjk is the location quotient of public service j, njk is the public service j capacity in region k, Nj represents the overall facility capacity in Xiamen City, pk is the population in region k, and P is Xiamen’s total population. The district and city total capacities (njk and Nj, respectively) for transportation, leisure, and commerce services were represented by their quantity of the public facilities (POI). The njk and Nj of the healthcare service were estimated by the number of hospital beds. The number of standard hospital beds in various level hospitals was gathered from “The measures for the administration of the hospital grade” released by the National Health Commission, People’s Republic of China. The total education service capacity was represented by the enrollment in primary school in the different districts in Xiamen City. Data were sourced from the “Xiamen Special Economic Zone Yearbook (2017)” [44]. If LQjk > 1, the per capita public service j supplement in region k is relatively sufficient compared to the average performance of the whole city, whereas if LQjk < 1, the region k’s per capita public service j is in short supply compared with the average level of per capita service supplement in Xiamen City.

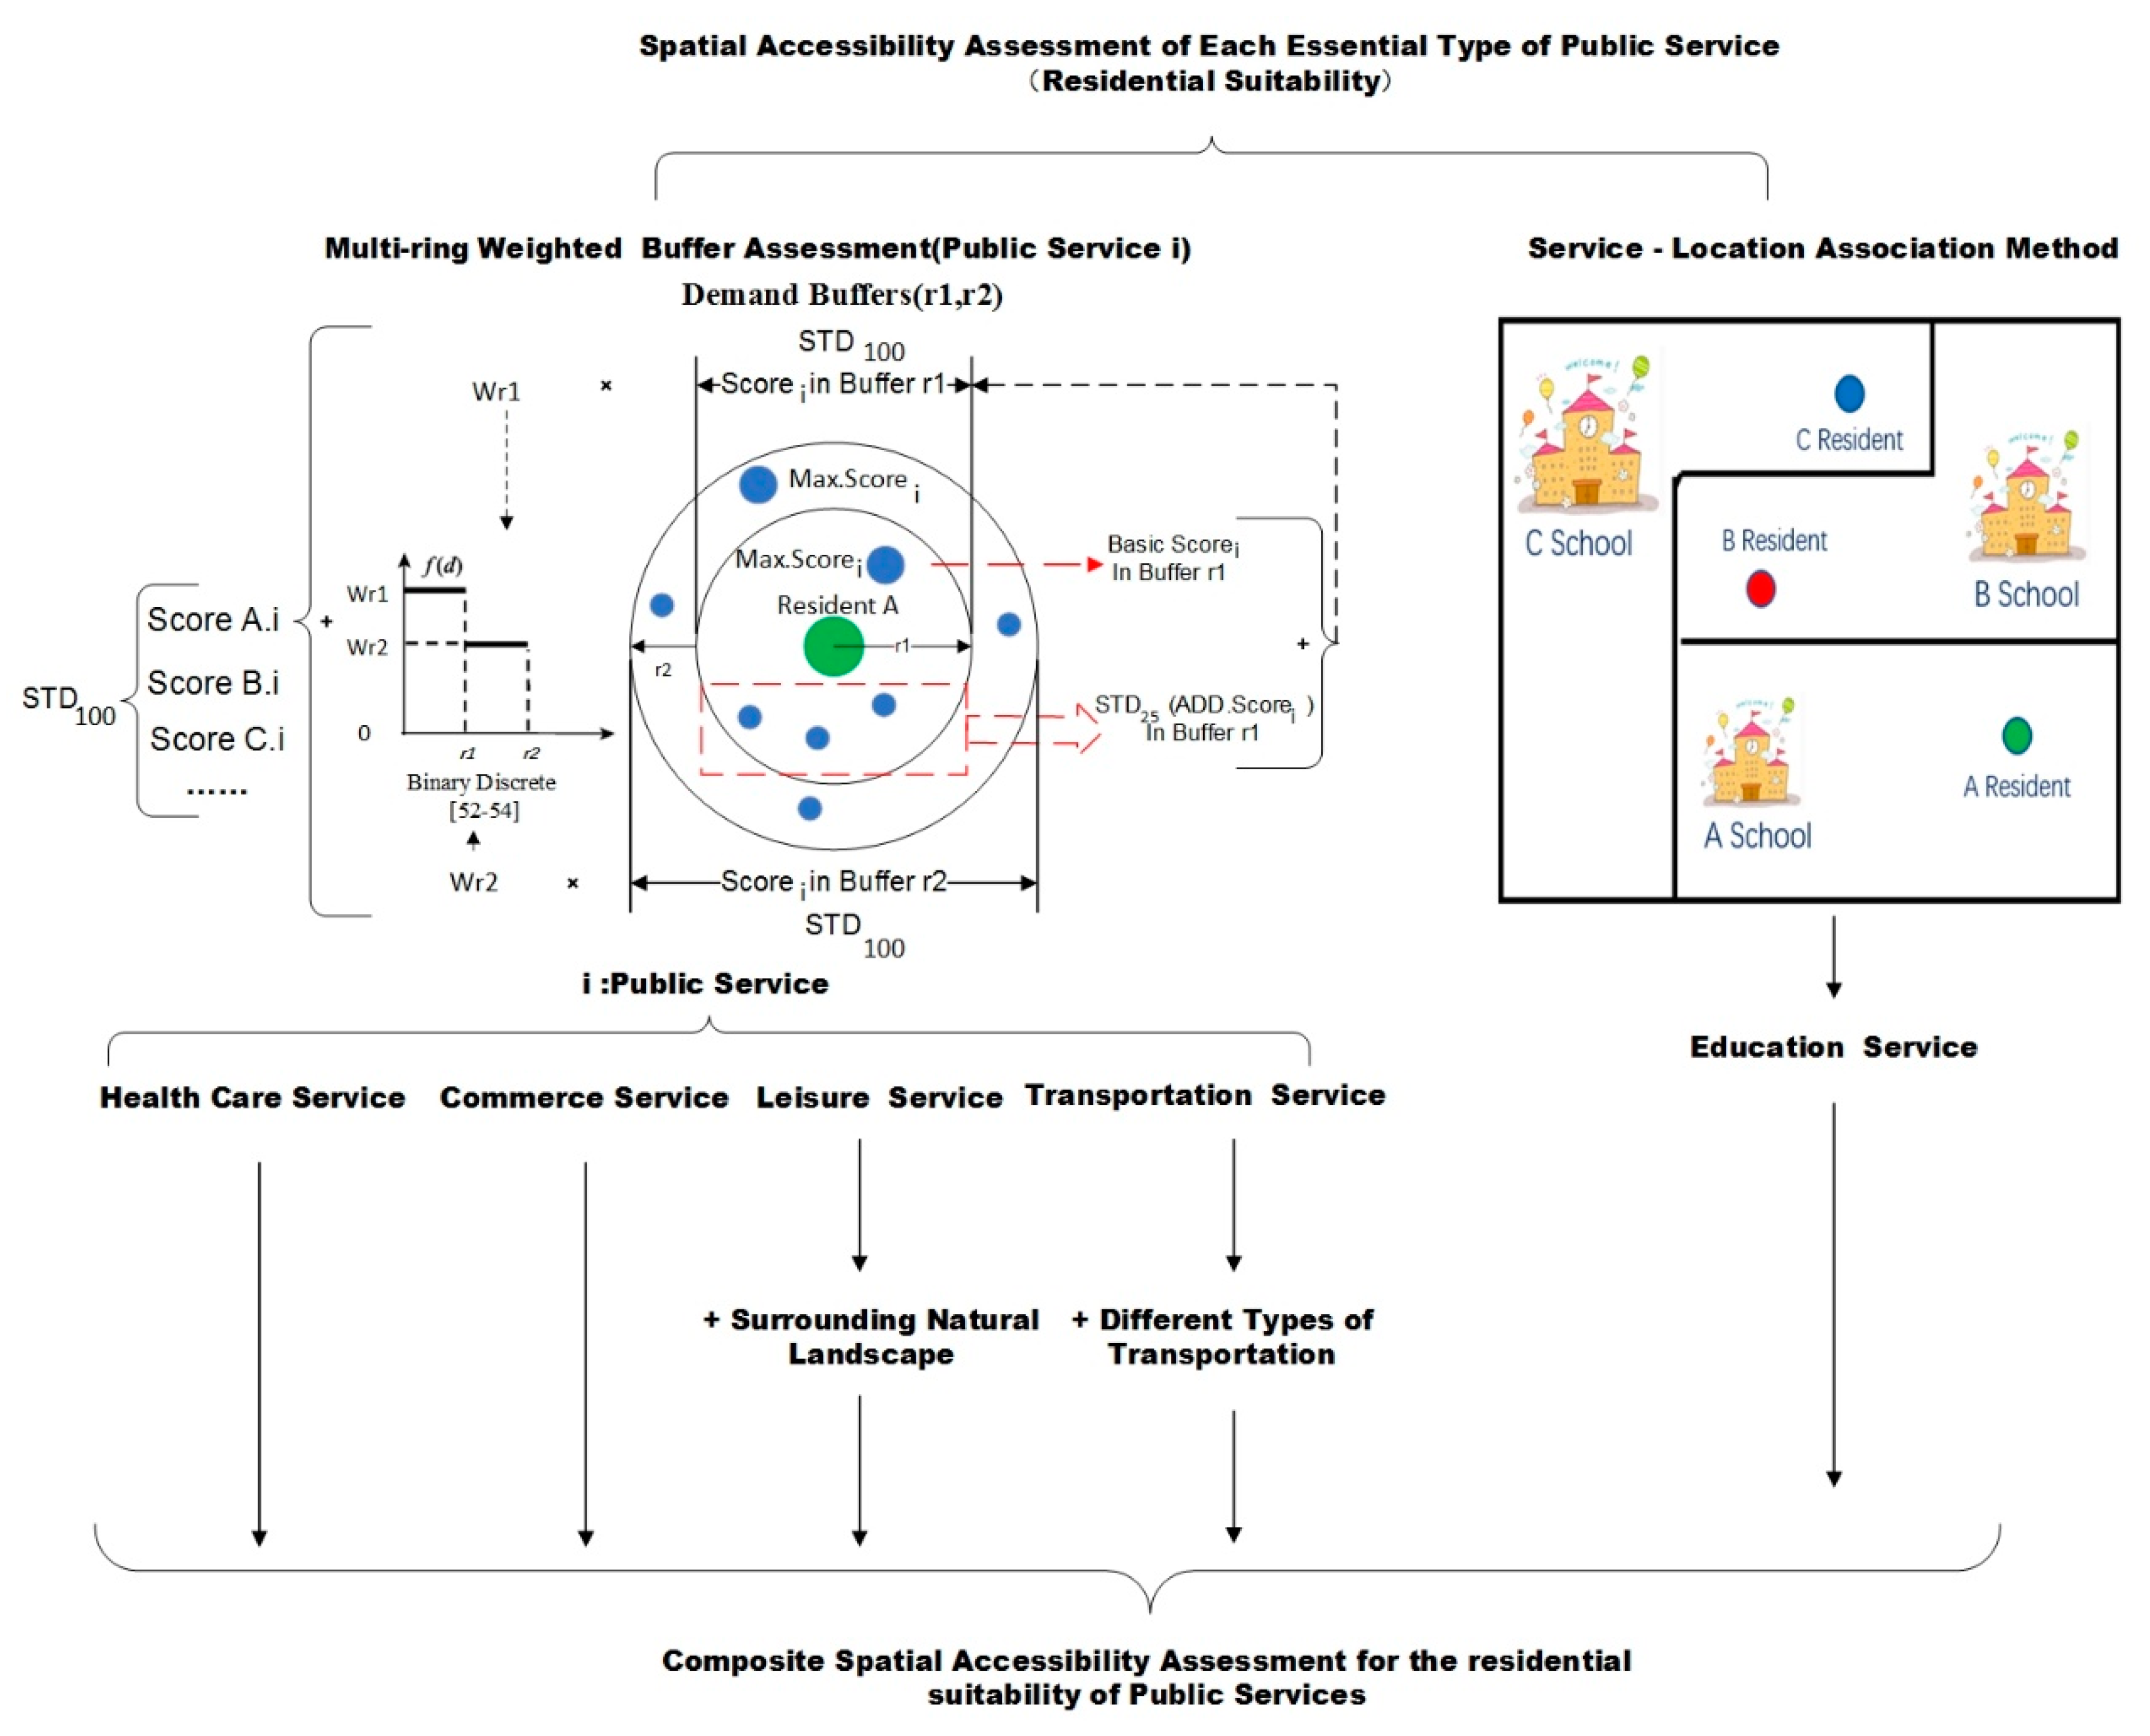
2.3.2. Composite Spatial Accessibility Assessment for the Residential Suitability of Public Services

Accessibility assessment was first proposed by Steward and Warntz in 1958 [47]. The “accessibility”, defined as the ease to reach the destinations from a given location, has been widely accepted as a suitable method to evaluate the residential suitability of the surrounding public services objectively. And it is initially expressed as a function of spatial isolation and facility attractiveness [48,49,50].
In practice, how to calculate accessibility is widely debated, and precise definitions of this metric can be arbitrary [6]. Ratio model, proximate-distance model, cumulative-opportunity model, and gravity model (models) are very intuitive and commonly used measures for assessing spatial accessibility [51]. However, when we made a choice among the above models for residential suitability assessment, several challenges had to be taken into consideration. Firstly, spatial isolation cannot merely be defined as the “point (settlements)-to-point (facilities)” distance, known as the Euclidean or Manhattan distance, because of the randomness in people’s travel modes [52]. Secondly, the residents’ demand for similar service facilities varies at different moments. The optimal public facility, which has the best service capacity, is not always the most sensible choice. Within the range of affordable travel distance, whether residents could make reasonable decisions among similar facilities or not, in accordance with their needs, is a factor that could better reflect the configuration completeness of the residential communities surrounding public facilities. Thirdly, the attractiveness of the facilities to residents has also decayed with increasing spatial isolation [53,54]. Finally, the administrative orders and communities surrounding landscape are also crucial factors affecting service supply mode and resident satisfaction of public services. All in all, distinct methods based on the concept of “accessibility” were necessary when we conducted the residential suitability assessments of different types of public services.
Therefore, in terms of residential transportation, commerce, healthcare, and leisure service, we firstly delineated multiple demand circles around each residential community point. According to the Delphi Methodology, circle radiuses were defined at 500 and 1000 m as the basic demand buffers, meaning that the citizen could access the facilities on foot. Moreover, concerning the residential travel options on public transportation, 3–5 km could also be separately designated as the other demand buffers according to people’s practical demands for healthcare, commerce, and leisure services. Different weights on the multiple demand circles around each residential community point have also been introduced by concerning space isolation effects on facility attractiveness. In our study, facilities in the same demand buffer have equal service attractiveness to the residents. However, the attractiveness of the facilities belonging to different buffers weakens along with increasing spatial isolation. Therefore, we chose the “Binary Discrete” model as our distance-decay function [54,55,56]. The original weight setting in this model is always by Gaussian function, with the prerequisite of the normal spatial distribution of the facilities, which is hard to satisfy in practice [57]. Therefore, the weights of different buffers in our study have been set depending on expert scoring and suggestions from the facility authorities. Detailed information about the demand buffers could be seen in Table 3. Our study conducted each community residential accessibility assessment of either type of public service by weighted summary of all the demand buffer accessibility scores (Table 3). As for the composition of the accessibility score, in each demand buffer, the facility with the highest service capacity score was chosen as the optimal facility. Its service capacity score was the basic score of the demand buffer. The sum of the other similar facilities capacity scores in the same demand buffer was set as the additional score (Table 2). We also further applied 25-standardization to the original additional score while considering the different significance of the optimal facility and other similar facilities on the satisfaction of residents’ demand in each buffer. Finally, each community’s accessibility scores were separately standardized on a scale of 100 for easy comparison based on the residential accessibility scores of all the communities in Xiamen City, China (Figure 2).
Considering the impact of surrounding water view on the residential accessibility of leisure service, we conducted the assessment with the multi-ring weighted method and also took the proximity distance from the residential areas to the water as another essential indicator into consideration (Table 2). The three different transportation types, bus, subway, and Bus Rapid Transportation (BRT) in Xiamen City, were used for assessing the residential accessibility of the transportation service. Each was assigned distinct weights according to the residents’ preference survey of travel model sourced from the expert scoring and relevant views from the transportation authority in Xiamen City (Table 3).
The primary schools in Xiamen City provide their services based on school district boundaries. To reflect how this feature influence the residential accessibility of education services, we graded the settlement education score according to its school district with the ArcGIS 10.5 spatial overlay analysis (Figure 2).
Finally, we conducted the composite spatial accessibility assessment for residential suitability by summarizing each community’s normalized accessibility score of all the essential services. Each essential public service has been assigned with the same weights. For easy comparison, every community’s composite accessibility score also experiences 100-standardized with all the residential neighborhoods in Xiamen City. Related equations are as follows:
S c o r e i j ( f a c i l i t i e s ) = S T D 100 ( k = 1 n j λ k j × S T D 100 ( M a x . S c o r e i j k + S T D 25 ( A D D . S c o r e i j k ) )
S c o r e i   ( H e a l t h c a r e ) = S c o r e i ( H e a l t h c a r e . f a c i l i t i e s )
S c o r e i   ( C o m m e r c e ) = S c o r e i   ( C o m m e r c e . f a c i l i t i e s )
S c o r e i   ( t r a n s p o r t a t i o n ) = S T D 100 ( 1 t y p e β t y p e × S c o r e i ( t r a n s p o r t a t i o n . facilities . t y p e ) )
S c o r e i   ( e d u c a t i o n ) = S T D 100 ( ( S c o r e i . school   district )
S c o r e i   ( L e i s u r e ) = S T D 100 ( ( S c o r e i . L e i s u r e . f a c i l i t i e s + S c o r e i . w a t e r )
S c o r e i   ( c o m p o s i t e ) = S T D 100 ( j 5 S c o r e i j )
S T D a = a ( X m i n ( X ) ) max ( X ) m i n ( X )
where S c o r e i j ( f a c i l i t i e s ) is the accessibility score of residential communities i surrounding public service j depending on the spatial layout of related public facilities. k, λ k j represents each demand buffers and their related weights for public service j separately. In Equation (2), M a x . S c o r e i j k is the optimal facility capacities score in buffer k, and ADD . S c o r e i j k is the additional score of j kind public facilities in buffer k, which is the total score of the other similar facilities capacities. In Equation (5), the S c o r e i   ( t r a n s p o r t a t i o n . f a c i l i t i e s ) is calculated according to the three esential types of transportation system, covering the bus, Bus Rapid Transportation (BRT), and subway respectively. type represents the three essential types of transportation system, β t y p e is each transportation types related weights. The S c o r e j . s c h o o l   d i s t r i c t in Equation (6) is the residential communities i belonging school district service capacity score, and S c o r e i . w a t e r in Equation (7) represents the water view service capacity score of residential settlement i. As shown in Equation (8), S c o r e i . c o m p o s i t e is the composite spatial accessibility assessment of settlement j with all the essential kinds of public facilities (services), which is the sum of each kind public service accessibility score of residential communities i ( S c o r e i j ). S T D 25   and   S T D 100 are the 25 or 100 standardizations on the original scores, respectively. In Equation (9), a = 25 or 100, m i n ( X )   and   m a x ( X ) represent the minimum and maximum original assessment score of residential public service i in all the communities of Xiamen City, China, respectively. In the end, our study also classified the residential accessibility score of public services, from high to low, into three groups by grading the scores with the half standard deviation, labeled as “High”, “Medium”, and “Low” respectively.

2.3.3. The Coefficient of Variation (CV) and Correlation Analysis

Here, we applied the mean value and the related coefficient of variation (CV) to describe the regional facility spatial layout performance on the residential suitability of each type of public service. To identify the allocation pattern of Xiamen urban planning on the residential communities surrounding public facilities, we also conducted a correlation analysis to figure out the mutual relationships among the five essential types of public services.
The CV is defined as the ratio of the standard deviation to the mean, and it is widely used to show the extent of variability in relation to the mean value of the population. As a dimensionless indicator, the CV has a significant advantage for comparing population variation between data sets with different units or means [58]. Here, we used CV as an indicator to reflect the regional disparity in the residential accessibility of public services on different spatial scales.
C V a = S a X a × 100 % = 1 X a [ i = 1 n ( X a i X a ¯ ) 2 n 1 ] 1 2 × 100 %
where Sa is the unbiased estimate of the standard deviation of residential public service evaluation score and X a ¯ is the mean of the assessment score.
Correlation analysis measures the variation closeness among multiple variables. The correlation coefficient is the ratio of the multivariate covariance and their standard deviation.
C o v p q = j = 1 N ( S c o r e p j S c o r e ¯ p ) ( S c o r e q j S c o r e ¯ q ) N 1
C o r r p q = C o v p q δ p δ q
where C o r r p q is the correlation coefficient of public service p, q in Xiamen City; C o v p q is their covariance; S c o r e p j   and   S c o r e q j represent the assessment score of the public service p,q for settlement j, respectively; S c o r e ¯ p   and   S c o r e ¯ q δ p , δ q separately mean the average score and their standard deviation of public service p, q in all the residential communities in Xiamen, respectively. N is the amount of settlements in Xiamen, N = 1756.

3. Results and Discussion

3.1. Residential Suitability Assessment on Service Supplement of Public Services in Xiamen City

Most public facilities, accounting for 53.18% of the total public infrastructures in Xiamen City, are concentrated on Xiamen Island. Moreover, the Siming district had the most outstanding performance of public service supplements, with a vast amount (29.73%) of high-quality facilities concentrated in this area. As for the off-island regions, the Tong’an district, an old inhabitant area with long-term regional development, still had advantages regarding the amount of public infrastructure that had accumulated, especially for transportation, education, and healthcare services. However, concerning the number of high-quality facilities, it was not only significantly less than that in the Siming and Huli districts, but also not as adequate as other districts in the off-island area. For example, except for the primary schools, the high-quality facilities in the Jimei district were more sufficient than those in the Tong’an district. Considering the performance in Haicang, Xiang’an districts, distinct disadvantages emerged by comparing their service supplement capacity with those of other regions, regardless of the quantity or the capability of the local public facilities (Table 4).
Concerning the regional disparity of local service supplement in meeting with the residents’ demand, the per capita performance of commerce services in Siming and Huli districts (LQsiming = 1.47 and LQhuli = 1.12) was still significantly better than those in the off-island area (LQ < 1) (Figure 3c). However, 52.6% of the population being concentrated on Xiamen Island [44]. Although most of the high-quality transportation and education infrastructures located in Siming and Huli district, the per capita service supplement is still insufficient compared with the average per capita performance in Xiamen City (LQ < 1). By contrast, the per capita transportation and education services in the districts outside Xiamen Island were relatively abundant, especially in the Tong’an district (LQ = 1.83, LQ = 1.26) (Figure 3d,e). Meanwhile, a large amount of healthcare and leisure facilities are concentrated in the Siming district, and the per capita services supplements are more adequate (LQ > 1) than those (LQ < 1) in the other districts (Figure 3a,b). Despite the LQ of 1.46 for the healthcare service in Xiang’an district (Figure 3a), 92.68% of the healthcare facilities were low-quality, such as clinics, which could not fully satisfy the high-quality healthcare demands of the local residents.
In terms of the per capita service supplement of all the five essential types of public facilities in Xiamen City (Figure 3f), although excellent public resources were mainly concentrated in the Siming and Huli districts, the per capita public service supplement was facing enormous challenges due to a large amount of population crowding in Xiamen Island. The per capita public services supplement in Siming district barely satisfied the average residents’ demand in Xiamen City (LQ = 1.02), whereas the LQ in Huli district was only 0.84, which had still shown a huge disadvantage by comparing the average level of the per capita service adequacy for the whole city. As for the off-island area, the long-term regional development in Tong’an district has led several relative advantages on the per capita supply supplement of all kinds of public services (LQ = 1.32), which was significantly higher than the city’s average level. Nevertheless, the high-quality facilities were deficient, as were those in the other off-island districts.

3.2. Residential Suitability Assessment on the Residential Accessibility of Public Services in Xiamen City

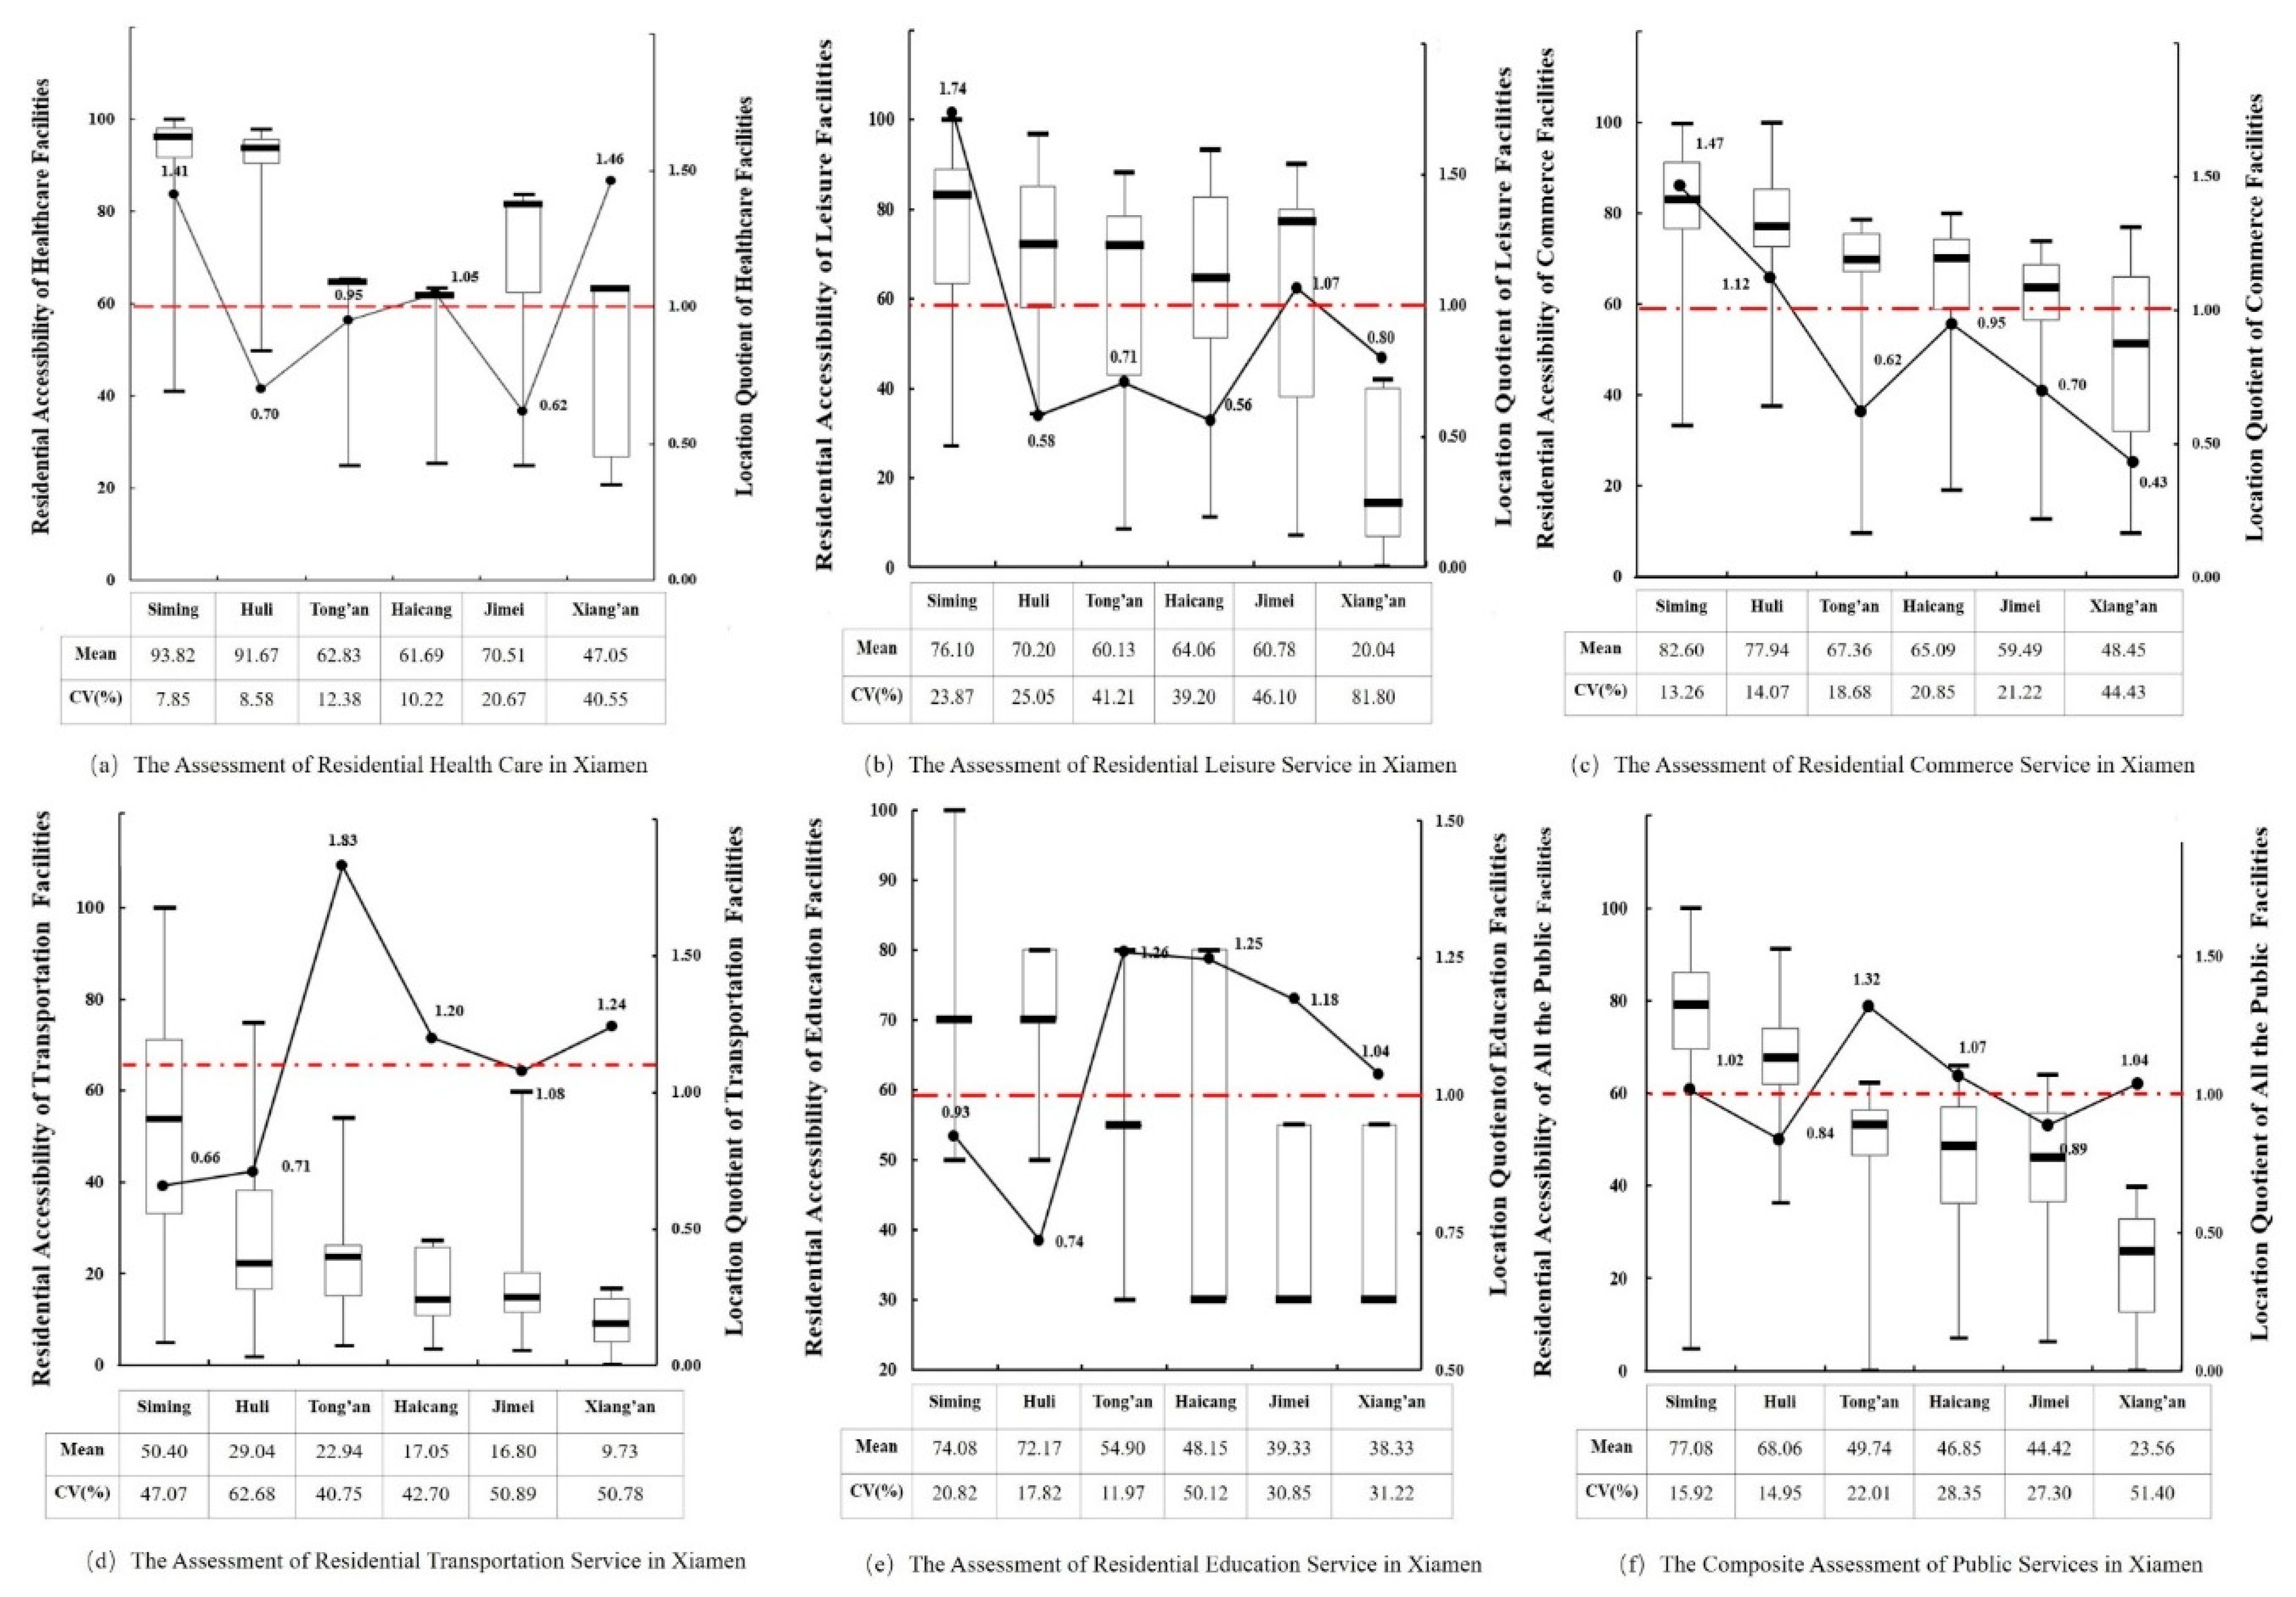
3.2.1. The Regional Residential Suitability Assessment on the Residential Accessibility of Xiamen Public Services

Despite the service supplement, ideally and equitably accessible residential public services are also crucial for residential suitability. Here, we utilized the local mean value and CV of the residential accessibility score as critical indicators to describe the regional residential suitability performance on the spatial layout of diverse types of public services in Xiamen City, China.
As for the healthcare service (Figure 3a), the district’s residential suitability in Xiamen City, from high to low, demonstrated a radiation pattern from inside Xiamen Island to the off-island areas. The settlement performances in Siming and Huli were apparently better than those in the other districts, regardless of the local residential accessibility score (Scorehealthcare.Siming = 93.82 and Scorehealthcare.Huli = 91.67) or its regional disparities (CVSiming = 7.85%, CVHuli = 8.58%). Amongst the residential public service in the off-island area, the accessibility in Jimei had the highest mean value. However, the regional disparity was apparent (CVJimei = 20.67%). The performance of residential suitability in Xiang’an district was the worst, with the lowest mean value (47.05) and highest regional disparity (40.55%) in Xiamen City.
The regional residential suitability of commerce and leisure services showed a naturally hierarchical distribution pattern (Figure 3b,c). The settlement performance of Siming and Huli were much better than the other districts on Xiamen Island with high S c o r e i j and low CVi. Tong’an, Haicang, and Jimei district had similar residential supporting qualities and relatively significant regional disparities. The performance in Xiang’an district was the worst.
In Figure 3d,e, the average residential accessibility of education (scoreeducation.Siming = 74.08, score education. Huli = 72.17) and transportation service (score transportatiom.Siming = 50.40, score transportation. Huli = 29.04) in Siming and Huli were much higher than those in the off-island districts. However, the regional disparities were relatively significant based on the uneven distribution of above facilities on Xiamen Island (CVSiming = 47.07%, CVHuli = 62.68% for transportation, and CVSiming = 20.82%, CVHuli = 17.82% for education). In terms of the Tong’an district, although the average residential accessibility scores of the above services were only 54.90 and 22.94 respectively, its regional disparities were the lowest amongst all the districts in Xiamen City (CVtongan=11.97% for education, CVtongan=40.75% for transportation). The performances of the residential suitability of education and transportation services in Haicang, Jimei, and Xiang’an district were quite poor in terms of the low mean value and relatively high regional disparities.
In general, the residential suitability of all public services in Siming and Huli district were the best, with the outstanding mean value (Composite Score Siming = 77.08, Composite Score Huli = 68.06) and lowest regional disparities (CVSiming = 15.92%, CVHuli = 14.95%) (Figure 3f). Meanwhile, the residential public services in Tong’an, Haicang, and Jimei districts performed similarly in terms of comparable residential accessibility scores and regional disparities. With considerable benefits from the long history of regional development, Tong’an still had some advantages in terms of the reasonable spatial layout of the local public facilities (Composite Score Tong’an = 49.74, CV Tong’an = 22.01%). However, the performance in Xiang’an district was the worst, with a 23.56 average residential score and 51.40% regional disparity. According to the Urban Master Planning (2011–2020) of Xiamen City, Xiang’an district will be one of the sub-centers of Xiamen City. It is urgent that the quality and quantity of local public facilities in Xiang’an district be improved.

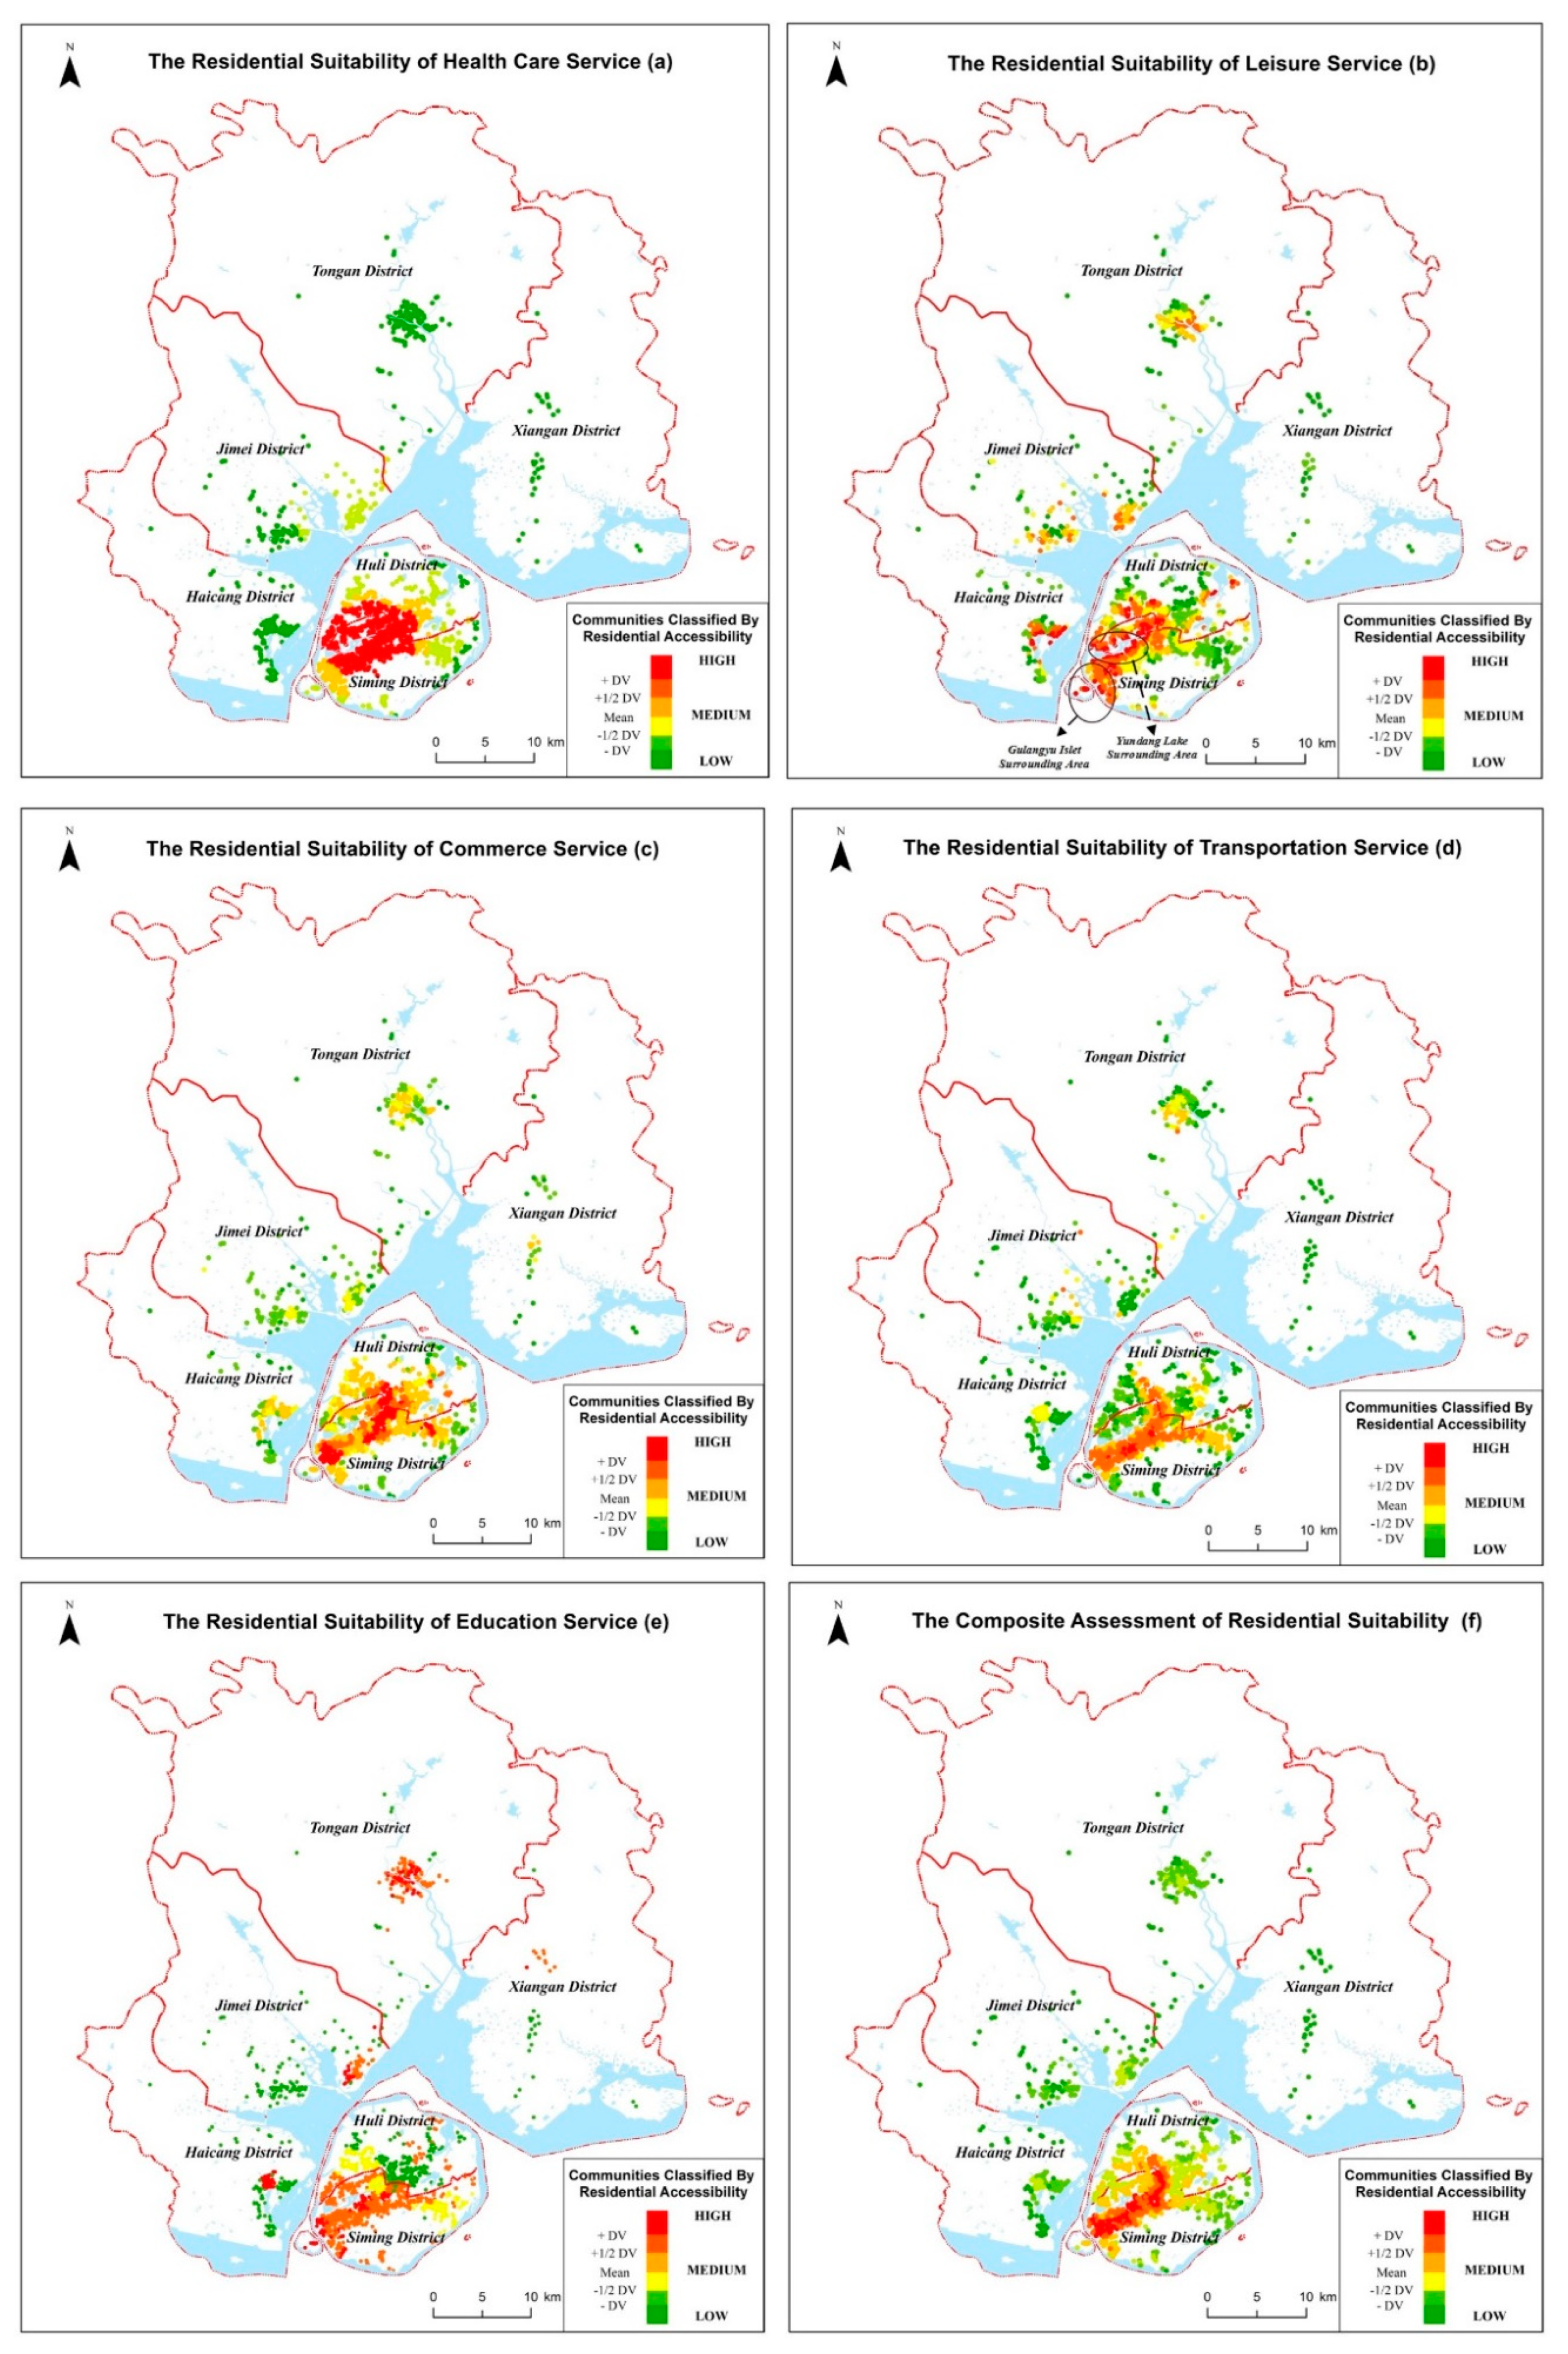
3.2.2. The Overall Residential Suitability Assessment on the Residential Accessibility of Xiamen Public Services

A residential suitability assessment of each type of public service among all the communities in Xiamen City is shown in Figure 4. The spatial layout of residential healthcare and commerce facilities were the most reasonable (Table 5). The average scores for the residential healthcare and commerce accessibility of all the communities in Xiamen were 85.31, 76.24, and the CVs were only 18.56%, 19.17%, respectively. The total proportion of “High” and “Medium” residential communities accounted for 75.17% and 78.25% (Figure 4a,c). In contrast, the residential suitability of the transportation service had the lowest average score (only 36.89) and the highest regional disparity on spatial accessibility (65.15%). Due to the uneven distribution of transportation facilities, 43.68% of the residential communities in Xiamen City were labeled as “Low” (Figure 4d). In Table 6, the correlation coefficient between the healthcare and commerce service was 0.68. Meanwhile, the indexes between transportation & commerce services and transportation & healthcare services were 0.67 and 0.54, respectively, indicating that the above three types of public services have similar spatial patterns in terms of the spatial layout around Xiamen’s residential communities. The phenomenon shows that the Xiamen’s residential planning has paid considerable attention to the assignment of the above types of public services.
The residential suitability of the leisure services and education performed similarly, with average scores of 70.06 and 66.34 and CVs of 31.71% and 27.86%, respectively (Table 5). Table 6 shows that the correlation coefficients of residential accessibility between the above services and other public services were all less than 0.5, reflecting that the spatial layout of residential communities surrounding education and leisure facilities did not match well with the other public services. As a renowned coastal city, the water-view-oriented leisure facilities played a vital role in the residential suitability of leisure services in Xiamen City. As shown in Figure 4b, most of the residential communities labeled with “High” located in the areas around the Yundang Lake and Gulangyu islet, Moreover, several adjacent water off-island communities also received great benefits on their accessibility of leisure services due to the nearby water bodies. Nowadays, the residential suitability of education services was mainly affected by the “School District.” However, the uneven distribution of education resources, high-quality primary schools being mainly concentrated in Siming and Huli district, caused a significant regional difference in the residential suitability of education service in Xiamen City. In Figure 4e, only 18.19% of the residential communities could be labeled as “Low” on their accessibility of education service on Xiamen island, whereas the accessibility of nearly half of the off-island communities, accounting for 48.3% being labeled as “Low”, could not fully satisfy the education demands of Xiamen’s citizens. Considering the above results, the residential accessibility of education and leisure service depicted apparent regional differences, especially among the communities on and off Xiamen Island, and the neighborhoods near and away from the water bodies.
A composite assessment of residential suitability among all the communities in Xiamen City is shown in Figure 3f. Although only 29.90% of the residential neighborhoods could be graded as “Low,” an evident inequality could be witnessed by comparing the residential suitability of all the five essential public services between the communities on Xiamen Island and those in the off-island areas due to the unbalanced regional development in Xiamen City. The urbanization rate in the Siming and Huli districts reached 100% in 2016 [44], with great benefits from regional policy bias and rapid social-economic development. Most of the “High “and “Medium” communities are concentrated on Xiamen Island. In contrast, the residential suitability of all the public services failed to meet the citizen’s expectation in the off-island area with the numerous “Low” and “Medium” communities, which is mainly due to the relatively backward regional development. As the 2030 Agenda for Sustainable Development asserts, “no one will be left behind” [8,17]; the apparent inequality could inevitably lead to adverse effects on the sustainable development of Xiamen City, China.

4. Conclusions

Residential suitability of urban public services has become a critical issue in many countries. The literature has so far witnessed a steady growth of studies using accessibility to services and facilities as the index of measure. Most of the studies have, nevertheless, targeted “residential suitability” of a single type of public facility. As public facility investigations involve types of public facilities with complex characteristics, existing methods have failed to meet contemporary demand. Moreover, the larger spatial urban study also proposed new requirements on the quality of the spatial data. The application of network big data provided better data resources compared to traditional social and field surveys for its full coverage and accuracy, and the low cost for updating. Meanwhile, the composite spatial accessibility assessment method contributes to a further attempt to integrate the study on residential suitability including various kinds of public facilities (services). In this study, combining network big data and spatial analysis, we conducted a composite spatial accessibility assessment for residential suitability covering five essential types of public services, i.e., healthcare, leisure, commerce, transportation, and education services in the rapidly urbanizing Xiamen City, China, which we hope to provide support for designing a sustainable city and community according to the 2030 Sustainable Development Goals of the United Nations.
As for the service supplement of public services in Xiamen City, although most of the facilities are concentrated in Xiamen Island, the regional per capita public service supplement was facing enormous challenges with the high local population, and the per capita transportation and education service supplements were in short supply compared with the average per capita performance of the whole city. Meanwhile, Tong’an, an old inhabitant district, still had advantages in the amount of public facilities due to its long history of regional development. However, high-quality facilities were insufficient, similar to the situation in other off-island districts.
In terms of the facility spatial layout, the residential suitability of healthcare and commerce services was the most reasonable in Xiamen city, respectively demonstrating radiation and hierarchical patterns from inside Xiamen Island to the off-island area. In contrast, the residential suitability of the transportation service performed the worst. Currently, Xiamen’s residential planning has paid considerable attention to the assignment of residential transportation, commerce, and healthcare services, which has a similar allocation pattern in terms of the community’s surrounding public facilities, whereas the residential education and leisure services did not match well with the other public services. Inequality is evident through a comparison of the residential composite suitability between the communities on Xiamen Island and those in the off-island area due to the unbalanced regional development in Xiamen City.
Therefore, we recommend (1) Upgrading and balancing the allocation of public facilities, especially those in the off-island districts, and Xiang’an district should be given significant attentions; (2) Reducing the regional differences in the residential accessibility of education and leisure services by redistributing the education resources to the off-island area, expanding the investment in cultural landscapes, and increasing the number of “hanging gardens” and self-service libraries in Xiamen City; and (3) Promoting the transformation of the urban spatial development pattern to “a single-heart multi-cores”, which could not only help to ease the supply-demand contradiction of the public services on Xiamen Island, but also provide ways to enhance the sustainable development by narrowing the regional inequality of residential suitability in Xiamen City. Our study calls for more focus on the supplement model of residential public services, including the service supply adequacy, ideally, and equitably-accessible residential public facilities (services), by urban planning and decision-makers, especially for cities in developing countries.
A composite spatial accessibility assessment method for the residential suitability of urban public services in Xiamen City was used as an empirical example. The usefulness of the composite methodology, network big data, and spatial analysis in measuring and analyzing the residential suitability of the urban public services, to some extent, has been verified by the empirical outcomes. However, due to the lack of a publicly-accepted quantitative evaluation system, several parameters in our study were set by the subjective method and only reflected the regional characteristics in Xiamen City. Future studies should focus on developing a universal parameter system on the residential suitability of urban public services. By doing so, residential suitability assessments at various levels could be better discerned.

Author Contributions

Y.Z., G.Z., T.L., X.L., J.L., M.L., H.Y., L.K. worked collectively. Specifically, conceptualization, T.L., and H.Y.; data curation, Y.Z.; formal analysis, Y.Z., X.L., and M.L.; funding acquisition, T.L., and G.Z.; investigation, J.L., and L.K.; methodology, Y.Z. and G.Z.; visualization, Y.Z.; writing—original draft, Y.Z.; writing—review and editing, Y.Z., T.L., G.Z., and H.Y.

Funding

This research was funded by the National Key R&D Program of China (2016YFC05027002018YFD1100300) and National Natural Science Foundation of China (41771573, 41871167, 41201155, 41771570, 41671444).

Conflicts of Interest

The authors declare no conflict of interest. The founding sponsors had no role in the design of the study; in the collection, analyses, or interpretation of data; in the writing of the manuscript; or in the decision to publish the results.

References

  1. Wei, Y.D.; Ewing, R. Urban Expansion, Sprawl, and Inequality; Elsevier: Amsterdam, The Netherlands, 2018. [Google Scholar]
  2. Brennetot, A. In Geographers and Spatial Justice: Genealogy of a Complicated Relationship. Annales de Géographie 2011, 678, 115–134. [Google Scholar] [CrossRef]
  3. Gunn, A.M. Habitat: Human Settlements in an Urban Age; Elsevier: Amsterdam, The Netherlands, 2017. [Google Scholar]
  4. Wu, L.Y. Introduction to Sciences of Human Settlements; China Architecture & Building Press: Beijing, China, 2001. [Google Scholar]
  5. Tsou, K.W.; Hung, Y.T.; Chang, Y.L. An accessibility-based integrated measure of relative spatial equity in urban public facilities. Cities 2005, 22, 424–435. [Google Scholar] [CrossRef]
  6. Weiss, D.; Nelson, A.; Gibson, H.; Temperley, W.; Peedell, S.; Lieber, A.; Hancher, M.; Poyart, E.; Belchior, S.; Fullman, N. A global map of travel time to cities to assess inequalities in accessibility in 2015. Nature 2018, 553, 333–336. [Google Scholar] [CrossRef] [PubMed]
  7. Higasa, T.; Hibata, Y. Urban Planning; Kioritz Corporation Press: Tokyo, Japan, 1977. [Google Scholar]
  8. Boeing, G.; Church, D.; Hubbard, H.; Mickens, J.; Rudis, L. LEED-ND and Livability Revisited. Berkeley Plan. J. 2014, 27, 31–55. [Google Scholar]
  9. Harvey, D. Social Justice and the City; Johns Hopkins University Press: Baltimore, MD, USA, 1973. [Google Scholar]
  10. Calthorpe, P. The Next American Metropolis: Ecology, Community, and the American Dream; Princeton Architectural Press: New York, NY, USA, 1993. [Google Scholar]
  11. Dong, J. On the forming of health-oriented urban space. Mod. Urban Res. 2009, 10, 77–84. [Google Scholar]
  12. Keeble, B.R. The Brundtland report: ‘Our common future’. Med War. 1988, 4, 17–25. [Google Scholar] [CrossRef]
  13. Bruckmeier, K. Sustainability between necessity, contingency, and impossibility. Sustainability 2009, 1, 1388–1411. [Google Scholar] [CrossRef]
  14. Asami, Y. Residential Environment: Methods and Theory for Evaluation; University of Tokyo Press: Tokyo, Japan, 2001. [Google Scholar]
  15. Evans, P.B. Livable Cities? Urban Struggles for Livelihood and Sustainability; University of California Press: Berkeley, CA, USA, 2002. [Google Scholar]
  16. Timmer, V.; Seymoar, N.K. The Livable City: World Urban Forum 2006, Vancouver Working Group Discussion Paper; International Centre for Sustainable Cities: Vancouver, BC, Canada, 2006. [Google Scholar]
  17. Transforming Our World: The 2030 Agenda for Sustainable Development. Available online: https://sustainabledevelopment.un.org/post2015/transformingourworld (accessed on 8 December 2018).[Green Version]
  18. Lineberry, R.L.; Welch, R.E. Who Gets What: Measuring the Distribution of Urban Public Services. Soc. Sci. Q. 1974, 54, 700–712. [Google Scholar]
  19. McAllister, D.M. Equity and efficiency in public facility location. Geogr. Ana. 1976, 8, 47–63. [Google Scholar] [CrossRef]
  20. Erkip, F.B. The distribution of urban public services: The case of parks and recreational services in Ankara. Cities 1997, 14, 353–361. [Google Scholar] [CrossRef]
  21. Kinman, E.L. Evaluating health service equity at a primary care clinic in Chilimarca, Bolivia. Soc Sci Med. 1999, 49, 663–678. [Google Scholar] [CrossRef]
  22. Kontodimopoulos, N.; Nanos, P.; Niakas, D. Balancing efficiency of health services and equity of access in remote areas in Greece. Health Policy 2006, 76, 49–57. [Google Scholar] [CrossRef] [PubMed]
  23. Lin, T.; Liu, X.F.; Song, J.C.; Zhang, G.Q.; Jia, Y.Q.; Tu, Z.Z.; Zheng, Z.H.; Liu, C.L. Urban waterlogging risk assessment based on internet open data: A case study in China. Habitat Int. 2018, 71, 88–96. [Google Scholar] [CrossRef]
  24. Panter, J.; Jones, A.; Hillsdon, M. Equity of access to physical activity facilities in an English city. Prevent. Med. 2008, 46, 303–307. [Google Scholar] [CrossRef] [PubMed]
  25. Jiang, H.B.; Xu, J.G.; Qi, Y.; Chen, J.T. The quantitative analysis of large-scale supermarkets location based on time accessibility and Gasa rules. Geogr. Res. 2010, 29, 1056–1068. [Google Scholar]
  26. Ni, J.; Wang, J.; Rui, Y.; Qian, T.; Wang, J. An enhanced variable two-step floating catchment area method for measuring spatial accessibility to residential care facilities in Nanjing. Int. J. Environ. Res. Public Health 2015, 12, 14490–14504. [Google Scholar] [CrossRef] [PubMed]
  27. Sun, C.G.; Lin, T.; Zhao, Y.; Lin, M.X.; Yu, Z.W. Residential Spatial Differentiation Based on Urban Housing Types—An Empirical Study of Xiamen Island, China. Sustainability 2017, 9, 1777. [Google Scholar] [CrossRef]
  28. Wang, J.H.; Deng, Y.; Song, C.; Tian, D.J. Measuring time accessibility and its spatial characteristics in the urban areas of Beijing. J. Geogr. Sci. 2016, 26, 1754–1768. [Google Scholar] [CrossRef] [Green Version]
  29. Wang, S.T.; Zheng, S.Q.; Feng, J. Spatial accessibility of housing to public services and its impact on housing price: A case study of Beijing’s inner city. Prog. Geogr. 2007, 26, 78–85. [Google Scholar]
  30. Becker, R.A.; Caceres, R.; Hanson, K.; Loh, J.M.; Urbanek, S.; Varshavsky, A.; Volinsky, C. A tale of one city: Using cellular network data for urban planning. IEEE Perv. Comput. 2011, 10, 18–26. [Google Scholar] [CrossRef]
  31. Wu, S.M.; Chen, T.; Wu, Y.J.; Lytras, M. Smart cities in Taiwan: A perspective on big data applications. Sustainability 2018, 10, 106. [Google Scholar] [CrossRef]
  32. Kharrazi, A.; Qin, H.; Zhang, Y. Urban big data and sustainable development goals: Challenges and opportunities. Sustainability 2016, 8, 1293. [Google Scholar] [CrossRef]
  33. Kamrowska-Zaluska, D.; Obracht-Prondzyńska, H. The Use of Big Data in Regenerative Planning. Sustainability 2018, 10, 3668. [Google Scholar] [CrossRef]
  34. Guo, J.; Lyu, Y.Q.; Shen, T.Y. Urban spatial structure based on point pattern analysis: Taking Beijing metropolitan area as a case. Econ. Geogr. 2015, 35, 68–74. [Google Scholar]
  35. Kwan, M.P. GIS methods in time-geographic research: Geocomputation and geovisualization of human activity patterns. Geogr. Ann. Ser. B Hum. Geogr. 2004, 86, 267–280. [Google Scholar] [CrossRef]
  36. Stessens, P.; Khan, A.Z.; Huysmans, M.; Canters, F. Analysing urban green space accessibility and quality: A GIS-based model as spatial decision support for urban ecosystem services in Brussels. Ecosyst. Serv. 2017, 28, 328–340. [Google Scholar] [CrossRef]
  37. Wu, Z.Y.; Zhuo, J. Impact of Urban Built Environment on Urban Short-Distance Taxi Travel: The Case of Shanghai. Available online: http://0-iopscience-iop-org.brum.beds.ac.uk/article/10.1088/1755-1315/153/6/062019/pdf (accessed on 8 December 2016).
  38. Lytras, M.; Visvizi, A. Who uses smart city services and what to make of it: Toward interdisciplinary smart cities research. Sustainability 2018, 10, 1998. [Google Scholar] [CrossRef]
  39. Cao, X.; Chen, H.; Liang, F.; Wang, W. Measurement and Spatial Differentiation Characteristics of Transit Equity: A Case Study of Guangzhou, China. Sustainability 2018, 10, 1069. [Google Scholar] [CrossRef]
  40. Tang, F.; Mo, W.; Zhang, X.; Zhou, S. Spatial Distribution of Public Service Facilities Based on POI Data. Urban. Archit. 2017, 27, 35–39. [Google Scholar]
  41. Yin, C.H.; He, Q.S.; Liu, Y.F.; Chen, W.Q.; Gao, Y. Inequality of public health and its role in spatial accessibility to medical facilities in China. Appl. Geogr. 2018, 92, 50–62. [Google Scholar] [CrossRef]
  42. Lin, T.; Cao, X.; Huang, N.; Xu, L.; Li, X.; Zhao, Y.; Lin, J. Social cognition of climate change in the coastal community: A case study in Xiamen City, China. Ocean Manag. 2018. [Google Scholar] [CrossRef]
  43. Zhang, W. China Livable City Report; China Science Publishing Press: Beijing, China, 2016. [Google Scholar]
  44. Xiamen Statistical Bureau, Xiamen Special Economic Zone Yearbook 2017. Available online: http://www.stats-xm.gov.cn/tjzl/tjsj/tqnj/ (accessed on 28 September 2017).
  45. Lin, T.; Li, X.H.; Zhang, G.Q.; Zhao, Q.J.; Cui, S.H. Dynamic analysis of island urban spatial expansion and its determinants: A case study of Xiamen Island. Acta Geogr. Sin. 2010, 65, 715–726. [Google Scholar]
  46. The Ministry of Housing and Urban-Rural Development of the People’s Republic of China. The Code of Urban Residential Areas Planning & Design (2016). Available online: http://www.mohurd.gov.cn/ (accessed on 28 June 2016).
  47. Stewart, J.Q.; Warntz, W. Physics of population distribution. J. Reg Sci. 1958, 1, 99–121. [Google Scholar] [CrossRef]
  48. Su, S.L.; Li, Z.K.; Xu, M.Y.; Cai, Z.L.; Weng, M. A geo-big data approach to intra-urban food deserts: Transit-varying accessibility, social inequalities, and implications for urban planning. Habitat Int. 2017, 64, 22–40. [Google Scholar] [CrossRef]
  49. Widener, M.J.; Farber, S.; Neutens, T.; Horner, M. Spatiotemporal accessibility to supermarkets using public transit: An interaction potential approach in Cincinnati, Ohio. J. Transp. Geogr. 2015, 42, 72–83. [Google Scholar] [CrossRef]
  50. Widener, M.J.; Shannon, J. When are food deserts? Integrating time into research on food accessibility. Health Place 2014, 30, 1–3. [Google Scholar] [CrossRef]
  51. Song, Z.N.; Chen, W.; Zhang, G.X.; Zhang, L. Spatial accessibility to public service facilities and its measurement approaches. Prog. Geogr. 2010, 29, 1217–1224. [Google Scholar]
  52. Chen, L.; Zhang, W.; Yang, Y. Residents’ incongruence between reality and preference of accessibility to urban facilities in Beijing. Acta Geogr. Sin. 2013, 68, 1071–1081. [Google Scholar]
  53. Wang, F. Quantitative Methods and Socio-Economic Applications in GIS; CRC Press: Boca Raton, FL, USA, 2014. [Google Scholar]
  54. Luo, W.; Qi, Y. An enhanced two-step floating catchment area (E2SFCA) method for measuring spatial accessibility to primary care physicians. Health Place 2009, 15, 1100–1107. [Google Scholar] [CrossRef]
  55. Luo, W.; Whippo, T. Variable catchment sizes for the two-step floating catchment area (2SFCA) method. Health Place 2012, 18, 789–795. [Google Scholar] [CrossRef]
  56. Wang, F. Measurement, optimization, and impact of healthcare accessibility: A methodological review. Ann. Assoc. Am. Geogr. 2012, 102, 1104–1112. [Google Scholar] [CrossRef] [PubMed]
  57. TAO, Z.L.; Cheng, Y.; Dai, T.Q.; Li, X. Sensitivity Analysis of Parameters in Measuring Spatial Accessibility to Public Service Facilities. Mod. Urban Res. 2017, 3, 30–35. [Google Scholar] [CrossRef]
  58. Reed, G.F.; Lynn, F.; Meade, B.D. Use of coefficient of variation in assessing variability of quantitative assays. Clin. Diagn. Immunol. 2002, 9, 1235–1239. [Google Scholar] [CrossRef]
Figure 1. Study area: (a) Fujian Province in China, and (b) Xiamen City in Fujian Province. (c) The six districts of Xiamen City. We separated the regions in Xiamen Island with those in off-island areas using distinct colors and (d) the distribution of all the residential communities in Xiamen City.
Sustainability 10 04767 g001
Figure 2. Composite spatial accessibility assessment for the residential suitability of public services.
Sustainability 10 04767 g002
Figure 3. Regional performance of per capita public service supply supplement (LQ) and residential suitability assessment on facility spatial Layout in each district. The tables contain each district’s Mean and CV value of the residential accessibility. The assessment results of Healthcare, Leisure, Commerce, Transportation, and Education Service are separately demonstrated in (ae). (f) is the composite assessment of all the residential public services in Xiamen City.
Sustainability 10 04767 g003
Figure 4. Residential suitability assessment of communities surrounding public services in Xiamen City (Low: Score < Score mean − 0.5 × DV; Medium: Score [Score mean − 0.5 × DV, Score mean + 0.5 × DV]; High: Score > Score mean + 0.5 × DV; “Score” is the abbreviation of residential accessibility score of diverse type of public facilities).
Sustainability 10 04767 g004
Table 1. A brief history of administration in Xiamen City.
YearDowntownSuburban Area
1911Siming
1950SimingJimei
1957SimingJimei, Tong’an
1987Siming, HuliJimei, Tong’an
2003 until presentSiming, HuliJimei, Tong’an, Haicang, Xiang’an
Note: The Siming district was divided from the Tong’an district in 1911. The table neglected some districts that no longer exist, such as the Xinglin and Kaiyuan districts.
Table 2. Service Capacities of Public Facilities and Assessment Standards.
Public ServiceFacility LevelService Capacity Score
CommerceKey Business Circle
(Shopping Mall, Supermarket, Local Market and Store)
100–90
Non-Key Business Circle
(Shopping Mall)
85–80
Non-Key Business Circle
(Supermarket)
75–65
Non-Key Business Circle
(Local Market)
50
Non-Key Business Circle
(Store)
30
TransportationSubway Hub100
Subway Stop90
BRT Hub80
BRT Stop75
Bus Hub60–10
LeisureCity Level
(Historical Sites, Plaza, Park, and Library)
100
District Level
(Historical Sites, Plaza, Park, and Library)
80
Subdistrict Level
(Historical Sites, Plaza, Park, and Library)
60
Community Level
(Historical Sites, Plaza, Park, and Library)
50
1st Level Water View Settlement100
2nd Level Water View Settlement80
HealthcareTertiary100–75
Secondary65–60
Primary35–30
Clinic25
EducationProvincial key Primary School100
City Key Primary School80
Key Primary School70–65
Ordinary Primary School (Located on Xiamen Island)50
Ordinary Primary School (Located on Off-Island Area)30
Note: The levels of facilities are graded according to the views from local planning and facilities authorities respectively. The scores of each facility are the general reflections of their service capacity.
Table 3. Multiple demand buffers for transportation, commerce, leisure, and healthcare facilities.
Public ServiceBuffer Distance (km)Weight ( λ )
Transportation0.0–0.51.0
0.5–1.00.7
Commerce0.0–1.01.0
1.0–5.00.5
Leisure0.0–1.01.0
1.0–5.00.5
Healthcare0.0–1.01.0
1.0–3.00.5
Traffic TypeBusBRT (Rapid Bus Transportation)Subway
Weight (β)0.50.71
Table 4. The summary of public facilities in each district of Xiamen City.
Public ServiceFacility LevelSimingHuliTong’anHaicangJimeiXiang’an
HealthcareTotal193911475772123
Tertiary (HQ)741222
Secondary1353110
Primary1712125117
Clinic156701314958114
LeisureTotal5031127239
Park and historical sites (HQ)271483154
Plaza952121
Others14122364
CommerceTotal1164893263234347112
Shopping mall and Supermarket (HQ)613185146
Store and local market1103862255229333106
Transportation (Stops)Total316342469179324195
Subway (HQ)7600110
BRT128100130
Bus297328459179300195
EducationTotal473980244565
Key primary school (HQ)1443110
Ordinary primary school333577234465
Note: The amount of facilities was summarized with the district boundary. “HQ” is the abbreviation of the high-quality public facilities.
Table 5. Residential suitability on residential accessibility of all the public services in Xiamen City
AreaServiceMeanCV (%)
Xiamen CityCommerce76.2419.17
Traffic36.8965.15
Leisure70.0631.71
Healthcare85.3118.56
Education66.3427.86
Table 6. The spatial correlation of the residential accessibility of each type of public service in Xiamen City.
ServiceCommerceTransportationLeisureHealthcareEducation
Commerce1.000.670.450.680.45
Transportation0.671.000.300.540.41
Leisure0.450.301.000.420.29
Healthcare0.680.540.421.000.47
Education0.450.410.290.471.00

