Article

Ecological Niche Space of Fish Communities in Impounded Sections of Large Rivers: Its Application to Assessment of the Impact of Weirs on River Ecosystems

1
Bio-Monitoring Center, Sejong 30121, Korea
2
Department of Biology Education, Kongju National University, Gongju 32588, Korea
3
Department of Marine Sciences and Convergent Technology, Hanyang University, Ansan 426-791, Korea
4
Watershed Ecology Research Team, National Institute of Environmental Research, Incheon 22689, Korea
5
Department of Environmental Science and Engineering, Kyung Hee University, Yongin 446-701, Korea
*
Author to whom correspondence should be addressed.
Sustainability 2018, 10(12), 4784; https://0-doi-org.brum.beds.ac.uk/10.3390/su10124784
Submission received: 12 November 2018 / Revised: 6 December 2018 / Accepted: 12 December 2018 / Published: 14 December 2018
(This article belongs to the Section Sustainable Agriculture)

Abstract

:
To estimate the impact of weirs on large river fish communities, we applied the ecological niche space (ENS) measured quantitatively using carbon and nitrogen stable isotope ratios to the monitoring of effects of weirs constructed on four major rivers in Korea. ENS was calculated using the Bayesian stable isotope in R statistics. The ENS of fish communities showed persistent differences between upstream and downstream areas of all studied weirs. The ENSs of omnivores were larger in upstream impounded areas but the ENSs of predator species, both endemic (Erythroculter erythropterus) and exotic (Micropterus salmoides) predators had decreased ENSs in upstream areas. E. erythropterus showed horizontal variations in a wide range of carbon stable isotopes, whereas M. salmoides showed vertical variations in nitrogen stable isotopes. The results suggest that weir construction may have species-specific impact on the ENS of fish community by impoundment and increase niche overlap in upstream areas of the weir. The measured ENS of fish community was significantly correlated with the relative abundance of tolerant species negatively, whereas correlated with that of endemic species positively, suggesting that the ENS can be used as a comprehensive indicator of habitat conditions.

1. Introduction

Hydrological modification of river channels by dams and weirs has been undertaken all over the world to secure water resources and prevent floods. At the same time, concerns regarding extensive ecological degradation and loss of biological diversity caused by river exploitation have increased [1]. The presence of dams and weirs interrupts the longitudinal connectivity of river channels and introduces habitat instability, with consequent negative impacts on fish communities [2,3,4]. Recently, the ecosystem service value of river ecosystems has been significantly increased by restoration efforts made for a variety of purposes, including not only traditional purposes such as improvement of water quality and flood control but also improvement of habitats and biodiversity [5]. In particular, from the viewpoint of cultural services, which are increasingly provided by ecosystem services, the condition of habitats supporting fish diversity has become a key point for the restoration and conservation of river environments [6]. Therefore, the majority of river restoration efforts focuses on the removal of dams and weirs that degraded river ecosystems by flow regulation and loss of connectivity [7,8]. However, the impact of large dams on fish communities is much better documented than that of weirs [9,10].
In Korea, 16 weirs were constructed in the main channels of four rivers through the Four Major Rivers Restoration Project [11]. The project was carried out from 2009 to 2012 to mitigate water scarcity, implement comprehensive flood control measures, improve water quality, restore the ecosystem, create multipurpose public spaces for local residents and engage in river-oriented regional development. The project included dredging of nearly 570 million cubic meters of sediment from the rivers, reinforcement of embankments and expansion of the capacity of 96 irrigation dams and 2 flood control reservoirs. Eight weirs were constructed in the main channel of the Nakdong River, the longest river in Korea, three weirs in the Han River and the Geum River and two weirs in the Yeongsan River. These 16 multi-functional weirs (height 3.5–11.8 m) were designed to regulate the amount of water according to the weather conditions and they are classified as small- to mid-sized dams in terms of height [12]. However, construction of the weirs led to changes in water quality and ecological degradation of fish communities related to increases in exotic and tolerant species [13,14].
The main negative impact of weirs is their blocking of the movement of migratory fish by providing a physical barrier across the channel. Not only anadromous fish species but also potamodromous and resident freshwater species migrate within certain ranges of river channels, which are shown by their usage of fishways across the weirs [4,10,15]. Impoundments frequently causes water quality problems because of stagnation of the water and increased productivity. However, there has been limited monitoring of biomass, composition-based community index and information needed for the long-term management of biological communities in river habitats regarding weirs. Therefore, habitat-based monitoring is necessary for the assessment of fish communities in relation to the impact of weirs [3].
Carbon and nitrogen stable isotopes are used to indicate time-integrated diets of consumers and potentially provide quantitative information regarding estimates of resource variation and overlap among food web components. Early use of stable isotope data was limited to trophic ecology of population regarding the variations in food sources (range of carbon stable isotopes) and the trophic positions of target species (range of nitrogen isotopes). On the other hand, later applications include the quantification of food web structures such as food chain length and dietary overlaps [16]. Since the concept of niche space (particularly for trophic niche) can be simply explained by what they eat and its connected region in the food web [17], two-dimensional space created by carbon and nitrogen isotope data of target organism can indicate its ecological niche space. Recently, theoretical measures of species requirements in habitats, ecological niche, have been used as isotopic niches representing a subset of the overall ecological niche [18,19]. In the present study, the ecological niche space (ENS) of fish, which was measured on the basis of δ13C and δ15N ratios, was used to estimate the impact of weirs on fish communities.
The sustainability of biodiversity and ecosystem functioning depends on knowledge of the structure and function of species assemblages and this understanding is challenged by natural variations in both time and space. In the present study, to estimate the impact of weirs on fish communities based on habitat quality, mainly focusing on the food environment driving biological interactions among fish species and supporting their diversity, we monitored weir sections of large Korean rivers based on guilds of major fish species. Ecological niches and their overlap were quantitatively measured using stable isotope ratios of carbon and nitrogen, which have recently been used for monitoring of fish communities [16].

2. Materials and Methods

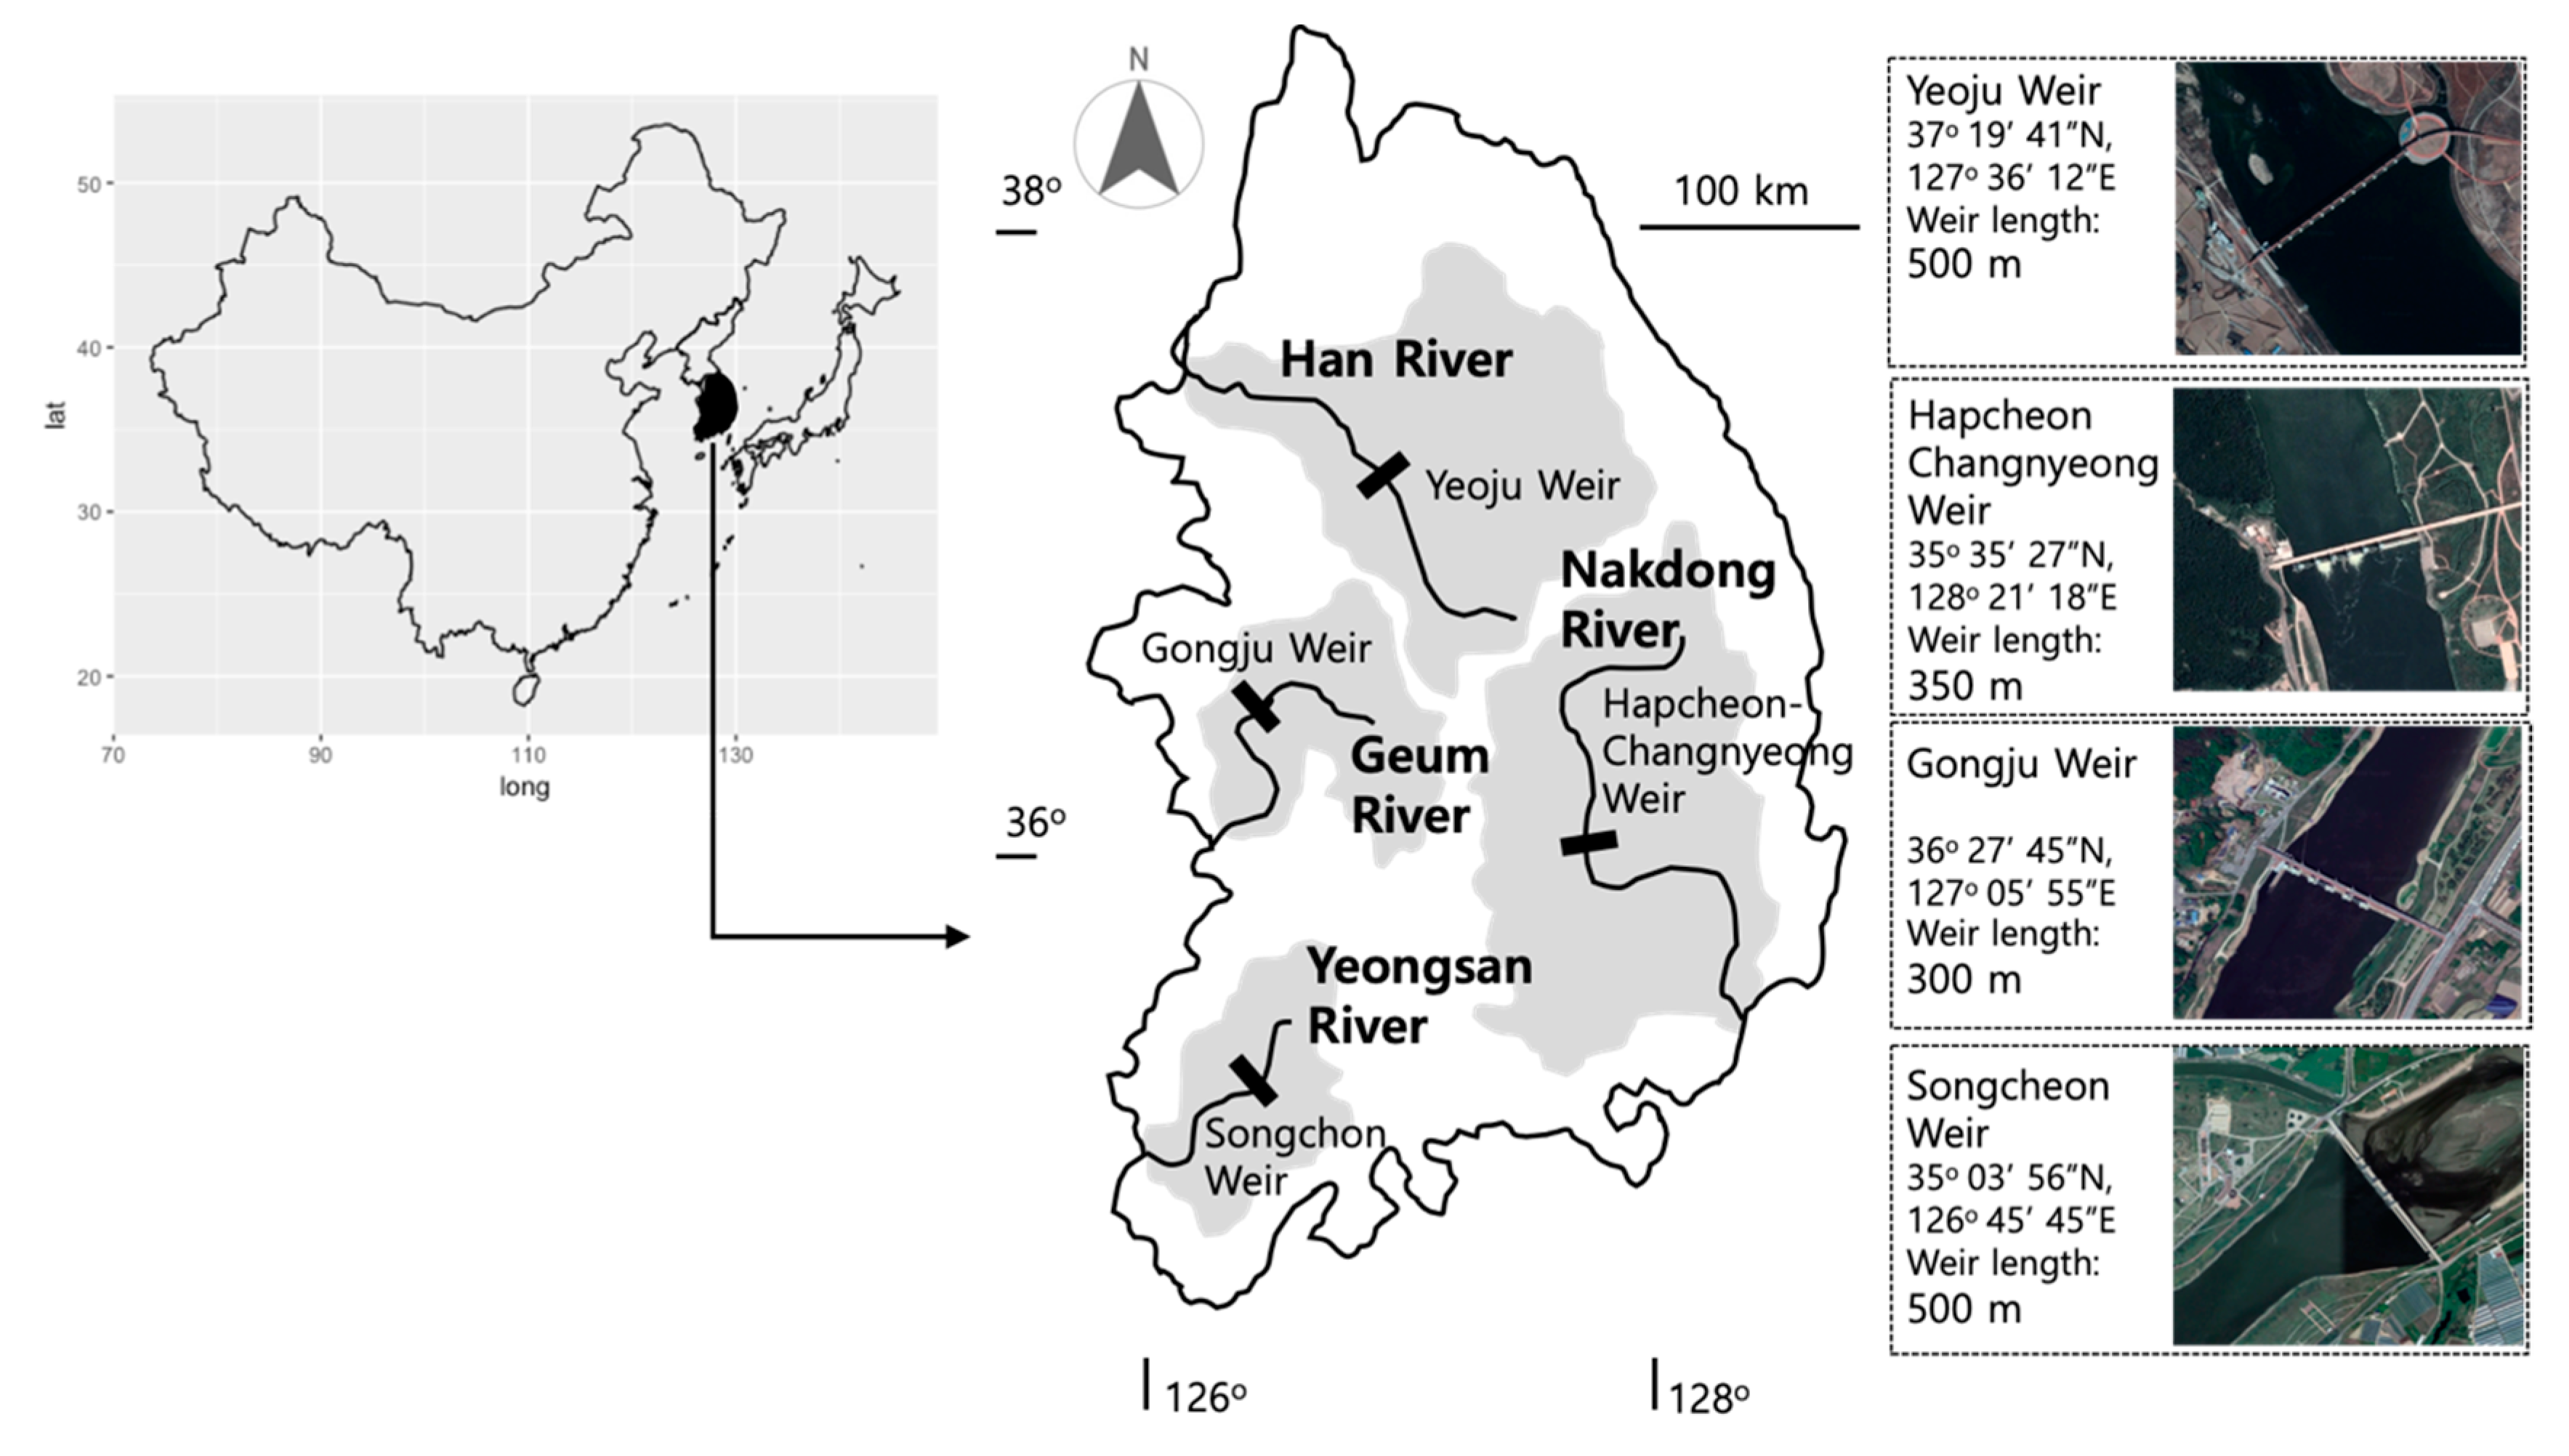
2.1. Study Sites and Fish Sampling

From four major Korean rivers, one weir from each was selected, comprising two eighth-order rivers (the Han and Nakdong rivers) and two seventh-order rivers (the Geum and Yeongsan rivers). Fish samples were collected from the lower and upper parts of the four selected weirs at 500 m from the weirs (Figure 1). All samplings were carried out in June 2017. Basic water quality parameters (water temperature, pH, EC and DO) were measured using Water Quality Monitoring System (U-50, HORIBA, Kyoto, Japan) at five points at 1 m depth intervals along a horizontal section of the study sites from both the left and right banks to the center and average values were calculated. Further water quality data (TOC, BOD, TN and TP) were obtained from the Water Environment Information System of the Ministry of Environment, Korea (http://water.nier.go.kr).
Three different types of gear, a cast net (7 mm mesh), fixed shore nets (4 mm mesh) and skimming nets (4 mm mesh), were used for collecting fishes. The cast net was deployed 10 times at 20 m intervals along a 200 m section. The fixed shore nets were set in the afternoon before sunset and retrieved the next morning after sunrise [20].

2.2. Community Index and Habitat Index

The diversity index (H′) [21] and the dominance index (D) [22] were calculated as indices of fish community structure. The relative abundances of tolerant species and endemic species were determined on the basis of the composition of collected fish samples. We categorized collected fish to different environmental guilds (tolerant, intermediate and sensitive species) following the river assessment manual of Ministry of Environment, Korea [20]. The benthic macroinvertebrate index (BMI) and the vegetation index were calculated as habitat indices [23,24,25]. The vegetation index was calculated based on the area of aquatic vegetation, diversity and the contribution as habitats for fish characterized by vegetation types. The nitrogen stable isotope ratio was used for estimation of river pollution by sources from the catchments [26]. The condition factor (CF) was calculated for major predator species as the ratio of total length to body weight measured in the field using at least 20 individuals of selected predator species [27,28].

2.3. Stable Isotope Analysis and Niche Calculations

Stable isotope values were determined for major species collected at a total of eight sites, consisting of the upstream and downstream regions of four weirs. Selected target species were used for isotope analyses to determine the specific ENSs of representative categories (omnivores and carnivorous predators). Three to five adult individuals representing different feeding behaviors were selected for the analyses. For omnivore species, the species that were caught for sampling and used for isotope analyses differed among different sites (Table 1). On the other hand, predator species such as Erythroculter erythropterus, Opsariichthys bidens and Micropterus salmoides, were collected from all four rivers. Back muscle tissues were collected from each individual and freeze-dried at −80 °C for at least 24 h. Lipid contents of the samples were removed by the chloroform/methanol (2/1 v/v) treatment [29].
As the primary food sources, the stable isotope ratios of particulate organic matter (POM), including planktonic matter and attached forms, were also measured with three replicates. For planktonic POM, surface river water was filtered through pretreated GF/F filters, which were acid pretreated to remove inorganic carbon before isotope analysis [29]. For attached POM, small cobbles were collected from littoral areas, organic matter was brushed away from the substrate and the same pretreatment was carried out. All fish and POM samples were freeze-dried at −80 °C.
The carbon and nitrogen isotope ratios of the samples were measured using an isotope ratio mass spectrometer (Isoprime, GV Instruments, Manchester, UK). All isotopic data are reported using the conventional δ notation, where δ13C or δ15N = (Rsample/Rstandard − 1)(‰). R is the 13C/12C or 15N/14N ratio for δ13C or δ15N, respectively. Vienna Pee Dee Belemnite and N2 in air were used as international standard for δ13C and δ15N, respectively. The overall analytical error values were within 0.1‰ for both δ13C and δ15N.
The breadth of each species’ isotopic niche was determined as the area of a two-dimensional Bayesian ellipse calculated using stable isotope Bayesian ellipses in R (package SIBER [19]). Bayesian ellipse areas were calculated with small sample size correction (SEAc [30]). The isotopic ellipses of each fish group or species were calculated with 95% confidential interval.
The ENS can be used as an estimate of resource use by competing species, particularly for carnivorous predator species [31]. Unlike carbon stable isotope ratios that indicate variation in food sources and are used for among-site comparisons, nitrogen stable isotope ratios can be affected by nonbiological factors, such as nitrogen pollution sources and are sensitive to baseline variability in nonbiological factors among sites [32]. Therefore, for comparison of ENS responses of major predator species to the presence of weirs, we standardized each species’ ENS by adjusting the nitrogen stable isotope ratios of individuals of the same species to zero baseline. Among individuals of the same species at each site, the lowest nitrogen stable isotope value was adjusted to zero and the same magnitude of nitrogen stable isotope values was adjusted for other individuals of the same species. Then the ENS values of all species were pooled to compare their variation across the weirs. On the other hand, we calculated and plotted the ENSs of planktonic and benthic POMs together as to show the variation in organic sources (planktonic vs. benthic organic matters) for fish community.
The statistical comparisons between water quality variables and indices of upstream and downstream of the weirs (Table 2 and Table 3) were made by paired t-test or Wilcoxon signed rank test depending on the normality of variables. To estimate the relationships between the ENSs of fish community and indices of community and habitat, the Pearson’s correlation coefficient or Spearman’s rank-order correlation test were performed after the normality of all variables was tested by Shapiro-Wilk test. The ENSs and habitat indices were transformed by logarithm (log(x + 1)). All analyses were conducted in RStudio (v.1.1.456).

3. Results

3.1. Water Quality

Among the four major Korean rivers, the Yeongsan River had the highest concentrations of total nitrogen and total phosphorus and overall the most eutrophicated environment. The Han River was less eutrophicated and all water quality parameters related with eutrophication showed lower values than other rivers. Remarkable differences in water quality were not observed between the upstream and downstream areas of the weirs (paired t-test, p > 0.05).

3.2. Fish Community

The total fish catch differed among sites, with the highest number of individuals in the upper region of the Yeoju weir in the Han River (1211 individuals) and the lowest in the lower region of the Hapcheon weir in the Nakdong River (29 individuals) (Table 2). At all study sites, the fish catch was higher in the upstream region of the weir, although the statistical difference was not obtained (paired t-test, p = 0.155). The omnivorous Squalidus chankaensis tsuchigae was the most frequently collected species, accounting for 38.6% of total fish catch (Table A1). The dominant fish species differed among rivers. Omnivorous species were dominant in most study sites except the Nakdong River, where the predatory O. bidens was dominant in both the upstream and downstream regions of the weir.
The species diversity (Shannon diversity) of the fish community ranged from 1.06 in the Geum River to 2.40 in the Nakdong River (Table 2). The dominance index showed the opposite pattern to the diversity index, with the highest value in the downstream of the Gongju weir in the Geum River. Only one sensitive species was collected from the Han River (Table A1) and most species were intermediate or tolerant species. The percentage of tolerant species was highest in the Geum River. The percentage of endemic species was highest in the Han River and lowest in the Geum River. The highest abundance of endemic species and the lowest abundance of tolerant species were recorded in the Han River, in which water quality parameters were within the range of those in less eutrophicated environments, with lower levels of TOC, BOD and nutrients. However, no clear differences between upstream and downstream were found in the diversity and dominance indices (Wilcoxon signed rank test, p > 0.05).
In the comparison between the upstream and downstream areas of the weirs, the total fish catch and the diversity index were often higher in the upper impounded area of the weir and there was no persistent pattern showing unequal distribution of diversity and dominance indices across the weirs. The largest difference in diversity between the upstream and downstream of a weir was observed in the Geum River, where the diversity was lowest whereas the dominance was highest among study sites (1.06). The lower part of Gongju Weir also showed the highest percentage of tolerant species and the lowest percentage of endemic species. In the Nakdong River, there was little difference in all indices between the upstream and downstream areas (Table 2).

3.3. Habitat Index

Measured indices (BMI and vegetation index) and variables (POM nitrogen stable isotope ratio and fish condition factor) provided different estimations for both comparison of four rivers and comparison between upstream and downstream of weirs (Table 3). BMI, which represents the health condition of a habitat from the calculated macroinvertebrate composition metric (detailed data not shown), was highest in the Han River. The BMI indices were much lower in the Yeongsan River. The nitrogen stable isotope ratio showed a similar trend with the BMI indices (Table 3); higher ratios indicate higher organic pollution sources from the catchment area [26]. Other indices, the vegetation index, which was calculated on the basis of the composition of aquatic plants and vegetation around the river and the CF of predatory fish species, did not follow the variation of the other two indices and water quality parameters. The CF was much higher in the Yeongsan River, despite other indices indicating a worse environmental condition. No persistent differences were observed in water quality parameters and measured variables between the upper and lower areas of the weirs (Wilcoxon signed rank test, p > 0.05).

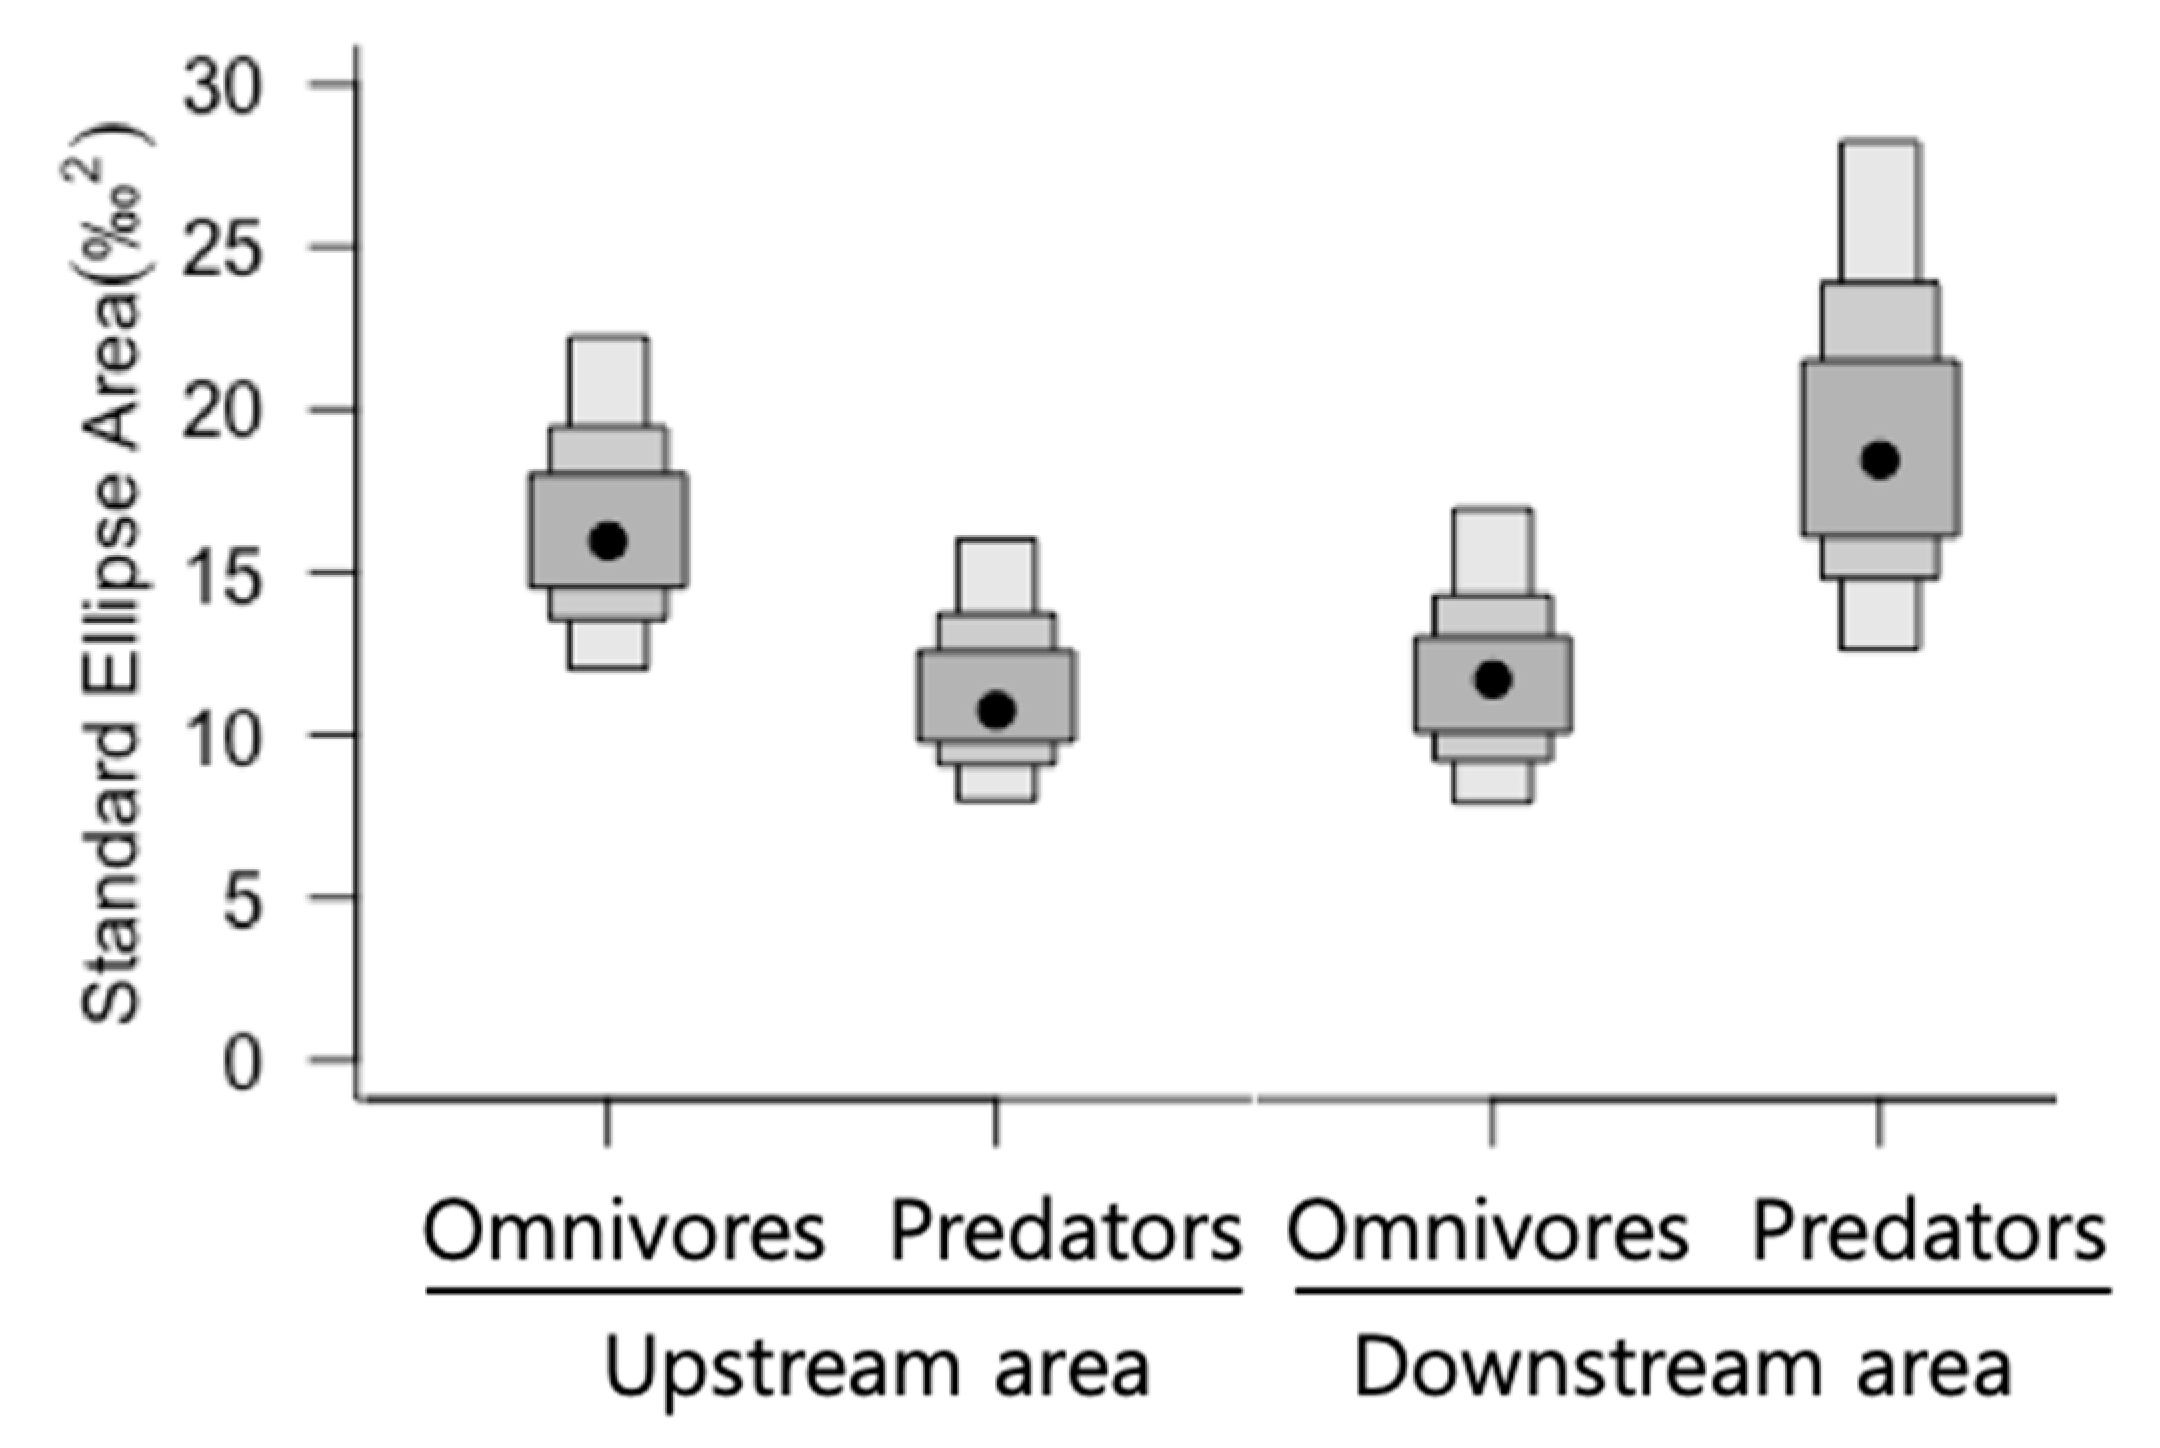
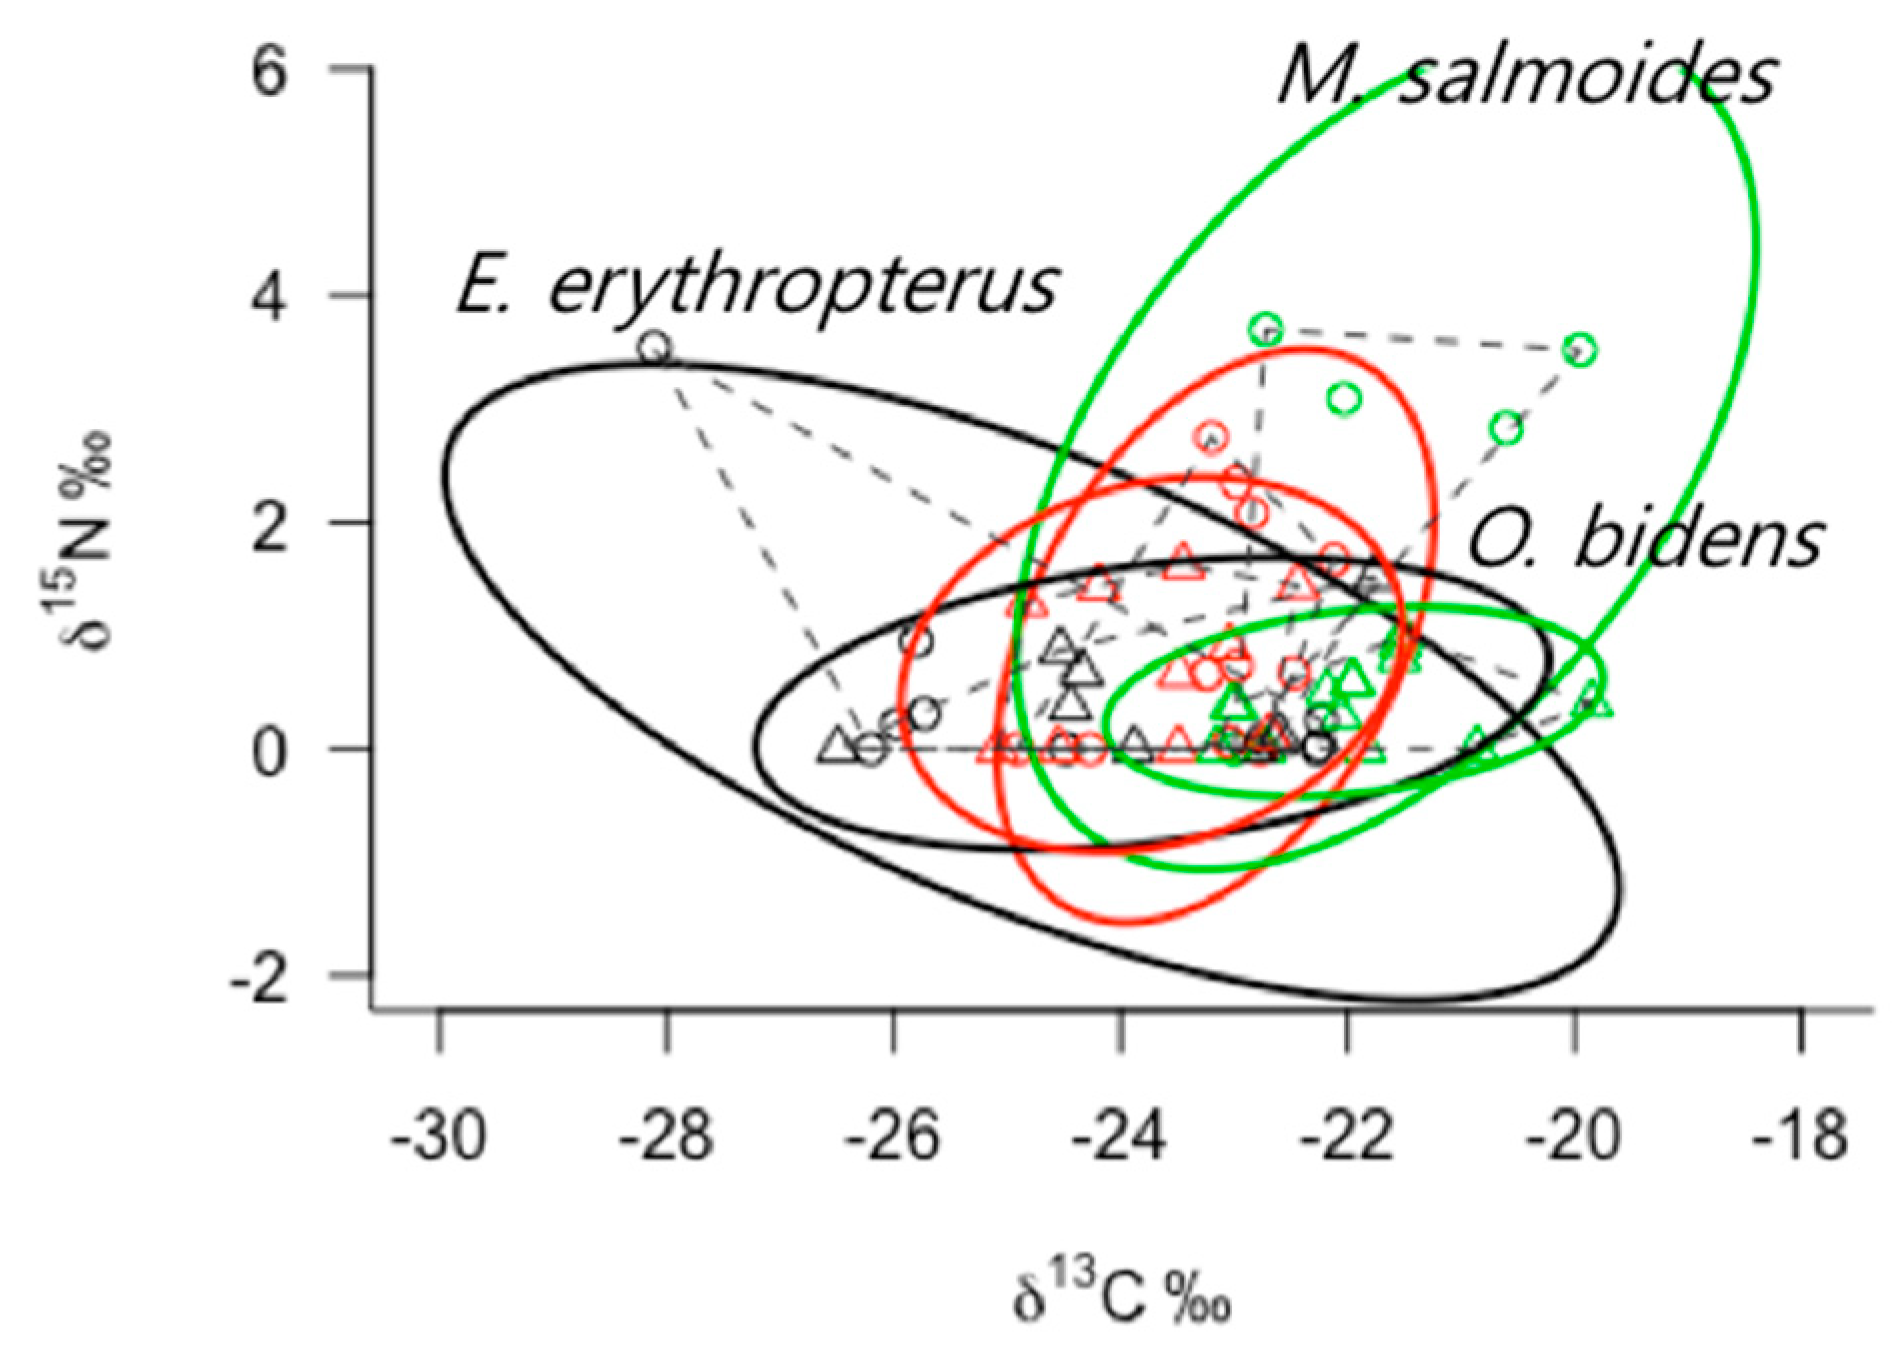
3.4. Ecological Niche Space of Fish and Overlap between Species Different Guild

The ENSs of fish assemblages, including omnivores and predatory species, were markedly narrower in the Geum River than in the other rivers (Figure 2). The ENSs of fish communities showed the similar tendencies in all study sites; the upstream regions had narrower ENS with aggregations of each individual plot. In the Han River, there was less overlap between the ENSs for the upstream and downstream areas of the weirs, whereas in the other rivers, there was an overlapping but narrower area in the upstream area of the weir. The ENS of the upstream area was located at the inside of the downstream area ENS in Geum and Yeongsan Rivers. This trend is most apparent in the Geum River, where the ENS was the narrowest among the four rivers.
For POM, both planktonic and benthic (mainly attached to cobbles) matter showed overlapping stable isotope signals. Since we plotted planktonic and benthic POM together with each three replicates, their widths indicate the difference between planktonic primary producers, mainly phytoplankton and organic matter, including both precipitated matter and benthic diatoms. The horizontal range of POM in the Han River was wide, whereas that in the Nakdong River was wide both horizontally and vertically (Figure 2). Different from Han River where the range of POM’s nitrogen stable isotopes was 9.42–11.18‰, that in Nakdong River was highly variable as 10.65–17.89‰. In the Yeongsan River, the nitrogen stable isotope ratio was also high as 14.61–19.09‰ and higher than that of fish.
When the fishes of all rivers were pooled as two different guilds, omnivores and predators and their ENSs were compared, predators had larger ENSs in the lower areas of the weirs and omnivores had narrower ENSs in the downstream areas of the weirs (Figure 3). In the upstream areas of the weirs, omnivores and predators showed opposite patterns.

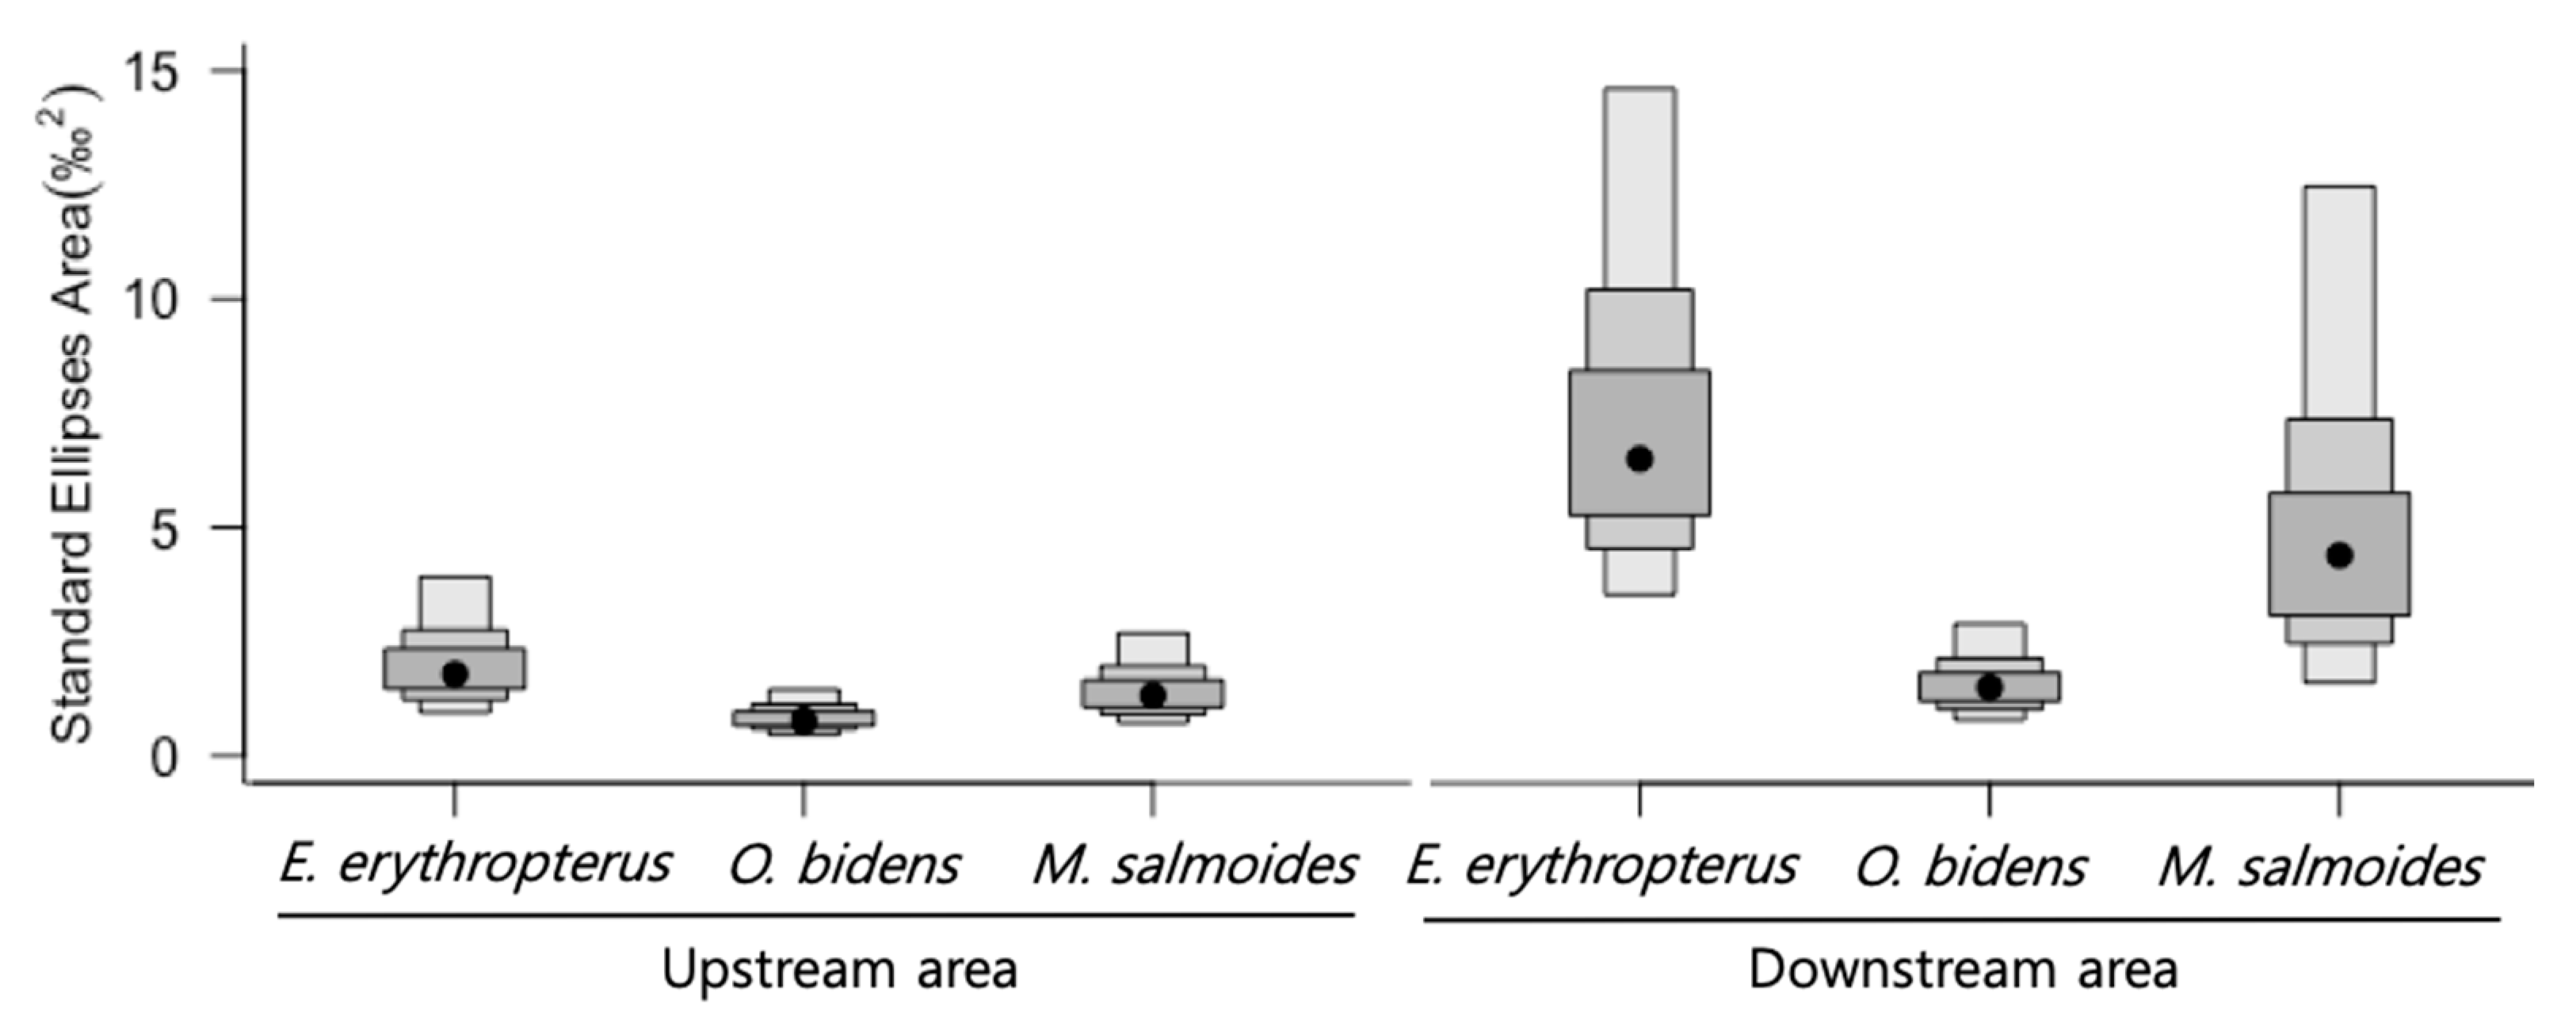
3.5. Comparison of ENSs of Predator Species

In downstream areas of the weirs, E. erythropterus and M. salmoides had larger ENSs than O. bidens (Figure 4). The ENS calculated by the stable isotopes of M. salmoides was largest as 7.33‰2, followed by E. erythropterus (6.62‰2). However, the ENS of O. bidens was much narrower (2.59‰2) than those two species. On the other hand, three predator species had narrow and similar ENSs in upstream areas of the weirs (E. erythropterus, 2.58‰2; M. salmoides, 1.01‰2; O. bidens, 2.11‰2). Consequently, E. erythropterus and M. salmoides showed marked differences in ENS between the upstream and downstream areas of the weirs, suggesting narrower food ranges in the upper areas. On the other hand, O. bidens showed a narrower range of ENSs and its ENSs were similar between upstream and downstream of the weirs. E. erythropterus had a wider range of ENSs for the variation of carbon stable isotope ratios (range of food sources), whereas M. salmoides showed vertical variations of nitrogen stable isotopes, indicating their trophic level (Figure 5).
When the ENSs of the total fish community were compared with other indices and variables measured in the present study, the ENSs showed relationships with community-related indices regardless of upstream and downstream of weirs (Figure 6). The ENSs showed positive relationships with species diversity of fish community and the percentage of endemic species, whereas negative relationships with dominance index and the percentage of tolerant species. In particular, the ENSs showed statistically significant correlations with the percentage (%) of tolerant species and endemic species (Pearson’s correlation test, p < 0.05). Although the relationships were not significant, the ENS showed positive relationship with vegetation index which indicates the availability of aquatic vegetation as the habitats for fish (r = 0.052, p = 0.1796), whereas negative relationship with nitrogen stable isotope ratio of POM which indicates the pollution level of catchment (r = −0.400, p = 0.327) [26].

4. Discussion

The impacts of obstacles on fish communities are believed to be obvious, since these artificial structures prevent the migration of local fish species and often cause quantitative and qualitative changes in the flow of materials through modification of the flow regime in river channels [2,4,33]. However, water quality parameters and biological assessments often do not represent the impact of weirs and small dams [34] and it is often difficult to suggest reliable indicators for assessment of their impact. In particular, compared with the impact of dams, the impact of weirs on fish communities has not been sufficiently studied [4,10]. This mismatch can be attributed to the limitation of assessment tools that depend on snapshot surveys. Species composition and diversity completely depend on the results of such snapshot sampling, which cannot always guarantee complete collection of existing species in the habitat. Efforts should be made to include enough limnophilic and rheophilic species in fish samples for precise results; many fish species are both limnophilic and rheophilic.
In the present study, differences between weirs in basic water quality parameters and community indices, including the diversity index, were not observed. In contrast, ENS measured quantitatively using carbon and nitrogen stable isotope ratios showed persistent differences across weirs, regardless of sampling results, such as total fish catch and measured diversity indices. Besides the barrier effect disrupting and limiting the migration of fish, additional negative impacts of weirs, particularly at upstream locations, include habitat-related alterations as well as changes in food sources and feeding efficiency. However, ecological indicators that represent such habitat conditions comprehensively have not been studied sufficiently [35].
The stable isotope ratios of POM which serves as origin of organic food sources showed high variation among rivers. The wide horizontal variation in carbon stable isotope ratios of POM can be attributed to the difference between planktonic and benthic POMs and consequently indicates high diversity of food sources [36]. At the same time, vertical difference in nitrogen stable isotope ratio of POM is often used as an indicator of pollution particularly by artificial nitrogen sources. Therefore, higher nitrogen stable isotope ratio of POM indicates that the river is highly affected by artificial nitrogen sources from the catchment [26]. In the present study, the carbon and nitrogen stable isotope ratios of study sites showed high variation among rivers but the clear trend showing the difference between upstream and downstream of the weirs was not observed.
On the other hand, the ENS showed different responses for different trophic guild groups such as omnivores and predators. In the upstream areas of the weirs, omnivores and predators showed opposite patterns. Thus, the presence of a weir decreases the ENS of predators but increases the ENS of omnivores in the impounded upstream area. Because the study sites were eutrophic and the construction of weirs introduced deep and stagnant environments upstream of weirs [37]. Consequently, the upstream area of weir is more likely to be dominated by planktonic organisms and interaction with benthic food sources may be limited. Omnivore species may benefit from impoundment upstream, probably due to increase in organic particles, including planktonic food sources [38]. However, decrease in the ENS of predators upstream suggests that this habitat condition may negatively affect the feeding of predators, since river predators such as largemouth bass prefer benthic prey, such as crustaceans [39]. Therefore, their available food sources may be limited at upstream locations and their niches may overlap with those of omnivores.
Among predator species, the trends in ENS across the weirs were species specific. Impoundment in upstream locations may result in higher productivity and consequent increase of lentic environments, with high densities of planktonic organisms [13,38,40]. This may have a positive impact on omnivores. The trophic level of largemouth bass decreases in upstream locations, which suggests that they may become more omnivorous by selecting prey from lower trophic levels [41]. The predatory carp E. erythropterus is also known to feed on benthic invertebrates and juvenile fish. They also pursue and select prey near the water surface [42]. The wide horizontal range of predatory E. erythropterus’s ENS at downstream but narrower ENS at upstream of the weirs may indicate that its niche is specified by selecting various prey items at the same trophic level, avoiding overlap with largemouth bass in the downstream area of the weirs, which is a more lotic environment but their niches overlap in upstream locations. Therefore, their feeding behaviors and responses to the presence of weirs are functionally different and habitat conditions induced by the presence of weirs may increase their competition.
The ENSs of the fish community considering various guilds together showed persistently different patterns, particularly depending on trophic guilds and species. Among the observed indices, the ENS showed correlations with most of commonly used indices. In particular, the ENS was positively correlated with fish diversity and significant correlation was observed for the relative abundance of tolerant species and endemic species. The results suggest that resource availability and competition among species can be represented by the ENS of fish community and it will be helpful to estimate the future impacts of introduced species through predation and competition as well as the impacts of artificial modification of river channel.

5. Conclusions

The ENS was measured by stable isotope ratios of carbon and nitrogen for fish community in upstream and downstream of weirs constructed in the main channel of large rivers. The measured ENSs of the fish community considering various guilds together showed persistently different patterns, particularly depending on trophic guilds and species. The results showed possible impacts of weirs on the habitat condition and consequent decrease in the ENS of dominant predator species.
The sustainability of river ecosystem services may depend on the stability of river food webs. The complexity of food web structures, particularly the multiple sources of food, plays an important role in supporting complex food webs and maintaining their stability [32]. Our results suggest that the presence of weirs in river channels may decrease the availability of food sources for competing species and increase their competition for resources. The concept of the ENS and its quantitative measurement by stable isotopes can provide a tool to monitor this aspect of food webs and evidence regarding the effect of artificial disturbances on biological processes for sustainable management.

Author Contributions

Conceptualization, K.-H.C.; methodology, K.-H.C. and K.-H.S.; investigation, J.W.H. and M.-H.J.; writing-original draft preparation, K.-H.C., M.-H.J. and J.W.H.; writing-review and editing, K.-H.C.; visualization, K.-H.C.; project administration, K.-L.L. and M.-H.J.

Funding

This research was funded by NIER, “Research on the characteristics of large river ecosystem (NIER-SP2017-359)”.

Acknowledgments

We thank B. Choi and all staff of BMC, KES, Cheongrock and SOKN for their support in field survey and data collection. We also acknowledge undergraduate and graduate students of Kyung Hee University, Gongju National University and Hanyang University for their support in field sampling and data processing.

Conflicts of Interest

The authors declare no conflict of interest.

Appendix A

Table A1. Species composition and individual numbers (total fish catch) of fish community in the study sites.
Class
(Species)
TG 1EI 2Han River
(Yeoju Weir)
Nakdong River
(Hapcheon Weir)
Geum River
(Gongju Weir)
Yeongsan River
(Seungchon Weir)
Region U 3D 4UDUDUD
Channidae
Channa argusTS 3 111
Centrarchidae
Micropterus salmoidesTSI9 3986841
Lepomis macrochirusTSI1 44212123388
Centropomidae
Siniperca scherzeriIS 1
Odontobutidae
Odontobutis interruptaISE2
Bagridae
Pseudobagrus koreanusISE 1 1
Pseudobagrus fulvidracoTS 4
Gobiidae
Rhinogobius brunneusIS 1 73 4
Rhinogobius giurinusTS 1
Tridentiger brevispinisIS 2
Siluridae
Silurus asotusTS 4 1 1
Cobitidae
Cobitis rotundicaudataSSE1
Misgurnus mizolepisTS 3
Cyprinidae
Abbottina rivularisTS 4
Acanthorhodeus asmussiIS 4 182
Acanthorhodeus gracilisISE191121 205
Acheilognathus lanceolatusIS 1
Acheilognathus yamatsutaeISE66980
Carassius carassiusTS 3441 3 2320
Carassius cuvieriTSI 94
Cyprinus carpioTSI12 1 4
Erythroculter erythropterusTS 4104441935
Gnathopogon strigatusIS 2
Hemibarbus labeoTS 3327188 121143
Hemiculter eigenmanniTSE 13 51611
Microphysogobio jeoniISE 13533
Microphysogobio yaluensisISE 1
Opsariichthys uncirostrisTS 15140620263645
Paracheilognathus rhombeaIS 7 3
Pseudogobio esocinusIS 21 314
Pseudorasbora parvaTS 1217 1 1
Pungtungia herziIS 124
Sarcocheilichthys nigripinnisISE261 1
Sarcocheilichthys wakiyaeISE49 1
Squalidus chankaensis tsuchigaeISE 1781 51212
Squalidus japonicus CoreanuTSE5946 4042
Squaliobarbus curriculusIS 34
Zacco platypusIS 10215106 719 1
Total species number 221710618191315
Total individual number 121138499029235201446379
1 Tolerance guild (TS, tolerant species; IS, intermediate species; SS, sensitive species); 2 Endemic (E) or Invasive (I) species; 3 Upstream (U); 4 Downstream (D).

References

  1. Poff, N.L.; Allan, J.D.; Bain, M.B.; Karr, J.R.; Prestegaard, K.L.; Richter, B.D.; Sparks, R.E.; Stromberg, J.C. The natural flow paradigm. BioScience 1997, 47, 769–784. [Google Scholar] [CrossRef]
  2. Bain, M.B.; Finn, J.T.; Booke, H.E. Streamflow regulation and fish community structure. Ecology 1988, 69, 382–392. [Google Scholar] [CrossRef]
  3. Musil, J.; Horky, P.; Slavik, O.; Zboril, A.; Horka, P. The response of the young of the year fish to river obstacles: Functional and numerical linkages between dams, weirs, fish habitat guilds and biotic integrity across large spatial scale. Ecol. Indic. 2012, 23, 634–640. [Google Scholar] [CrossRef]
  4. Amaral, S.D.; Branco, P.; da Silva, A.T.; Datopodis, C.; Viseu, T.; Ferreira, M.T.; Pinheiro, A.N.; Santos, J.M. Upstream passage of potamodromous cyprinids over small weirs: The influence of key-hydraulic parameters. J. Ecohydraul. 2016, 1, 79–89. [Google Scholar] [CrossRef]
  5. Vermaat, J.E.; Wagtendok, A.J.; Brouwer, R.; Sheremet, O.; Ansink, E.; Brockhoff, T.; Plug, M.; Hellsten, S.; Aroviita, J.; Tylec, L.; et al. Assessing the sociental benefits of river restoration using the ecosystem services approach. Hydrobiologia 2015, 769, 121–135. [Google Scholar] [CrossRef]
  6. Doi, H.; Katano, I.; Negishi, J.N.; Sanada, S.; Kayaba, Y. Effects of biodiversity, habitat structure, and water quality on recreational use of rivers. Ecophere 2013, 4, 102. [Google Scholar] [CrossRef]
  7. Ward, J.V.; Stanford, J.A. The Ecology of regulated streams: Past accomplishment and directions for future research. In Regulated Streams; Craig, J.F., Kemper, J.B., Eds.; Springer: Boston, MA, USA, 1987; pp. 391–409. ISBN 978-1-4684-5394-2. [Google Scholar]
  8. Branco, P.; Amaral, S.D.; Ferreira, M.T.; Santos, J.M. Do small barriers affect the movement of freshwater fish by increasing residency? Sci. Total Environ. 2017, 581–582, 486–494. [Google Scholar] [CrossRef] [PubMed]
  9. Poulet, N. Impact of weirs on fish communities in a Piedmont Stream. River Res. Appl. 2007, 23, 1038–1047. [Google Scholar] [CrossRef]
  10. Amaral, S.D.; Branco, P.; Romao, F.; Viseu, T.; Ferreira, M.T.; Pinheiro, A.N.; Santos, J.M. The effect of weir crest width and discharge on passage performance of a potamodromous cycprinid. Mar. Freshw. Res. 2018. [Google Scholar] [CrossRef]
  11. Lah, T.J.; Park, Y.; Cho, Y.J. The four major rivers restoration project of South Korea: An assessment of its process, program, and political dimensions. J. Environ. Dev. 2015, 24, 375–394. [Google Scholar] [CrossRef]
  12. Ahn, J.M.; Lee, S.; Kang, T. Evaluation of dams and weirs operating for water resource management of the Geum River. Sci. Total Environ. 2014, 478, 103–115. [Google Scholar] [CrossRef] [PubMed]
  13. Lee, J.H.; Han, J.H.; Lim, B.J.; Park, J.H.; Shin, J.K.; An, K.G. Comparative analysis of fish fauna and community structures before and after the artificial weir construction in the mainstreams and tributaries of Yeongsan River watershed. Korean J. Ecol. Environ. 2013, 46, 103–115. [Google Scholar] [CrossRef]
  14. Cha, S.M.; Kang, M.J.; Park, Y.; Lee, S.W.; Kim, J.H. Water quality changes according to the midstream weir construction in the Yeongsan River, Korea. Desalin. Water Treat. 2014, 53, 3066–3071. [Google Scholar] [CrossRef]
  15. Kim, J.H.; Yoon, J.D.; Baek, S.H.; Park, S.H.; Lee, J.W.; Lee, J.A.; Jang, M.H. An efficiency analysis of a nature-like fishway for freshwater fish ascending a large Korean river. Water 2016, 8, 3. [Google Scholar] [CrossRef]
  16. Wang, J.; Chapman, D.; Xu, J.; Wang, Y.; Gu, B. Isotope niche dimension and trophic overlap between bigheaded carps and native fliter-feeding fish in the lower Missouri River, USA. PLoS ONE 2018, 13, e0197584. [Google Scholar] [CrossRef]
  17. Cohen, J.E. Food webs and the dimensionality of trophic niche space. Proc. Natl. Acad. Sci. USA 1977, 74, 4533–4536. [Google Scholar] [CrossRef] [PubMed] [Green Version]
  18. Newsome, S.D.; Martinez del Rio, C.; Bearhop, S.; Phillips, D.L. A niche for isotopic ecology. Front. Ecol. Environ. 2007, 5, 429–436. [Google Scholar] [CrossRef]
  19. Jackson, A.L.; Inger, R.; Parnell, A.C.; Bearhop, S. Comparing isotopic niche widths among and within communities: SIBER-stable isotope Bayesian ellipses in R. J. Anim. Ecol. 2011, 80, 595–602. [Google Scholar] [CrossRef]
  20. Ministry of Environment, Korea. Survey and Evaluation Method for River and Stream Ecosystem Health Assessment. In Biomonitoring Survey and Assessment Manual; NIER/2016-372; Ministry of Environment: Sejong, Korea, 2016. [Google Scholar]
  21. Pielou, E.C. Species-diversity and pattern-diversity in the study of ecological succession. J. Theor. Biol. 1966, 10, 370–383. [Google Scholar] [CrossRef]
  22. Simpson, E.H. Measurement of diversity. Nature 1949, 163, 688. [Google Scholar] [CrossRef]
  23. Kong, D.; Son, S.H.; Hwang, S.J.; Won, D.H.; Kim, M.C.; Park, J.H.; Jeon, T.S.; Lee, J.E.; Kim, J.H.; Kim, J.S.; et al. Development of benthic macroinvertebrates index (BMI) for biological assessment on stream environment. J. Korean Soc. Water Environ. 2018, 34, 183–201. [Google Scholar] [CrossRef]
  24. Ministry of Environment, Korea. The Improvement of Mid-Long Term Aquatic Ecosystem Monitoring on Weir Section; NIER-SP2015-189; Ministry of Environment: Se-jong, Korea, 2015; ISBN 11-1480523-002465-01.
  25. Barbour, M.T.; Gerritsen, J.; Snyder, B.D.; Stribling, J.B. Rapid Bioassessment Protocols for Use in Streams and Wadeable Rivers: Periphyton, Benthic Macroinvertebrates and Fish, 2nd ed.; EPA/841-B-99-002; US Environmental Protection Agency: Washington, DC, USA, 1999.
  26. Bannon, R.O.; Roman, C.T. Using stable isotopes to monitor anthropogenic nitrogen inputs to estuaries. Ecol. Appl. 2008, 18, 22–30. [Google Scholar] [CrossRef] [PubMed]
  27. Froese, R. Cube law, condition factor and weight-length relationships: History, meta-analysis and recommendations. J. Appl. Ichthyol. 2006, 22, 241–253. [Google Scholar] [CrossRef]
  28. Bolger, T.; Connolly, P.L. The selection of suitable indices for the measurement and analysis of fish condition. J. Fish Biol. 1989, 34, 171–182. [Google Scholar] [CrossRef]
  29. Lee, W.S.; Kim, M.S.; Hwang, J.Y.; Kwon, O.S. Analytical methodology of stable isotopes ratios: Sample pretreatment, analysis and application. Korean J. Ecol. Environ. 2013, 46, 471–487. [Google Scholar] [CrossRef]
  30. Layman, C.A.; Arrington, D.A.; Montana, C.G.; Post, D.M. Can stable isotope ratios provide for community-wide measures of trophic structure? Ecology 2007, 88, 42–48. [Google Scholar] [CrossRef]
  31. Coulter, A.A.; Swanson, H.K.; Goforth, R.R. Seasonal variation in resource overlap of invasive and native fishes revealed by stable isotopes. Biol. Invasions 2018. [Google Scholar] [CrossRef]
  32. Cabana, G.; Rasmussen, J.B. Comparison of aquatic food chains using nitrogen isotopes. Proc. Natl. Acad. Sci. USA 1996, 93, 10844–10847. [Google Scholar] [CrossRef]
  33. Tummers, J.S.; Hudson, S.; Lucas, M.C. Evaluating the effectiveness of restoring longitudinal connectivity for stream fish communities: Towards a more holistic approach. Sci. Total Environ. 2016, 569–570, 850–860. [Google Scholar] [CrossRef]
  34. Mbaka, J.G.; Mwaniki, M.W. A global review of the downstream effects of small impoundments on stream habitat conditions and macroinvertebrates. Environ. Rev. 2015, 23, 257–262. [Google Scholar] [CrossRef]
  35. Smith, S.C.F.; Meiners, S.J.; Hastings, R.P.; Thomas, T.; Colombo, R.E. Low-head dam impacts on habitat and the functional composition of fish communities. River Res. Appl. 2017, 33, 680–689. [Google Scholar] [CrossRef]
  36. France, R.L. Differentiation between littoral and pelagic food webs in lakes using stable carbon isotopes. Limnol. Oceanogr. 1995, 40, 1310–1313. [Google Scholar] [CrossRef] [Green Version]
  37. Yu, J.J.; Lee, K.L.; Lee, H.J.; Hwang, J.W.; Lyu, H.S.; Shin, L.Y.; Park, A.R.; Chen, S.U. Relations of nutrient concentrations on the seasonality of algal community in the Nakdong River, Korea. J. Korean Soc. Water Environ. 2015, 31, 110–119. [Google Scholar] [CrossRef]
  38. Chang, K.H.; Doi, H.; Imai, H.; Gunji, H.; Nakano, S. Longitudinal changes in zooplankton distribution below a reservoir outfall with reference to river planktivory. Limnology 2008, 9, 125–133. [Google Scholar] [CrossRef]
  39. Jo, H.; Yoon, J.D.; Kim, J.H.; Jeong, K.S.; Do, Y.; Joo, G.J. Diet shifts and delayed piscivory specialization during the ontegenesis of the largemouth bass Micropterus salmoides (Lacepede, 1802) in the Nakdong River and Upo Wetlands, South Korea. Indian J. Fish. 2016, 63, 48–54. [Google Scholar] [CrossRef]
  40. Doi, H.; Chang, K.H.; Ando, T.; Imai, H.; Nakano, S.; Kajimoto, A.; Katano, I. Drifting plankton from a reservoir subsidize downstream food webs and alter community structure. Oecologia 2008, 156, 363–371. [Google Scholar] [CrossRef]
  41. Lombard, R.J.; Chimimba, T.; Zengeya, T.A. Niche complementary between an alien predator and native omnivorous fish in the Wilge River, South Africa. Hydrobiologia 2018, 817, 329–340. [Google Scholar] [CrossRef]
  42. Yoon, J.D.; Park, S.H.; Chang, K.H.; Choi, J.Y.; Joo, G.J.; Nam, G.S.; Yoon, J.; Jang, M.H. Characteristics of fish fauna in the lower Geum River and identification of trophic guilds using stable isotopes analysis. Korean J. Environ. Biol. 2015, 33, 34–44. [Google Scholar] [CrossRef]
Figure 1. Map of study sites showing four major Korean rivers and the location of the weirs. Fish samplings were carried out 500 m from the weir in each upstream and downstream area.
Sustainability 10 04784 g001
Figure 2. Ecological niche space (ENS) of fish and particulate organic matter (POM) (primarily algal biomass) in the upstream and downstream areas of the weirs in four rivers.
Sustainability 10 04784 g002
Figure 3. Comparison of the ecological niche space (ENS) area as the calculated standard ellipse area of omnivores and predators in the upstream and downstream areas of the weirs (pooled data from all rivers).
Sustainability 10 04784 g003
Figure 4. Ecological niche space (ENS) calculated as the standard ellipse area of major predator species using standardized nitrogen stable isotope ratios.
Sustainability 10 04784 g004
Figure 5. Ecological niche space (ENS) plots of major predator species and their distribution and overlap.
Sustainability 10 04784 g005
Figure 6. Correlations between the ecological niche space (ENS) of fish communities and other indices and variables measured at each study site (Statistically significant correlations were marked as bold).
Sustainability 10 04784 g006
Table 1. List of fish species used for measurement of ecological niche space (ENS) by stable isotope ratios of carbon and nitrogen with individual measured numbers in parenthesis.
River (Weir)RegionPredatorsOmnivores
Han River
(Yeoju Weir)
upstreamErythroculter erythropterus (3)
Micropterus salmoides (3)
Acheilognathus yamatsutae (3) 1
Acanthorhodeus gracilis (3)
Pseudogobio esocinus (3)
downstreamErythroculter erythropterus (3)Acheilognathus yamatsutae (3)
Acanthorhodeus gracilis (3) 1
Nakdong River
(Hapcheon Weir)
upstreamErythroculter erythropterus (3)
Micropterus salmoides (3)
Opsariichthys bidens (3) 1
Lepomis macrochirus (3)
Squalidus chankaensis tsuchigae (3)
Pseudogobio esocinus (3)
downstreamErythroculter erythropterus (3)
Opsariichthys bidens (3)1
Lepomis macrochirus (3)
Squalidus chankaensis tsuchigae (3)
Hemiculter eigenmanni (2)
Geum River
(Gongju Weir)
upstreamErythroculter erythropterus (3)
Micropterus salmoides (3)
Opsariichthys bidens (3)
Squalidus japonicus Coreanus(3)1
Microphysogobio jeoni (3)
Pseudogobio esocinus (3)
downstreamErythroculter erythropterus (3)
Opsariichthys bidens (3)
Squalidus japonicus Coreanus (3) 1
Yeongsan River
(Seungchon Weir)
upstreamMicropterus salmoides (5)
Opsariichthys bidens (5)
Squalidus chankaensis tsuchigae (5)
Lepomis macrochirus (5) 1
Pseudogobio esocinus (5)
downstreamMicropterus salmoides (5)
Opsariichthys bidens (5)
Squalidus chankaensis tsuchigae (5) 1
Lepomis macrochirus (5)
Pseudogobio esocinus (5)
1 Dominant species.
Table 2. Community index of the upstream and downstream of the weirs in the four rivers.
River
(Weir)
RegionNumber of Captured IndividualsDiversity
Index
Dominance
Index
Tolerant Species %Endemic
Species %
Han River
(Yeoju Weir)
upstream12111.620.3414.980.3
downstream3841.950.1923.780.5
Nakdong River
(Hapcheon Weir)
upstream9902.400.1165.140.9
downstream292.190.1464.743.3
Geum River
(Gongju Weir)
upstream2351.620.6071.317.8
downstream2011.060.8393.111.1
Yeongsan River
(Seungchon Weir)
upstream4461.620.3283.615.0
downstream3971.460.3544.656.4
Table 3. Benthic macroinvertebrate index (BMI), vegetation index, nitrogen stable isotopes of particulate organic matters (POM) and fish condition factor (CF) in the upstream and downstream of the weirs in the four rivers.
River (weir)RegionBMIVegetation IndexDelta 15N POM CF
Han River
(Yeoju Weir)
upstream43.22111.230.49
downstream34.61910.160.51
Nakdong River
(Hapcheon Weir)
upstream25.22410.770.51
downstream15.82512.200.38
Geum River
(Gongju Weir)
upstream20.12014.500.49
downstream31.0613.080.59
Yeongsan River
(Seungchon Weir)
upstream12.52117.700.69
downstream12.41016.810.76

