Evaluating On-Farm Biodiversity: A Comparison of Assessment Methods
by
 ,
,
Vanessa Gabel
1,2,*, 
Robert Home
1,
Sibylle Stöckli
1,
Matthias Meier
1,
Matthias Stolze
1 and
Ulrich Köpke
2 1
Research Institute of Organic Agriculture (FiBL), CH-5070 Frick, Switzerland
2
Institute of Organic Agriculture, University of Bonn, D-53115 Bonn, Germany
*
Author to whom correspondence should be addressed.
Sustainability 2018, 10(12), 4812; https://0-doi-org.brum.beds.ac.uk/10.3390/su10124812
Submission received: 27 November 2018
/
Revised: 10 December 2018
/
Accepted: 13 December 2018
/
Published: 17 December 2018
(This article belongs to the Special Issue Sustainability, Biodiversity, and Conservation)
Abstract
:Strategies to stop the loss of biodiversity in agriculture areas will be more successful if farmers have the means to understand changes in biodiversity on their farms and to assess the effectiveness of biodiversity promoting measures. There are several methods to assess on-farm biodiversity but it may be difficult to select the most appropriate method for a farmer’s individual circumstances. This study aims to evaluate the usability and usefulness of four biodiversity assessment methods that are available to farmers in Switzerland. All four methods were applied to five case study farms, which were ranked according to the results. None of the methods were able to provide an exact statement on the current biodiversity status of the farms, but each method could provide an indication, or approximation, of one or more aspects of biodiversity. However, the results also showed that it is possible to generate different statements on the state of biodiversity on the same farms by using different biodiversity assessment methods. All methods showed strengths and weaknesses so, when choosing a method, the purpose of the biodiversity assessment should be kept in the foreground and the limitations of the chosen methods should be considered when interpreting the outcomes.
1. Introduction
There is little dispute that agriculture is one of the main causes of global biodiversity loss [1] and that agricultural induced biodiversity decline is accelerated by intensification and expansion of agricultural land use [2,3]. Several of the factors that can be considered as intensification, such as increased drainage, irrigation, grazing intensity [4], and the homogenization of landscapes, lead to the loss of habitat elements. Other intensification factors, such as the increased use of fertilizers, herbicides, and pesticides, lead directly or indirectly to the death of organisms and their subsequent disappearance from the landscape [5]. Biodiversity loss in agricultural landscapes was highlighted in an alarming study that showed a 75% decrease in insect biomass in Germany over a period of just 27 years [6]. However, agricultural ecosystems are themselves dependent on various ecosystem services, such as water regulation, soil fertility, pest and disease control, and pollination [7]. Ollerton et al. [8] estimate, for example, that 87.5% of all flowering plants are in need of pollination by animals. Gallai et al. [9] estimated the economic value of the ecosystem service: “pollination” alone at around 153 billion euros, which corresponds to almost 10% of global agricultural production.
A wide body of research suggests that agricultural landscapes actually have the potential to contribute to biodiversity preservation [10] and can self-provide important ecosystem services when diverse agricultural systems are maintained [11]. Therefore, it is clear that the biodiversity loss in agricultural landscapes, which contributes to global biodiversity loss and the associated reduction of ecosystem services, is a result of insufficient diversity in agricultural systems, or over-intensive agricultural management, rather than by agriculture per se [12]. Consequently, governments recognize a global priority to reduce biodiversity loss [13] and agricultural management is often the focus of political activities that attempt to counteract this loss.
Efforts to stop biodiversity loss in agricultural landscapes can be enhanced by on-site engagement by farmers [14]. With approximately 40% of land in the European Union under agricultural use [15], farmers have a great potential to protect or even promote biodiversity with their management decisions, such as the mode of production they choose for their farms [14]. However, farmers need sufficient knowledge to make informed decisions, which implies a need for assessment methods to evaluate and monitor the biodiversity in their particular circumstances [10]. Stöckli et al. [16] recommended using such methods to support farm advisory services.
Farmers need both access to adequate information and the skills to process it if they are to make informed decisions about goal-oriented land management [10]. However, farmer education rarely provides farmers with the requisite skills and knowledge to achieve specific environmental outcomes by appropriate land management [17], so they typically consult with expert advisors. Gabel et al. [18] concluded that advisory services are an effective means of conveying biodiversity information to farmers, which reflects the findings of Noe et al. [19] who reported that dialogue with trained biologists was able to influence farmers’ perceptions and awareness of wildlife. Similarly, Chevillat et al. [20] found that proposed on-farm biodiversity advice at a whole farm level, when delivered by a trained and credible advisor, raised the willingness of farmers to implement biodiversity conservation measures.
However, passing the task of biodiversity assessment at farm level to advisors is not without drawbacks. Smallshire et al. [21], while acknowledging the effectiveness of advice, pointed out that direct on-farm advice by well-trained advisors is also the most expensive way of disseminating information to farmers. There are also potential conflicts of interest in which advisors are sometimes incentivized to help farmers maximize their agri-environmental grants rather than providing them with the tools to undertake actions with the most environmental benefit [22]. Schroeder et al. [23] found that advisors tended to take a relatively neutral stance on on-farm biodiversity, which meant they experienced limited success in motivating farmers to implement biodiversity conservation measures. Ironically, farmers tend to trust advisory services that are perceived to be pro-farmer, and who have knowledge of agriculture and agri-environmental grants. In any case, an economical and readily applicable method for objectively evaluating the state of biodiversity on a particular farm could provide a useful start to discussions about on-farm biodiversity and may thereby contribute to motivating farmers to engage.
Jenny et al. [24] pointed out that it was difficult for farmers to quantify on-farm biodiversity, which limits their ability to evaluate the outcomes of biodiversity conservation efforts on their farm. Even for trained ecologists, it remains a challenge to assess or measure biodiversity or biodiversity loss [25] because biodiversity encompasses different biotic levels: from genes to ecosystems [26], and cannot be measured as a whole [27,28]. Duelli and Obrist [29] summarized that no single indicator for biodiversity can exist so appropriate surrogates must be used [30].
A possibility to help farmers recognize biodiversity changes could be provided by biodiversity assessment methods that can be applied on farms and thereby demonstrate the biodiversity impact of the farm or different production methods. Several methods have been developed to evaluate and monitor biodiversity [31,32,33,34,35,36], but there are fewer methods that can assess farmland biodiversity at a farm level [37]. Of those that can, there has been little comparative study into their usability, comparability, or accuracy, and the usefulness of these methods for individual farmers to gain a picture of their biodiversity conservation performance has not been extensively tested in real-world situations. Furthermore, many of these methods capture only part of the complexity of biodiversity [10] and it has not been sufficiently evaluated whether the results provided are valid with respect to the assessed biodiversity aspect. Primary research, in which these newly developed methods are applied to case study farms so that their outcomes and usability can be compared, could shed some light on the usefulness of these methods.
The aim of this research is to evaluate and compare a selection of biodiversity assessment methods by applying several methods to each of a set of case study farms. This approach, along with a measurement-based biodiversity evaluation on the same farms, will inform about the accuracy and suitability of these methods for assessing farmland biodiversity at the farm level. The methods that were applied, and the justification for selecting a case study approach, are described in detail in the methodology section.
2. Materials and Methods
2.1. Biodiversity Assessment Methods
To assess farmland biodiversity at farm level, four different methods were compared: (1) the credit point system (CPS) [31], which is a scoring system integrating various measures to promote biodiversity; (2) The Sustainability Monitoring and Assessment Routine (SMART), which is a comprehensive sustainability assessment tool that covers biodiversity as one thematic area [34]; (3) the Life Cycle Impact Assessment (LCIA) method for farmland biodiversity [32], in which species diversity on landscape scale is assessed as a potential loss due to land use intensity and deficiency of landscape structural elements; and (4) a traditional method of species monitoring in which numbers of individuals are determined and classified [31]. These four methods can be readily applied in Switzerland because data is either available or readily collectable. However, although these methods do not produce sufficiently similar values that allow them to be directly compared, they all evaluate farmland biodiversity and allow within-method farm comparison. The capacity for within-method comparison means that farms in which the same method has been applied can be easily ranked from best to worst.
(1) Credit Points System [31]
Within the project “Scoring with biodiversity—farmers enrich nature”, the Research Institute of Organic Agriculture (FiBL) in Switzerland and the Swiss Ornithological Institute developed a scoring system to assess species diversity of agricultural farms. Relevant measures, from a list with 32 different options, most of which derive from the Swiss agri-environment scheme, for improving biodiversity at the farm level, are evaluated and recorded, which results in an overall score per farm. A particularly important component of the point system is the percentage of ecological compensation areas (ECA), which are mainly semi-natural habitats, on the farm. The “ecological quality”, the size and the spatial distribution of those ECAs are also important [30]. Different in-field options for arable land and grassland, and farm characteristics, such as average field size, are also included in the assessment [30]. The points are weighted with the help of expert judgements and on the basis of the known benefits for biodiversity and thus, for instance, larger meadows receive a higher score than smaller meadows and those with a high ecological value receive more points than meadows with a lower ecological value [24].
(2) Sustainability Monitoring and Assessment Routine [34]
The Sustainability Monitoring and Assessment Routine (SMART) is a method that was developed by FiBL to assess the sustainability performance of farms in a comprehensive, efficient and comparable way. The tool is based on the Sustainability Assessment of Food and Agriculture systems (SAFA) Guidelines of the FAO [38]. SMART covers four sustainability dimensions (good governance, environmental integrity, economic resilience and social well-being) which in turn consist of 21 themes and 58 subthemes. Biodiversity is reflected as one theme that encompasses the subthemes: genetic diversity, species diversity, and ecosystem diversity. The SMART method is built on a set that includes up to 327 indicators. A total of 72 indicators are related to the biodiversity theme [34] and are primarily concerned with possible management measures and factors relating to use intensity. For each indicator, the achievement of the goal is measured in a range of 0–100%. The method used in this study was SMART-farm tool version 4.1.
(3) Life Cycle Impact Assessment [32]
The Life Cycle Impact Assessment (LCIA) method of Meier et al. [32] was developed to assess agricultural land use related impacts on farmland biodiversity. It allows for the continuous assessment of the effects of various agricultural production intensities (e.g., organic and conventional production) on biodiversity and includes the local landscape context. For brevity, and for the purposes of this paper, we refer to the LCIA biodiversity assessment method as the LCIA method or simply LCIA.
The LCIA method is based on regression models that describe species diversity on landscape level as a function of land use intensity and landscape structure including parameters that refer not only to the farm under consideration but also to the surrounding landscape. The regression functions are based on empirical data [39] and are valid for European agricultural landscapes in the lowlands. The species groups included vascular plants and birds, and the landscape level refers to a square of 4 × 4 km. The model first assesses the impact on the diversity of the mentioned species groups on landscape level by considering the nitrogen input on the agriculturally used area; the diversity of the crop rotations within the overall landscape; and the proportion of semi-natural area, with individual elements converted to an equivalent area value, within a specific landscape. This determines the overall impact in a landscape due to agricultural land use. The overall impact at the landscape level is then allocated to a specific farm within the landscape proportionally to the land use intensity and the proportion of semi-natural habitats on that farm. Semi-natural habitats cover aerial structural elements, such as permanent grassland, forest, fallows, bogs; and linear structural elements, such as hedges, tree lines, grassy margins, and solitary trees. The impact on farmland biodiversity is expressed as the biodiversity damage potential (BDP), which is calculated by comparing the species diversity, under the given land use intensity and landscape structure, with the species density that would be expected under a state of minimum land use intensity and 100% semi-natural habitats. The BDP is normalized to a dimensionless index with values between zero and one in which lower values indicate land use that is better for encouraging species diversity.
(4) Monitoring plant and species diversity [31]
Biodiversity data were collected during several visits on the five farms throughout the years 2009 and 2015. On each farm, transects with a total length of 2500 m were laid, in which the diversity (among other things, species number and density) of plants, grasshoppers, butterflies and birds were recorded. The transects were distributed over the farm so that all ECAs and arable land or grassland types were covered and the total number of all species on the farm was counted to calculate the species richness. Species richness simply quantifies how many different species were contained in the dataset. Calculation of other commonly used indices of species richness, such as the Shannon Index, Simpson Index, and Berger-Parker index was deemed unnecessary for the purposes of this study However, species richness is a function of farm size and the farms in this study were not identical in size, so a density measure, which is independent of the farm size, was calculated by summing all individuals of each transect and dividing by the farm area. The entire farmland was used for the bird recordings and all birds, which were heard or seen, have been incorporated. For a precise description of the measurement-based evaluation of biodiversity, see Birrer et al. [31].
2.2. Case Study Approach
According to Yin [40] a case study is an empirical study that examines a phenomenon in a real-life context: especially when the boundaries between the phenomenon and the context are not entirely clear. A central component of case studies, which this study also aims to pursue, is to attract attention and make suggestions for specific relations [40]. The execution of several case studies should help to support either similar or, for predictable reasons, contrasting results [40]. It is not the aim of case studies to derive generalizations [41].
We contrasted the four methods on each of the five farms to reveal the advantages and disadvantages in their application as well as their accuracy. To this end, each method was compared with the measurement-based evaluation of biodiversity. Although indicator-based methods have been developed with the explicit aim of evaluating biodiversity with less time and fewer resources than measurement-based methods, both measurement based and indicator-based biodiversity evaluation methods are quite time- and resource-intensive to apply. These time and resource demands meant that this comparison study, in which four methods were applied to each case study farm, was restricted to five farms. Furthermore, remembering that the LCIA method requires calculation of a landscape structural input parameter, so the biodiversity damage potential (BDP) is usually calculated for the entire farm within a 4 × 4 km quadrant. In our case, we extended the area to 5 × 5 km landscape quadrants to make sure that all areas of the farms could be included. Extending the size of the quadrants was not considered to negatively impact the logic of the method, with the BDP expressing the influence on biodiversity of the entire farm in the considered landscape. Thus, the results depend strongly on the respective farm size, with larger farms having a greater influence on the BDP. This applies to a positive as well as a negative influence on biodiversity.
2.3. Management Variety on Swiss Farms
Essentially, there are three production systems in Switzerland to which virtually all Swiss farms belong. Swiss farmers who meet a number of prescribed ecological standards [42] and thereby qualify for general direct payments are known as proof of ecological performance (PEP) farms. Organic farming is additionally subsidised, and Swiss law dictates the minimum requirements, including implementation of at least 12 from a catalogue of ecological measures, that a farm must meet to gain the organic label and claim further direct payments. A parallel label in Switzerland is IP SUISSE, which is a joint NGO/private initiative for integrated pest management, and which is based around a system of points being allocated to implemented measures, from a pre-defined list, that demonstrate the ecological performance of the farm. Farmers who achieve sufficient points gain the IP SUISSE accreditation label and qualify to receive higher product prices from some major retailers. The IP Suisse label was founded to reward farmers for providing additional services, such as limited use of chemical sprays and fertilizers, which remain at the heart of the IP SUISSE philosophy. Although the use of chemical sprays and fertilizers is among the practices that are forbidden in organic production, both organic and IP-SUISSE-labelled farms have some freedom to decide which measures they implement to meet standards or gain sufficient points to attain their respective label [37].
Therefore, it can be assumed that the production intensity of an organic or IP Suisse farming system will be less intensive than a conventional PEP farming system. Gomiero et al. [43] noted that the biodiversity potential of organic farms is greater compared with conventional farms through a higher habitat variability, more wild-life friendly farm practices and, although less decisive, by the renunciation of pesticides. Nevertheless, the production intensities within a production system can also vary widely, with Weibull and Östman [44] and Billeter et al. [39] finding that biodiversity in agricultural ecosystems depends on both landscape heterogeneity and farm management methods.
2.4. Sampling
Remembering that the aim is not to compare production systems, we used a maximum variety sampling strategy [45] to select farms with different management intensities from within the different production systems to provide contrasting environments and thereby facilitate comparisons of the biodiversity assessment methods. Duelli et al. [46] assigned a higher organismal biodiversity to habitats that are less intensively cultivated, so a prerequisite for the selection of the case study farms was that they should cover a large variety in management intensity and represent the gradient found within different production systems.
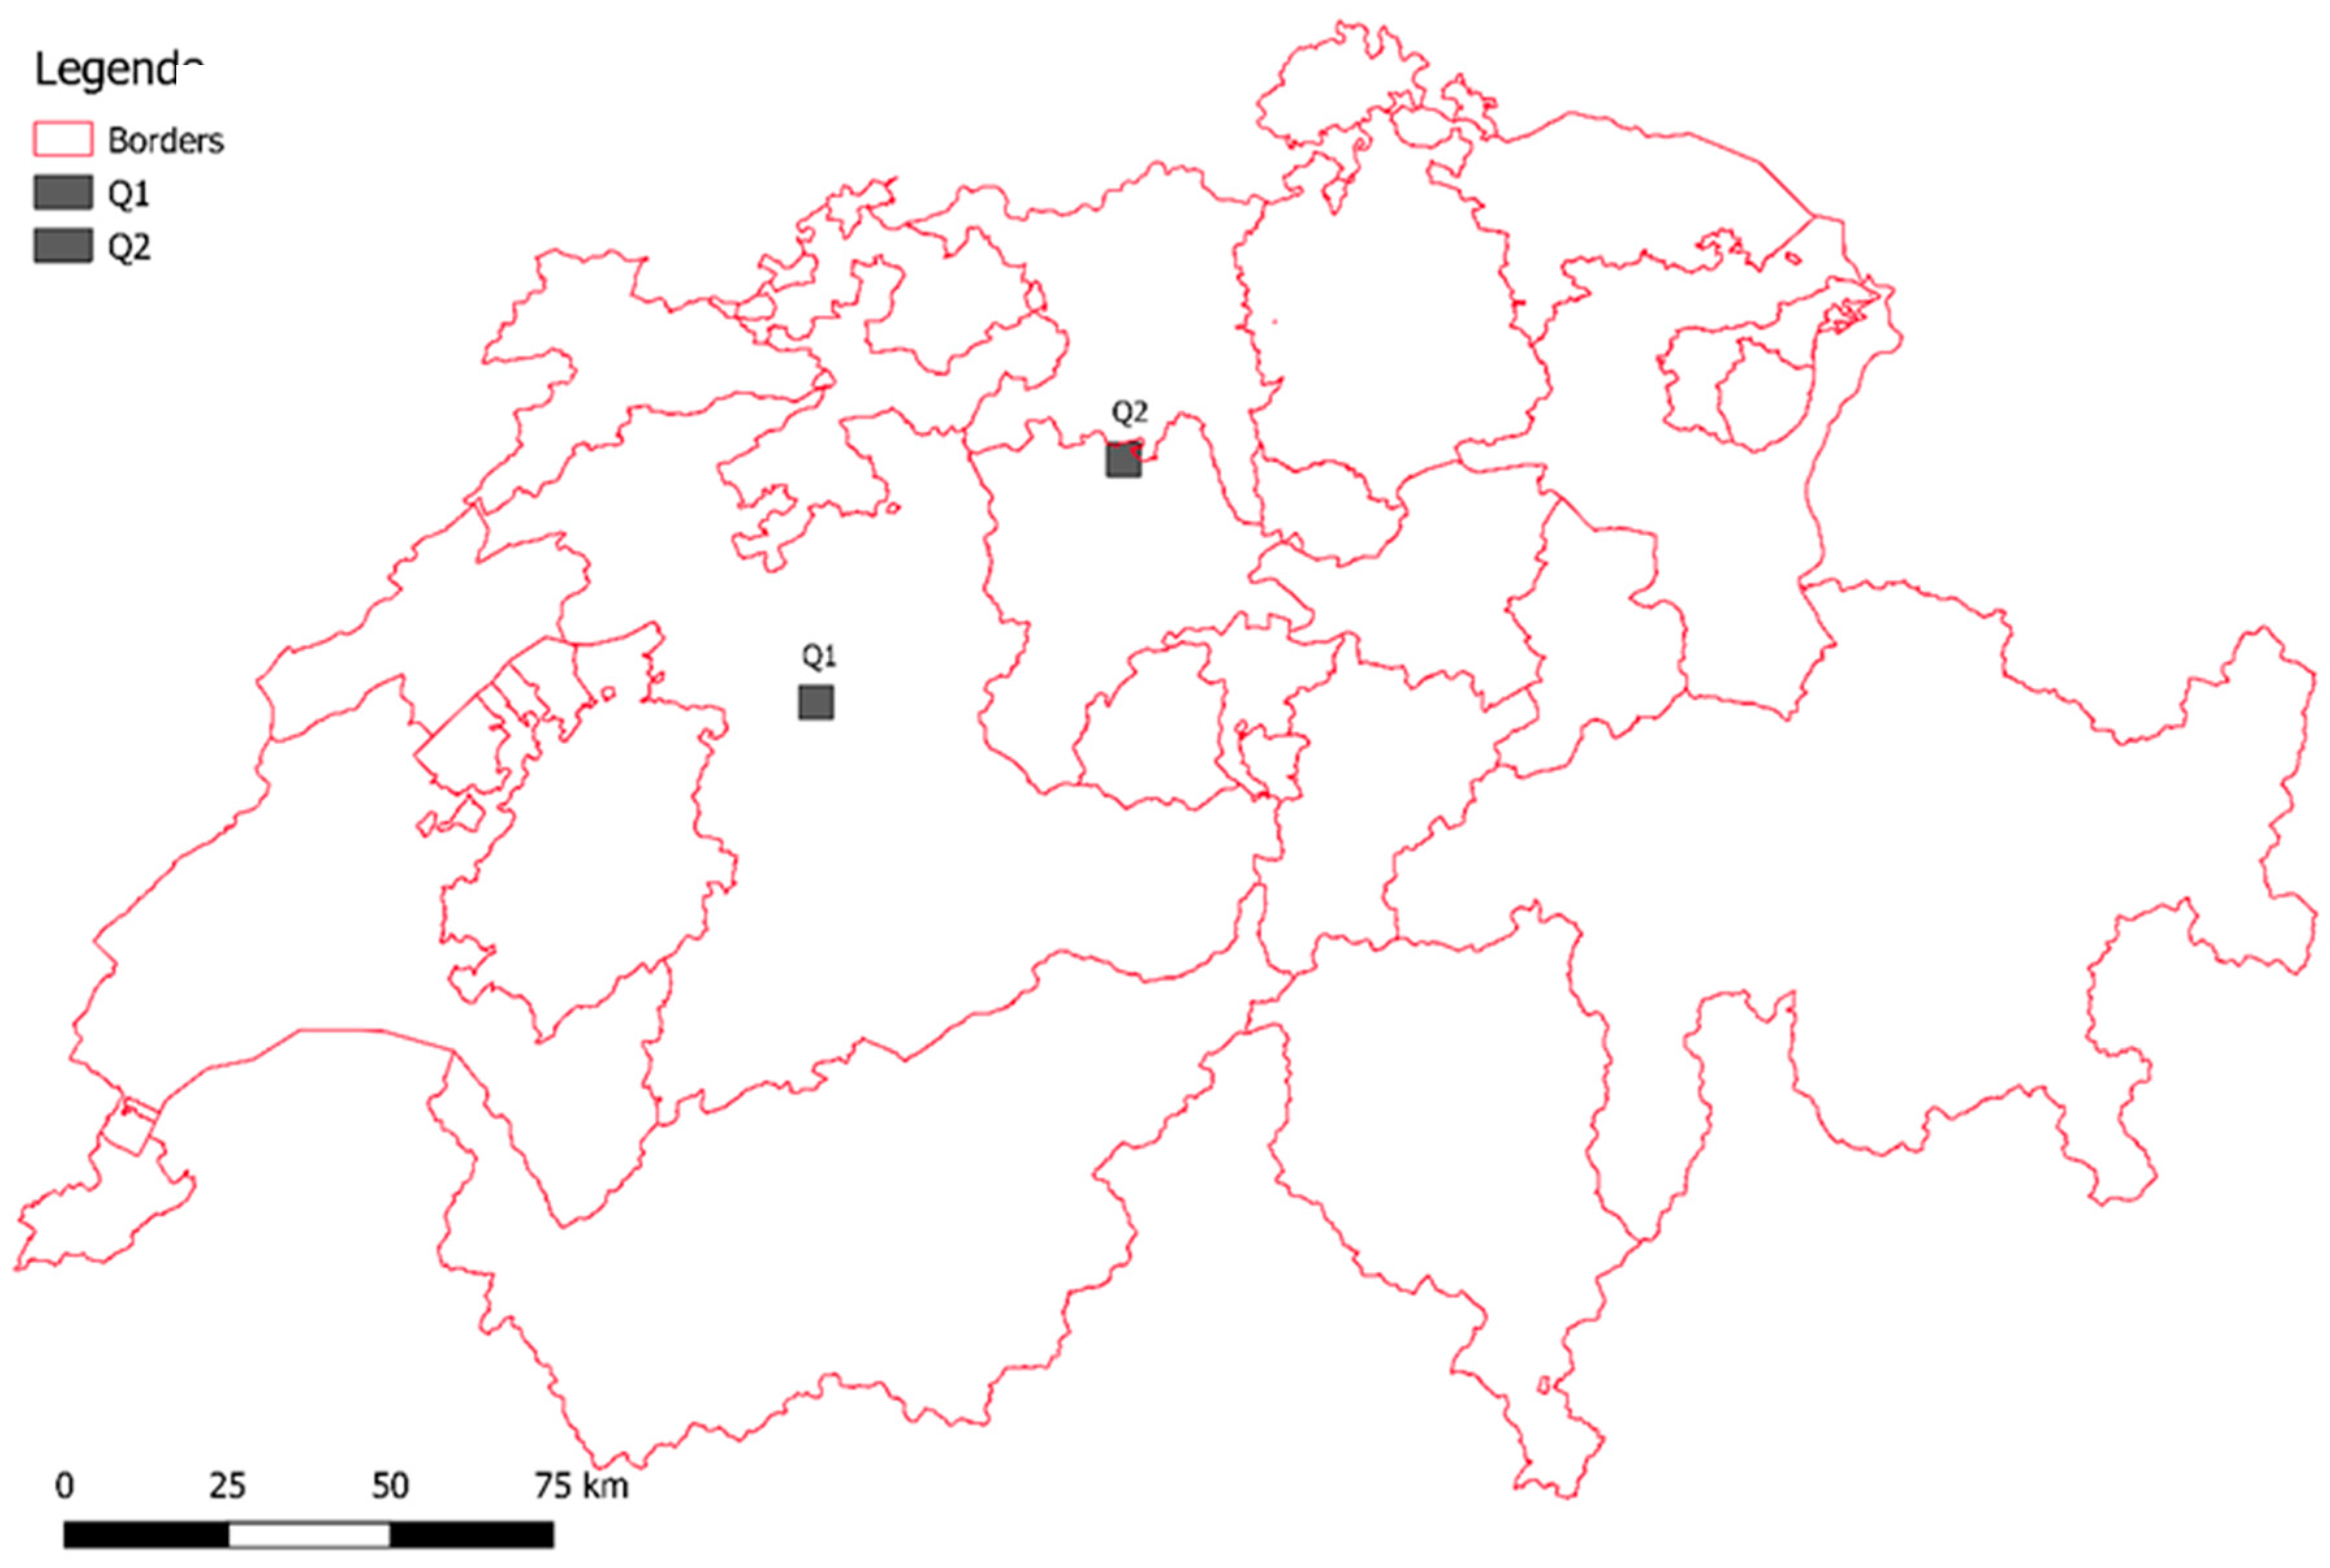
The farms were selected so as to be located sufficiently close to each other, in the cantons Bern (two farms) and Lucerne (three farms), that the LCIA landscape structural input parameter only needed to be calculated once for each region. The distance between both landscapes was approximately 70 km but both sites belong to the Swiss lowlands at an altitude of 543–803 m above sea level (Figure 1). An average precipitation probability of 1100 mm is assumed for all farms. A total of 16.9 ha are farmed on the smallest farm and 30.2 ha on the largest farm. Further information can be found in Table 1.
All farms are mixed farms. Originally, all five farms had dairy cows whereby one farm stopped keeping dairy cows in 2015. In addition, pigs, sheep or horses were kept on some farms. The stocking density on the farms ranged between 0.8 and 3.16 livestock per hectare. The forested area on the farms ranged between 0.08 ha and 4.98 ha. Between four and seven different crops are cultivated within the crop rotation. All farms exceed the 7% ecological compensation area required in Switzerland with the proportion of ECAs ranging between 10.3% and 13.9%.
2.5. Analysis Criteria
To examine the usability of the different biodiversity assessment methods, a set of criteria was established which describes the basis of the methods and can provide guidance in selecting the appropriate methods for the different purposes. The selection of the analysis criteria was based on criteria that have been used in an overview of biodiversity assessment methods for LCIAs [47] or in an analysis of sustainability assessment methods in food systems [48]. The following analysis criteria were selected:
- The biodiversity aspect describes the part of biodiversity that is covered by the various methods (e.g., species biodiversity, genetic diversity or functional diversity).
- Since it is not possible to measure biodiversity as a whole [49], the methods depend on the use of biodiversity indicators. Biodiversity indicators can be samples (e.g., plant richness) or indirect measures (e.g., semi-natural habitats), which provide information to express the size, extent or degree of biodiversity [50].
- To compare biodiversity, it is necessary to use a benchmark. This is referred to as the reference situation for the investigated methods.
- The spatial unit refers to the reference value on which the biodiversity assessment is based on (e.g., product, plot, field, farm).
- Geographical scope refers to the geographical context in which the methods can be applied. It can be distinguished, for example, whether the methods can be applied regionally, nationally or globally.
- Primary purpose means the originally intended use of the method. Examples of this are research, advice, evaluation, etc.
- The duration of the assessment describes the time required to generate a result with the methods.
- Data availability refers to the sources of the data that are required for the application of the methods.
A comparison of different methods is difficult because of the different ways they describe biodiversity. For the CPS method, the system focusses solely on species diversity, while the biodiversity theme in the SMART method is subdivided into species diversity, ecosystem diversity and genetic diversity. The LCIA method covers the biodiversity aspect: ‘species richness’ on a landscape scale and also indirectly covers ecosystem diversity. All methods are indicator based.
Furthermore, the reference point in each of the methods is different. The CPS compares with a reference point of 0 points, the SMART method refers to a 100% percent goal achievement, and the LCIA method refers to a potential maximum number of species. Despite different reference points, one way of comparison is to rank the farms according to the outputs from the different methods.
3. Results
3.1. Overview of the Analysis Criteria
These criteria provide useful guidance when selecting the most appropriate method to choose in specific circumstances. In particular, they indicate the relationship between the selected method and the purpose for which the evaluation is being conducted. The results also indicate the resource commitment required for them to be applied, which may be decisive in many situations. Furthermore, it can be seen that each method requires a degree of expertise and so may be beyond the ability of farmers to implement self-assessment on their farms.
3.2. SMART
The SMART method provides an overall score for the thematic area of biodiversity, which is expressed as a percentage of the goal achievement. The percentage is calculated from the average of the results for the subthemes ecosystem diversity, species diversity and genetic diversity (Table 2).
The results of the farms for the biodiversity theme ranged from 46 to 66% (shown in Table 3). The highest and lowest values were achieved by farms 3 and 1. Farms 4 and 2 were ranked second and third respectively, while farm 5 was ranked fourth. Farms 1 and 3 retain their position in the ranking for all three sub-themes. On the other hand, the results of the other three farms at the subtheme level did not remain constant, but were quite different for the individual sub-themes. The theme values were used in the comparison with the other biodiversity assessment methods because they give the broadest assessment of biodiversity.
3.3. CPS Method
The CPS scoring system for the five different farms results in scores between 13.4 and 26.8 points. Farms 3 and 2 were ranked highest with scores with 26.8 and 26.7 points respectively. Farm 4 was ranked third with 18.8 points and farm 5 was ranked fourth with 15.4 points. Farm 1 was ranked worst with 13.4 points.
3.4. LCIA Method
The results of the assessed farms using the LCIA method reflect the relationship between farm size and biodiversity impact (Table 4). The BDP of farm 1, for example, is the largest, since it also clearly has the largest farm area. Accordingly, the smallest farm 5 has the least negative impact on biodiversity and its size is less than half that of the largest farm. Farm 2 can also be grouped according to the farm size. There is a difference from the ranking according to the farm size only for farms 3 and 4, which are similar in size, with the results showing that the slightly larger farm 3 has a lower BDP than the slightly smaller farm 4. These reversed places in the ranking can be explained by the comparably lower intensity of farm 3 and the very small difference in size (0.1 ha) between the two farms. For the outcomes of this method to give more than an indication of farm size, it was necessary to calculate the BDP per hectare and these results are shown in Table 4. The ranking according to BDP per hectare shows that farm 3 has lowest BDP per ha, which was followed by farm 1, which was ranked second. Farm 4 was ranked third in both BDP and BDP/hectare, while farm 5 was ranked fourth. The fifth place in the BDP ranking was farm 2, which has the greatest negative impact on biodiversity in the landscape per hectare. The BDP/hectare values were used in the comparison with the other biodiversity assessment methods because they are independent of the farm area.
3.5. Monitoring Plant and Animal Biodiversity
In Table 5, the rankings of the individual numbers for species richness and density have been added to form an overall ranking for both measures. While the largest farm in the species richness ranking scored relatively well to rank second, this changes within the density ranking where the farm has the worst rank. The smallest farm, which clearly scored the worst in the species richness ranking, was ranked fourth in species density, while the second largest farm 2 was ranked first in both rankings, although in the density ranking, this place was shared with farm 3. Farm 4 was ranked third in both rankings. The density values were used in the comparison with the other biodiversity assessment methods because they are independent of the farm area.
3.6. Comparison of Rankings According to Evaluation System
The combined results are shown in Table 6.
A comparison of the three biodiversity assessment methods with the species recording data of the farms shows that the CPS scoring method corresponds reasonably closely to the density data. There is the restriction that in the species density ranking results the first place was given twice and farm 2 and 3 are thus equal and there is, therefore, no second place in this case. There is also agreement between the rankings of the LCIA method and the density values for the farms 3, 4 and 5, which occupy the first, third and fourth places respectively. The farms 1 and 2 show the same deviations as for the CPS scoring method. The SMART ranking is also very similar to the density ranking and is in agreement with it on the ranks 1, 4 and 5. Farm 4 scored in the SMART rating: one place better than in the recording data, and ends on the second place. The highest deviation from the ranking with the density values can be found for farm 2, which comes third in the SMART method after the two organic farms 3 and 4.
The best evaluation in all four methods is given to the farm 3. With one exception, the ranks obtained with the CPS scoring method and the SMART method matched. In the CPS evaluation, farm 4 was ranked third with farm 2 ranked second, while the SMART method ranked farm 4 scores slightly better in second place with farm 2 in 3rd place. (The subtopic genetic diversity in the SMART method shows exactly the same order of the farms as the CPS score). For the LCIA method with BDP/ha, the ranking corresponds to the CPS method in the farms ranked first, third and fourth. However, in contrast to the other two methods, farm 1 was ranked second rather than fifth, while farm 2 was ranked fifth.
4. Discussion
Compared to the other two methods, relatively few input parameters are decisive for the evaluation of farms with the LCIA method. Possibly this is also the reason that this method showed a different picture of biodiversity than the other methods for two of the five farms. It could be that crop diversity plays a too large a role in the LCIA method because the two farms that showed a clear deviation from the rankings of the other farms, differ most from each other. While farm 1, as a seed producing farm, has up to 7 crops in its crop rotation, only 4 different crops are cultivated on farm 2. This might also be the case for the animal stocking density, where farm 1 performs clearly better than the other farms (first place with farm 4 in 4th place). It may, however, be that differences occur because the LCIA method applies a model that focusses on species diversity at the landscape level in which intensity and landscape structure in the remaining landscape are also considered. Further research with a larger sample would be needed to explore this possibility.
When comparing the SMART method with the CPS method, there is only one difference in the ranking of the two: organic farm 4 is rated one place better (second place) with the SMART method than with the CPS method. This means that both organic farms are ranked best with SMART. One reason for this, which has already emerged in other comparative studies between organic farms and conventional farms using the SMART method, is that possibly too much importance is attached to the use of synthetic pesticides (which are forbidden on organic farms). In addition, in the SMART method so far only the type and number of pesticides used have played a role, but not the amount and number of sprays used on the farm. In this case, farm 2, which uses pesticides sparingly, was probably overly penalized. The clear advantages of the SMART method, however, are the comparatively low workload, the global applicability and the fact that, in addition to the biodiversity result, many other sustainability issues are also covered by the method. Although Smallshire et al. [21] pointed out that direct on-farm advice by well-trained advisors is also the most expensive way of disseminating information to farmers, none of the methods tested in this study are readily implemented without a reasonably high degree of expertise, so advisors are necessary for their implementation.
There were some limitations of the study: the most important of which was the small sample size that was necessitated by conducting four resource intensive methods of assessing biodiversity on the case study farms. Further study with a larger sample would be recommended to confirm the results of this exploration. Sample size notwithstanding, this study provided validation for each evaluation method in some aspects of biodiversity, and could show the strengths and weaknesses of the selected methods. With five evaluated farms, we cannot make statistical statements about significant differences and we are aware of Hays’ [41] caution that a case study design is not intended to meet in generalizations.
The approach of to using a ranking system to compare farms is also potentially problematic in that the difference between the ranking was sometimes very small. For example, the difference between the second (1.97 × 10⁻⁶) and fourth (2.06 × 10⁻⁶) ranked farms according to the LCIA method was 0.000006. Indeed, most farmers might be challenged to interpret, or qualify, these numbers. However, despite these challenges, ranking is how biodiversity assessment is typically carried out in the real world. This can be a ranking of a particular set of farms, or an indication of change with an individual farm in which biodiversity is evaluated at different points in time. As the results of this study have shown, it is quite possible to generate different statements about biodiversity by applying different methods to the same farms. We argue that the approach of ranking avoids giving a false picture by maintaining a methodological consistency, and allows qualification of the results by means of comparison.
Buchs [49] and Duelli and Obrist [46] each pointed out that biodiversity, in its entirety and complexity, is not readily measurable and there can be no all-encompassing indices that could be derived for it. These statements were supported by the results of this case study in which no method was able to make a definitive statement about the actual state of biodiversity on the different farms. For example, even the method in which species richness was measured on site by trained ecologists, there was variation between farms, with the farm that had the highest density of birds also found with the lowest density of grasshoppers and butterflies. Furthermore, for the attempt to determine the accuracy of the methods, we made a comparison of the methods with the species recordings on the farm, but it has to be clear that the species recordings also only represent one specific aspect of biodiversity. In this case, the measurement method represents the species density aspect for a few indicator species (birds, plants, butterflies and grasshoppers). We do not have any indication for genetic and ecosystem diversity on the farms, which Purvis and Hector [26] suggest would be necessary for an evaluation of biodiversity. However, these methods can each be understood as indications or approximations to this state or at least for one or more aspects of the state and thereby deliver the information demanded by Clergue et al. [10]. If the possibilities for making statements are clearly defined or limited from the beginning, and the appropriate analysis criteria for the particular circumstances are considered, they can be helpful in deciding which method is most suitable.
5. Conclusions
When selecting a method to apply, and given that the methods compared within this study all exhibit strengths and weaknesses, with no method producing results that are overwhelming, a farmer might be advised to choose the evaluation method that is the least effort. The CPS method was developed especially for the Swiss context (even especially for lowland farms) and mainly integrates Swiss agri-environmental measures. It appears to provide an accurate picture of the species diversity on Swiss farms, but is not globally applicable and therefore might not allow a comparison of farms from different regions of the world. It is only suitable as a self-evaluation tool for farmers and advisory support in Switzerland if they have a sufficient level of expertise in biology and knowledge of the Swiss subsidy system.
The SMART method was found to be the least resource intensive and requires the least expertise while also producing a reasonably accurate picture of the on-farm biodiversity. The SMART method would also be preferred if the farmer saw biodiversity within the frame of a more complex view of sustainability, because biodiversity is one of several sustainability aspects considered within the SMART tool. The LCIA method appears to be more suited to an evaluation of biodiversity that is connected to a product comparison or in cases where it is not possible to visit the farm in person. Traditional measurement by counting individuals has a high degree of credibility, but is resource intensive, requires a high level of expertise, and is time-consuming. This method appears to be more suitable for confirming the accuracy of the faster and cheaper indicator-based methods. In summary, none of the methods is capable of giving a clearly better estimate of actual on-farm biodiversity than any other. Choice of method would best be made in light of the purpose of the evaluation.
Author Contributions
V.G. and R.H. were involved in the conceptualization of the article, have written the original draft preparation, and have been active in the writing review and editing process of the paper. S.S. and M.M. have been experts for the different methods used and have as well contributed to the writing process through review and editing. U.K. and M.S. were also involved in the conceptualization and in the reviewing and editing process.
Funding
This research received no external funding.
Acknowledgments
We would like to thank the developers of the different biodiversity assessment methods used in our study and all of the people who were involved in the species recordings on the farms. Many thanks also to Simon Birrer who provided us with the biodiversity data from the CPS-Project. Thanks also go to Lukas Baumgart, Jan Landert, Michael Curran and Richard Bircher from the SMART team for their support. Thanks are also due to the anonymous reviewers whose suggestions have significantly improved this contribution. Special thanks of course go to the farmers of the five case study farms who allowed to have different methods carried out on their farms and who all devoted their valuable time to enabling the project.
Conflicts of Interest
The authors declare no conflict of interest.
References
- Kleijn, D.; Kohler, F.; Báldi, A.; Batáry, P.; Conceptón, E.D.; Clough, Y.; Díaz, M.; Gabriel, D.; Holzschuh, A.; Knop, E.; et al. On the Relationship between Farmland Biodiversity and Land-Use Intensity in Europe. R. Soc. 2009, 276, 903–909. [Google Scholar] [CrossRef]
- Clough, Y.; Barkmann, J.; Juhrbandt, J.; Kessler, M.; Wanger, T.C.; Anshary, A.; Buchori, D.; Cicuzza, D.; Darras, K.; Putra, D.D.; et al. Combining High Biodiversity with High Yields in Tropical Agroforests. Proc. Natl. Acad. Sci. USA 2011, 108, 8311–8316. [Google Scholar] [CrossRef] [PubMed]
- Pe’er, G.; Dicks, L.V.; Visconti, P.; Arlettaz, R.; Báldi, A.; Benton, T.G.; Collins, S.; Dieterich, M.; Gregory, R.D.; Hartig, F.; et al. Eu Agricultural Reform Fails on Biodiversity. Science 2014, 344, 1090–1092. [Google Scholar] [CrossRef] [PubMed]
- Benton, T.G.; Vickery, J.A.; Wilson, J.D. Farmland Biodiversity: Is Habitat Heterogeneity the Key? Trends Ecol. Evol. 2003, 18, 182–188. [Google Scholar] [CrossRef]
- Geiger, F.; Bengtsson, J.; Berendse, F.; Weisser, W.W.; Emmerson, M.; Morales, M.B.; Ceryngier, P.; Liira, J.; Tscharntke, T.; Winqvist, C.; et al. Persistent Negative Effects of Pesticides on Biodiversity and Biological Control Potential on European Farmland. Basic Appl. Ecol. 2010, 11, 97–105. [Google Scholar] [CrossRef]
- Hallmann, C.A.; Sorg, M.; Jongejans, E.; Siepel, H.; Hofland, N.; Schwan, H.; Stenmans, W.; Müller, A.; Sumser, H.; Hörren, T.; et al. More Than 75 Percent Decline over 27 Years in Total Flying Insect Biomass in Protected Areas. PLoS ONE 2017, 12, e0185809. [Google Scholar] [CrossRef]
- Swinton, S.M.; Lupi, F.; Robertson, G.P.; Hamilton, S.K. Ecosystem Services and Agriculture: Cultivating Agricultural Ecosystems for Diverse Benefits. Ecol. Econ. 2007, 64, 245–252. [Google Scholar] [CrossRef]
- Ollerton, J.; Winfree, R.; Tarrant, S. How Many Flowering Plants Are Pollinated by Animals? Oikos 2011, 120, 321–326. [Google Scholar] [CrossRef]
- Gallai, N.; Salles, J.; Settele, J.; Vaissière, B.E. Economic Valuation of the Vulnerability of World Agriculture Confronted with Pollinator Decline. Ecol. Econ. 2009, 68, 810–821. [Google Scholar] [CrossRef]
- Clergue, B.; Amiaud, B.; Pervanchon, F.; Lasserre, F.; Plantureux, S. Biodiversity: Function and Assessment in Agricultural Areas. Agron. Sustain. Dev. 2005, 25, 1–15. [Google Scholar] [CrossRef]
- Tscharntke, T.; Klein, A.M.; Kruess, A.; Steffan-Dewenter, I.; Thies, C. Landscape Perspectives on Agricultural Intensification and Biodiversity—Ecosystem Service Management. Ecol. Lett. 2005, 8, 857–874. [Google Scholar] [CrossRef]
- Haines-Young, R. Land Use and Biodiversity Relationships. Land Use Policy 2009, 26 (Suppl. 1), S178–S186. [Google Scholar] [CrossRef]
- Baillie, J.E.M.; Collen, B.; Amin, R.; Akcakaya, H.R.; Butchart, S.H.M.; Brummitt, N.; Meagher, T.R.; Ram, M.; Hilton-Taylor, C.; Mace, G.M. Toward Monitoring Global Biodiversity. Conserv. Lett. 2008, 1, 18–26. [Google Scholar] [CrossRef]
- Lokhorst, A.M.; Staats, H.; van Dijk, J.; van Dijk, E.; de Snoo, G. What’s in It for Me? Motivational Differences between Farmers’ Subsidised and Non-Subsidised Conservation Practices. Appl. Psychol. 2011, 60, 337–353. [Google Scholar] [CrossRef]
- Eurostat. Farm Structure Statistics: Agricultural Land Use. Available online: https://ec.europa.eu/eurostat/statistics_explained/index.php/Farm_structure_statistics#Agricultural_land_use (accessed on 17 October 2018).
- Stoeckli, S.; Birrer, S.; Zellweger-Fischer, J.; Balmer, O.; Jenny, M.; Pfiffner, L. Quantifying the Extent to Which Farmers Can Influence Biodiversity on Their Farms. Agric. Ecosyst. Environ. 2017, 237, 224–233. [Google Scholar] [CrossRef]
- Batary, P.; Dicks, L.V.; Kleijn, D.; Sutherland, W.J. The Role of Agri-Environment Schemes in Conservation and Environmental Management. Conserv. Biol. 2015, 29, 1006–1016. [Google Scholar] [CrossRef]
- Gabel, V.M.; Home, R.; Stolze, M.; Birrer, S.; Steinemann, B.; Köpke, U. The Influence of on-Farm Advice on Beliefs and Motivations for Swiss Lowland Farmers to Implement Ecological Compensation Areas on Their Farms. J. Agric. Educ. Ext. 2018, 24, 233–248. [Google Scholar] [CrossRef]
- Noe, E.; Halberg, N.; Reddersen, J. Indicators of Biodiversity and Conservational Wildlife Quality on Danish Organic Farms for Use in Farm Management: A Multidisciplinary Approach to Indicator Development and Testing. J. Agric. Environ. Ethics 2005, 18, 383–414. [Google Scholar] [CrossRef]
- Chevillat, V.; Balmer, O.; Birrer, S.; Doppler, V.; Graf, R.; Jenny, M.; Pfiffner, L.; Rudmann, C.; Zellweger-Fischer, J. Gesamtbetriebliche Beratung Steigert Qualität Und Quantität Von Ökoausgleichsflächen. Agrarforschung Schweiz 2012, 3, 104–111. [Google Scholar]
- Smallshire, D.; Robertson, P.; Thompson, P. Policy into Practice: The Development and Delivery of Agri-Environment Schemes and Supporting Advice in England. Ibis 2004, 146, 250–258. [Google Scholar] [CrossRef]
- Sutherland, L.-A.; Mills, J.; Ingram, J.; Burton, R.J.F.; Dwyer, J.; Blackstock, K. Considering the Source: Commercialisation and Trust in Agri-Environmental Information and Advisory Services in England. J. Environ. Manag. 2013, 118, 96–105. [Google Scholar] [CrossRef] [PubMed]
- Schroeder, L.A.; Chaplin, S.; Isselstein, J. What influences farmers’ acceptance of agri-environment schemes? An ex-post application of the ‘Theory of Planned Behaviour’. Landbauforschung 2015, 65, 15–28. [Google Scholar]
- Jenny, M.; Fischer, J.; Pfiffner, L.; Birrer, S.; Graf, R. Leitfaden für Die Anwendung Des Punktesystems Biodiversität Ip-Suisse; Zollikofen und Schweizerische Vogelwarte, Ed.; Version 2009; IP-SUISSE: Sempach, Switzerland, 2009. [Google Scholar]
- Biała, K.; Condé, S.; Delbaere, B.; Jones-Walters, L.; Torre-Marín, A. Streamlining European Biodiversity Indicators 2020: Building a Future on Lessons Learnt from the Sebi 2010 Process. In EEA Technical Report; European Environmental Agency: Luxembourg, 2012. [Google Scholar]
- Purvis, A.; Hector, A. Getting the Measure of Biodiversity. Nature 2000, 405, 212–219. [Google Scholar] [CrossRef] [PubMed]
- Duelli, P. Biodiversity Evaluation in Agricultural Landscapes: An Approach at Two Different Scales. Agric. Ecosyst. Environ. 1997, 62, 81–91. [Google Scholar] [CrossRef]
- Magurran, A.E.; McGill, B.J. Biological Diversity: Frontiers in Measurement and Assessment; Oxford University Press: Oxford, UK, 2011. [Google Scholar]
- Duelli, P.; Obrist, M.K. Biodiversity Indicators: The Choice of Values and Measures. Agric. Ecosyst. Environ. 2003, 98, 87–98. [Google Scholar] [CrossRef]
- Jenny, M.; Zellweger-Fischer, J.; Balmer, O.; Birrer, S.; Pfiffner, L. The Credit Point System: An Innovative Approach to Enhance Biodiversity on Farmland. Asp. Appl. Biol. 2013, 118, 23–30. [Google Scholar]
- Birrer, S.; Zellweger-Fischer, J.; Stoeckli, S.; Korner-Nievergelt, F.; Balmer, O.; Jenny, M.; Pfiffner, L. Biodiversity at the Farm Scale: A Novel Credit Point System. Agric. Ecosyst. Environ. 2014, 197, 195–203. [Google Scholar] [CrossRef]
- Meier, M.; Siegrist, F.; Drapela, T.; Pluschke, H.; Pfiffner, L.; Stolze, M. Schlussbericht. Entwicklung Einer Wirkungsabschätzungsmethode Für Biodiversität; FiBL Forschungsinstitut für Biologischen Landbau: Frick, Switzerland, 2015; pp. 7–78. [Google Scholar]
- Quinn, J.E.; Brandle, J.R.; Johnson, R.J. A Farm-Scale Biodiversity and Ecosystem Services Assessment Tool: The Healthy Farm Index. Int. J. Agric. Sustain. 2013, 11, 176–192. [Google Scholar] [CrossRef]
- Schader, C.; Baumgart, L.; Landert, J.; Muller, A.; Ssebunya, B.; Blockeel, J.; Weisshaidinger, R.; Petrasek, R.; Mészáros, D.; Padel, S.; et al. Using the Sustainability Monitoring and Assessment Routine (Smart) for the Systematic Analysis of Trade-Offs and Synergies between Sustainability Dimensions and Themes at Farm Level. Sustainability 2016, 8, 274. [Google Scholar] [CrossRef]
- Schader, C.; Drapela, T.; Markut, T.; Hörtenhuber, S.; Lindenthal, T.; Meier, M.; Pfiffner, L. Biodiversity Impact Assessment of Austrian Organic and Conventional Dairy Products. Presented at the LCA Discussion Forum: Integrating biodiversity in LCA, Lausanne, Switzerland, 19 November 2010. [Google Scholar]
- von Haaren, C.; Kempa, D.; Vogel, K.; Rüter, S. Assessing Biodiversity on the Farm Scale as Basis for Ecosystem Service Payments. J. Environ. Manag. 2012, 113, 40–50. [Google Scholar] [CrossRef]
- Zellweger-Fischer, J.; Althaus, P.; Birrer, S.; Jenny, M.; Pfiffner, L.; Stöckli, S. Biodiversität Auf Landwirtschaftsbetrieben Mit Einem Punktesystem Erheben. Agrarforschung Schweiz 2016, 7, 40–47. [Google Scholar]
- FAO (Food and Agriculture Organization of the United Nations). Sustainability Assessment of Food and Agriculture Systems SAFA Guidelines; FAO: Rome, Italy, 2014. [Google Scholar]
- Billeter, R.; Liira, J.; Bailey, D.; Bugter, R.; Arens, P.; Augenstein, I.; Aviron, S.; Baudry, J.; Bukacek, R.; Burel, F.; et al. Indicators for Biodiversity in Agricultural Landscapes: A Pan-European Study. J. Appl. Ecol. 2008, 45, 141–150. [Google Scholar] [CrossRef]
- Yin, R.K. Applications of Case Study Research; Sage: Newbury Park, CA, USA, 2011. [Google Scholar]
- Hays, P.A. Case Study Research. In Foundations for Research: Methods of Inquiry in Education and the Social Sciences; Routledge: Abingdon, UK, 2004; pp. 217–234. [Google Scholar]
- Junge, X.; Lindemann-Matthies, P.; Hunziker, M.; Schüpbach, B. Aesthetic Preferences of Non-Farmers and Farmers for Different Land-Use Types and Proportions of Ecological Compensation Areas in the Swiss Lowlands. Biol. Conserv. 2011, 144, 1430–1440. [Google Scholar] [CrossRef]
- Gomiero, T.; Pimentel, D.; Paoletti, M.G. Environmental Impact of Diffrerent Agicultural Management Practices: Conventional vs. Organic Agriculture. Crit. Rev. Plant Sci. 2011, 26, 95–124. [Google Scholar] [CrossRef]
- Weibull, A.-C.; Östman, Ö. Species Composition in Agroecosystems: The Effect of Landscape, Habitat, and Farm Management. Basic Appl. Ecol. 2003, 4, 349–361. [Google Scholar] [CrossRef]
- Patton, M. Qualitative Evaluation and Research Methods; Sage: Newbury Park, CA, USA, 1990. [Google Scholar]
- Duelli, P.; Obrist, M.K.; Schmatz, D.R. Biodiversity Evaluation in Agricultural Landscapes: Above-Ground Insects. Agric. Ecosyst. Environ. 1999, 74, 33–64. [Google Scholar] [CrossRef]
- Gabel, V.M.; Meier, M.S.; Köpke, U.; Stolze, M. The Challenges of Including Impacts on Biodiversity in Agricultural Life Cycle Assessments. J. Environ. Manag. 2016, 181, 249–260. [Google Scholar] [CrossRef] [PubMed]
- Schader, C.; Grenz, J.; Meier, M.S.; Stolze, M. Scope and Precision of Sustainability Assessment Approaches to Food Systems. Ecol. Soc. 2014, 19, 1–15. [Google Scholar] [CrossRef]
- Büchs, W. Biotic Indicators for Biodiversity and Sustainable Agriculture—Introduction and Background. Agric. Ecosyst. Environ. 2003, 98, 1–16. [Google Scholar] [CrossRef]
- Biodiversity Indicators Partnership. Guidance for National Biodiversity Indicator Development and Use; Unep World Conservation Monitoring Centre: Cambridge, UK, 2011. [Google Scholar]
Figure 1.
Location of the landscape squares in Switzerland (Q1 in canton Bern, Q2 canton Lucerne).


Table 1.
Overview of farm details.
| Farm | Farm 1 | Farm 2 | Farm 3 | Farm 4 | Farm 5 |
|---|---|---|---|---|---|
| Landscape Canton (municipality) | Bern (Rubigen) | Lucerne (Rickenbach) | Bern (Rubigen) | Lucerne (Rickenbach) | Lucerne (Rickenbach) |
| Production system | IP Suisse | IP Suisse | Demeter | Bio Suisse | PEP |
| Altitude (m) | 543 | 803 | 586 | 702 | 672 |
| Precipitation (mm) | 1100 | 1100 | 1100 | 1100 | 1100 |
| Agricutural area (ha) | 36.9 | 27.2 | 23.5 | 23.4 | 16.9 |
| Arable land (ha) | 30.20 | 9.8 | 15 | 17.48 | 9.09 |
| Pasture (ha) | 5.85 | 16.38 | 7 | 5.94 | 3.9 |
| Forest (ha) | 0.08 | 4.98 | 2.18 | 3.6 | 3.13 |
| Animals | Cows/sheep | Cows/pigs | Cows, pigs, horses | Cows/pigs | Cows/Horses |
| Livestock units per ha | 0.8 | 2.08 | 1.7 | 3.16 | 1.59 |
| Crops | Wheat, Barley, rye, rapeseed, sugar beet, peas, sunflower, maize for silage | Barley spelt wheat | Broad Beans, Oats, Wheat, spelt, peas, maize for silage | Sunflowers, potatoes, maize for silage, wheat, spelt | Wheat, rapeseed, barley, maize for silage |
| Crops in rotation | 7 | 4 | 7 | 6 | 5 |
| Labour force (Full-time equivalent) | 2.5 | 2.8 | 4 | 3 | 1.45 |
| ECA (ha) | 3.8 ha | 3.78 | 3.20 ha | 2.6 ha | 1.84 ha |
| % | 10.3% | 13.9% | 13.6% | 11.1% | 10.6% |
Table 2.
Results of the Analysis Criteria.
| Method | CPS | SMART (Version 4.1) | LCIA | Measurement |
|---|---|---|---|---|
| Biodiversity aspect | Species diversity | Species diversity, ecosystem diversity genetic diversity, | Species diversity (indirect Ecosystem quality) | Species richness, species density |
| Biodiversity indicator | 32 measures options to enhance biodiversity on the farm (most of them base on options of the Swiss agri-environment scheme. Management measures) | 72 biodiversity indicators | Land use intensity parameters (Land use intensity index N-input, and crop diversity) and landscape structure parameters (Share of semi natural habitats) | Number of individuals, identified to species level |
| Reference situation | 0 Points (although 0 points is extremely unlikely) | 100% goal achievement | maximum possible number of species | None. It is not comparative |
| Spatial Unit | Area (Farm) | Area (Farm) | Area (Farm), product | Area (Farm) (can be calculated per hectare) |
| Geographical scope | Switzerland | Global | Primarily temperate regions (lowlands) | Global |
| Intended Purpose | Biodiversity Assessment and Advice on farm-level | Sustainability assessment for research and business contexts | Assessment of farmland biodiversity of agricultural products in the framework of a LCIA | Biodiversity assessment at a farm level |
| Assessment duration | 2 h | 3–4 h, but including an evaluation of other sustainability indicators other than biodiversity. | Depends strongly on the availability of processed data (especially the landscape data) | A half day, 3–6 times per season, with approximately one day in the laboratory per animal/plant type |
| Data availability | On the farm available | On the farm available | Partly on the farm available, additional landscape data needed | On the farm |
| Expertise needed | High expertise in biology and knowledge of subsidy system | Moderate expertise. Lay people require some training | High expertise in GIS | High expertise in biology |
Table 3.
Sustainability Monitoring and Assessment Routine (SMART) theme and subtheme results.
| Farm | Farm 1 | Farm 2 | Farm 3 | Farm 4 | Farm 5 |
|---|---|---|---|---|---|
| Production system | IP Suisse | IP Suisse | Organic (demeter) | Organic | PEP |
| Farm size (ha) | 36.9 | 27.2 | 23.5 | 23.4 | 16.9 |
| Theme Biodiversity | 46% | 56% | 66% | 61% | 55% |
| Subtheme Ecosystem diversity | 43% | 50% | 61% | 56% | 57% |
| Subtheme Species Diversity | 48% | 57% | 70% | 70% | 54% |
| Subtheme Genetic Diversity | 47% | 60% | 68% | 57% | 55% |
Table 4.
Results of the Life Cycle Impact Assessment (LCIA) biodiversity damage potential on farm.
| Farm 1 | Farm 2 | Farm 3 | Farm 4 | Farm 5 | |
|---|---|---|---|---|---|
| Production system | IP Suisse | IP Suisse | Organic (demeter) | Organic (Biosuisse) | PEP |
| Farm size (ha) | 36.9 | 27.2 | 23.5 | 23.4 | 16.9 |
| LCIA BDP/farm | 7.3 × 10⁻³ | 6.6 × 10⁻³ | 4.4 × 10⁻³ | 4.7 × 10⁻³ | 3.5 × 10⁻³ |
| LCIA BDP/ha | 1.97 × 10⁻⁶ | 2.43 × 10⁻⁶ | 1.86 × 10⁻⁶ | 2.01 × 10⁻⁶ | 2.06 × 10⁻⁶ |
Table 5.
Results of the biodiversity recordings on the farm 2015.
| Farm | Farm 1 | Farm 2 | Farm 3 | Farm 4 | Farm 5 |
|---|---|---|---|---|---|
| Production system | IP Suisse | IP Suisse | Organic (demeter) | Organic (Biosuisse) | PEP |
| Farm size | 36.9 | 27.2 | 23.5 | 23.4 | 16.9 |
| Species richness Butterflies | 22 | 26 | 24 | 26 | 18 |
| Species richness plants | 205 | 185 | 160 | 166 | 129 |
| Species richness birds | 35 | 25 | 24 | 23 | 21 |
| Species richness grasshoppers | 8 | 13 | 7 | 6 | 7 |
| Ranking species richness | 8 | 6 | 13 | 13 | 18 |
| Density plants | 695.579 | 925.723 | 1051.633 | 791.437 | 596.752 |
| Density Grasshoppers | 82.441 | 229.363 | 163.416 | 88.982 | 95.773 |
| Density Butterflies | 60.45 | 178.859 | 364.894 | 382.726 | 203.576 |
| Density Birds UZL | 3.25 | 2.205 | 0.852 | 0.427 | 1.179 |
| Ranking Density | 15 | 9 | 9 | 13 | 14 |
Note: Species richness refers to the number of species per farm. Density refers to the number of individuals per ha.
Table 6.
Overview of the different method results (ranking in brackets).
| Farm | Production Systems | Farm Size (ha) | CPS Biodiversity (Points) | Smart Theme Biodiversity (Goal Achievement) | LCIA Methode (BDP/ha) | Species Density (Individuals/ha) |
|---|---|---|---|---|---|---|
| Farm 1 | IP Suisse | 36.9 (1) | 13.41 (5) | 46% (5) | 1.97 × 10⁻⁶ (2) | 15 (5) |
| Farm 2 | IP Suisse | 27.2 (2) | 26.71 (2) | 56% (3) | 2.43 × 10⁻⁶ (5) | 9 (1) |
| Farm 3 | Organic (demeter) | 23.5 (3) | 26.77 (1) | 66% (1) | 1.86 × 10⁻⁶ (1) | 9 (1) |
| Farm 4 | Organic (Biosuisse) | 23.4 (4) | 18.79 (3) | 61% (2) | 2.01 × 10⁻⁶ (3) | 12 (3) |
| Farm 5 | PEP | 16.9 (5) | 15.37 (4) | 55% (4) | 2.06 × 10⁻⁶ (4) | 14 (4) |
© 2018 by the authors. Licensee MDPI, Basel, Switzerland. This article is an open access article distributed under the terms and conditions of the Creative Commons Attribution (CC BY) license (http://creativecommons.org/licenses/by/4.0/).
Share and Cite
MDPI and ACS Style
Gabel, V.; Home, R.; Stöckli, S.; Meier, M.; Stolze, M.; Köpke, U. Evaluating On-Farm Biodiversity: A Comparison of Assessment Methods. Sustainability 2018, 10, 4812. https://0-doi-org.brum.beds.ac.uk/10.3390/su10124812
AMA Style
Gabel V, Home R, Stöckli S, Meier M, Stolze M, Köpke U. Evaluating On-Farm Biodiversity: A Comparison of Assessment Methods. Sustainability. 2018; 10(12):4812. https://0-doi-org.brum.beds.ac.uk/10.3390/su10124812
Chicago/Turabian StyleGabel, Vanessa, Robert Home, Sibylle Stöckli, Matthias Meier, Matthias Stolze, and Ulrich Köpke. 2018. "Evaluating On-Farm Biodiversity: A Comparison of Assessment Methods" Sustainability 10, no. 12: 4812. https://0-doi-org.brum.beds.ac.uk/10.3390/su10124812
Note that from the first issue of 2016, this journal uses article numbers instead of page numbers. See further details here.