Article

Research on the Measurement of the Technical Innovative Capabilities of Oil and Gas Industry Clusters and Their Factors of Influence: Empirical Analysis Based on Eight Provinces in China

1
School of Business Administration, China University of Petroleum, Beijing 102249, China
2
Department of Mathematics, Wilfrid Laurier University, Waterloo, ON N2L 3C5, Canada
*
Author to whom correspondence should be addressed.
Sustainability 2018, 10(12), 4833; https://0-doi-org.brum.beds.ac.uk/10.3390/su10124833
Submission received: 17 November 2018 / Revised: 12 December 2018 / Accepted: 14 December 2018 / Published: 18 December 2018
(This article belongs to the Section Energy Sustainability)

Abstract

:
Existing studies have suggested that rich mineral resources may serve as a “resource curse” as well as a “resource blessing” with respect to regional economic development. However, the reason behind the emergence of this paradox is not clear. In this paper, we carried out an investigation of the sustainable development of oil and gas industry clusters in eight provinces of China. We studied the panel data of these industry clusters and performed quantitative analysis. By considering the effects of the technical innovation ability of the cluster on its long-term development, we showed that increasing the technical innovation ability of the cluster promoted the development of the industry, which led to a “resource blessing” situation. On the other hand, a mineral resource-based industry cluster may not survive long without technological innovation. Increasing investments in scientific research and technology development and reducing the reckless expansion of the industry cluster may lower the possibility of the occurrence of a “resource curse”.

1. Introduction

It has generally been believed that rich natural resources have a significant influence on the development of regional economies. Such resources may also be beneficial to the economic development of a country. However, this assumption has been gradually contradicted. To describe the situation where natural resource-based economies grow more slowly than non-natural resource-based economies, Auty introduced the concept of the “resource curse” [1]. The theory posits, and studies have shown, that natural resources, such as oil and coal, may not always bring prosperity to a given region and, in some cases, may even impact negatively the development of the regional economy [2,3,4,5,6]. Indeed, typical cases of resource-based industry clusters have shown the coexistence of a “resource curse” and “resource blessing” all over the world [7].
Cappelen performed case studies on oil and gas industry clusters in Norway and other countries and concluded that the crowding out effect is responsible for the slow growth of such regional economies [8]. Typically, the resource-based industry clusters will provide higher salaries for their employees, and as such, the expected salary in that particular industry will be higher than that in other types of industries. As a result, some traditional industries in the region will lose competitiveness and be eliminated [8]. In such an industrial development pattern, once the resources in the region are depleted, the resource-based industries will stagnate, which is evidence of the “resource curse” in the regional economy. Such problems have attracted the attention of scholars, and research has been performed to examine the mechanisms behind this phenomenon. By studying the resource-based industrial clusters during the stage of their successful developments, we have found that promoting innovation and dynamic growth patterns plays a positive role in the sustainable development of such resource-based industrial clusters. Our investigations have also suggested that innovation promotes the development of the resource-based industries and leads to the development of other supporting industries in the region, which is, in turn, beneficial to the sustainable development of the resource-based industrial clusters [9].
Some scholars have explained this phenomenon from the perspective of technological progress, while others have attributed it to the concept of knowledge spillover. The scenario has also been analyzed with respect to innovation sponsored by the government [10,11,12,13].
However, some scholars are skeptical about the role of technological innovation in the development of resource-based industrial clusters. They believe that the development of resource-based industrial clusters mainly depends on “manna from heaven” [2,14].
Most studies in the literature have found that technological innovation leads to the aforementioned paradox [9,12,15,16,17,18]. It is believed that the ability of the cluster to innovate will directly affect the sustainable development of the cluster and, as such, may lead to two distinct development paths, the “resource blessing” and the “resource curse”. However, some studies have shown that the accumulation of original technology will affect the adoption of new technologies by enterprises within the cluster, unless the technology can be successfully implemented and shown to bring benefits [13,19].
The uncertainty in the process of adopting new technology leads to the path dependence of the technological innovation ability in the cluster [20,21,22]. Thus, some scholars have studied the evolution of the technological innovation ability in the clusters with respect to technical specificity, technological innovation opportunities, and technological accumulation with the aim of reducing uncertainty to avoid such dependence and promote the sustainable development of the clusters [16,23]. In this work, we conclude that the development of a resource-based industrial cluster depends on its ability to engage in technological innovation. However, at certain developmental stages and specific industry scales, the path of technological innovation is locked, which curbs the demand for technological innovation. If the cluster is able to break through this barrier, it may experience a “resource blessing”, and vice versa. The research contribution of this paper is as follows: by introducing the growth rate of total factor productivity (TFP), we measured the technological innovation capability of oil and gas industry clusters. We then divided the concept of technological innovation capability into a technological progress index and a technical efficiency index. Then, based on the data from the oil and gas industrial clusters in eight provinces and regions of China, we carried out empirical analysis to demonstrate which factors inhibit the technological innovation ability of the oil and gas industrial clusters. We also show which factors promote technological innovation ability and lead to the sustainable development of the cluster.

2. Measure and Indicators for Technological Innovation Capabilities

2.1. The Selection of Measure and Indicators of Technical Innovation Capability

The total factor productivity (TFP) is defined as the ratio of output to the input of all the factors (such as capital and labor). The difference between the output growth rate and the growth rate of the factor input is the growth rate of the total factor productivity. The neo-classical economist Solow indicated that this indicator can be used to measure the impact of factors other than the investment of capital and labor on economic growth [24]. TFP ignores the scale effect of factor input, avoids the inaccuracy caused by complex multi-indicator analysis, and thus serves the purpose of a comprehensive indicator to measure the technical progress and technical efficiency of a region or industry [25]. Technological innovation includes technological progress and increased efficiency, which can be reflected by the TFP growth rate.
Accounting methods for total factor productivity growth mainly include the Solow residual method, the invisible variable method, the stochastic frontier production function method, and the Malmquist index method [24]. For the first two methods, complete market competition, constant returns to scale, and Hicks neutrality for technological progress are required. These conditions are often difficult to meet in the real economy. Moreover, the calculated result only considers technological progress and neglects the influence of technical efficiency. Although the stochastic frontier production function method considers the effect of technical efficiency on total factor productivity, its premise requires a special function. Parameter estimation or small changes in the model or data will have substantial influence on the results. When applying the Malmquist index method, we do not need to consider the production function structure and do not need to perform parameter extinctions in advance. Because it allows inefficient behavior and can decompose TFP changes, the Malmquist index method has been widely used in specific quantitative analysis.
The Malmquist index was first proposed by Swedish statistician Sten Malmquist in 1953. Caves, et al. applied it to productivity analysis in 1982. Fare et al. combined data envelopment analysis (DEA) with the Malmquist Index and established a new type of analytical TFP growth method. By using the Shephard distance function to decompose the TFP to obtain technical progress and technical efficiency, we can gain in-depth insight into the source of TFP growth [26,27].
Considering the differences in the above methods, in this paper, we selected the Malmquist index method to calculate the TFP growth of typical oil and gas industry clusters in China, as an indicator to measure the technological innovation capability of these oil and gas industry clusters. Using such a method, it is not necessary to form a unified production function. This method is subject to the specific constraints of growth accounting, and as such, it is feasible under the conditions of variable return on scale (VRS), incomplete market competition, etc. [26,27,28]. Compared with other calculation methods, it does not consider the random impact effect. Therefore, this method avoids the significant impact caused by small data changes. Because its output is more stable and it usually uses provincial panel data, this method is universal. Based on the above analysis, this method is applicable to countries that are in a period of economic transition, such as China.

2.2. Calculation Results and Analysis

In this section, we investigate the data from 30 provinces and regions in China from 1978 to 2012 (due to the lack of availability of statistical data and consistency, we did not consider Hong Kong, Macao, Chongqing, Tibet, etc.). All the data were obtained from the Chinese statistical yearbooks and provincial statistical yearbooks. Following the procedure for calculating the TFP growth rate and adopting 1978 as the base period, we obtained the output data used in this paper, the GDP of each province during 1978–2012. We also determined the constant price of the GDP with the base period of 1978. We chose the labor input (the number of laborers) and capital input as the input variables, in which the number of employees in each of the 30 provinces or regions in China from 1978 to 2012 was considered [25]. Here, the capital investment was calculated using the general measurement method of capital stock, i.e., the perpetual inventory method (PIM) established by Gordon Smith, given by the following:
K i t = K i , t 1 · ( 1 δ i t ) + I i t
where I stands for the total new fixed asset investment in the current year, K stands for the fixed capital stock, δ stands for the depreciation rate, subscript i stands for the ith province, and subscript t stands for year t. The estimation of the capital stock has been extensively investigated in the literature. For example, Zhang and Shan used the perpetual inventory method and confirmed the variables by formula [29,30]. In order to simplify big data operations, here, we used the method of calculating the capital stock proposed by Shan and chose a uniform depreciation rate of 10.96%. For the capital base stocks K0 in each province in 1978, we used the sum of the actual capital formation depreciation ratio in 1979 and the investment growth rates between 1979 and 1983. Finally, we used the fixed capital stocks of 30 provinces from 1978 to 2012 to calculate the capital investment data.
According to our previous investigation, among the 30 provinces and regions, 8 provinces and regions, including Heilongjiang, Liaoning, Tianjin, Hebei, Shandong, Shanxi, Gansu, and Xinjiang, had the characteristics of typical oil and gas industrial clusters [31]. In the calculation of the TFP, we used the software DEAP2.1 to process and calculate the input and output data. The software has certain requirements on the amount of original data, i.e., the larger the amount of data, the higher the calculation precision. The actual TFP growth rate was calculated using the data of 30 provinces and regions from 1978 to 2012. Besides obtaining the TFP growth rate, we also decomposed the TFP growth rate into the technological progress index (TP) and the technical efficiency index (TE). We used the three as the explanatory variables in this study and performed in-depth analysis. In order to better reflect the long-term trends of the three indicators, we calculated the geometric average for each province with 5-year cycles, as shown in Figure 1.
As shown in Figure 1, the TFP growth rates in Heilongjiang, Gansu, and Shanxi provinces decrease significantly. The TFP growth rates of the other provinces and regions increased for a long period of time, followed by a slight decline in the last two cycles. We notice that in Heilongjiang, Gansu, and Shaanxi, where the TFP growth rate decreased significantly, the efficiency index increased and the technical progress index decreased remarkably. It was shown that in regions where the resource stock is relatively sufficient and the mining is difficult, an increase in the technical efficiency of the mining can increase the profit and, as such, bring greater economic growth, which inhibits the demand for technological progress. However, when the natural resources are depleted, the oil and gas industry clusters will be in trouble due to their slow technological progress, which will lead to the phenomenon of the “resource curse”. For example, the slow technological progress in the oil and gas industry clusters in Heilongjiang and Gansu provinces were responsible for such a “resource curse”.
Then, we considered the situation in the provinces and regions where the contribution of technological progress in the growth of the TFP was greater than that of technical efficiency. Through the follow-up study of oil and gas industry clusters in these provinces and regions, we obtained the following observations.
(1)
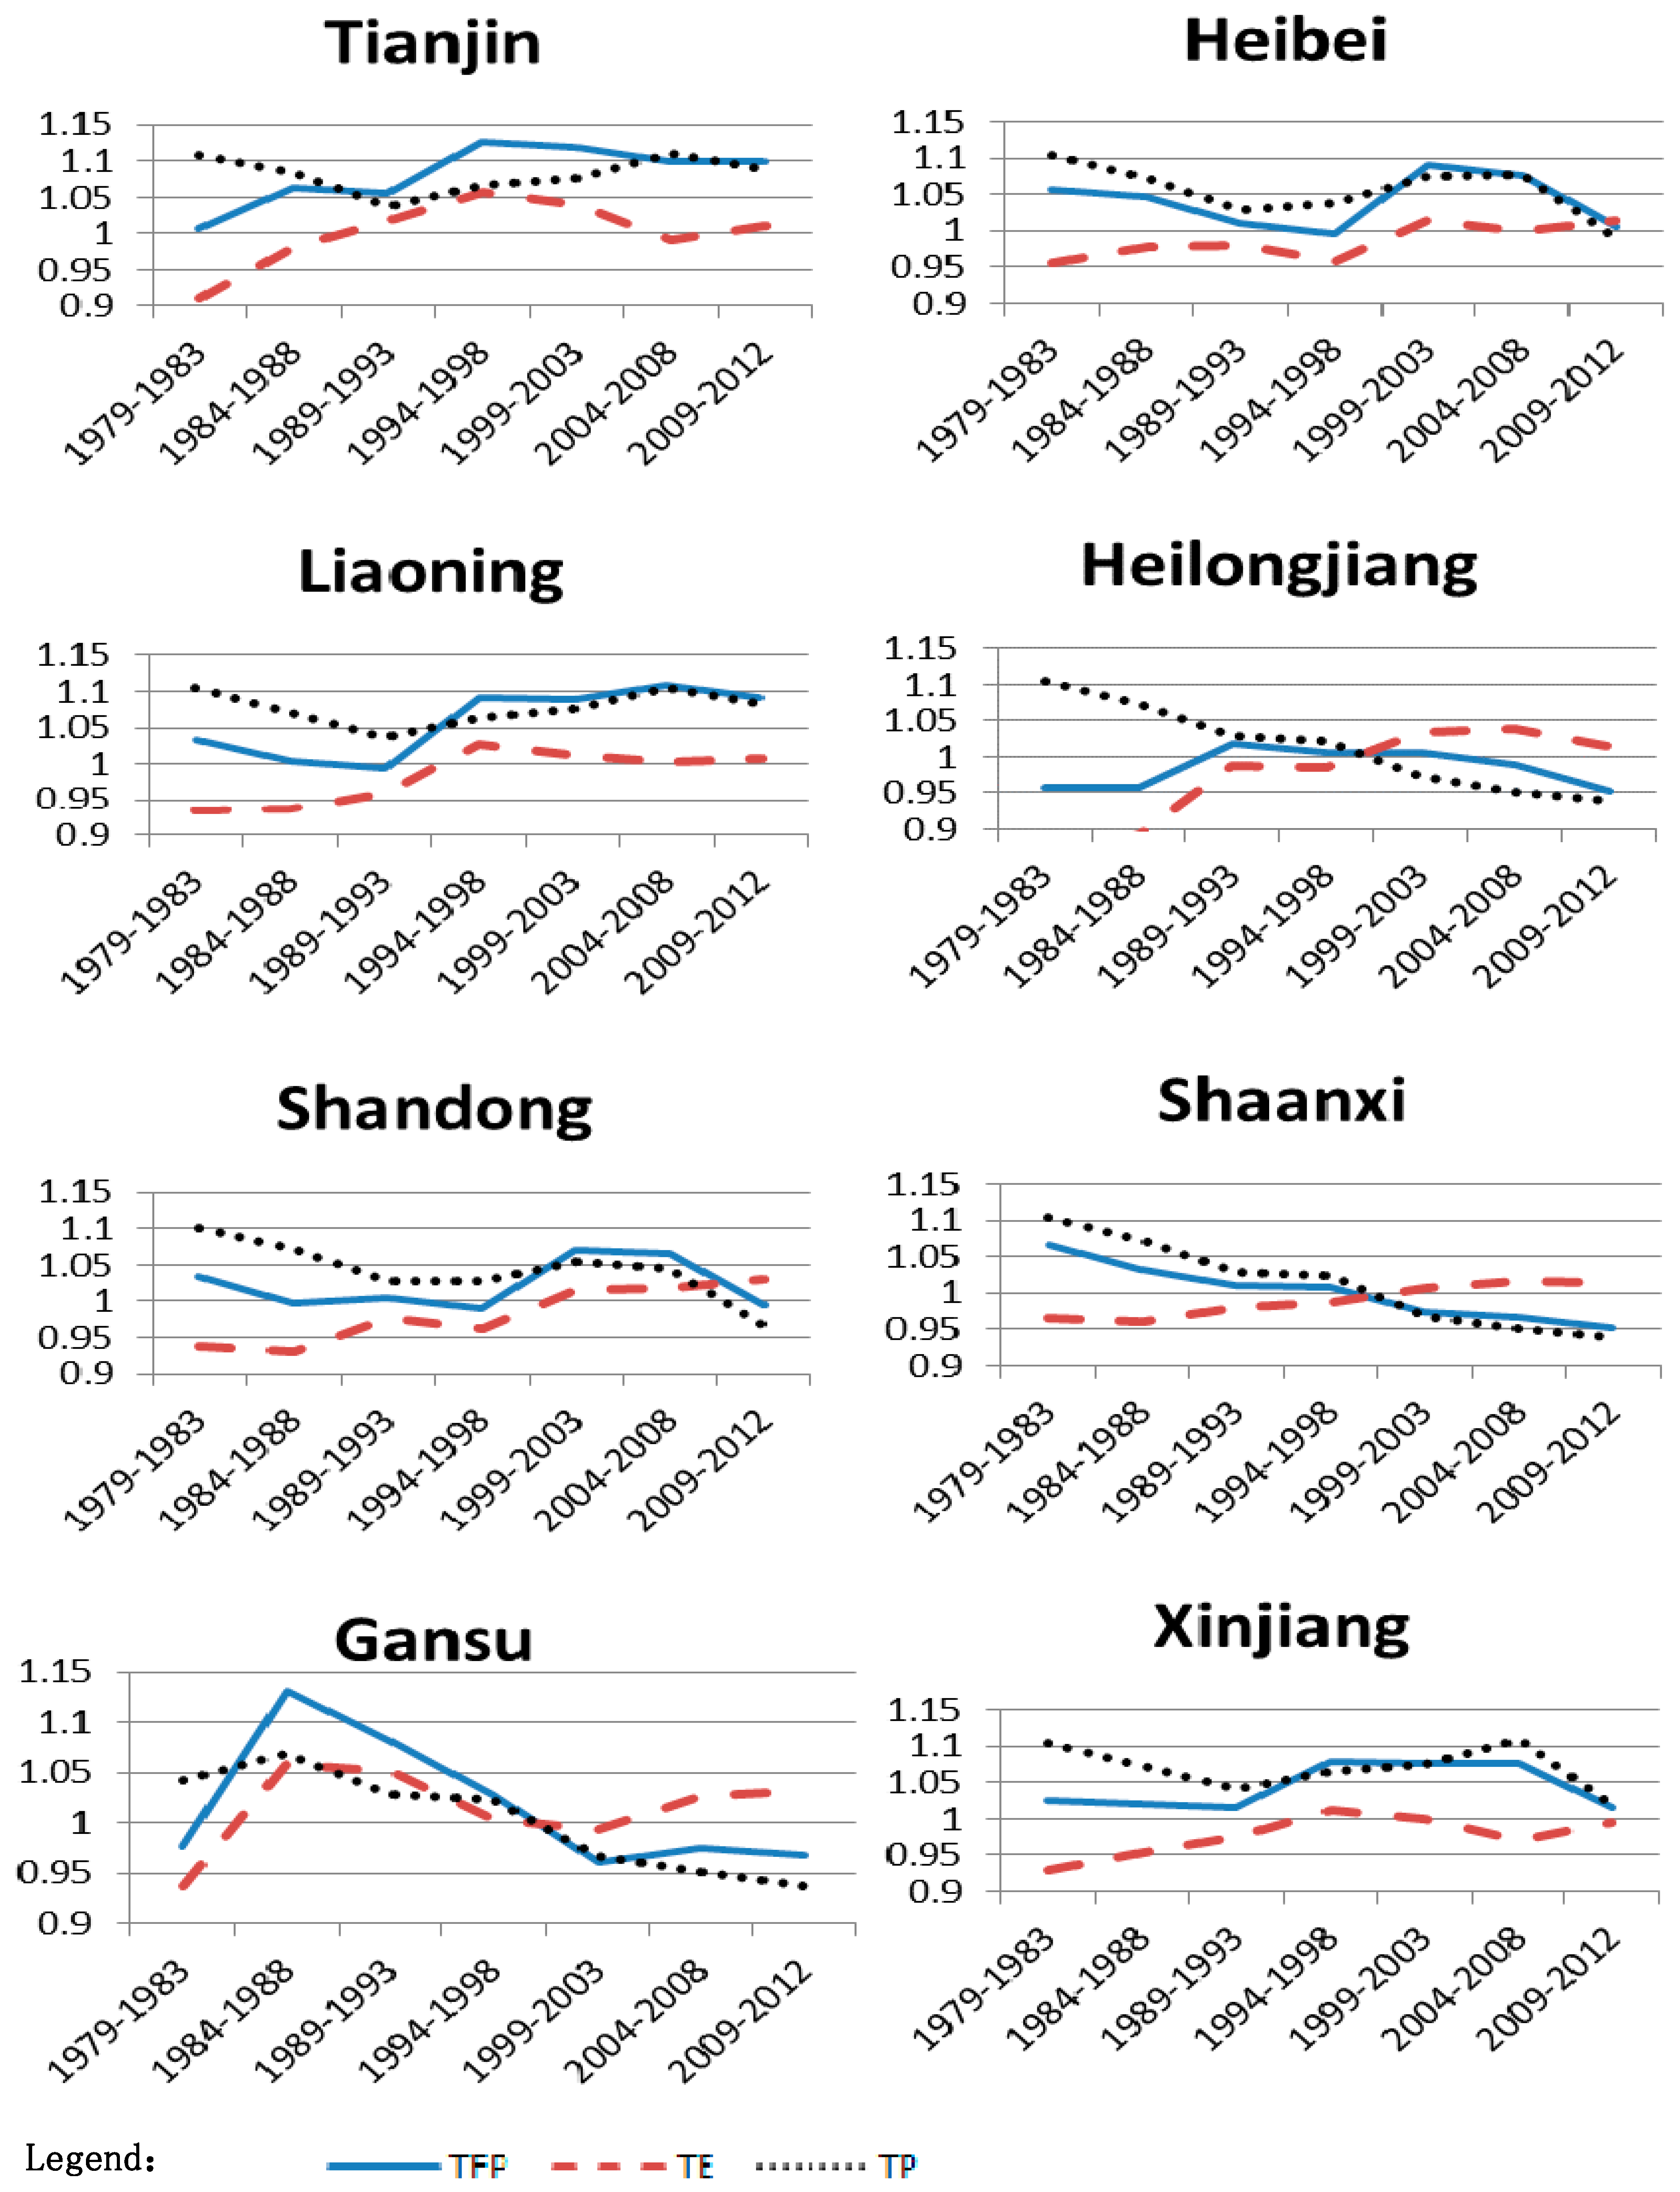
For oil and gas industry clusters with long development periods, when the stock of recoverable resources is decreasing, it is necessary to increase the exploitation of difficult reserves to increase production, which will inevitably lead to technology progress. Because the technical efficiency improvements are not sufficient to increase the production, the demand for technological progress will be realized. For example, in the oil and gas industry clusters in Liaoning, Hebei, and other provinces, the technological progress index is significantly higher than the technical efficiency index.
(2)
For oil and gas industry clusters with relatively short development periods, though there is a relative abundance of resources, in order to avoid falling into the “resource curse” dilemma, more attention should be paid to technological progress to realize sustainable development rather than improving technical efficiency. For example, in the oil and gas industry clusters in Xinjiang, Tianjin, and other provinces, their technological progress index is significantly higher than their technical efficiency index. We noticed that there was a decline in the TFP growth rate in all the provinces and regions in the last two cycles. This may have been caused by the peak of international crude oil prices around 2008. Due to the high prices, the oil and gas industry clusters could still attain high profits without improving their technology progress and technical efficiency, which suppressed the growth of the TFP.

3. The Construction and Analysis of the Empirical Model

Oil and gas industry clusters develop based on natural resources. The leading industries are extractive industries that rely on non-renewable resources. Thus, their economic growth depends on natural resources. Our discussion in Section 2.2 implies that there is no shortage of technological innovation in the oil and gas industry clusters. The demand for technological innovation may vary under different market conditions, which affects the sustainable development of the cluster, resulting in the emergence of the “resource curse” or “resource blessing” [12,32,33].
In the following, we will combine the calculation results from Section 2.2 from 2000 to 2012 to construct an econometric model to reveal the factors that influence the changes in the TFP growth rate, technological progress index, and technical efficiency index of the oil and gas industry clusters. We will also consider the factors that promote or constrain the continuous development of industrial clusters.

3.1. The Definition of Variables and Model Construction

3.1.1. Variables to Be Explained

The TFP growth rate of an oil and gas industry cluster calculated by the Malmquist index method was used as a variable to be explained to measure the overall change in the technological innovation capability of each oil and gas industry cluster. Then, according to the TFP growth rate, we obtained the technology progress index (TP) and technical efficiency index (TE), which we used as the variables to measure the technical progress and technical efficiency of each oil and gas industry cluster. The purpose of choosing multiple variables to be explained was to reveal how these different factors affect the technological progress and technical efficiency of the oil and gas industry clusters, which in turn affects the overall technological innovation capability of each cluster.

3.1.2. Explanatory Variables

In order to sort out the major factors affecting the technological innovation capability of the oil and gas industry clusters and identify the specific impacts of these factors, we combined previous studies and relevant research literature to introduce the following explanatory variables to measure their influences on the variables to be explained, such as TFP, TP, and TE, and the degree of impact [7,8,11,14,32,33,34,35,36].
Scientific research investment (X1): Scientific research investment measures the investment of a region or industry in research and experimentation, including labor cost, material cost, cost for fixed assets equipment, and other related expenses used for scientific research activities. In order to measure the impact of such scientific research investment in the oil and gas industry clusters, we selected the research and development expenditure of the oil and gas industry of each province to measure the scale of scientific research investment. The data were obtained from the science and technology part of the statistical yearbook of each province.
Industry scale (X2): With the expansion of the production scale, the division of labor becomes clearer and more detailed, and the degree of specialization is further enhanced, which leads to the formation of economies of scale. Research has suggested that this scale effect is conducive to the occurrence of technology spillovers and, as such, promotes the development of the oil and gas industry clusters. The ratio of the total output value of an industry to the total output value of all the industries reflects the development scale of the industry. In this work, the ratio between the total output value of the oil and gas industry of each province or region and the GDP value of each province or region was selected to measure the industrial scale. The data were obtained from the statistical yearbook of each province and the statistical yearbook of energy.
Human Capital (X3): The accumulation of knowledge and skills of workers is generally referred to as human capital. High human capital levels enable workers to obtain new knowledge and skills.
With improved capabilities of application and innovation of newly obtained knowledge, the technology of the enterprise will be improved. The number of educated students in higher education can reflect the learning ability of workers to some extent. Therefore, in this paper, we chose the number of college graduates in each province or region to measure human capital. The data were obtained from education section in the statistical yearbook of each province.
Fixed Assets Investment (X4): The total investment in the construction or purchase of fixed assets in an industry reflects the development speed and quality of the industry to some extent. As a large industry in China, the oil and gas industry has great demands for fixed assets. The amount of investment in fixed assets plays an important role in the development of the entire industry. In this work, we examined the impact of the variation of fixed asset investment on the oil and gas industry cluster in each province or region. The data were obtained from the provincial statistical yearbook.
Consumption capacity (X5): The oil and gas industry is a pillar industry in China. In addition, crude oil and natural gas, as raw materials for many industries, are at a high level of demand. The level of oil and gas consumption in a region can affect the productivity and technological level of the oil and gas industry. In order to measure the impact of the market consumption on the oil and gas industrial clusters, the ratio of crude oil and natural gas consumption to total production (converted into standard coal) in each province or region was chosen to measure the consumption capacity. Here, the data were obtained from the statistical yearbooks of these provinces and energy statistics yearbooks.
Degree of openness (X6): As a resource-based industry, the degree of industrial openness of the oil and gas industrial clusters also has great impact on their development. However, there exists controversy about the effects of such influence in the literature. In order to evaluate the influence of industrial openness on the development of the oil and gas industry, we chose the total import and export of oil products in these provinces and regions as a measure of openness. Here, the data were obtained from the statistical yearbook of energy resources in each province.
Other influencing factors: There are numerous complex factors that influence the evolution and development of an industrial cluster. For example, the government policies, laws, and regulations also greatly influence the development of an oil and gas industrial cluster. Based on the characteristics of the oil and gas-based industrial clusters and the availability of the data, this study selected the above six factors to carry out the following quantitative analysis.
There were some other important explanatory variables, such as the resource development policies and resource stocks. Because these factors were difficult to obtain directly or indirectly, we did not consider them in our model. Above, we obtained the TFP growth rate using the DEA–Malmquist index method, in which 2000 is the base year and the value is 1. In each subsequent year, the TFP was calculated by multiplying the growth rate. In order to ensure the stability of the data during the operation and to prevent the occurrence of heteroskedasticity, we took logarithms of X1 and X4. The remaining explanatory variables were unchanged. Based on the selected variables to be explained and the explanatory variables, we built the following panel data measurement model:
Y i t = α i + β i · X i t + ε i t ,
where (i = 1, 2, …, N, t = 1, 2, …, T), N = 8 denotes the number of provinces/regions, T = 13 is the number of years, and Y denotes TFP, TP, and TE. Here, X denotes X1~X6, and the error is εit ~ (0,δ2).

3.2. Results and Analysis

In this Section, we perform the Hausman analysis. The regression results are shown Table 1.
The first model shows the effect of the six variables on the TFP. The investment intensity in technical research (X1), the oil and gas industry scale (X2), the human capital stock (X3), and the investment intensity of the fixed assets in the oil and gas industry (X4) played a significant role at the level of 1%, indicating that these factors are crucial to the growth of the TFP. The effect of the resources consumption capacity (X5) and the degree of openness (X6) of the oil and gas industry on the TFP were not as pronounced as those of the other actors. As shown in Figure 1, the effects of X5 and X6 were not prominent, even at a level of 10%. The coefficient of the technical research input strength the oil and gas industry was 0.629, indicating that the research input strength promotes the growth of the TFP. The coefficients for the oil and gas industry scale, the human capital stock, and the investment intensity of the fixed assets in the oil and gas industry were −2.076, −0.020, and −0.137, respectively. These factors suppressed the growth of the TFP. The oil and gas resource consumption capacity and the degree of openness of the oil and gas industry also contribute to the TFP growth.
In the second model, we considered the effects of the explanatory variables on the improvement in the technology for the oil and gas industry. We showed that the intensity of the investment in research (X1), the oil and gas industry scale (X2), the human capital stock (X3), the investment intensity of the fixed assets (X4), and the consumption capacity of oil and gas resources (X5) played a significant role at level of 1%. However, the effect of the degree of openness (X6) was not prominent. As shown in the Table 1, even at level of 10%, its effect was not significant. The coefficient of investment intensity was 0.693, implying that such intensity promoted the improvement in technology. The coefficients of the oil and gas industry scale, the human capital stock, the investment in fixed assets of oil and gas industry, and the consumption capacity of oil and gas resources were −1.755, −0.034, −0.143, and −0.032, respectively, which implies that these factors suppressed the improvement in technology. The degree of openness of the oil and gas industry had a positive effect on the improvement in technology.
The third model showed the effects of the six explanatory variables on the technical efficiency. The effect of the oil and gas industry scale (X2) was significant at the level of 10%. The effects of human capital stock (X3), the investment intensity (X4) of the fixed assets of the oil and gas industry and the consumption capacity of the oil and gas resources (X5) were significant at the level of 1%. The effects of the research intensity of the oil and gas industry (X1) and the degree of openness of the oil and gas industry (X6) were not significant at the level of 10%. The coefficient of the oil and gas industry scale was −0.213, which suggests that it hindered technical efficiency. The coefficients of the human capital stock (X3), the investment intensity of the fixed assets of the oil and gas industry (X4), and the consumption capacity of the oil and gas resource (X5) were 0.008, 0.026, and 0.012, respectively, which implies that these factors played a significant role in the increase of technical efficiency. The investment in scientific research and the openness in the oil and gas industry had negative impacts on the technical efficiency.
The above regression results imply that the intensity of the investment in research (X1) of the oil and gas industry promoted the technological progress and total factor productivity of the various oil and gas industry clusters. However, its effects on their technical efficiency were not significant. In some cases, investment in research may even pose negative effects. The results were consistent with our expectations. By increasing the investment in research, continuous development and innovation in technology can be obtained. However, we then observed a more complex paradigm. The application of technologies, including water flooding, fire flooding, and compound oil flooding improved the recovery efficiency of the old oil fields. However, because it takes time for industrial employees to get used to new technologies, a reduction in the technical efficiency may appear. Thus, the effects of investment in research on the technical efficiency may not be significant, or may even have negative effects.
The expansion of the oil and gas industry scale (X2) may have inhibited the technical progress, technical efficiency, and total factor productivity of the oil and gas industry clusters, which was consistent with our expectation. Our preliminary analysis implies that because the oil and gas industry clusters are resource-dependent, their expansion depends on the reserves. It is easier to mine oil and gas when there are large reserves, and as such, its expansion does not depend on advances in technology and technical efficiency, which inhibits the demand for technological innovation. When the resources are depleted, there is increasing demand for technological innovation. When the industry shrinks, the negative impact occurs.
Human capital stock (X3) had a negative effect on the technological progress and the total factor productivity of the oil and gas industry clusters. However, X3 promoted technical efficiency. The results were not what we expected. On the one hand, its beneficial effect on technical efficiency was in line with our expectations, because an increase in human capital stock can provide more specialized technical personnel for the oil and gas industry and shorten the training time for skilled workers, which increases technical efficiency. On the other hand, its suppression effects on technological progress and total factor productivity were contrary to our expectations. These results may have been caused by the following reasons:
First, due to barriers in the technology path, the supply of human capital cannot change the dependence of the oil and gas industry clusters on the existing technology paradigm. In order to promote the development of the oil and gas industry, one has to increase the technical efficiency, and thus, new human capital will pay more attention to the improvement of efficiency, which inhibits the demand for technological progress. Second, as the oil and gas industries become more highly automated, the demand for the amount of human capital decreases. The increase of excessive human capital stock may reduce efficiency and increase cost, which inhibits the growth of the total factor productivity.
The increase in the investment intensity of the fixed assets (X4) of the oil and gas industry also inhibited the technological progress and the growth rate of the total factor productivity in the oil and gas industry clusters and promoted technical efficiency, which was consistent with our expectations. As a large-scale resource mining industry, its exploration, development, storage, transportation, processing, and refining require fixed assets. Thus, the investment in fixed assets is indispensable. However, the increase in fixed asset investment in the oil and gas industry clusters does not necessarily lead to technological improvements. More often, the oil and gas industry just invests in old technologies and processes repeatedly to obtain increased profit by expanding production, because the cost of acquiring natural resources is low. However, the repeated use of old technology may improve the technical efficiency to some extent.
The increase in the consumption capacity of oil and gas resources (X5) had no significant impact on the total factor productivity, inhibited technological progress, and promoted technical efficiency. We expected that the increase in the consumption capacity of oil and gas resources would promote the total factor productivity, technological progress, and technical efficiency. However, it only promoted technical efficiency. Further analysis implies that international crude oil was in a relatively high price cycle during the period of our research, which stimulated most oil and gas industry clusters to pay more attention to the growth of production without considering the corresponding mining costs. With the increase in production and neglect in the production costs, there was increased technical efficiency and inhibited technological progress. The mining costs of some domestic enterprises during this period were much higher than the average international costs. This problem was realized as the international oil prices fell. Oil and gas companies must take measures to reduce costs through technological progress instead of simply increasing technical efficiency to increase production.
The degree of openness of the oil and gas industry (X6) had no significant impact on the total factor productivity. It inhibited technological progress and promoted technical efficiency, which contradicted our expectations. The data implied that the imports and exports remained low. In addition, based on the current regulatory status of China’s oil and gas industry, the importing and exporting of China’s oil and gas products is highly monopolistic. This monopolistic market may not reflect the impact of market openness. The impact of the openness of the oil and gas industry should be positive in a fully competitive market.

4. Conclusions

In this paper, we used the TFP growth rate to measure the technological progress of China’s oil and gas industry clusters. Using the Malmquist index method, we studied the eight major oil and gas industry clusters in China. In order to further analyze their trends, we investigated TFP and further decomposed it into TP and TE. We introduced six variables to perform empirical analysis for the oil and gas industry clusters in eight provinces or districts in China from 2000 to 2012. Our analysis reveals the relationship between TFP and the different factors. We identified factors that inhibited and promoted the total factor productivity. We also identified factors that inhibited and promoted the technological progress and technical efficiency. Our results have potential applications in the development of the oil and gas industry clusters.
Based on the empirical results in Section 3, we know that TP and TE have a reciprocal relationship of growth and decline, and the six factors have different directions of influence on them. These interactions contributed to the technical innovation capability of the oil and gas industry clusters. From the findings, we propose the following suggestions to the oil and gas industry clusters in China.
(1)
Maintain stable investment in research and increase the conversion rate of scientific research results. Stable scientific research investment improves the independent innovation in the oil and gas industry clusters and avoids the barriers in the path of technological innovation. With improvement in technological progress, the oil and gas industry will gain enhanced competitiveness. In particular, with the current low oil and gas prices, improvement in technology will reduce costs, and as such, profits will increase. Therefore, the oil and gas industry cluster can obtain the ability to avoid any market shocks caused by fluctuations in price. Special attention should also be paid to improving technical efficiency and transforming technological achievements. We should not only focus on the development of new technologies, but also pay attention to the improvement and optimization of existing technologies. Achievements obtained in technological research should be industrialized as soon as possible.
(2)
Control the development speed and maintain an appropriate scale for the oil and gas industry clusters. Follow the principle of moderate exploitation of oil and gas resources in the clusters, maintain a sustainable industrial development strategy, and do not blindly expand the scale of industry to avoid falling into the “resource curse” cycle. During the development and utilization of natural resources, we should fully consider the protection of the environment. We should also control the mining costs and avoid exploiting difficult mining reserves to prevent market risks caused by excessive mining costs. In view of the environmental carrying capacity, the oil and gas industrial clusters should extract resources responsibly to protect the environment.
(3)
Improve the quality of human resources. With the improvement in technology and the reduction in the resources of major domestic oil and gas industry clusters, the demand for low-end human resources is gradually decreasing, while the demand for professionals is constantly increasing. For example, Daqing Oilfield has been hiring more professionals. On the other hand, a large number of low-end operators in the Daqing Oilfield are faced with the predicament of being laid off. It is important to optimize the structure of human capital within the oil and gas industry clusters and gradually improve the quality of human capital.
(4)
Pay attention to the quality of fixed asset investment. When the current fixed asset is enough for exploration, development, and processing within the industrial cluster, it is not necessary to increase low-level investment. Such short-term growth in production capacity will not bring benefits to the development of the cluster in the long run. Instead, it will inhibit advances in technology due by creating barriers to the path of technological innovation, which will ultimately affect the sustainable development of the industrial cluster. In particular, when the resources in the cluster are exhausted, such over-investment will result in sunk costs, which will not promote the development of the local economy. It will become an obstacle to economic development.
(5)
While meeting the growing demand for oil and gas consumption, companies within the cluster must also consider the risks posed by the market fluctuation. The rigid demand for oil and gas products in the domestic market and the rise in international crude oil prices in previous years have led many domestic oil and gas industry clusters to enter a period of rapid expansion. However, this simple capacity expansion does not consider the risk of fluctuating international oil prices. When the oil price is high, all the cost problems will be obscured. However, when the oil price falls, this hidden risk will appear. At present, many oil and gas production enterprises in China, especially oil and gas exploration and development enterprises, are faced with such a dilemma. Therefore, the oil and gas industry clusters in China should increase their investment in technical research and development whenever possible to enhance their ability to cope with market fluctuation risks.

Author Contributions

L.J. and Z.L. conceived of and designed the study; L.J. and F.X. analyzed the data; and L.J. and Z.L. wrote the article.

Acknowledgments

This article was funded by the Humanities and Social Science fund of the Ministry of Education of China (18YJA630046).

Conflicts of Interest

The authors declare no conflicts of interest.

References

  1. Auty, R.M. Sustaining Development in Mineral Economies: The Resource Curse, 1st ed.; Routledge Press: New York, NY, USA, 1993; ISBN 0-203-42259-7. [Google Scholar]
  2. Sachs, J.; Warner, A.M. The Curse of Natural Resources. European Economic Review. Nat. Resour. Econ. Dev. 2001, 45, 827–838. [Google Scholar] [CrossRef]
  3. Robert, H. How to Unlock Regional Economies from Path Dependency? From Learning Region to Learning Cluster. Eur. Plan. Stud. 2005, 13, 521–535. [Google Scholar] [CrossRef]
  4. Frederick, V.D.P.; Frederick, V.D.P. Natural Resources: Curse or Blessing? J. Econ. Lit. 2011, 49, 366–420. [Google Scholar] [CrossRef]
  5. Partridge, M.D.; Lobao, L. Natural Resource Curse and Poverty in Appalachian America. Am. J. Agric. Econ. 2013, 95, 449–456. [Google Scholar] [CrossRef] [Green Version]
  6. Betz, M.R.; Partridge, M.D.; Farren, M.; Lobao, L. Coal Mining, Economic Development, and the Natural Resources Curse. Energy Econ. 2015, 50, 105–116. [Google Scholar] [CrossRef]
  7. Shao, S.; Fan, M.T.; Yang, L.L. How the Dependence on Resource-based Industries Influence Economic Development Efficiency?—The Empirical Test and Explanation of the Conditional Resource Curse Hypothesis. Manag. World 2013, 2, 32–63. (In Chinese) [Google Scholar]
  8. Cappelen, A.; Mjøset, L. Can Norway Be a Role Model for Natural Resource Abundant, 1st ed.; United Nations University-Wider Research Paper Press: Tokyo, Japan, 2009; ISBN 978-92-9230-192-7. [Google Scholar]
  9. Mehlum, H.; Moene, K.O.; Torvik, R. Cursed by Resources or Institutions? World Econ. 2006, 29, 1117–1131. [Google Scholar] [CrossRef] [Green Version]
  10. Feldman, M.P. The New Economics of Innovation Spillovers and Agglomeration: A Review of Empirical. Econ. Innov. New Technol. 2007, 8, 5–25. [Google Scholar] [CrossRef]
  11. Baum, J.A.C.; Cowan, R.; Jonard, N. Network-Independent Partner Selection and the Evolution of Innovation Networks. Manag. Sci. 2010, 56, 2094–2110. [Google Scholar] [CrossRef] [Green Version]
  12. Sæther, B.T. Innovation by Co-Evolution in Natural Resource Industries-The Norwegian Experience. Geoforum 2011, 42, 373–381. [Google Scholar] [CrossRef]
  13. Silvestre, B.S.; Neto, R.E.S. Capability Accumulation, Innovation, and Technology Diffusion: Lessons from a base of the Pyramid Cluster. Technovation 2014, 34, 270–283. [Google Scholar] [CrossRef]
  14. Stanko, M.A.; Olleros, X. Industry Growth and the Knowledge Spillover Regime: Does Outsourcing Harm Innovativeness but Help Profit? J. Bus. Res. 2013, 66, 2007–2016. [Google Scholar] [CrossRef]
  15. Malerba, F.; Orsennigo, L. Technological regimes and sectoral patterns of innovative activities. Res. Policy 1997, 25, 451–478. [Google Scholar] [CrossRef]
  16. Castellacci, F. Technological regimes and sectoral differences in productivity growth. Ind. Corp. Chang. 2007, 16, 1105–1145. [Google Scholar] [CrossRef] [Green Version]
  17. Acemoglu, D.; Aghion, P.; Bursztyn, L. The environment and directed technical change. Am. Econ. Rev. 2012, 102, 131–166. [Google Scholar] [CrossRef] [PubMed]
  18. Antonio, J.R.; Zulima, F. The relation between firm size and R&D productivity in different technological regimes. Technovation 2012, 32, 609–623. [Google Scholar] [CrossRef]
  19. Parente, S.L.; Prescott, E.C. Barriers to technology adoption and development. J. Political Econ. 1994, 2, 298–321. [Google Scholar] [CrossRef]
  20. Hall, B.H.; Khan, B. Adoption of new technology. Soc. Sci. Electron. Publ. 2003, 5, 477–501. [Google Scholar] [CrossRef]
  21. Li, M.F.; Simerly, R.L. Environmental dynamism, capital structure and innovation: An empirical test. Int. J. Organ. Anal. 2002, 10, 156–171. [Google Scholar] [CrossRef]
  22. Attewell, P. Technology diffusion and organizational learning: The case of business computing. Manag. Sci. 1992, 3, 1–19. [Google Scholar] [CrossRef]
  23. Peneder, M. Technological regimes and the variety of innovation behavior: Creating integrated taxonomies of firms and sectors. Res. Policy 2010, 39, 323–334. [Google Scholar] [CrossRef]
  24. Solow, R.M. Technical Change and the Aggregate Production Function. Rev. Econ. Stat. 1957, 39, 554–562. [Google Scholar] [CrossRef]
  25. Zhang, Z.R.; Lu, M.T. Influence of Total Factor Productivity on China’s Regional Economic Growth and Fluctuations. Chin. Rev. Financ. Stud. 2013, 5, 7–31. (In Chinese) [Google Scholar]
  26. Färe, R.; Grosskopf, S.; Lindgren, B.; Roos, P. Productivity Developments in Swedish Hospitals: A Malmquist Output Index Approach; Springer: Dordrecht, The Netherlands; Berlin Press: Berlin, Germany, 1994; pp. 227–235. ISBN 978-94-011-0637-5. [Google Scholar]
  27. Grosskopf, S. Some Remarks on Productivity and its Decompositions. J. Prod. Anal. 2003, 20, 459–474. [Google Scholar] [CrossRef]
  28. Färe, R.; Grosskopf, S.; Norris, M. Productivity Growth, Technical Progress, and Efficiency Change in Industrialized Countries: Reply. Am. Econ. Rev. 1997, 87, 1040–1044. [Google Scholar] [CrossRef]
  29. Shan, H.J. Reestimating the Capital Stock of China: 1952–2006. J. Quant. Tech. Econ. 2008, 10, 7–31. [Google Scholar] [CrossRef]
  30. Jun, Z. Investment, Investment Efficiency, and Economic Growth in China. J. Asian Econ. 2003, 14, 713–734. [Google Scholar] [CrossRef]
  31. Lei, J.; Juan, L. An Empirical Study on Oil & Gas Resource Clusters and Regional Innovation Network. China Popul. Resour. Environ. 2013, 23, 157–160. (In Chinese) [Google Scholar]
  32. Forster, B.A. A Note on Economic Growth and Environmental Quality. Swed. J. Econ. 1972, 74, 281–285. [Google Scholar] [CrossRef]
  33. Gylfason, T. Natural Resources, Education, and Economic Development. Eur. Econ. Rev. 2001, 45, 847–859. [Google Scholar] [CrossRef]
  34. Wang, S.Y.; Guo, S.Q. Study on Countermeasures for Sustainable Development of Resource-Exhausted Cities. China Soft Sci. 2012, 1, 1–13. [Google Scholar] [CrossRef]
  35. Tu, Z.G. The Coordination of Industrial Growth with Environment and Resource. Econ. Res. J. 2008, 2, 93–105. (In Chinese) [Google Scholar]
  36. Qing, Z.A. Study on the Mechanism of the Formation of the Fragility of the Resources-type Firms Groups and on their Model of Control. Manag. World 2011, 2, 172–173. (In Chinese) [Google Scholar]
Figure 1. The changing trends of total factor productivity (TFP), technical efficiency (TE), and technological progress (TP) in typical oil and gas industry clusters.
Sustainability 10 04833 g001
Table 1. Regression results of TFP, TP, and TE.
VariableTFPTPTE
C−3.551 ***−4.179 ***0.929 ***
LnX10.629 ***0.693 ***−0.021
X2−2.076 ***−1.755 ***−0.213 *
X3−0.020 ***−0.034 ***0.008 ***
LnX4−0.137 ***−0.143 ***0.026 ***
X5−0.019−0.032 ***0.012 ***
X60.3280.429−0.058
R20.8020.8130.586
F-statistic28.09830.01622.842
Prob (F)000
Type of modelFixed effect modelFixed effect modelRandom effect model
Note: (*** The effect is prominent at 1%, ** The effect is prominent at 5%, * The effect is prominent at 10%).

