Dynamic Change in the Water-Level Fluctuation Zone of the Danjiangkou Reservoir and Its Influence on Water Quality


1
Faculty of Resources and Environment Science, Hubei University, Wuhan 430062, China
2
School of Remote Sensing and Information, Wuhan University, Wuhan 430062, China
3
Jiangxi Provincial Geomatics Center, Nanchang 330209, China
4
State Key Laboratory of Information Engineering in Surveying, Mapping and Remote Sensing, Wuhan University, Wuhan 430079, China
5
Key Laboratory of Poyang Lake Wetland and Watershed Research, Ministry of Education, Jiangxi Normal University, 99 Ziyang Road, Nanchang 330022, China
*
Authors to whom correspondence should be addressed.
†
These authors contributed equally to this work.
Sustainability 2018, 10(4), 1025; https://0-doi-org.brum.beds.ac.uk/10.3390/su10041025
Submission received: 29 January 2018
/
Revised: 26 March 2018
/
Accepted: 27 March 2018
/
Published: 30 March 2018
(This article belongs to the Section Environmental Sustainability and Applications)
Abstract
:The water-level fluctuation zone (WLFZ) of the Danjiangkou Reservoir is the last barrier to ensure the water quality of the middle route of the South-North Water Diversion (SNWD) Project and has therefore received widespread attention. Based on the 17-year serial dynamics of the Danjiangkou Reservoir WLFZ extracted from satellite images from 2000 to 2016, this study analyzed the annual and inter-monthly changes in inundation area as well as the non-flooded area within the WLFZ. The first comprehensive map of the temporal and spatial nitrogen (N) and phosphorus (P) release characteristics of the Danjiangkou Reservoir WLFZ is presented. The results showed that the inundation area underwent a significant increasing trend during this period, and the WLFZ was more frequently affected by off-season alternative drying-wetting than before the water diversion. The total amounts of N and P released into the water from the WLFZ soil layer are considerable (7.6 tons of P and 301.2 tons of N per year) and increasing. Optimizing land use in the WLFZ is an important means to ensure water quality in the Danjiangkou Reservoir and the sustainability of the SNWD Project.
1. Introduction
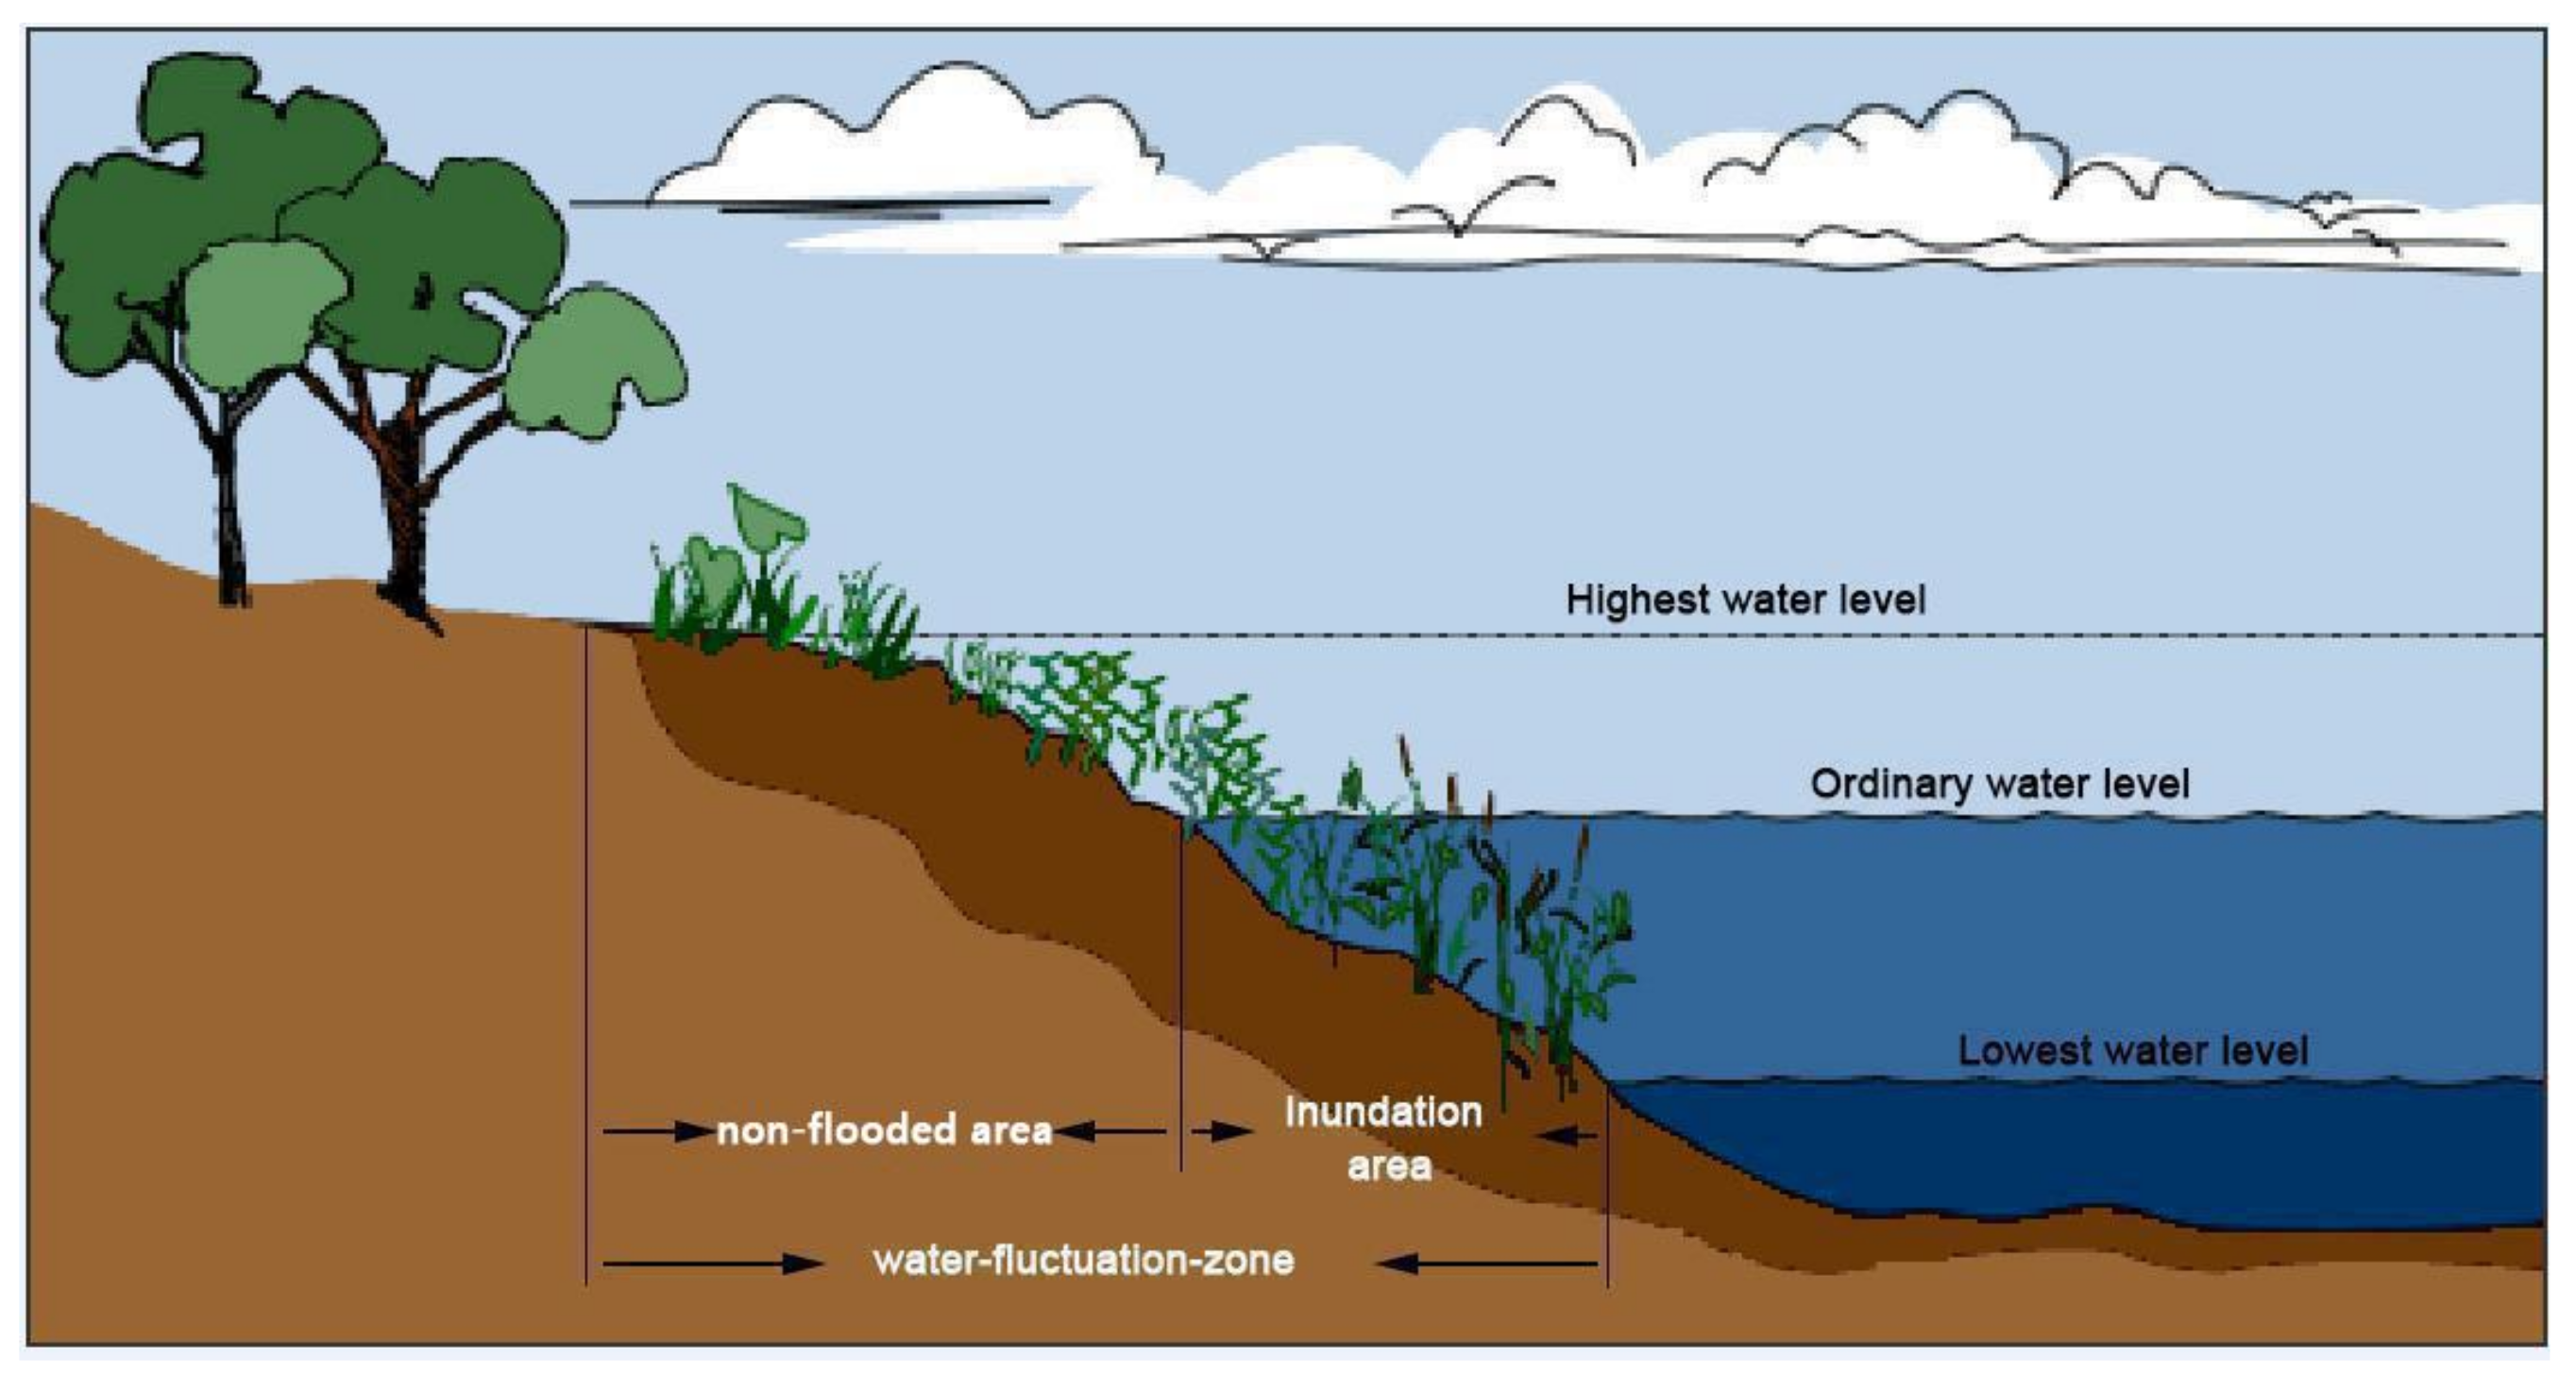
The reservoir water-level fluctuation zone (WLFZ) refers to the periodically submerged and exposed ecozone created by artificial hydrological regulation and the seasonal and spatial variability of natural rainfall [1,2,3]. The WLFZ is customarily depicted as the area between the highest and the lowest water levels historically attained in reservoir management [4]. It is a main channel for the interchange of material, energy, and information and maintains the dynamic equilibrium, biodiversity, and ecological health of the aquatic-terrestrial ecosystems [5]. The WLFZ is particularly attractive as an essential barrier in promoting water quality in a reservoir, as it can filter eroded soil, nutrients, and non-point source pollutants [6]. Constant changes caused by natural events and human activities create the need for monitoring the condition of WLFZ over time. Scientists have commonly paid attention to small-scale ecological issues, such as the cycling of elements, including the migration or transformation dynamics of nitrogen (N) and phosphorus (P), or to larger-scale issues such as land-use change [7]. Spatially hydrological process can help to link these macro- and micro-scale studies closely [8,9].
However, studies on the dynamic hydrological process of the WLFZ are only in the initial stage, waiting for exploring. From a comprehensive perspective, the dynamic process of the WLFZ mainly involves the variation in water area and its frequency. To the single geographic cell in the WLFZ, the dynamic process can be described as the alternation of wet and dry conditions [10]. WLFZ exhibit extreme variations in width, length, spatial complexity, soil, and vegetation cover, mapping their hydrology requires high-spatial- and high-spectral-resolution data [11]. Previous research generally emphasizes the area of the WLFZ by remote-sensing images during the typical seasonal periods [12,13]. Due to the lengthy and irregular monitoring intervals, a lot of detailed dynamic information of the WLFZ has been ignored [14,15].
In China, reservoirs are nearly all in congested areas, where conflicts between people and land are common [16,17]. The WLFZs of these reservoirs are widely acknowledged as an important land resource and are often cultivated seasonally, providing valuable farmland for agricultural production [18]. At the same time, reservoir WLFZs are susceptible to a series of ecological problems, such as soil erosion, water pollution, and geological hazards. The Danjiangkou Reservoir partially solving the water shortage problem of north China is subject to these issues. Since 12 December 2014, the Danjiangkou Reservoir has supplied 6.25 billion cubic meters of water over two years, benefiting 40 million residents living in Beijing and Tianjin as well as Hebei and Henan Provinces. The water quality of the Danjiangkou Reservoir directly affects water security in water-receiving areas and hence the efficacy of the SNWD Project [19]. Given the environmental problems of the Danjiangkou Reservoir WLFZ, which is considered the main buffer to ensure water safety, scientists have investigated the relationship between water quality and the WLFZ. The results of these investigations include the following: agricultural land is dominant even though the spatial land use/cover distribution varies with different water levels; the main factor spatially affecting the type of land use/cover is dam water management and the bank slope terrain [20]; active P and convertible N account for more than 30% of the total phosphorus (TP) and total nitrogen (TN) in WLFZ soils, indicating a high risk level, and these may become secondary pollution sources to the overlying water under suitable conditions [21,22]. The amounts and characteristics of N and P released from submersed soils to the overlying water are closely linked with the N and P background content, which varies greatly with land use type in the WLFZ [23,24,25]. However, Researchers have not yet elucidated the WLFZ’s dynamic changes in the long-term observation, including the relationship between the soils of WLFZ and water quality.
This study analyzed the dynamic process of the WLFZ and spatially estimated the amount of N and P released from soils within the WLFZ to the overlying water under the conditions of alternative wetting-drying processes, using 185 remote sensing images roughly cover every month from 2000 to 2016. The objective of this paper is to: (1) explore WLFZ’s dynamic changes in the long-term sequence to identify the temporal and spatial variation; and (2) map the WLFZ’s released nutrients at two periods to improve water quality management.
2. Research Area and Data
2.1. Research Area
The Danjiangkou Reservoir (32°36′–33°48′ N, 110°59′–111°49′ E) is in the upstream reaches of the Hanjiang River, the largest tributary of the Yangtze River, and is surrounded by Danjiangkou City and Yunyang District in Hubei Province and Xichuang County in Henan Province (Figure 1). This reservoir is the exclusive water source of the middle route of South-North Water Diversion (SNWD) Project—a remarkable interbasin water transfer project started construction in 2003 and the first phase completed in 2013, which delivers the Danjiangkou Reservoir’s water to the North China (Figure 1). To impound more adequate water for diversion, the Danjiangkou Reservoir Dam had been raised on the original dam. After the dam-heightening project completed in 2013, the storage capacity upgraded to 29.05 billion cubic meters. Since the beginning of water transfer on 12 December 2014, the Danjiangkou Reservoir has supplied 6.25 billion cubic meters of water over two years, benefiting 40 million residents living in Beijing and Tianjin as well as Hebei and Henan Provinces. The water quality of the Danjiangkou Reservoir directly affects water security in water-receiving areas and hence the efficacy of the SNWD Project [22]. After the dam-heightening stage, water level parameters were modified in reservoir operation management (Table 1). There are approximately 180 million residents living around the Danjiangkou Reservoir. The average annual water area of the reservoir is 480.38 km², the largest depth is 53.2 m, the water inflow is 39.48 billion cubic meters per year, and the total annual rainfall is 900.4 mm, of which 75–80% falls during the flood season (21 June–30 September). The Danjiangkou Reservoir WLFZ is characterized by “summer land and winter flood”, with abundant plant growth during the summer period, and over 40% area of which are planted crops, mainly rice, corn and sesame seeds.
2.2. Data
The data applied in this study are mainly composed of remote-sensing images, land use, soil, digital elevation and N and P background contents in the typical WLFZ. Remote-sensing image data include 185 scenes, including Landsat series and HJ-1A/B. Land use data are interpreted from Landsat remote-sensing images taken in 2006 and 2015 supplemented by national land survey data. The source and composition of the data are shown in Table 2.
3. Remote-Sensing Image Extraction in the WLFZ
3.1. Reservoir Water Extraction
The NDWI (Normalized Difference Water Index) was applied to the Danjiangkou Reservoir water extraction and partially eliminated the influence of the solar elevation angle, the sensor angle, and the atmospheric condition, enabling the water body information to be extracted accurately to capture the variation characteristics of the large-scale water body under a long time sequence [26]. The specific formula of NDWI [27] is as follows:
In Formula (1), represents the green band and represents the near red band, which represent the 2/2/3/2 band and the 4/4/5/4 band, respectively, of the TM/ETM + /OLI/HJ-1 remote-sensing image.
In the NDWI image, the pixel values range from −1 to 1. Water features have positive values, while soil and terrestrial vegetation features have zero or negative values due to their typically higher reflectance of NIR than that of green light [28].
3.2. Extraction of Reservoir Inundation Area and Non-Flooded Area
The WLFZ is the area affected by periodic water level fluctuation between the lowest water level and the highest water level of the reservoir [29], of which the former part is termed the inundation area because it is flooded by water, while the latter is termed the non-flooded area (Figure 2).
Extracting the range of characteristic water levels from reservoir DEM (i.e., the highest level of the water body RH and the lowest level of the water body RL), and combined with water body interpretation from the remote-sensing images (R), the inundation of the WLFZ can be established as the difference between R and RL, with the non-flooded area between RH and R. When the water level remains stable, the reservoir WLFZ unit is subordinate to the inundation area or the non-flooded area and can be calculated using Formulas (2) and (3):
In Formulas (2) and (3), is the inundation area in the reservoir WLFZ, is the non-flooded area in the reservoir WLFZ, cell is the geographical unit of the WLFZ, R is the water body interpreted from remote-sensing images, is the highest level of the water body, and is the lowest level of the water body.
Three indexes on the WLFZ unit are proposed in this study, including the probability of inundation (), the frequency of alternative drying-wetting (C), and the inundation duration (). describes the probability that the cell has been submersed, and C is described by the dynamic degree, which reflects the severity of the disturbance of the water level. is measured in submerged days. The formulas are as follows:
In Formulas (4) and (5), C is the dynamic degree of the WLFZ unit, is the duration of inundation, is the inundation count, is a count of the number of occurrences that the state of the cell changes from wet to dry and vice versa from successive images, is the monitoring number, is the duration of inundation in the WLFZ unit from to time, and are respectively the non-flooded area by remote sensing monitoring in i and i + 1 time, and are respectively the areas of inundation in i and i + 1 time, is the interval days between times i and i + 1, is the shortest distance between the WLFZ unit and the water boundary of remote-sensing monitoring area at time i + 1, and is the shortest distance between the WLFZ unit and water boundary at time .
3.3. Potential N/P Release in Reservoir WLFZ
In the process of being alternatively submersed or exposed, N and P circulate and reform between the WLFZ soil and the overlying water through a series of physicochemical reactions [30]. The occurrence rate of conversion, background content and release characteristics of soil N and P for different land use/covers in the Danjiangkou Reservoir typical of WLFZ were obtained (Table 3).
The following four key assumptions are presented to enable this practical issues, spatially evaluating the total amount of N and P released from the soils of WLFZ to overlying water under the alternating dry-wet process, to be calculated integrally:
Key assumption 1: the background content of N and P elements in soils of WLFZ varies from one type of land use/cover to another;
Key assumption 2: during the wet and dry alternation process in the WLFZ, the contents of N and P in the soils remain relatively stable;
Key assumption 3: the N and P elements released into the overlying water will no longer be deposited in other soil units of the WLFZ;
Key assumption 4: the ratio of N release to soil N background contents is equal for the same time, and P is the same.
Based on the above assumptions, , and constitute the external hydrological conditions of soils in the WLFZ. Formula (8) can be described as follows [31]:
is the potential release amount of N or P elements, is N or P element type, is the edaphic weight in the WLFZ unit (here, only the plowing layer (i.e., 20 cm) is considered), is the background content of TP or TN, and is the proportion of the N or P released to the overlying water (here, referring to the results of the laboratory experiments of the soils in Danjiangkou Reservoir’s WLFZ [32], the of N is 1.2% and the of P is 0.47%).
4. Results and Analysis
4.1. Dynamic Process of the WLFZ
The time series of inundation area and non-flooded area in the Danjiangkou Reservoir WLFZ based on remote-sensing monitoring from 2000 to 2016 is illustrated in Figure 3.
There was a sudden change of gray line in Figure 3 that coincided with the abrupt augmentation of the WLFZ area, as the water level reached its greatest height of 160.72 m after the measures to increase the reservoir storage were implemented. Remarkably, the area of inundation showed a statistically significant increasing trend (p < 0.05 from t test) from 2000 to 2016, and accordingly, the non-flooded area showed a decreasing trend (p < 0.05 from t test) from 2000 to 2016. During the period from 2000 to 2013, the total area of the WLFZ was 450 km², of which the inundation area was 192.16 ± 93.86 km². During the period from 2014 to 2016, the total area of WLFZ was 500 km², of which the inundation area was 258.58 ± 126.27 km². With respect to the area fluctuations, the standard deviation of the period between 2005 and 2011 was 88.29 km², lower than that of the periods from 2000 to 2005 and from 2012 to 2016.
Figure 4 shows the average monthly area variation in inundation and non-flooded area in the Danjiangkou Reservoir WLFZ from 2000 to 2016, including the period before water diversion and after water diversion. A clear difference occurred in both inundation and non-flooded area between the period before the water diversion and after the water diversion (i.e., blue line to green line and orange line to purple line, respectively). On average, the inundation area increased by 106.91 km2 and the non-flooded area decreased by 66.91 km². Before the water diversion, the average area of inundation between 2000 and 2016 was at a minimum during May and a maximum during October. The area of the inundation broadly increased by 30.04 km2 per month from May to October, while the non-flooded area exhibited the opposite trend. After the water diversion, the time at which the inundation area reached its largest or smallest value during the year was delayed by one month.
4.2. Spatial Features before the Water Diversion and after the Water Diversion
To show the diversity between grid cells more clearly, the degrees were reduced to four levels by from 10% to 90% in Figure 5. In total, the shorter the distance between the grid cells and the permanent surface is, the smaller the value tends to be. Two representative areas were selected, and the frame enlarged: Junxian County, where the relocation area of the ancient Junzhou City was flooded, at the top-left, and Taocha, the first sluice gate and the head of the main canal of the middle route of the SNWD project, at the bottom-right. Comparing the areas of scope during the period before water diversion reveals that those after water diversion have shown a significant increase in permanent water area (i.e., 90% < ≤ 100% or dark blue region) and potential inundation area (i.e., = 0 or gray region). The formerly tortuous, fragmented bays was submerged, becoming a continuous expanse of open water. In the northern part of the reservoir, nearly 65% of the seasonally flooded areas were completely submerged. Accordingly, the permanent water increased by 169.60 km², and the potential inundation area increased by 202.87 km².
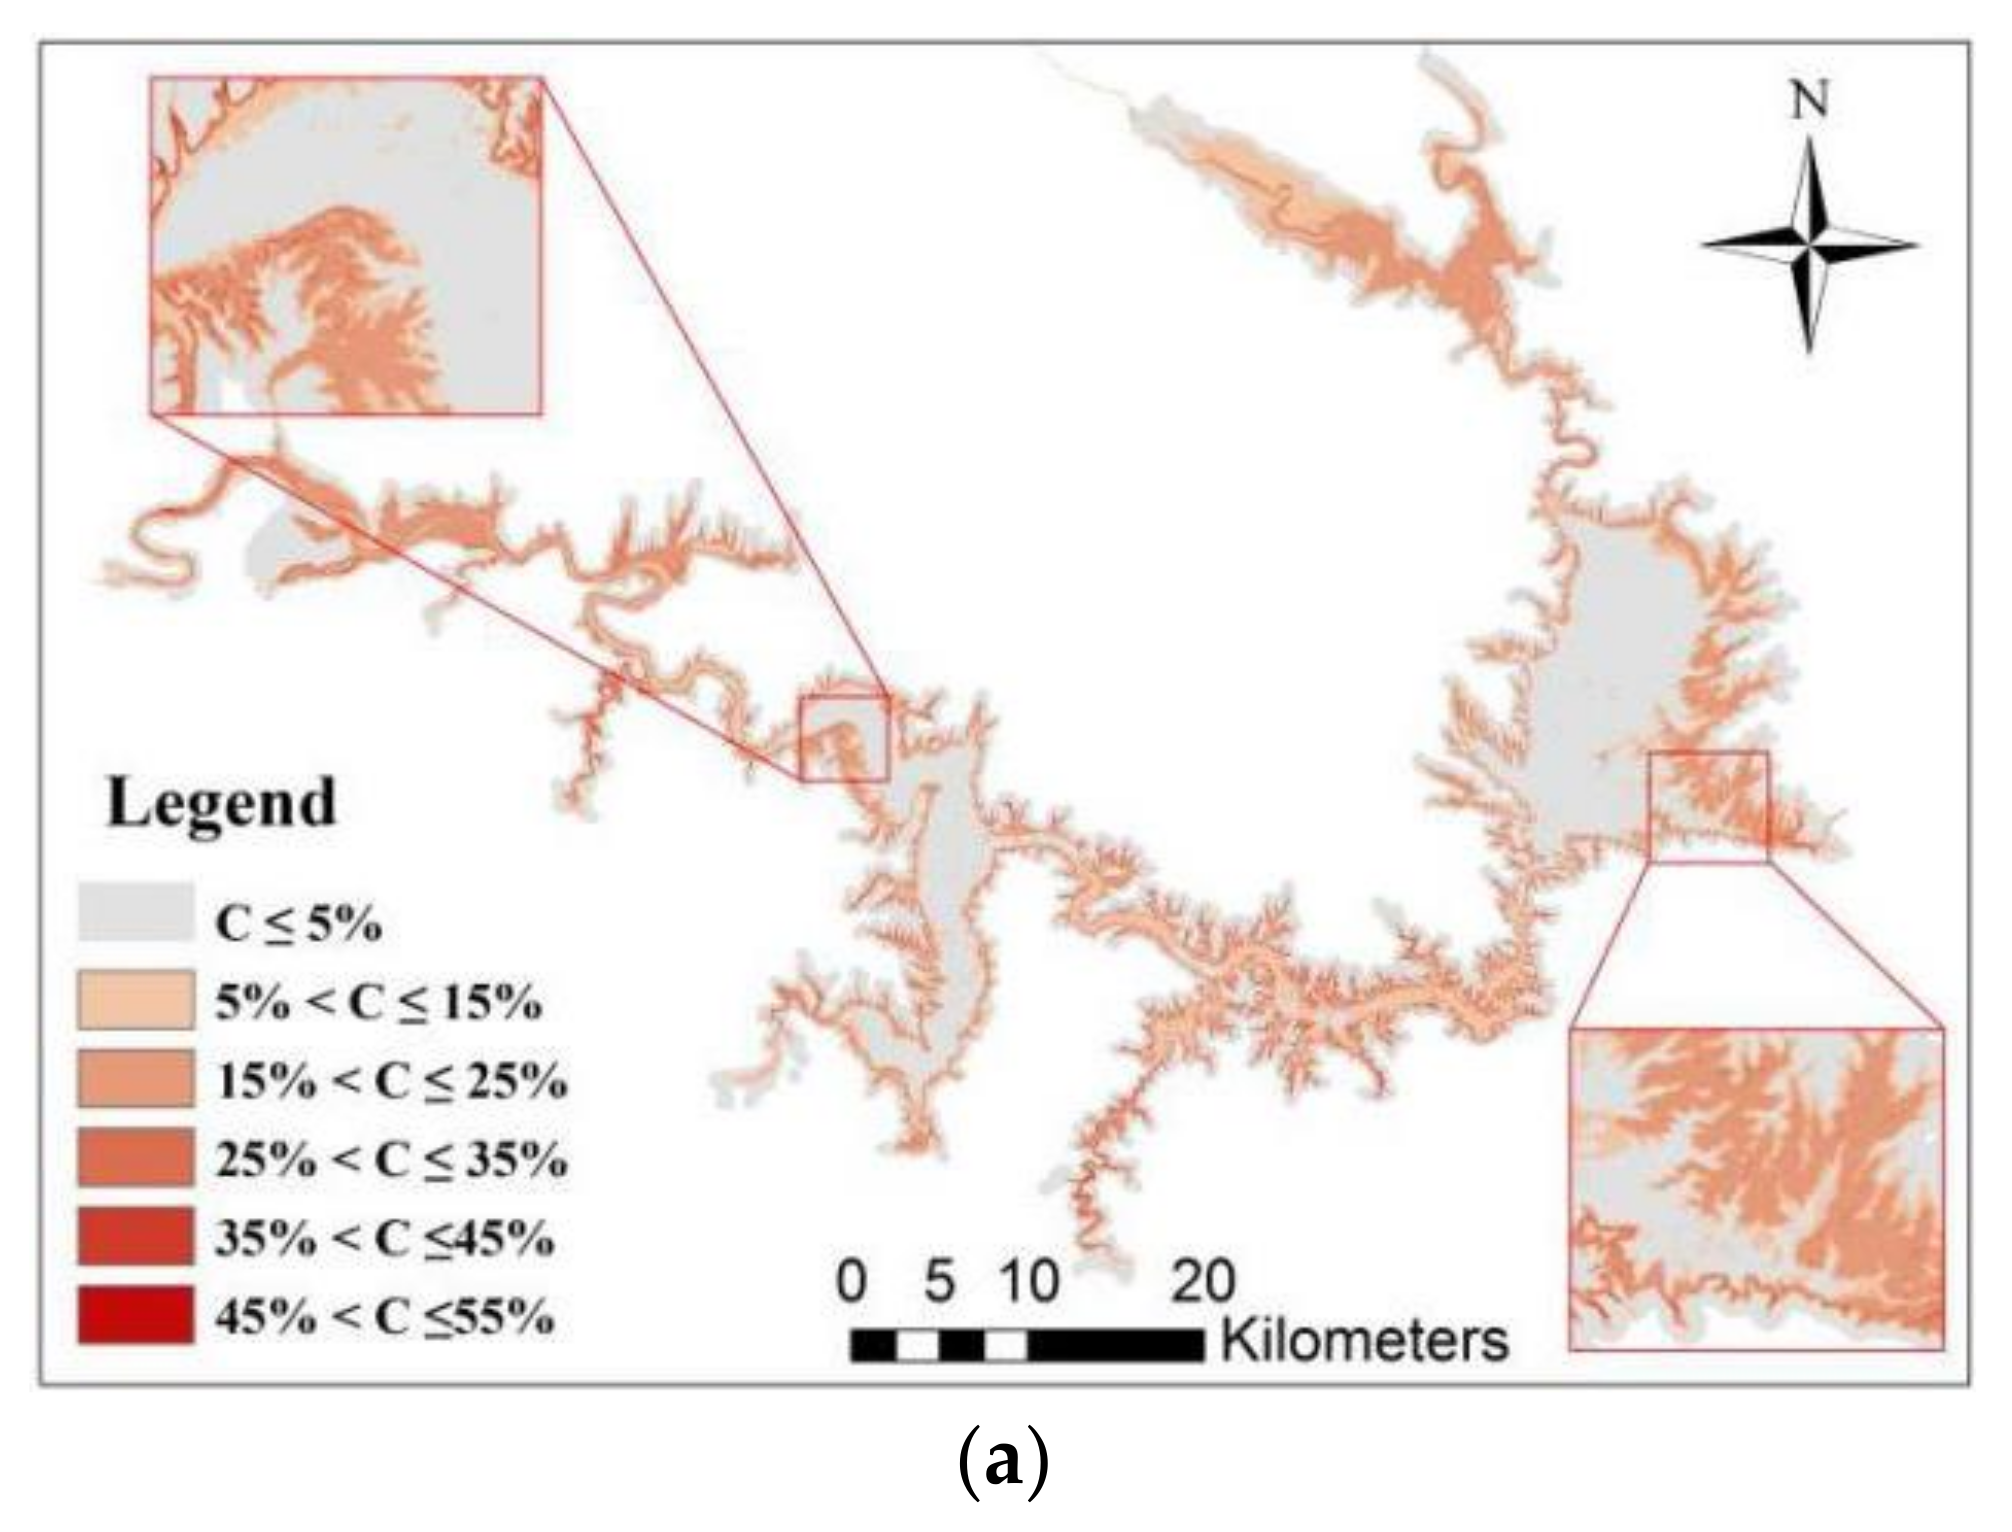
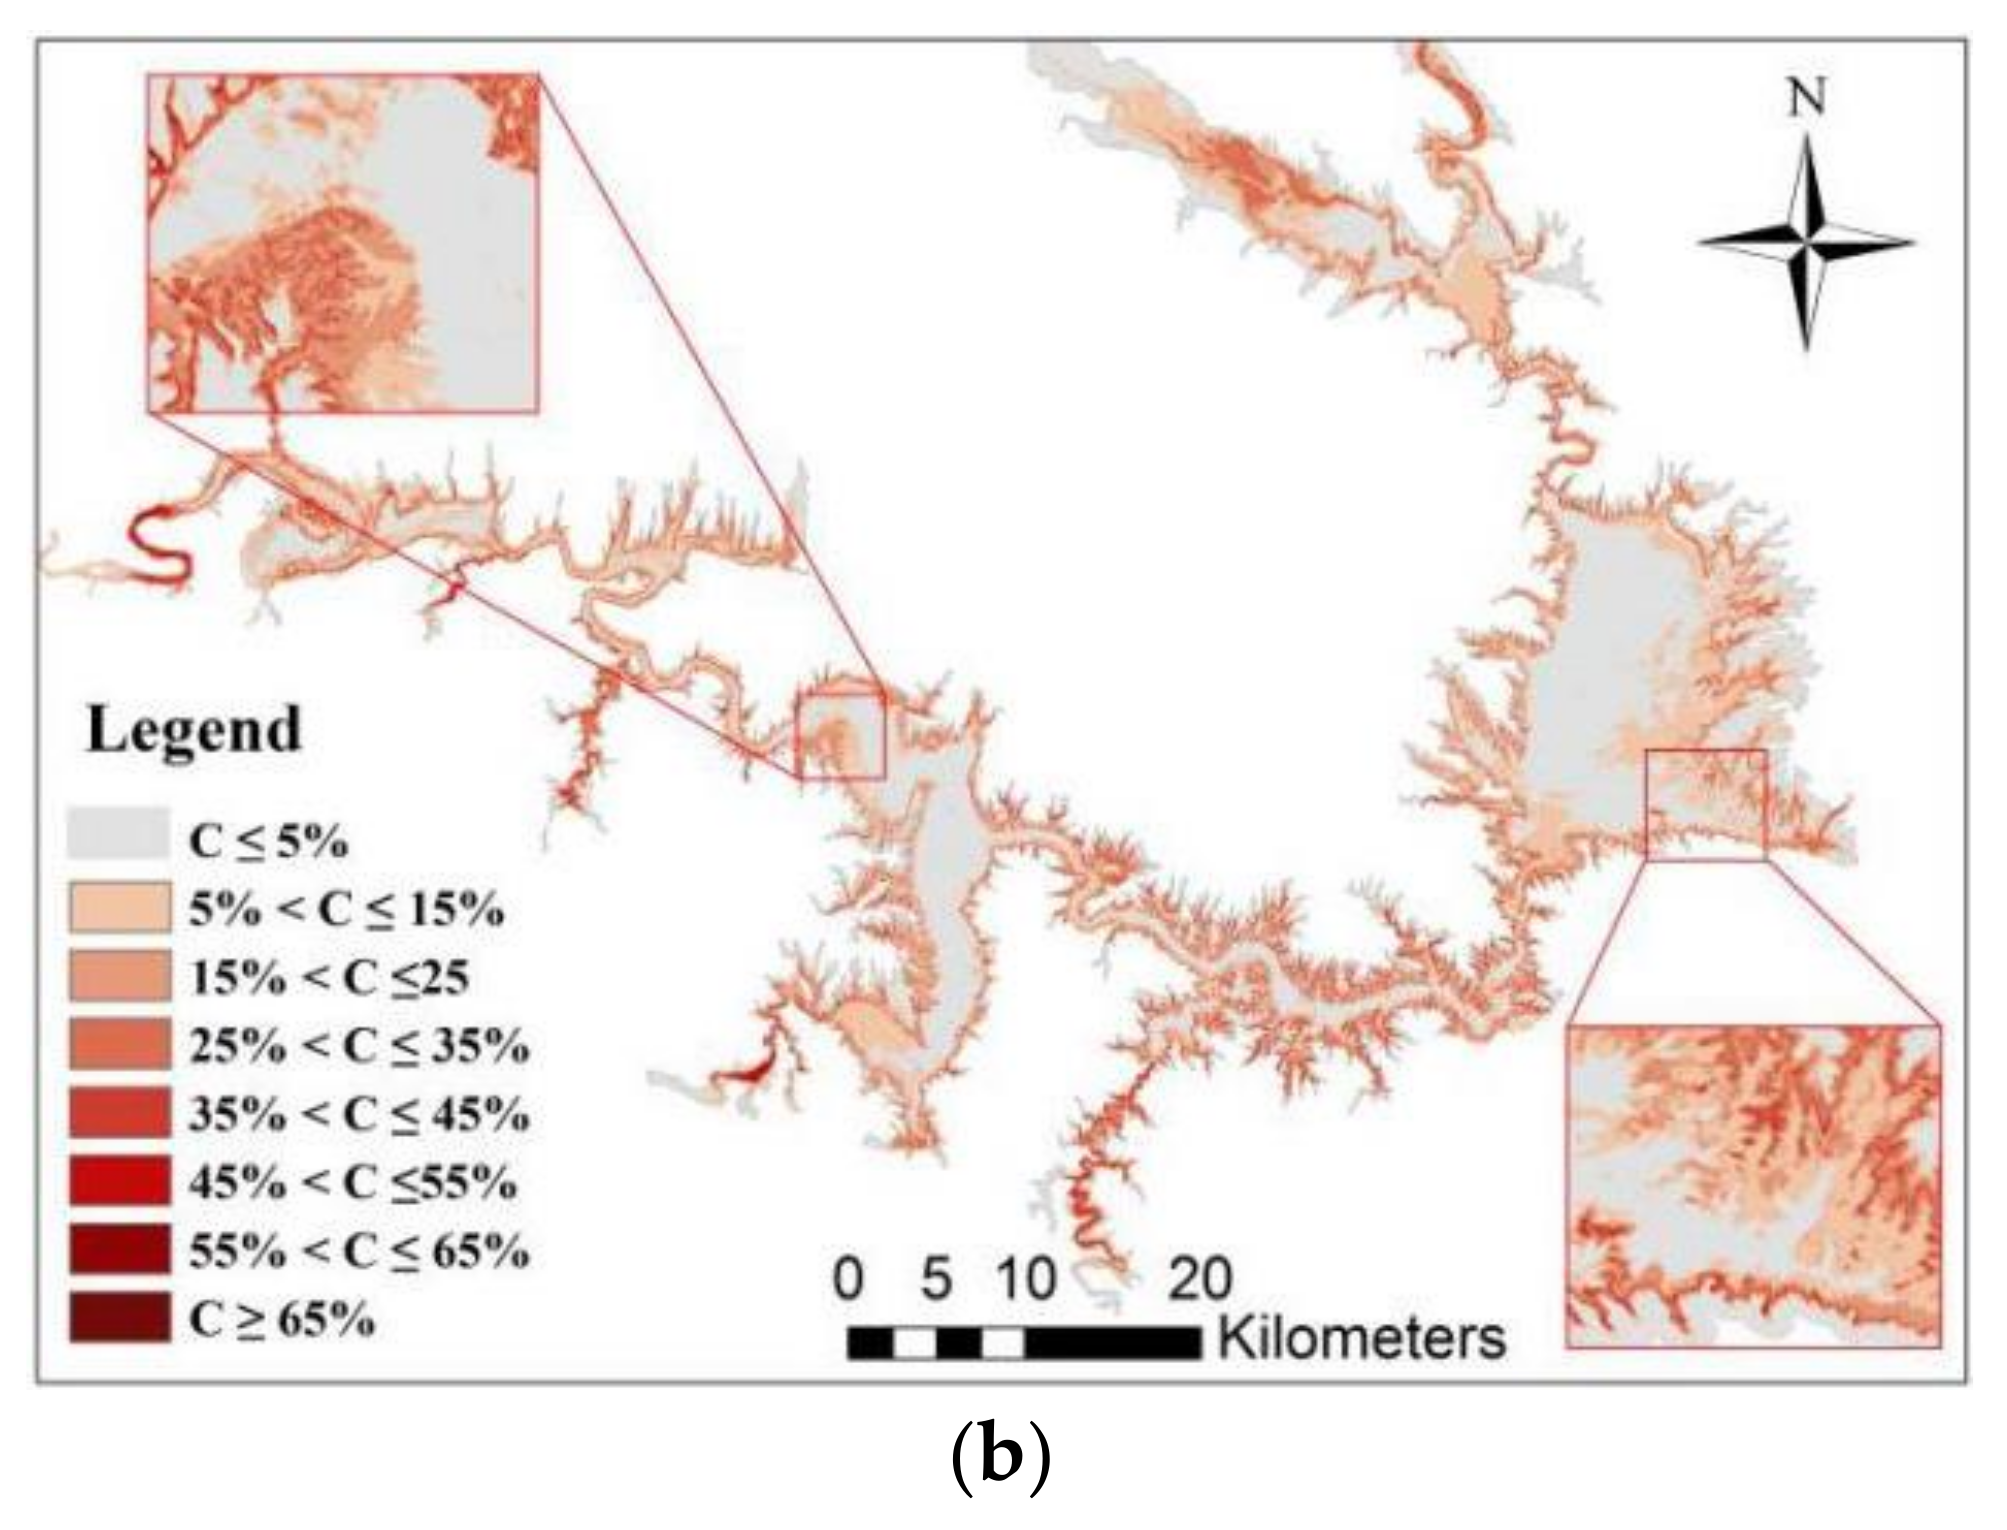
As shown in Figure 6, the spatial distribution of the alternative drying-wetting frequency (C) during the two periods was obtained. The C values of permanent water surface and potential WLFZ are less than 5%, which indicates that it is not obvious whether water areas rapidly dry into beaches or beaches are repeatedly submerged. Before water diversion, all the WLFZ grid cells have a C value of less than 55% and the total area of the grid cells with C values between 15% and 35% accounts for 48%. After water transfer, the distribution range of the C values expands to 0–80%, and to some extent, the higher the elevation of the WLFZ, the greater the C value. In contrast, the areas where C values are less than 25% before water transfer decrease after water transfer, whereas the areas where C values are greater than 25% increase.
The spatial distribution map of inundation duration () before water diversion and after water diversion at the Danjiangkou Reservoir is shown in Figure 7, reflecting the lasting time differences when the cell of the WLFZ was submerged for one year. Before water diversion, the grid area with a value less than six months is 161.88 km², which accounts for 64.9% of the total WLFZ area. After water diversion, the grid area with a value less than six months accounts for 43.3% of the total WLFZ area. Thus, more areas have been inundated and the water storage increased significantly in the Danjiangkou Reservoir.
4.3. Nitrogen and Phosphorus Release in the WLFZ
Based on Figure 5, Figure 6 and Figure 7 and Table 3, the distribution of N and P release amounts (Figure 8 and Figure 9) in the two periods before and after water diversion in the soil of Danjiangkou Reservoir WLFZ was initially estimated by map algebra and spatial statistical analysis.
The annual release of P in soil grids has spatial heterogeneity, as well as the N. The spatial distribution of the annual release amount of P in the Danjiangkou Reservoir WLFZ was similar to the annual distribution of N release; the soil that releases N is approximately coincident with the soil that releases P, except that the N release amount was larger, exceeding by 10 times the annual P release during the whole study periods. The concentrated contiguous N and P release areas are in Xichuan County along the right bank (red and purple dashed oval in Figure 9) and Yunyang District on the eastern side of the reservoir (cyan dashed oval in Figure 9). After water diversion, more N and P were precipitated into the overlying water compared to the period before the water diversion, and large release grids of WLFZ were distributed in areas that have gradually had less permanent water.
The annual N and P release amounts were relatively limited for each 30 × 30 m soil unit in the Danjiangkou Reservoir WLFZ. The areas of soil units with different N and P annual efflux in the WLFZ was calculated in Figure 10. Before water diversion, the P release amount was less than 2.3 kg per year in 94% of the WLFZ soil units and the N release amount of nitrogen was less than 50 kg per year in 81.8% the WLFZ soil units. After water diversion, the proportion of soil units with the same annual release amount of P and N as the total WLFZ area decreased to 84.9% and 79.8% respectively. The release amount of P and N annually during the two periods before and after water diversion in the Danjiangkou Reservoir WLFZ was estimated. The release amounts of P and N reached 6.0 tons and 196.9 tons, respectively, per year before 2014, and increased to 7.6 tons and 301.2 tons, respectively, after 2014.
5. Discussion
5.1. Discussion of Precision
The inundation area and non-flooded area in the Danjiangkou Reservoir WLFZ are indirectly interpreted via an alternative method that uses spatial calculations on the DEM based on a range of feature levels and water interpreted by satellite images. The key lies in the accuracy of the water body delineation. As an important means of monitoring a wide range of water bodies, remote sensing has been applied to different regions of different spatial scales [27,33,34]. Because of meteorological factors such as cloud cover, Landsat’s 16-day return cycle is difficult to guarantee; thus, HJ-1A/B satellite imagery was introduced as an important data source [35]. This approach allowed satellite imagery to include at least one remote-sensing image each month for the period after 2008. The HJ-1A/B remote-sensing images and Landsat series remote-sensing images used in this study are the same used in satellite orbit design, imaging geometry, visible and near-infrared band settings, and spectral response curves [36]. An important aspect is that both sensors have a spatial resolution of 30 m, which ensures that the extracted water is not disturbed by resolution and can be compared at the same scale. Therefore, HJ-1A/B can be used as an effective supplement to remote-sensing information extraction and has little effect on interpreting the dynamic processes in the Danjiangkou Reservoir WLFZ.
The N and P background contents in the WLFZ soil have spatial and temporal heterogeneity, i.e., there may be significant differences in N and P contents in WLFZ soils by region and time. The background contents of N and P in different soil types, as well as the fact that N and P are released to overlying water when WLFZ soil units are submerged, affect the research results of the Danjiangkou Reservoir WLFZ in recent years. However, the lack of consideration of surface runoff due to rainfall may result in underestimation.
5.2. The Dynamic Processes of the WLFZ
The dynamic processes of the WLFZ reflect the spatial variability of the submergence-out phenomenon caused by periodic water level fluctuations and the duration of inundation, which link the macro-hydrological process and micro-material cycles and the flooding stress of species [37]. The dynamics of the Danjiangkou Reservoir WLFZ are closely related to changes in reservoir water storage, which are influenced by human factors such as regulation and storage, climatic conditions, irrigation, etc. The regulation and storage of the Danjiangkou Reservoir mainly involve the management methods, including raising the reservoir dam to save incoming water, draining more water before the flood season (For example, before 21 June, the water level was forcibly reduced to below 160 m for safely crossing the flood peak.) or during the agricultural water demand period, and strengthening water storage at the end of the flood season. In addition to a variety of man-made regulating factors, the main climate factor is rainfall. With the change in reservoir water area, the WLFZ experiences two processes of submergence and drying. The dynamic changes in the WLFZ from 2000 to 2016 can be roughly divided into two stages: 2000–2014 (before water diversion) and 2015–2016 (after water diversion). Before 2014, the area of the WLFZ was approximately 450 km2, including 192.16 ± 93.86 km2 of inundation area. After 2014, the total area of the WLFZ was 500 km2, including 258.58 ± 126.27 km2 of inundation area. The Danjiangkou Reservoir watershed experienced a long period of drought, with an average submerged area of only 146 km2, between 2000 and 2002. Subsequently, due to climatic factors such as rainfall, the levels gradually returned to the multi-year average and the area of inundated areas gradually increased. Between 2005 and 2012, to ensure the safety of the dam-heightening project, the water storage of the reservoir was maintained to be relatively stable, resulting in the inundation area and the dry area being in homeostasis. During the transitional period between 2013 and 2014, when the dam-heightening project was completed and the premise of the middle routes of the SNWD Project established, reservoir water needed nearly one year to meet water requirements. By the time the water level of the Danjiangkou Reservoir reached 160 m during autumn 2014, the area of the fluctuation zone had increased significantly. After 2014, the Danjiangkou Reservoir water level was always maintained at a high level to ensure sufficient water could be delivered for use.
There is a marked seasonality in the flooded area of the Danjiangkou Reservoir. The rainfall in the upper reaches of the Danjiangkou Reservoir and the Hanjiang River mainly occurs from May–October. The rainfall during this period accounts for more than 70% of the annual rainfall, resulting in summer and autumn floods. Therefore, the flooded area shows a dramatically increasing trend, reaching 258.61 km2 from May to October, as shown in Figure 4. The monthly mean inundation area basically remained at 250 km2 with little fluctuation from October to December. In December to May of the next year, the Danjiangkou Reservoir experienced a dry season with less rainfall, and the average area of inundation during the month gradually decreased to 108 km2 during May. In contrast to typical riverbanks in China, which are submerged in summer and exposed in winter, the Danjiangkou Reservoir WLFZ exhibits the pattern of off-season alternating dry and wet conditions.
5.3. Impact on Reservoir Water Quality
The Danjiangkou Reservoir is a water source for the middle route of the SNWD Project, and its water quality is the decisive factor for the sustainable operation of the diversion project. N and P restrict the growth of most algae; when their concentrations increase, water eutrophication occurs, resulting in a decline of water quality. It is impossible to completely avoid an increase the concentrations of N and P in the water, as the soil of the WLFZ are inevitably affected by the hydrologic processes such as in flooding and drought. Several years of water quality monitoring have revealed that the Danjiangkou Reservoir is approximately Class II (according to the national surface water quality standards GB3838-2002 formulated by China’s environmental protection department, the concentrations of P and N in water quality monitoring section are 0.01–0.025 mg/L and 0.2–0.5 mg/L, respectively, in lake or reservoir water [38]). Given that the annual volume of water in the Danjiangkou Reservoir is calculated according to the annual average (10.55 billion cubic meters before water diversion and 11.04 billion cubic meters after water diversion) and the P and N released from the WLFZ soil to the overlying water evenly dissolve in the reservoir water body, the impact of the WLFZ dynamic process on water quality will be roughly evaluated. Before water diversion, the total P and N concentrations in the water increased by 5.69 × 10⁻⁴ mg/L and 1.87 × 10⁻² mg/L, respectively, due to the release of WLFZ soil P and N into the water. After water diversion, these values increased to 6.88 × 10⁻⁴ mg/L and 2.73 × 10⁻² mg/L, respectively. Notably, this increasing trend will not be terminated with the gradual normalization of water diversion works in the middle route of the SNWD Project. The Danjiangkou Reservoir management department has taken many effective measures to increase water storage; the water level is far from the normal high water level of 170 m. Thus, the flooded area will be further enlarged when the second phase of the water diversion project is completed. By this time, more arable land with a high background of N and P will be submerged, and more frequent and more extensive hydrological processes will release more N and P from the WLFZ soil to the water, which will further lead to the deterioration of the quality of local water bodies and the sustainable water diversion. Though the total amounts of N and P released from WLFZ soil to overlying water were estimated to contribute approximately 13% and 7% of the water quality monitoring content, respectively, which absented the consideration of flow disturbance and surface runoff, their values are more likely to be enriched in local inactive water bodies such as bays. In reservoir operation, the work of meteorological and hydrological prediction should be strengthened to rationally allocate the water resources of reservoirs, avoid exploding rise or sharp fall of water level, and reduce the frequency of alternative drying-wetting in the WLFZ. Ecological migration and optimization of land use structure are available measures to lessen the allochthonous nutrients entering the WLFZ, ensure water quality in the Danjiangkou Reservoir and the sustainability of the SNWD Project.
6. Conclusions
This work provides a novel perspective from which tracking the characteristics of the WLFZ and provides a new approach to estimating the effects of N and P released from WLFZ soil to water in space. Long time series and multi-source satellite images are the cost-effective data source that can completely capture the dynamic process of the WLFZ. A 17-year dynamic process of the WLFZ in the Danjiangkou Reservoir has been established, from which significant seasonal changes and inter-annual variability have been revealed. Three indices that reflect the hydrological characteristics of the geographical cell in the WLFZ were proposed and applied to Danjiangkou Reservoir. The comprehensive map of the temporal and spatial nitrogen (N) and phosphorus (P) release characteristics of the Danjiangkou Reservoir WLFZ is presented. The results indicate the area of inundation showed an increasing trend from 2000 to 2016, and this trend was closely associated with the water storage increase of the SNWD. After water diversion, the coming time of inundation extremum was nearly delayed by one month during the year and the area submerged over six months increased by 75.1% within the WLFZ. The release amounts of P and N reached 6.0 tons and 196.9 tons, respectively, per year before 2014, and increased to 7.6 tons and 301.2 tons, respectively, after 2014. Without considering the influence of flow disturbance, surface runoff and plant decay, the total amounts of N and P released from WLFZ soil to overlying water were estimated to contribute approximately 11% of the water quality monitoring content. Efforts are currently underway to examine the effects of plant decay on water quality in the context of the dynamic processes of the Danjiangkou Reservoir WLFZ elucidated in this study.
Acknowledgments
This research was financially supported by the Collaborative Innovation Center for Major Ecological Security Issues of Jiangxi Province and Monitoring Implementation (JXS-EW-08) and the Hubei Chenguang Talented Youth Development Foundation (HBCG).
Author Contributions
Hai Liu designed the research and revised the paper. Jie Yin analyzed the data and wrote the paper. Xiaolin Chen provided direction to the research work. All authors have read and approved the final manuscript.
Conflicts of Interest
The authors declare no conflicts of interest.
References
- White, M.; Xenopoulos, M.; Hogsden, K.; Metcalfe, R.; Dillon, P. Natural lake level fluctuation and associated concordance with water quality and aquatic communities within small lakes of the Laurentian Great Lakes region. Hydrobiologia 2008, 613, 21–31. [Google Scholar] [CrossRef]
- Mpelasoka, F.; Hennessy, K.; Jones, R.; Bates, B. Comparison of suitable drought indices for climate change impacts assessment over Australia towards resource management. Int. J. Climatol. 2008, 28, 1283–1292. [Google Scholar] [CrossRef]
- Naiman, R.J.; Decamps, H. The ecology of interfaces: Riparian zones. Ann. Rev. Ecol. Syst. 1997, 28, 621–658. [Google Scholar] [CrossRef]
- Li, S.; Xia, X.; Tan, X.; Zhang, Q. Effects of catchment and riparian landscape setting on water chemistry and seasonal evolution of water quality in the upper Han river basin, China. PLoS ONE 2013, 8, e53163. [Google Scholar] [CrossRef] [PubMed]
- Klemas, V. Remote sensing of riparian and wetland buffers: An overview. J. Coast. Res. 2014, 30, 869–880. [Google Scholar] [CrossRef]
- Cheng, R.; Wang, X.; Xiao, W.; Guo, Q. Advances in studies on water-level-fluctuation zone. Sci. Silvae Sin. 2010, 46, 111–119. [Google Scholar]
- Ye, C.; Li, S.; Zhang, Y.; Zhang, Q. Assessing soil heavy metal pollution in the water-level-fluctuation zone of the Three Gorges Reservoir, China. J. Hazard. Mater. 2011, 191, 366–372. [Google Scholar] [CrossRef] [PubMed]
- Liu, J.; Zeng, B.; Lin, F.; Ayi, Q. Effects of water level regulation on the seed germination and production of annual plant xanthium sibiricum in the water-level-fluctuating-zone of Three Gorges Reservoir. Sci. Rep. 2017, 7, 5056. [Google Scholar] [CrossRef] [PubMed]
- Wang, T.; Liu, J.; Xu, S.; Qin, G.; Sun, Y.; Wang, F. Spatial distribution, adsorption/release characteristics, and environment influence of phosphorus on sediments in reservoir. Water 2017, 9, 724. [Google Scholar] [CrossRef]
- Fu, B.; Li, Y.; Wang, Y.; Campbell, A.; Zhang, B.; Yin, S.; Zhu, H.; Xing, Z.; Jin, X. Evaluation of riparian condition of Songhua river by integration of remote sensing and field measurements. Sci. Rep. 2017, 7, 2565. [Google Scholar] [CrossRef] [PubMed]
- Sun, W.; Du, B.; Zhao, X.; He, B. Fractions and adsorption characteristics of phosphorus on sediments and soils in water level fluctuating zone of the Pengxi river, a tributary of the Three Gorges Reservoir. Environ. Sci. 2013, 34, 1107–1113. [Google Scholar]
- Leigh, C.; Burford, M.A.; Roberts, D.T.; Udy, J.W. Predicting the vulnerability of reservoirs to poor water quality and cyanobacterial blooms. Water Res. 2010, 44, 4487–4496. [Google Scholar] [CrossRef] [PubMed]
- Yuan, S.; Zeng, B.; Su, X.; Xu, J. Effect of water-level fluctuation discrepancy on the composition of different annuals in Three Gorges Reservoir drawdown zone. Acta Ecol. Sin. 2014, 34, 6481–6488. [Google Scholar]
- Wang, Y.; Liu, Y.; Liu, S.; Huang, H. Vegetation reconstruction in the water-level-fluctuation zone of the Three Gorges Reservoir. Chin. Bull. Bot. 2005, 22, 513–522. [Google Scholar]
- Stutter, M.I.; Chardon, W.J.; Kronvang, B. Riparian buffer strips as a multifunctional management tool in agricultural landscapes: Introduction. J. Environ. Qual. 2012, 41, 297–303. [Google Scholar] [CrossRef] [PubMed]
- Tomer, M.D.; Dosskey, M.G.; Burkart, M.R.; James, D.E.; Helmers, M.J.; Eisenhauer, D.E. Methods to prioritize placement of riparian buffers for improved water quality. Agrofor. Syst. 2009, 75, 17–25. [Google Scholar] [CrossRef]
- Ruban, V.; Brigault, S.; Demare, D.; Philippe, A.-M. An investigation of the origin and mobility of phosphorus in freshwater sedimments from Bort-Les-Orgues reservoir, france. J. Environ. Monit. 1999, 1, 403–407. [Google Scholar] [CrossRef] [PubMed]
- Johansen, K.; Arroyo, L.A.; Armston, J.; Phinn, S.; Witte, C. Mapping riparian condition indicators in a sub-tropical Savanna environment from discrete return LiDAR data using object-based image analysis. Ecol. Indic. 2010, 10, 796–807. [Google Scholar] [CrossRef]
- Lv, M.; Wu, S.; Chen, C.; Jiang, Y.; Wen, Z.; Chen, J.; Wang, Y.; Wang, X.; Huang, P. A review of studies on water level fluctuating zone (WLFZ) of the Three Gorges Reservoir (TGR) based on bibliometric perspective. Acta Ecol. Sin. 2015, 35. [Google Scholar] [CrossRef]
- Han, B. Reservoir ecology and limnology in China: A retrospective comment. J. Lake Sci. 2010, 22, 151–160. [Google Scholar]
- Tan, S.; Wang, Y.; Zhang, Q. Environmental challenges and countermeasures of the water-level-fluctuation zone (wlfz) of the Three Gorges Reservoir. Resour. Environ. Yangtze Basin 2008, 17, 101–105. [Google Scholar]
- Li, S.; Cheng, X.; Xu, Z.; Han, H.; Zhang, Q. Spatial and temporal patterns of the water quality in the Danjiangkoureservoir, China. Hydrol. Sci. J. 2009, 54, 124–134. [Google Scholar] [CrossRef]
- Li, W.; Zeng, Y.; Zhang, L.; Yin, K.; Yuan, C.; Wu, B. The spatial pattern of land cover in the drawdown area of Danjiangkou reservoir. Remote Sens. Land Resour. 2011, 91, 108–114. [Google Scholar]
- Zhang, B.; Chen, Y. Nitrogen forms and their distribution characteristics in the soils of water; level; fluctuation zone in the central Three Gorges Reservoir. Acta Sci. Circum Stant. 2012, 32, 1126. [Google Scholar]
- Yin, W.; Zhu, D.; Lei, J.; Jia, H.; Zeng, Z. Distribution of nitrogen, phospthorus in the soils of different land uses from the representive water-level-fluctuating zone of Danjiangkou Reservoir. Resour. Environ. Yangtze Basin 2015, 224, 1185–1191. [Google Scholar]
- Crétaux, J.-F.; Biancamaria, S.; Arsen, A.; Bergé-Nguyen, M.; Becker, M. Global surveys of reservoirs and lakes from satellites and regional application to the Syrdarya river basin. Environ. Res. Lett. 2015, 10, 015002. [Google Scholar] [CrossRef]
- Feng, L.; Hu, C.; Chen, X.; Cai, X.; Tian, L.; Gan, W. Assessment of inundation changes of Poyang lake using modis observations between 2000 and 2010. Remote Sens. Environ. 2012, 121, 80–92. [Google Scholar] [CrossRef]
- Yamazaki, D.; Trigg, M.A.; Ikeshima, D. Development of a global ~90 m water body map using multi-temporal landsat images. Remote Sens. Environ. 2015, 171, 337–351. [Google Scholar] [CrossRef] [Green Version]
- Feyisa, G.L.; Meilby, H.; Fensholt, R.; Proud, S.R. Automated water extraction index: A new technique for surface watemapping using Landsat imagery. Remote Sens. Environ. 2014, 140, 23–35. [Google Scholar] [CrossRef]
- Tang, Q.; Bao, Y.; He, X.; Zhou, H.; Cao, Z.; Gao, P.; Zhong, R.; Hu, Y.; Zhang, X. Sedimentation and associated trace metal enrichment in the riparian zone of the Three Gorges Reservoir, China. Sci. Total Environ. 2014, 479, 258–266. [Google Scholar] [CrossRef] [PubMed]
- Shu, X.; Zhang, K.; Zhang, Q.; Wang, W. Response of soil physico-chemical properties to restoration approaches and submergence in the water level fluctuation zone of the Danjiangkou reservoir, China. Ecotoxicol. Environ. Saf. 2017, 145, 119–125. [Google Scholar] [CrossRef] [PubMed]
- Zeng, Z.; Lei, P.; Zhang, H.; Shan, B.; Ye, Y. Nitrogen and phosphorus fractions and releasing characteristics of the soilsfrom the representative water-level-fluctuating zone of Danjiangkou reservoir. Acta Sci. Circumst. 2015, 35, 1383–1392. [Google Scholar]
- Song, C.; Huang, B.; Ke, L. Modeling and analysis of lake water storage changes on the Tibetan Plateau using multi-mission satellite data. Remote Sens. Environ. 2013, 135, 25–35. [Google Scholar] [CrossRef]
- Fowe, T.; Karambiri, H.; Paturel, J.-E.; Poussin, J.-C.; Cecchi, P. Water balance of small reservoirs in the Volta basin: A case study of Boura reservoir in Burkina Faso. Agric. Water Manag. 2015, 152, 99–109. [Google Scholar] [CrossRef]
- Liu, H.; Yin, J.; Chen, J.; Chen, X.L. Dynamic change and cause of water area in Danjingkou reservoir based on remote sensing image. Resour. Environ. Yangtze Basin 2016, 25, 1759–1766. [Google Scholar]
- Lu, S.; Wu, B.; Yan, N.; Wang, H. Water body mapping method with HJ-1A/B satellite imagery. Int. J. Appl. Earth Obs. Geoinform. 2011, 13, 428–434. [Google Scholar] [CrossRef]
- Park, J.; Jeong, H.J.; Du Yoo, Y.; Yoon, E.Y. Mixotrophic dinoflagellate red tides in Korean waters: Distribution andecophysiology. Harmful Algae 2013, 30, S28–S40. [Google Scholar] [CrossRef]
- Liu, Y.; Zhu, Y.; Qiao, X.; Zheng, B.; Chang, S.; Fu, Q. Investigation of nitrogen and phosphorus contents in water in the tributaries of Danjiangkou reservoir. R. Soc. Open Sci. 2018, 5, 170624. [Google Scholar] [CrossRef] [PubMed]
Figure 1.
Location map of the Danjiangkou Reservoir and the middle route of South-North Diversion Project (SNDW).
Figure 1.
Location map of the Danjiangkou Reservoir and the middle route of South-North Diversion Project (SNDW).

Figure 2.
Reservoir WLFZ map.

Figure 3.
The long time sequence results of remote-sensing monitoring of the inundation area in the Danjiangkou Reservoir WLFZ (the results of non-flooded area are presented in the upper area with vertical stripes inside the figure).
Figure 3.
The long time sequence results of remote-sensing monitoring of the inundation area in the Danjiangkou Reservoir WLFZ (the results of non-flooded area are presented in the upper area with vertical stripes inside the figure).

Figure 4.
The monthly average area of inundation and non-flooded areas of the Danjiangkou Reservoir WLFZ before the water diversion and after the water diversion.
Figure 4.
The monthly average area of inundation and non-flooded areas of the Danjiangkou Reservoir WLFZ before the water diversion and after the water diversion.

Figure 5.
Map of the probability of inundation () before water diversion and after water diversion. (a) before water diversion (b) after water diversion.
Figure 5.
Map of the probability of inundation () before water diversion and after water diversion. (a) before water diversion (b) after water diversion.

Figure 6.
Map of alternating drying-wetting frequency (C) before water diversion and after water diversion. (a) before water diversion (b) after water diversion.
Figure 6.
Map of alternating drying-wetting frequency (C) before water diversion and after water diversion. (a) before water diversion (b) after water diversion.


Figure 7.
Spatial distribution of inundation time in the Danjiangkou Reservoir. (a) before water diversion (b) after water diversion.
Figure 7.
Spatial distribution of inundation time in the Danjiangkou Reservoir. (a) before water diversion (b) after water diversion.

Figure 8.
Spatial distribution of phosphorus release in the Danjiangkou Reservoir WLFZ soil. (a) before water diversion (b) after water diversion.
Figure 8.
Spatial distribution of phosphorus release in the Danjiangkou Reservoir WLFZ soil. (a) before water diversion (b) after water diversion.

Figure 9.
Spatial distribution of nitrogen release in the Danjiangkou Reservoir WLFZ soil. (a) before water diversion (b) after water diversion.
Figure 9.
Spatial distribution of nitrogen release in the Danjiangkou Reservoir WLFZ soil. (a) before water diversion (b) after water diversion.


Figure 10.
The Areas of soil units with different N and P annual efflux in the WLFZ. (a) phosphorus (b) nitrogen.
Figure 10.
The Areas of soil units with different N and P annual efflux in the WLFZ. (a) phosphorus (b) nitrogen.


Table 1.
Danjiangkou Reservoir water level parameters during management (meters).
| Dead Water Level | Normal Water Level | Highest Water Level | Lowest Water Level | Flood Limit Water Level | ||
|---|---|---|---|---|---|---|
| Summer | Autumn | |||||
| Before the dam-heightening stage (2000–2013) | 139.00 | 157.00 | 157.20 * (6 December 2011) | 134.70 * (20 May 2011) | ≤149.00 | ≤152.50 |
| After the dam-heightening stage (2014–2016) | 150.00 | 170.00 | 160.72 * (1 November 2014) | 136.51 * (11 April 2014) | ≤160.00 | ≤163.50 |
* The historically highest and lowest water level data was retrieved from the Hubei Province water information system “Clairvoyance”.
Table 2.
Data composition, uses and sources.
| Component | Application | Source | Description | |
|---|---|---|---|---|
| Remote sensing data | Landsat 5 TM 32, 7 ETM+ 83, 8 OLI 15, HJ-1A 49 HJ-1B 6 | Obtaining the water level dynamics in Danjiangkou Reservoir | http://www.gscloud.cn/ http://www.cresda.com/ | The loss of ETM+ sensing image is repaired by gap mask; projection reference is WGS84_UTM_zone_49N |
| Land cover/use data | Land cover/use data in 2006 and 2015 in WLFZ | Analyzing the N and P released in alternating dry–wet conditions | Interpretation according to different objects | Obtaining remote-sensing images at a low water level; the types of land cover/use include plow, garden, forest, grassland, desert land, tidal flat, construction land |
| Soil data | The world soil database | Analyzing the N and P release in the reservoir | Harmonized World Soil Database (HWSD) v1.1 | The spatial resolution is 1 km; released by the United Nations Food and Agriculture Organization (FAO) |
| elevation data | Reservoir SRTM DEM | Analyzing the range of reservoir’s characteristic water level | http://www.gscloud.cn/ | The spatial resolution is 90 m, acquired in February 2000, during a historically low water level |
Table 3.
The N and P background contents for different land use/covers in the Danjiangkou Reservoir WLFZ [25].
Table 3.
The N and P background contents for different land use/covers in the Danjiangkou Reservoir WLFZ [25].
| Flood Land | Wild Grassland | Plow | Garden | Forest | |
|---|---|---|---|---|---|
| Total phosphorus (TP) * | 372. 0 | 494.8 | 820.9 | 765.1 | 518.4 |
| Total nitrogen (TN) * | 545.3 | 668.7 | 723.0 | 932.1 | 674.5 |
* The depth of soil sample collection is 0–20 cm and the unit in the table is mg/kg.
© 2018 by the authors. Licensee MDPI, Basel, Switzerland. This article is an open access article distributed under the terms and conditions of the Creative Commons Attribution (CC BY) license (http://creativecommons.org/licenses/by/4.0/).
Share and Cite
MDPI and ACS Style
Yin, J.; Liu, H.; Chen, X. Dynamic Change in the Water-Level Fluctuation Zone of the Danjiangkou Reservoir and Its Influence on Water Quality. Sustainability 2018, 10, 1025. https://0-doi-org.brum.beds.ac.uk/10.3390/su10041025
AMA Style
Yin J, Liu H, Chen X. Dynamic Change in the Water-Level Fluctuation Zone of the Danjiangkou Reservoir and Its Influence on Water Quality. Sustainability. 2018; 10(4):1025. https://0-doi-org.brum.beds.ac.uk/10.3390/su10041025
Chicago/Turabian StyleYin, Jie, Hai Liu, and Xiaoling Chen. 2018. "Dynamic Change in the Water-Level Fluctuation Zone of the Danjiangkou Reservoir and Its Influence on Water Quality" Sustainability 10, no. 4: 1025. https://0-doi-org.brum.beds.ac.uk/10.3390/su10041025
Note that from the first issue of 2016, this journal uses article numbers instead of page numbers. See further details here.