Article

Shortcut Biological Nitrogen Removal (SBNR) in an MFC Anode Chamber under Microaerobic Conditions: The Effect of C/N Ratio and Kinetic Study

Department of Chemical Engineering Materials & Environment, Sapienza University of Rome, Via Eudossiana 18, 00184 Rome, Italy
*
Author to whom correspondence should be addressed.
Sustainability 2018, 10(4), 1062; https://0-doi-org.brum.beds.ac.uk/10.3390/su10041062
Submission received: 2 March 2018 / Revised: 20 March 2018 / Accepted: 2 April 2018 / Published: 3 April 2018

Abstract

:
In this work, the feasibility of the Shortcut Biological Nitrogen Removal (SBNR) in the anodic chamber of a Microbial Fuel Cell (MFC) was investigated. Thirty day experiments were carried out using synthetic wastewaters with a Total Organic Carbon vs. nitrogen ratio (TOC/N) ranging from 0.1 to 1. Ammonium, nitrite, nitrate, pH, and TOC were daily monitored. Results showed that microaerobic conditions in the anodic chamber favored the development of nitritation reaction, due to oxygen transfer from the cathodic chamber through the membrane. Nitritation was found to depend on TOC/N ratio: at TOC/N equal to 0.1 an ammonium removal efficiency of up to 76% was observed. Once the oxygen supply to the cathodic chamber was stopped, denitritation occurred, favored by an increase of the TOC/N ratio: a nitrite removal of 80.3% was achieved at TOC/N equal to 0.75. The presence of nitrogen species strongly affected the potential of the electrochemical system: in the nitritation step, the Open Circuit Voltage (OCV) decreased from 180 mV to 21 mV with the decrease of the TOC/N ratio in the investigated range. Lower OCV values were observed in the denitritation steps since the organic carbon acted as the energy source for the conversion of nitrite to nitrogen gas. A kinetic analysis was also performed. Monod and Blackman models described the ammonium and the organic carbon removal processes well during the nitritation step, respectively, while Blackman-Blackman fitted experimental results of the denitritation step better.

Graphical Abstract

1. Introduction

Nitrogen rich wastewaters are generated by several industrial and agricultural activities, as well, ammonium is one of the major pollutants in domestic wastewater. The uncontrolled release of such wastewater may favor eutrophication in rivers and lakes, and ammonium is also a strong pollutant in aquatic ecosystems [1]. For this reason, the amount of ammonium discharged into the environment is limited by European Directive [2]. Nitrogen removal from wastewater is generally carried out through biological processes, called Biological Nutrient Removal (BNR), by a specific microbial pool [3]. The BNR process is characterized by two steps: ammonium oxidation (nitrification) followed by nitrogen gas development by nitrate reduction (denitrification). Nitrification, in turn, is carried out in two steps: ammonia is first converted into nitrite by Ammonia Oxidizing Bacteria (AOB, Equation (1)) and then nitrite is converted in nitrate by Nitrite Oxidizing Bacteria (NOB, Equation (2)) [4]. In both reactions, the oxygen is the electron acceptor:
N H 4 + +   3 / 2   O 2 N O 2 +   H 2 O + 2 H +
N O 2 +   1 / 2   O 2 N O 3
The nitrogen cycle ends with the denitrification step, by reductive reaction pathway (Equations (3) and (4)) [5]. In this case, organic matter is the energy source for denitrifying bacteria.
N O 3 +   2   e +   2 H + N O 2 +   H 2 O
N O 2 +   3   e +   4 H + 1 / 2 N 2   + H 2 O
Since nitrification and denitrification are developed under aerobic and anaerobic conditions, respectively, these processes are usually performed in two different reactor systems [6]. However it has been reported that simultaneous nitrification and denitrification (SND) can be achieved in the presence of heterotrophic bacteria [7]. Nowadays, several studies have been developed in order to improve and optimize the nitrogen removal process.
Nitrogen removal has been successfully obtained by the Anammox process: under anoxic condition, the ammonia is firstly oxidized to nitrite by autotrophic Anammox microorganisms, and then nitrite is used as an electron acceptor for the nitrogen gas production. The overall stoichiometry of the Anammox process can be described by the following Equation [8]:
N H 4 + +   1.146   N O 2 +   0.071   H C O 3 +   0.057   H + 0.986   N 2 +   0.161   N O 3 +   0.071   C H 1.74 O 0.31 N 0.20 +   2.002   H 2 O .
In this equation, CH1.74O0.31N0.20 represents the biomass elemental composition. This process has been proposed as an alternative to conventional treatment, but the difficulty of Anammox bacteria acclimation limits Anammox process applicability to wastewater treatment [9].
In recent years, the Shortcut Biological Nitrogen Removal (SBNR) has been proposed and experimentally tested as an alternative to conventional SND, with the objective to bypass nitrate formation and to directly convert nitrite in to nitrogen gas [10]. The shortcut pathway is characterized by a nitritation step that is the partial ammonia oxidation to nitrite according to Equation (1) and a denitritation step that is the production of nitrogen gas through the reduction reaction of nitrite accumulated in the first step according to Equation (4) [11]. This process presents several advantages with respect the conventional BNR, including lower oxygen demand, lower carbon source request, and short retention times [4].
The treatment of wastewater with a low TOC/N ratio still represents a challenge for industrial wastewater treatment plant. Conventional biological processes, such as Anaerobic Digestion (AD), are generally unsuitable to complete the nitrogen cycle due to the inhibition of microorganisms involved in the treatment [12]. For this reason, effluents from AD are usually rich in ammonium up to 2 kgN/m3 [13].
Bioelectrochemical systems (BES) represent an alternative cross link between biological wastewater treatment and the advantage of producing energy [14]. Generally the combination of AD-BES technologies leads to the recovery of organic carbon still present in wastewater end-off AD and the production of adding-value by-products such as bioalcohols [15].
Microbial Fuel Cell (MFC) is a BES in which chemical energy is converted in electrical energy [16] by means of electrogenic bacteria [17]. An MFC is composed by two chambers (anodic and cathodic) separated by a specific cationic or protonic exchange membrane [18]. In the anodic chamber, microorganisms oxidize the organic carbon producing electrons and protons [19]. The electrons are transferred to the cathode through an external circuit [20] while the protons cross the membrane and close the electrical circuit [21]. To perform reduction reactions in optimal condition, the cathodic chamber is aerated by using an air supply [22].
Simultaneous organic and nitrogen removal in MFCs has been already widely investigated [23,24] and different configuration were proposed: ammonia can be oxidized in an external aerated system and then nitrate was reduced into nitrogen gas in the cathodic compartment [25]; nitrification and denitrification were developed in an aerated bio-cathode in which ammonia was oxidized, by the oxygen supply, and the nitrate was the electron acceptor of the cathodic compartment [26].
Based on this the simultaneous nitrification/denitrification was enhanced by using an intermittent aerated cathode for the establishment of a suitable nitrifying and denitrifying microbial consortium [27].
It was found that using a cationic exchange membrane diffusion phenomena involving the ion species can occur. In particular, ammonium can move from the anode to the cathode [26] while nitrite and nitrate move in the opposite direction. In this last case, the removal of nitrite and nitrate can be obtained by electrochemically active bacteria (EAB) that are able to provide the electrons for the reduction reaction [28].
In the present study, the nitritation and denitritation processes via nitrite accumulation in the anodic chamber were investigated in the treatment of a nitrogen-rich wastewater, in order to prevent the nitrite accumulation and to achieve denitritation by the coexistence of AOB and heterotrophic denitrifying bacteria [29].
The novelty of this work is that nitritation and denitritation steps occurred in the same compartment via the SBNR pathway, thus avoiding wastewater recirculation. In our work, microaerobic conditions during the nitritation step were obtained by oxygen diffusion from the aerated cathodic chamber through the cationic exchange membrane. Conversely, the stop of the air supply in the cathodic chamber [30] ensured the anaerobic condition in the anodic chamber to allow the development of the denitritation step.
It is worth noting that the studies mentioned above (and several others about this topic) dealt with lower nitrogen/carbon ratios with respect to those adopted in this work [31].
In fact, the TOC/N ratio plays an important role in this process. Low values of this ratio enhance ammonium conversion and nitrite accumulation, while a positive influence of high TOC concentration is expected during the denitritation, when the presence of organic carbon as the electron donor for nitrite reduction is required.
A kinetic study was then carried out in order to identify the kinetic parameters describing nitritation and denitritation steps: Monod, Blackman, and Tessier kinetics were considered to model the microorganism’s specific growth rate.

2. Materials and Methods

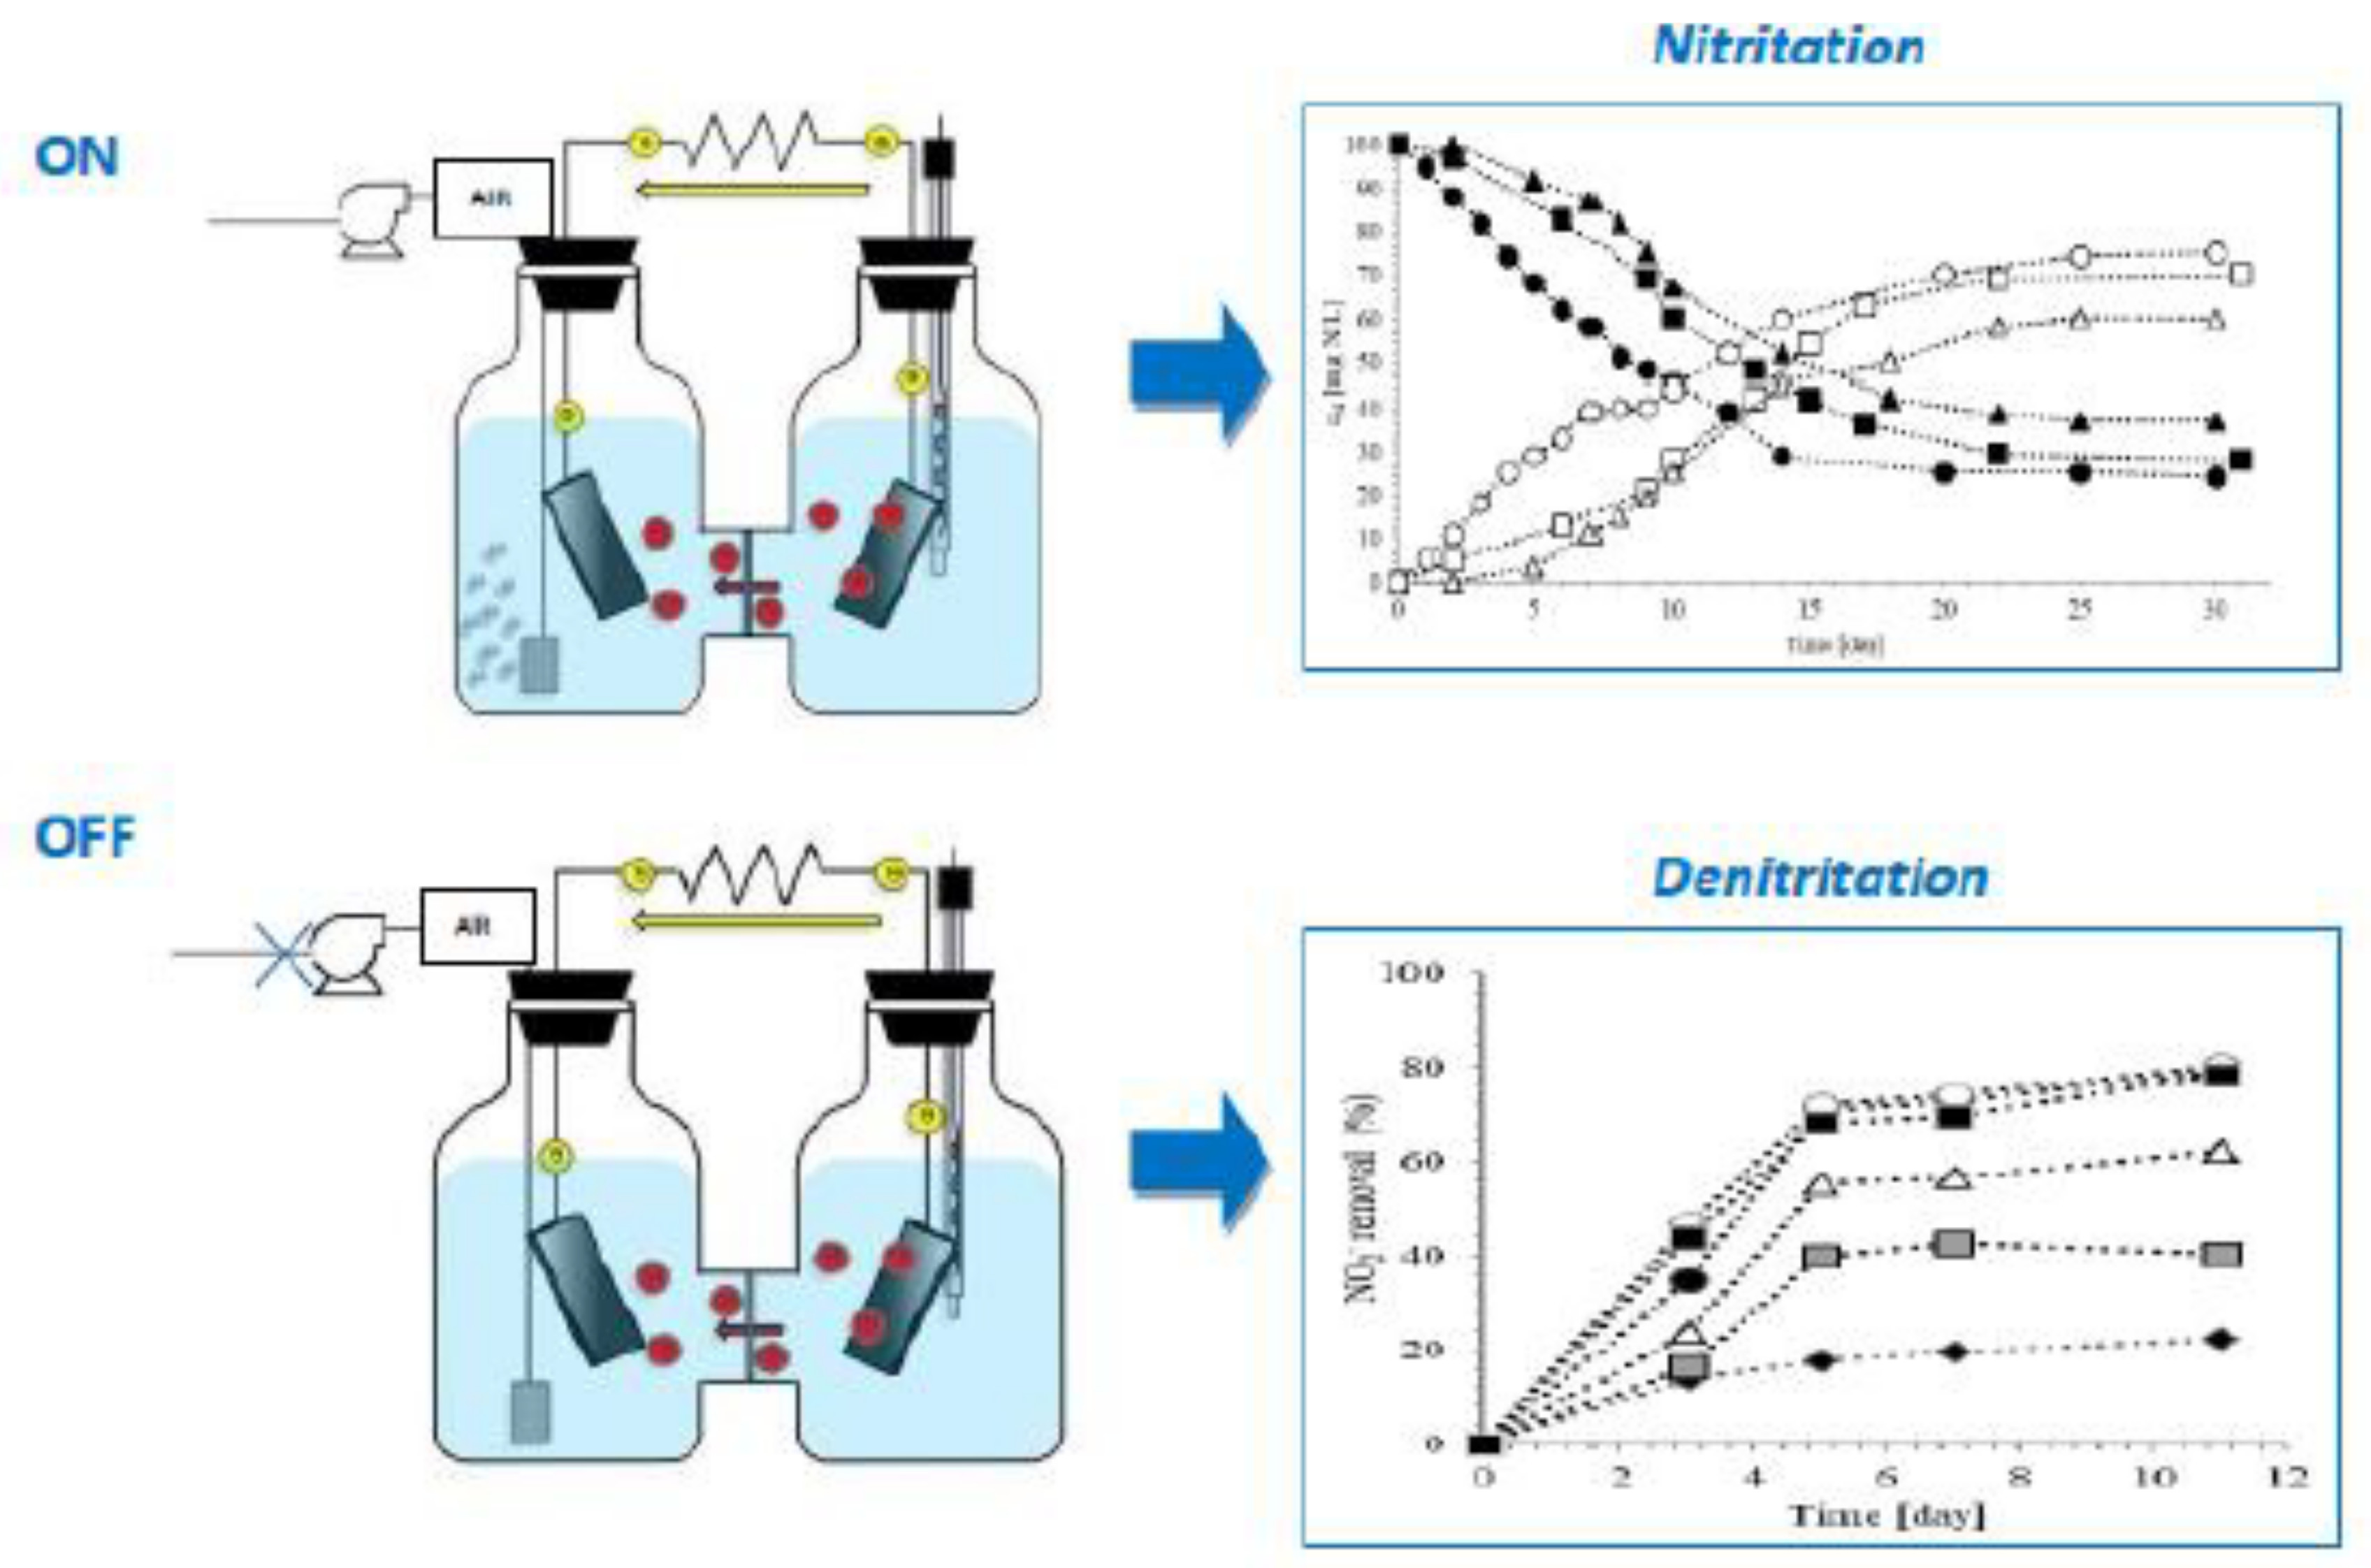
2.1. Microbial Fuel Cell Set-Up

H-type MFC was used to perform the experimental tests (Figure S1a). This system was constituted by two 300 mL pyrex glass chambers, divided by a cationic exchange membrane (Ultrex-CMI 7000-Membranes International, Ringwood, NJ, USA) and equipped with carbon paper electrodes (12.5 cm2; Goodfellow Cambridge Limited, Huntingdon, UK, LS366112 SJP Carbon Foil). The electrodes were connected to a resistor (2034 Ω) by means of a titanium wire. The cathodic chamber was provided with an air diffusion system. A reference electrode (Crison Ag/AgCl) was placed in the anodic chamber.
Batch tests were performed to establish the optimal parameters for the nitrogen cycle development: synthetic wastewaters were prepared by dissolving sodium acetate as carbon source and ammonium sulfate and sodium nitrite as nitrogen source in a 50 mM phosphate buffer solution [32]. The supernatant of a digestate from the treatment of cattle manure and agricultural wastes was used as inoculum. For the nitritation tests the microorganisms were previously conditioned in an aerated reactor at high concentration of ammonium (up to 100 mgN/L) while the same microorganisms source was acclimated under anaerobic condition at high nitrite concentration (up to 540 mgN/L). The conditioning phase was crucial to reduce the start-up time: the solutions were fed in the anodic compartment and simultaneously the monitoring of the process in term of nitrogen species, TOC concentration and potential (see Section 2.2) was performed. No addition or recirculation of solution was carried out.
H-type MFC was used in half-biotic modality: bacteria source was inoculated in the anodic chamber fed with the prepared wastewater, while in the cathodic chamber only the phosphate buffer solution was added.
Considering the opportunity of implementing MFC technology on the effluent of the anaerobic digestion generally characterized by low C/N ratio [33], the effect of different TOC/N ratio was investigated. In the first series of tests (from N1 to N4) the nitritation step and the optimum condition for the nitrite accumulation were investigated. The second series (from D1 to D6) concerned the denitritation step and the influence of TOC/N ratio on nitrite removal yield was studied (Figure S1b).
The operating conditions are reported in Table 1.

2.2. Measurement

Organic carbon (Total Organic Carbon analyzer TOC-L Shimadzu) and pH (Crison GLP21) were daily monitored. Open Circuit Voltage (OCV) was recorded using a multimeter (FLUKE 87): as reference electrode (Ag/AgCl) was used to evaluate the potential of the electrode (anode or cathode) without passage of current (open circuit). Ammonium content was determined by distillation method (VelpScientifica UDK 139). Nitrite and nitrate species were measured by ion chromatography (Dionex ICS 1100 Thermo Scientific, Waltham, MA, USA). Dissolved oxygen in anodic solution was measured using Oximeter Seven GO (Mettler Toledo, Columbus, OH, USA).

2.3. Kinetic of Nitritation and Denitritation

The objective of this work was also to estimate the kinetic parameters that well describe nitritation and denitritation steps developed in an MFC system. According to literature [34] the substrate consumption rate in the anodic chamber is tightly dependent to substrate concentration, active biomass and it can be described by the following equation:
d S / d t =   ( X / Y ) μ
where S is nitrogen or carbon concentration expressed in mg/L, t is the time (d), X is the biomass concentration in term of Volatile Suspended Solids (mg VSS/L), Y is the stoichiometric biomass growth yield related to nitrogen species (mg VSS/mg N) or organic carbon species (mg VSS/mg TOC) and µ is the overall specific growth rate. In order to simplify the numerical analysis of each test, X/Y and µ were expressed by a general factor µ* (mg/L d). The studied equation becomes:
d S / d t = μ * .
In this work, three different models were analyzed to explain µ*: Monod (Equation (8)) [35], Blackman (Equation (9)) [36], and Tessier (Equation (10)) [37].
μ * = μ * * S i / ( k i +   S i )
μ * = μ * * S i / ( 2 k i )  
μ * = μ * * ( 1 exp ( S i   / k i )
Two kinetic parameters can be estimated in such models: the reaction rate µ** (mg/Ld) and the substrate saturation constant ki (mg/L). In the nitritation step, ammonium removal and carbon removal can be analyzed as separate processes, while in the denitritation step a double function type model [38] was considered (Equation (11)) because both TOC and nitrite concentrations are included in the kinetic expression:
d S N O 2 / d t   =   μ T O C * μ N O 2 *
where µ*TOC and µ*NO2 can be expressed with one of the model considered. All possible expression of the Equation (11) are reported in Table S2. The differential equations were solved by the Runge-Kutta method, using a fixed step of 0.5 day: the fitting of the experimental data to model predictions was based on the minimum value of the objective function Φ.
Φ = i = 1   n ( y e x p , i y θ , i ) 2 / n
where y e x p , i is the experimental data, y θ , i is the predicted value of the mathematical model and n is the number of experimental data.

3. Results and Discussion

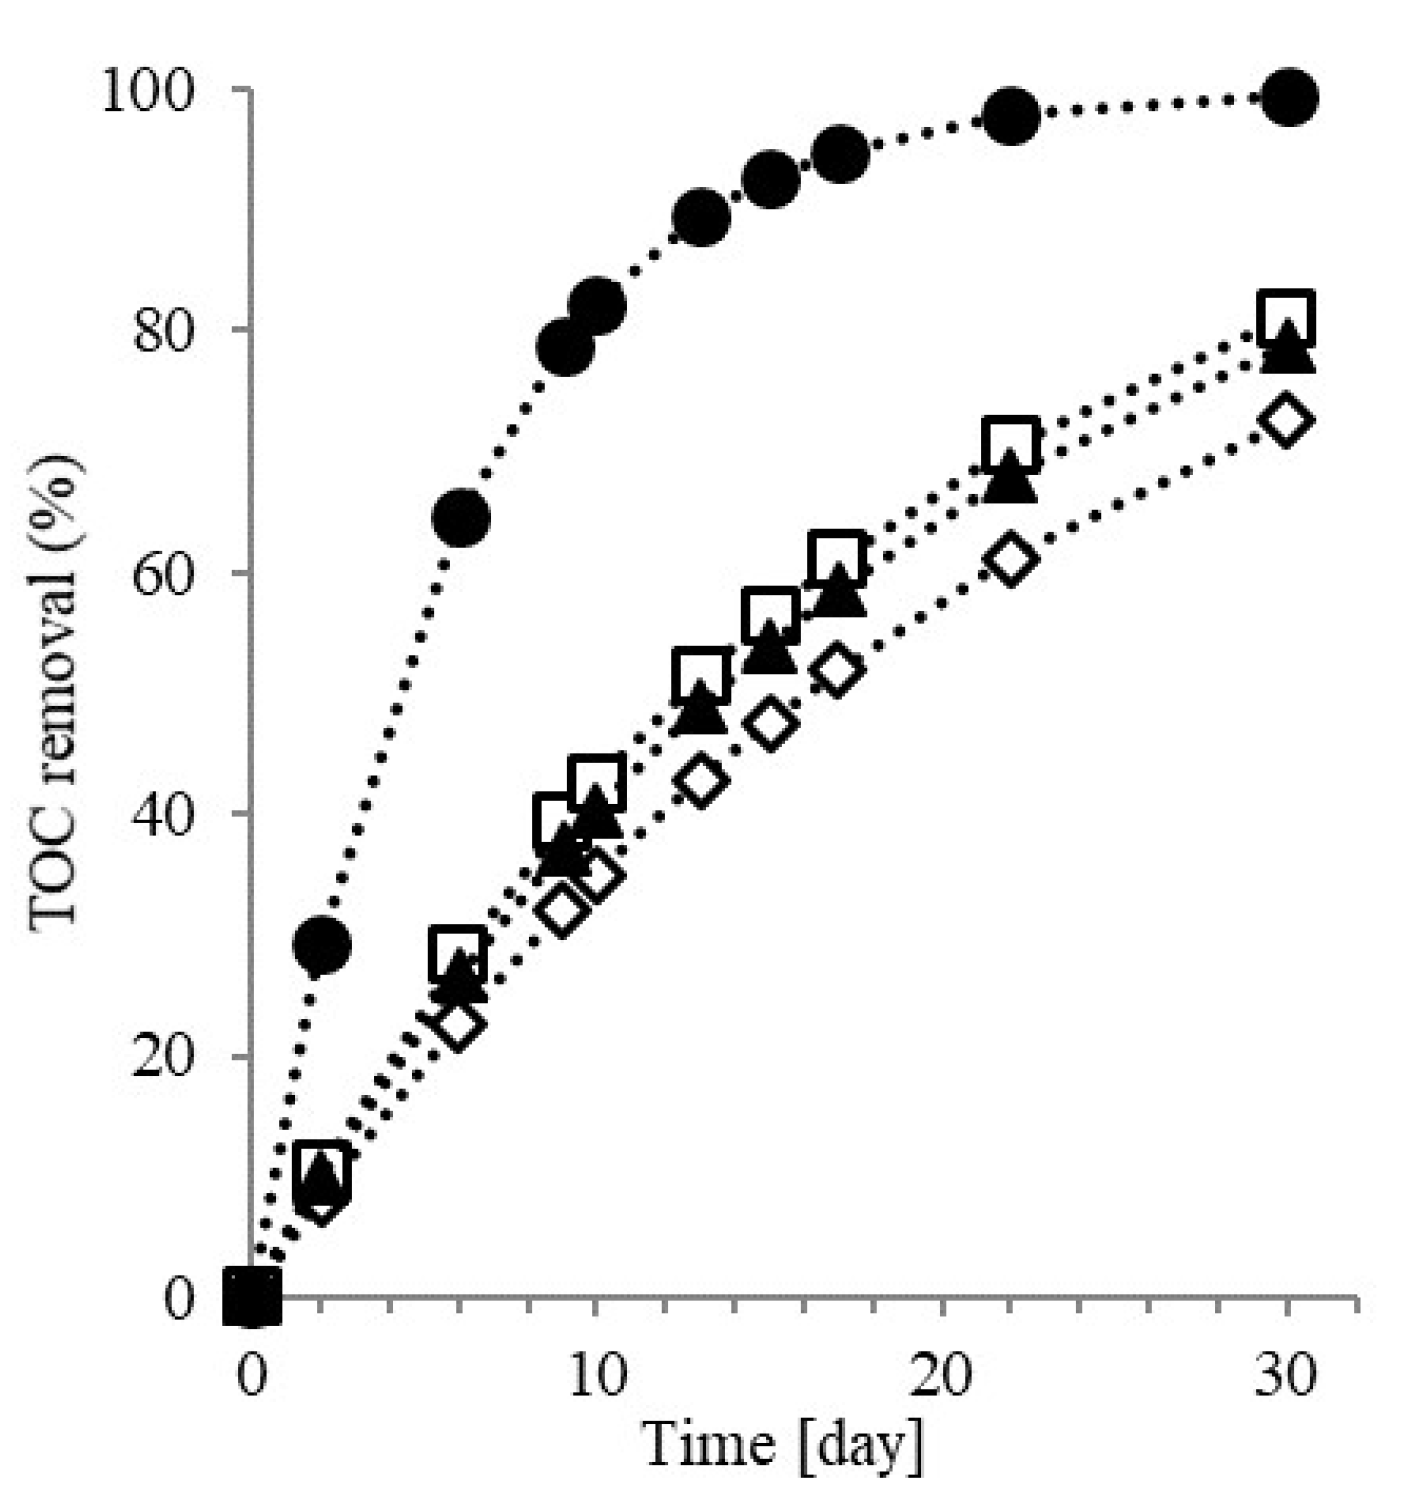
3.1. Nitritation Test

Table 2 shows the overall ammonium removal in tests at different TOC/N values. The nitritation step was found to strongly depend on TOC/N. In fact, in tests N1, N2, and N3 ammonium removal of 76%, 72% and 63% was achieved respectively, thus indicating that ammonium oxidation is favored when TOC/N was lower than 1. These results can be explained considering that at low concentration of organics the dissolved oxygen in the anodic chamber is available for the development of the ammonia oxidation.
Data in Figure 1, where daily concentration of nitrogen species during the tests is reported, also show that the accumulation of nitrite occurred without further oxidation to nitrate.
This suggests the establishment of a nitrifying microbial pool, favored by microaerobic conditions due to oxygen intrusion in the anodic compartment through the membrane [39,40]: in such tests, initial dissolved oxygen in the anodic chamber was about 0.4 mg/L.
The intersection point of curves in Figure 1, representing the equal molar concentration of nitrite and ammonium during the nitritation, was found to depend on the TOC/N ratio: in particular, in the test with the lower TOC/N ratio (test N1), this intersection point was reached after 10 days, while in tests N2 and N3 the equal molar concentration of ammonium and nitrite was observed after 14 days and 16 days, respectively.
According to these results, the Anammox process can be excluded. At the end of nitritation tests, both ammonium and nitrite concentration reached a plateau (after about 23 days) and no simultaneous ammonium and nitrite removal was observed until the end of the experiment. No ammonium losses through the membrane were observed: the concentration of this species in the cathodic chamber was always undetectable. In our case, anaerobic conditions in the anodic chamber, a necessary condition for the Anammox process, were not guaranteed as a consequence of oxygen losses through the separator. In test N4 (data not reported here), in the presence of a large excess of organic matter, neither removal of ammonium nor nitrite accumulation was observed and only TOC removal occurred. In fact, as shown in Figure 2, the 60% of TOC removal was obtained after 6 days in test N4 and the complete mineralization was reached after about 20 days. On the contrary, in the tests where nitritation occurred, the TOC removal trends were similar and only 80% of complete mineralization was found after 30 days.
This behavior can be explained considering a competition between ammonium and TOC removal processes in the anodic chamber: at high TOC values, only organic carbon oxidation occurred and microaerobic condition was not sufficient to promote the development of the nitritation reaction at the adopted operative condition.
To assess the electrical performances of the MFC, Open Circuit Voltage (OCV) was measured during the experiments. The sulfate ions effect was not evaluated in this study because no change in sulfate concentration was detected: ammonium sulfate was used as the ammonium source, even considering that sulfate can act as an electron shuttle from the cell to the electrode [41].
In Figure 3, the OCV values measured in the anodic chamber are reported. It can be seen that in all the tests a gradual increase of OCV was observed; it started with a linear growth phase and reached an almost constant value after 6–9 days of operation. This is typical of the potential trend in MFC [42]: the maximum value achieved depends on the organic carbon content. The maximum OCV values were 196 mV, 165 mV, 91 mV, and 21 mV for N4, N3, N2, and N1, respectively. In test N3, the stable OCV value was achieved after only 5 days due to the previous biofilm formation [43]. Although an increase of OCV maximum value with the increasing of organic carbon content was observed, there was no proportional correlation between these two parameters. In fact, the voltages recorded in tests N3 and N4 were slightly different, though the initial TOC of test N4 was an order of magnitude greater. Other authors indicated that an OCV value up to 500 mV is expected for a stacks MFC (30 Ω) with 31 mM of acetate solution [44]; in our case, 2600 mg/L of TOC (31 mM) resulted in an OCV corresponding to about 60% of such a theoretical value. In our system, the loss in electrical efficiency can be attributed not only to high internal resistance given by the selected PEM (333 ± 33 Ω load resistance) but also to the establishment of microaerobic conditions in the anodic chamber that promoted the oxidation of the organic matter at the highest TOC initial value. However, for the purpose of this work, a further reduction of oxygen concentration in the cell is not desirable, since a little oxygenation is required to favor nitritation.
In all the tests, a neutral pH condition was always maintained (data not shown).

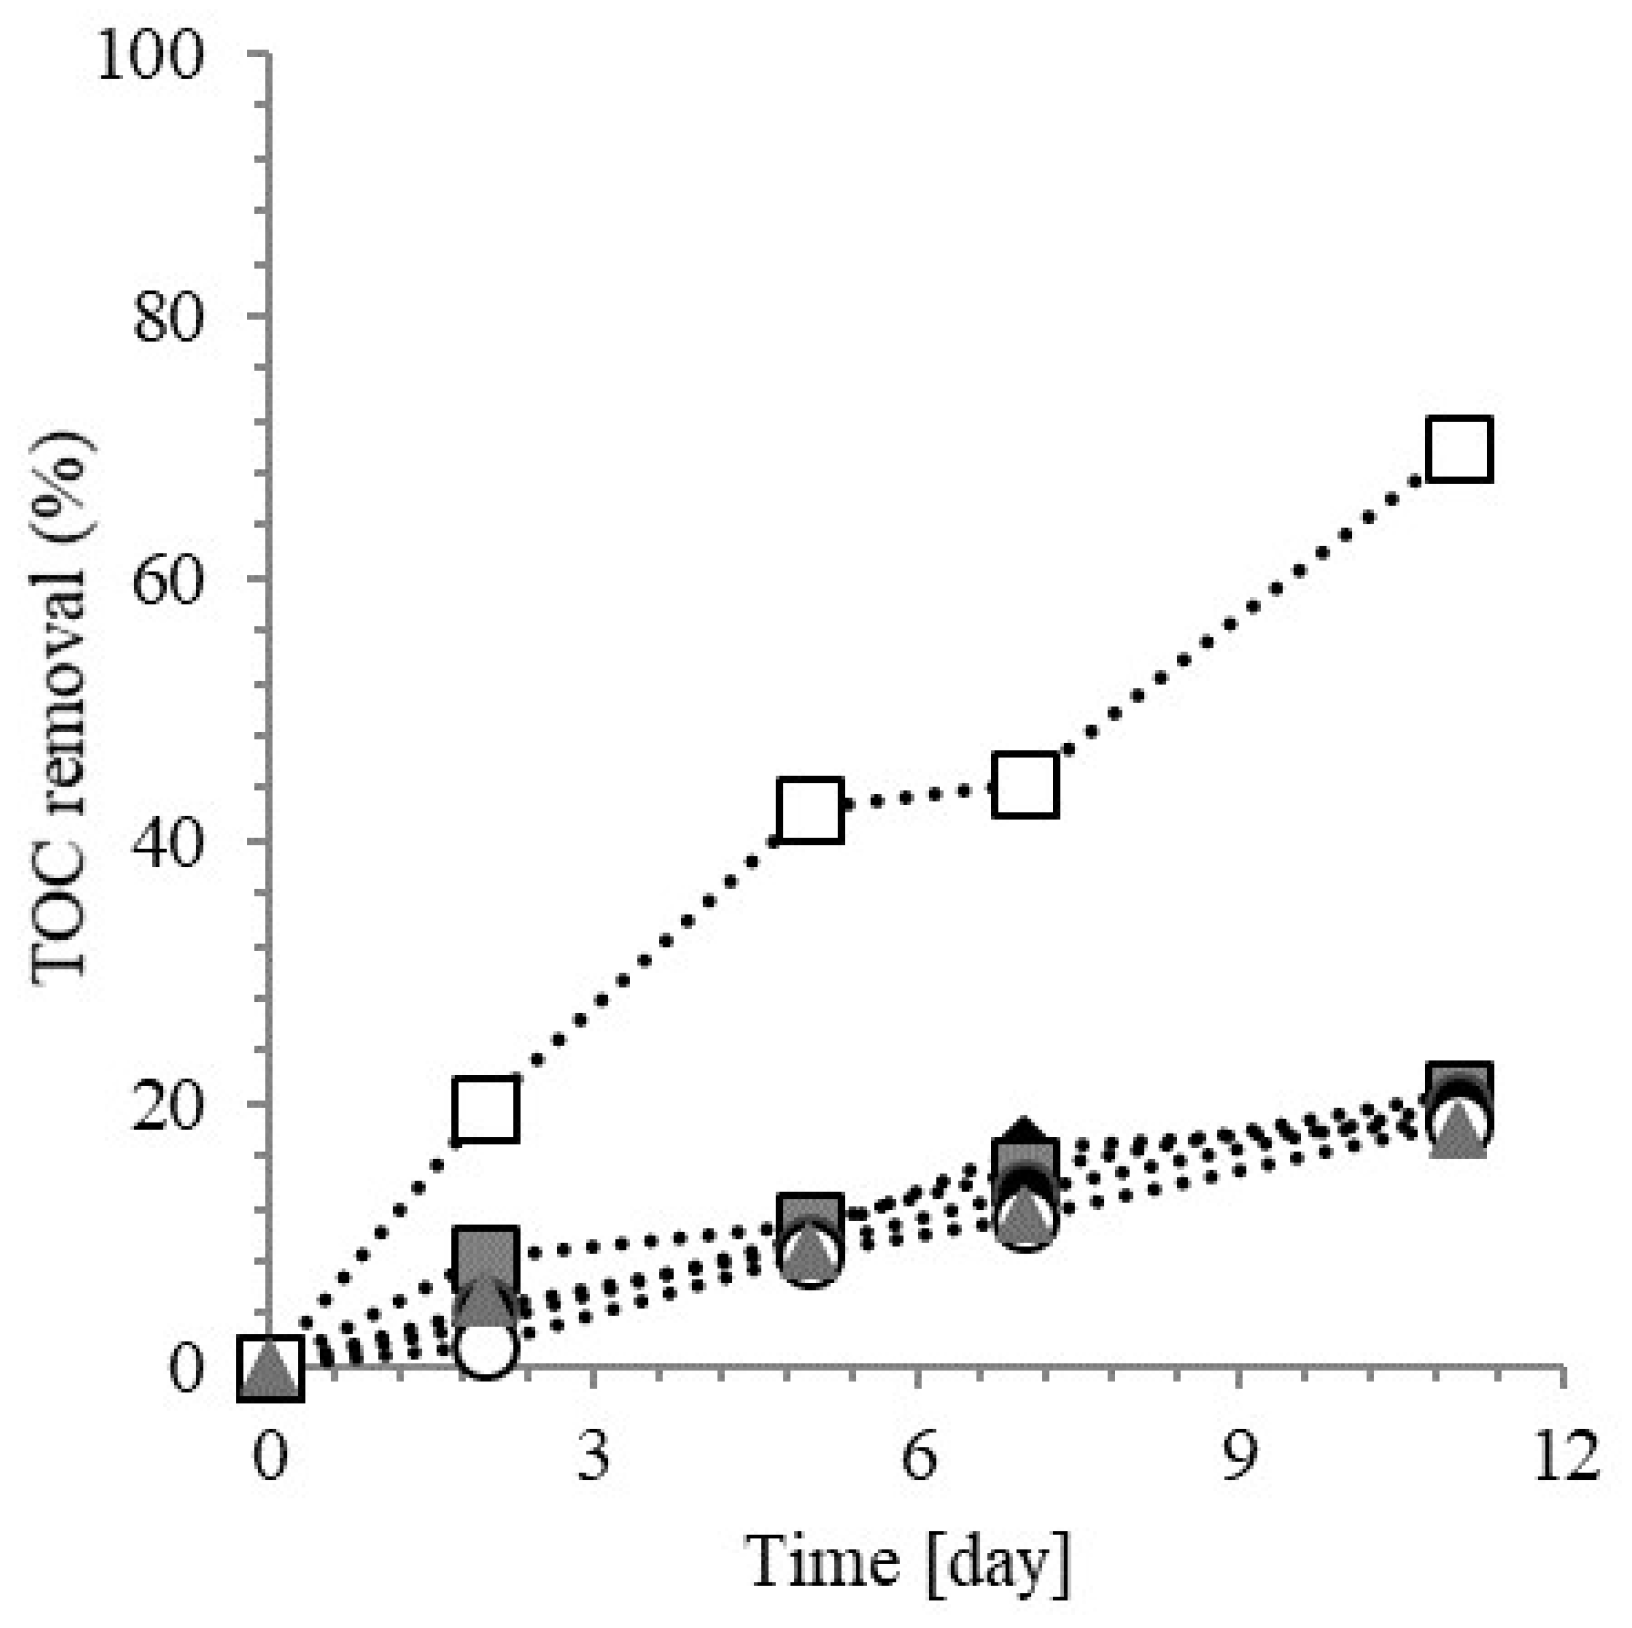
3.2. Denitritation Test

Figure 4 shows the results obtained during the denitritation tests performed at a different TOC/N ratio. A quick removal was observed within 5 days in all the tests, followed by a slight decrease of the removal rate up to the end of the operation time. Denitritation tests were carried out on a synthetic solution with the same composition of the effluent from the nitritation test at TOC/N = 0.11, to evaluate the optimal organic carbon amount to be added to develop denitrification.
With the increasing of the TOC/N ratio, the nitrite removal was first enhanced (D1, D2, and D3 tests) then, in the range from 0.52 to 1(D4, D5, and D6 tests) an almost constant nitrite removal was observed, as reported in Table 3, where the final concentration is indicated.
During denitritation, in fact, organic carbon acted as an electron donor and an increase of TOC concentration allowed the nitrite reduction [45]. Nevertheless, a further increase in the organic matter content did not result in a corresponding raise in nitrite removal, and the TOC removal was the prevailing process. Data in Figure 5, where TOC removal along time is reported, shows that similar trends were observed when TOC/N was in the range 0.11–0.75. A final TOC removal of about 20% was calculated in all the tests (after 11 days), while in test with the higher TOC/N ratio, a substantial TOC reduction occurred (about 70%).
This behavior can be attributed to the preferential development of organic carbon degrading microorganisms. TOC/N ratio had a strong effect on biomass activity: lower values of this ratio generate high heterotrophic denitrifying activity, while high organic carbon matter concentrations promote organic carbon removal [46].
In test D6, the organic carbon was also used as an electron donor for the energy generation in MFC. During denitritation, the OCV values were detected only in tests D5 and D6, though they were very low with respect to the values obtained during the previous nitritation step. In the denitritation step, OCV values are affected by the absence of air supply in the cathodic compartment, thus compromising the electrochemical performances of the system.
Based on the results achieved in the experiments, though increasing organic matter content favored the denitritation step, an optimal value of the TOC/N ratio was pointed out.
In the present work, TOC/N = 0.75 proved to be the optimal ratio to maximize nitrite reduction. This value is in good accordance with the theoretical value equal to 0.71 obtained by combining the Equation (4) with the following reaction:
C n H 2 n O n + n H 2 O n C O 2 + 4 n e + 4 n H +
which describes the substrate oxidation by microorganisms in the anodic compartment.
All the tests were performed in triplicate. For nitritation tests the average standard deviations were 2.67%, 5.87% and 5.37%, respectively for NH4+, NO2, and TOC concentrations. With regard to the denitritation tests, the average standard deviations were 4% and 4.51%, respectively for NO2 and TOC concentration.
This study demonstrated that nitrogen cycle can be developed in an MFC system, via the SBNR pathway. By adjusting the air supply in the cathodic chamber, it was possible to perform the nitrogen cycle in the anodic compartment: the oxygen losses through the separator were therefore an important parameter to be taken into account. The microaerobic condition enhances the partial oxidation of ammonia to nitrite, while, on the contrary, the absence of oxygen diffusion to the anodic chamber, by stopping the aeration in the cathodic chamber, ensured ideal conditions for the nitrite removal. In this case, a reduction of organic carbon required for denitritation step was obtained. The enhancement of nitrite accumulation at a low C/N ratio favored denitritation with respect to denitrification, where a C/N ratio between 2 and 3.5 is required [47].
Therefore, both steps (nitritation and denitritation) occurred in the same compartment, thus avoiding the wastewater recirculation usually adopted in case of high nitrogen concentration with respect to the organic carbon.
In view of implementing this process on a large-scale cost evaluation, further studies devoted to the optimization of cell configuration are required. In particular, the influence of cathodic chamber volume on the effectiveness of the anodic processes should be evaluated. Moreover, the role of the cathodic chamber could be optimized for the development of a parallel process, such as algae cultivation and related biodiesel production [48], methane production [49], or for in-situ Fenton oxidation treatment [50].

3.3. Kinetics Analysis of Nitritation and Denitritation

All data collected were used to evaluate a possible kinetic model expression that better describes the experimental results. Two different procedures of analysis were used: during nitritation the ammonium oxidation and the organic carbon removal process were considered two different mechanisms; in the case of denitritation step, organic carbon concentration is a promoter of the process, and nitrite and TOC removal were considered as only one process.

3.3.1. Nitritation

Although their different structures, the Monod, Blackman, and Tessier models keep the same meaning of kinetic parameters. In Table 4, the results of the kinetic analysis optimization of experimental data with the three models adopted in this work are reported.
Good results (lower value of Φ) were obtained for N1, N2, and N3 tests, while in test N4 this type of analysis was not possible since nitritation was not observed. An increase of the objective function value was observed for the test N2 and N3 during the analysis (data not reported), so a further optimization was necessary. For this reason, the results of the N2 and N3 tests were optimized using a time delay (τ) in the nitrification start-up [51]. In particular, 2 days and 7 days were adopted as τ for N2 and N3, respectively. µ** maintained the same behavior also with the introduction of τ. It decreased with increasing TOC/N ratio, as a result of the lower nitritation activity of ammonia oxidizing bacteria in the presence of high amount of organic carbon [52].
The kN values decreased with the increasing of TOC/N, approaching a zero order kinetic, according to other literature experiments [53]. Overall, Monod shown the best results, in terms of minimum Φ, in the case of the nitritation step.
Similarly to nitrification data, the kinetic analysis was performed using TOC data (Table 4). All models successfully fitted the experimental data, but a zero value of Φ was reached only using the Blackman model. An overall first order kinetic behavior of TOC removal was observed and the results of the optimization confirmed that the increase of µ** was associated with the increase of the TOC/N ratio.

3.3.2. Denitritation

A double-type model was used to describe denitritation kinetic behavior considering both nitrite (N) and organic carbon (C) as substrate. In Table S3, all model combinations used to fit the experimental data are summarized. The optimization of data fitting was implemented in order to find µ***, kN, and kC values. Φ values were minimized using the Blackman-Blackman model (Table 5), and the obtained kinetic coefficients were in agreement with the typical denitrification coefficients, as determined in other studies [38,54]. Tests D1 and D2 showed the same kinetic parameters, while higher values of µ*** was observed in tests D3 and D4, due to the positive effect of the high organic carbon concentration on denitritation. Basing on these results, a general trend was observed: at a low TOC/N ratio of up to 0.75 an increase of TOC amount favored nitrogen removal, while, at TOC/N values higher than 0.75, the nitrate removal rate decreased.

4. Conclusions

In this work, the SBNR process was carried out in a MFC system: the influence of TOC/N ratio on nitritation and denitritation processes was investigated. High ammonium removal (76%) was observed for TOC/N = 0.1, whilst organic carbon removal was favored at higher TOC/N ratios and it was almost completed at TOC/N = 26. Conversely, denitritation was positively influenced by increasing the TOC/N ratio up to 0.75. The presence of nitrogen species and the oxygen losses affected the electrochemical performances of the MFC: during nitritation and denitritation steps OCV increased with increases to the TOC concentration. At the optimal conditions of TOC/N for nitritation and denitritation OCV values equal to 21 mV and 5.3 mV were measured, respectively. A kinetic analysis showed that the Monod model well described ammonium removal, while carbon removal followed a Blackman kinetic; as for the denitritation tests, a Blackman-Blackman double model was found to better fit the experimental results. The nitrogen cycle in an anodic chamber of an MFC system can be achieved by regulating the oxygen diffusion from the cathodic chamber to the anodic compartment: the microaerobic condition and the nitrite accumulation guaranteed the possibility to use low amounts of organic carbon making it available for electrical energy generation.

Supplementary Materials

Author Contributions

Irene Bavasso performed the experiments, conducted the analyses and contributed to writing the manuscript. Daniele Montanaro participated in performing the experiments and in writing the manuscript. Elisabetta Petrucci participated in designing the study and in conducting analyses and writing the manuscript. Luca Di Palma contributed to design the study, supervised the whole work, edited and revised the manuscript.

Conflicts of Interest

The authors declare no conflict of interest.

References

  1. Effler, S.W.; Brooks, C.M.; Aver, M.T.; Doerr, S.M. Free ammonia and toxicity criteria in a polluted urban lake. J. Water Pollut. Control Fed. 1990, 62, 771–780. [Google Scholar]
  2. Carrera, J.; Jubany, I.; Carvallo, L.; Chamy, R.; Lafuente, J. Kinetic models for nitrification inhibition by ammonium and nitrite in a suspended and an immobilised biomass systems. Process Biochem. 2004, 39, 1159–1165. [Google Scholar] [CrossRef]
  3. Van Haandel, A.C.; Van Der Lubbe, J. Handbook of Biological Wastewater Treatment: Design and Optimisation of Activated Sludge Systems; IWA, Quist Publishing: Leidschendam, The Netherlands, 2012. [Google Scholar]
  4. Ruiz, G.; Jeison, D.; Rubilar, O.; Ciudad, G.; Chamy, R. Nitrification-denitrification via nitrite accumulation for nitrogen removal from wastewaters. Bioresour. Technol. 2006, 97, 330–335. [Google Scholar] [CrossRef] [PubMed]
  5. Pan, Y.; Ye, L.; Ni, B.J.; Yuan, Z. Effect of pH on N2O reduction and accumulation during denitrification by methanol utilizing denitrifiers. Water Res. 2012, 46, 4832–4840. [Google Scholar] [CrossRef] [PubMed]
  6. Khin, T.; Annachhatre, A.P. Novel microbial nitrogen removal processes. Biotechnol. Adv. 2004, 22, 519–532. [Google Scholar] [CrossRef] [PubMed]
  7. Chiu, Y.C.; Lee, L.L.; Chang, C.N.; Chao, A.C. Control of carbon and ammonium ratio for simultaneous nitrification and denitrification in a sequencing batch bioreactor. Int. Biodeterior. Biodegrad. 2007, 59, 1–7. [Google Scholar] [CrossRef]
  8. Lotti, T.; Kleerebezem, R.; Lubello, C.; van Loosdrecht, M.C.M. Physiological and kinetic characterization of suspended cell anammox culture. Water Res. 2014, 60, 1–14. [Google Scholar] [CrossRef] [PubMed]
  9. Strous, M.; Heijnen, J.J.; Kuenen, J.G.; Jetten, M.S.S. The sequencing batch reactor as apowerful tool for the study of slowly growing anaerobic ammonium oxidizing microorganisms. Appl. Microbiol. Biotechnol. 1998, 50, 589–596. [Google Scholar] [CrossRef]
  10. Peng, Y.; Zhu, G. Biological nitrogen removal with nitrification and denitrification via nitrite pathway. Appl. Microbiol. Biotechnol. 2006, 73, 15–26. [Google Scholar] [CrossRef] [PubMed]
  11. Ciudad, G.; Rubilar, O.; Muñoz, P.; Ruiz, G.; Chamy, R.; Vergara, C.; Jeison, D. Partial nitrification of high ammonia concentration wastewater as a part of a shortcut biological nitrogen removal process. Process Biochem. 2005, 40, 1715–1719. [Google Scholar] [CrossRef]
  12. Yirong, C.; Zhang, W.; Heaven, S.; Banks, C.J. Influence of ammonia in the anaerobic digestion of food waste. J. Environ. Chem. Eng. 2017, 5, 5131–5142. [Google Scholar] [CrossRef]
  13. Strous, M.; Van Gerven, E.; Zheng, P.; Kuenen, J.G.; Jetten, M.S.M. Ammonium removal from concentrated waste streams with the anaerobic ammonium oxidation (anammox) process in different reactor configurations. Water Res. 1997, 31, 1955–1962. [Google Scholar] [CrossRef]
  14. Wang, H.; Ren, Z.J. A comprehensive review of microbial electrochemical systems as a platform technology. Biotechnol. Adv. 2013, 31, 1796–1807. [Google Scholar] [CrossRef] [PubMed]
  15. Kondaveeti, S.; Min, B. Bioelectrochemical reduction of volatile fatty acids in anaerobic digestion effluent for the production of biofuels. Water Res. 2015, 87, 137–144. [Google Scholar] [CrossRef] [PubMed]
  16. Logan, B.E. Microbial Fuel Cells; Wiley: Hoboken, NJ, USA, 2008. [Google Scholar]
  17. Osman, M.H.; Shah, A.A.; Walsh, F.C. Recent progress and continuing challenges in bio-fuel cells. Part II: Microbial. Biosens. Bioelectron. 2010, 26, 953–963. [Google Scholar] [CrossRef] [PubMed]
  18. Rozendal, R.; Hamelers, H.V.M.; Buisman, C.J.N. Effects of membrane cation transport on pH and microbial fuel cell performance. Environ. Sci. Technol. 2006, 40, 5206–5211. [Google Scholar] [CrossRef] [PubMed]
  19. Allen, R.M.; Bennetto, H.P. Microbial fuel-cells: Electricity production from carbohydrates. Appl. Biochem. Biotechnol. 1993, 39, 27–40. [Google Scholar] [CrossRef]
  20. Moon, J.M.; Kondaveeti, S.; Lee, T.H.; Song, Y.C.; Min, B. Minimum interspatial electrode spacing to optimize air-cathode microbial fuel cell operation with a membrane electrode assembly. Bioelectrochemistry 2015, 106, 263–267. [Google Scholar] [CrossRef] [PubMed]
  21. Oh, S.E.; Logan, B.E. Proton exchange membrane and electrode surface areas as factors that affect power generation in microbial fuel cells. Appl. Microbiol. Biotechnol. 2006, 70, 162–169. [Google Scholar] [CrossRef] [PubMed]
  22. Liu, H.; Logan, B.E. Electricity generation using an air-cathode single chamber microbial fuel cell in the presence and absence of a proton exchange membrane. Environ. Sci. Technol. 2004, 38, 4040–4046. [Google Scholar] [CrossRef] [PubMed]
  23. Di Domenico, E.G.; Petroni, G.; Mancini, D.; Geri, A.; Di Palma, L.; Ascenzioni, F. Development of electroactive and anaerobic ammonium oxidizing (Anammox) biofilms from digestate in microbial fuel cells. BioMed. Res. Int. 2015, 2015, 351014. [Google Scholar] [CrossRef] [PubMed]
  24. Di Palma, L.; Geri, A.; Maccioni, M.; Paoletti, C.; Petroni, G.; Di Battista, A.; Varrone, C. Experimental assessment of a process including microbial fuel cell for nitrogen removal from digestate of anaerobic treatment of livestock manure and agricultural wastes. Chem. Eng. Trans. 2015, 43, 2239–2244. [Google Scholar]
  25. Virdis, B.; Rabaey, K.; Yuan, Z.; Keller, J. Microbial fuel cells for simultaneous carbon and nitrogen removal. Water Res. 2008, 42, 3013–3024. [Google Scholar] [CrossRef] [PubMed]
  26. Virdis, B.; Rabaey, K.; Rozendal, R.A.; Yuan, Z.; Keller, J. Simultaneous nitrification, denitrification and carbon removal in microbial fuel cells. Water Res. 2010, 44, 2970–2980. [Google Scholar] [CrossRef] [PubMed]
  27. Sotres, A.; Cerrillo, M.; Viñas, M.; Bonmatí, A. Nitrogen removal in a two-chambered microbial fuel cell: Establishment of a nitrifying-denitrifying microbial community on an intermittent aerated cathode. Chem. Eng. J. 2016, 284, 905–916. [Google Scholar] [CrossRef]
  28. Ryu, J.H.; Lee, H.L.; Lee, Y.P.; Kim, T.S.; Kim, M.K.; Anh, D.T.N.; Tran, H.T.; Ahn, D.H. Simultaneous carbon and nitrogen removal from piggery wastewater using loop configuration microbial fuel cell. Process Biochem. 2013, 48, 1080–1085. [Google Scholar] [CrossRef]
  29. Drewnowski, J.; Fernandez-Morales, F.J. Heterotrophic anodic denitrification in microbial fuel cells. Sustainability 2016, 8, 561. [Google Scholar] [CrossRef]
  30. Zhang, G.; Lee, D.-J.; Cheng, F. Treatment of domestic sewage with anoxic/oxic membrane-less microbial fuel cell with intermittent aeration. Bioresour. Technol. 2016, 218, 680–686. [Google Scholar] [CrossRef] [PubMed]
  31. Ryu, H.D.; Kim, D.; Lim, H.E.; Lee, S.I. Nitrogen removal from low carbon-to nitrogen wastewater in four-stage biological aerated filter system. Process Biochem. 2008, 43, 729–735. [Google Scholar] [CrossRef]
  32. Jung, S.; Regan, J.M. Comparison of anode bacterial communities and performance in microbial fuel cells with different electron donors. Appl. Microbiol. Biotechnol. 2007, 77, 393–402. [Google Scholar] [CrossRef] [PubMed]
  33. Kim, T.; An, J.; Jang, J.K.; Chang, I.S. Coupling of anaerobic digester and microbial fuel cell for COD removal and ammonia recovery. Bioresour. Technol. 2015, 195, 217–222. [Google Scholar] [CrossRef] [PubMed]
  34. Esfandyari, M.; Fanaei, M.A.; Gheshlaghi, R.; Akhavan Mahdavi, M. Mathematical modeling of two-chamber batch microbial fuel cell with pure culture of Shewanella. Chem. Eng. Res. Des. 2017, 117, 34–42. [Google Scholar] [CrossRef]
  35. Shuler, M.; Kargi, F. Bioprocess Engineering: Basic Concepts, 2nd ed.; Prentice Hall: Upper Saddle River, NJ, USA, 2002. [Google Scholar]
  36. Zacharof, M.P.; Lovitt, R.W. Modelling and simulation of cell growth dynamics, substrate consumption, and lactic acid production kinetics of Lactococcuslactis. Biotechnol. Bioprocess Eng. 2013, 18, 52–64. [Google Scholar] [CrossRef]
  37. Jafary, T.; Ghoreyshi, A.A.; Najafpour, G.D.; Fatemi, S.; Rahimnejad, M. Investigation on performance of microbial fuel cells based on carbon sources and kinetic models. Int. J. Energy Res. 2013, 37, 1539–1549. [Google Scholar] [CrossRef]
  38. Mora, M.; Dorado, A.D.; Gamisans, X.; Gabriel, D. Investigating the kinetics of autotrophic denitrification with thiosulfate: Modeling the denitritation mechanisms and the effect of the acclimation of SO-NR cultures to nitrite. Chem. Eng. J. 2015, 262, 235–241. [Google Scholar] [CrossRef] [Green Version]
  39. Hussain, A.; Manuel, M.; Tartakovsky, B. A comparison of simultaneous organic carbon and nitrogen removal in microbial fuel cells and microbial electrolysis cells. J. Environ. Manag. 2016, 173, 23–33. [Google Scholar] [CrossRef] [PubMed]
  40. Guo, J.; Peng, Y.; Wang, S.; Zheng, Y.; Huang, H.; Wang, Z. Long-term effect of dissolved oxygen on partial nitrification performance and microbial community structure. Bioresour. Technol. 2009, 100, 2796–2802. [Google Scholar] [CrossRef] [PubMed]
  41. Eaktasang, N.; Kang, C.S.; Lim, H.; Kwean, O.S.; Cho, S.; Kim, Y.; Kim, H.S. Production of electrically-conductive nanoscale filaments by sulfate-reducing bacteria in the microbial fuel cell. Bioresour. Technol. 2016, 210, 61–67. [Google Scholar] [CrossRef] [PubMed]
  42. Moqsud, M.A.; Omine, K.; Yasufuku, N.; Hyodo, M.; Nakata, Y. Microbial fuel cell (MFC) for bioelectricity generation from organic wastes. Waste Manag. 2013, 33, 2465–2469. [Google Scholar] [CrossRef] [PubMed]
  43. Bavasso, I.; Di Palma, L.; Petrucci, E. Treatment of wastewater in h-type mfc with protonic exchange membrane: Experimental study of organic carbon and ammonium reduction with electrochemical characterization. Chem. Eng. Trans. 2016, 47, 223–228. [Google Scholar]
  44. Oh, S.E.; Logan, B.E. Voltage reversal during microbial fuel cell stack operation. J. Power Sources 2007, 167, 11–17. [Google Scholar] [CrossRef]
  45. An, S.; Loden, B.; Nemati, M. Evaluation of heterotrophic nitrite removal by a sulphide and acetate oxidizing mixed culture originated from an oil reservoir. J. Chem. Technol. Biotechnol. 2012, 87, 410–417. [Google Scholar] [CrossRef]
  46. Ruiz, G.; Jeison, D.; Chamy, R. Development of denitrifying and methanogenic activities in USB reactors for the treatment of wastewater: Effect of COD/N ratio. Process Biochem. 2006, 41, 1338–1342. [Google Scholar] [CrossRef]
  47. Huang, B.; Feng, H.; Wang, M.; Li, N.; Cong, Y.; Shen, D. The effect of C/N ratio on nitrogen removal in a bioelectrochemical system. Bioresour. Technol. 2013, 132, 91–98. [Google Scholar] [CrossRef] [PubMed]
  48. Hou, Q.; Nie, C.; Pei, H.; Hu, W.; Jiang, L.; Yang, Z. The effect of algae species on the bioelectricity and biodiesel generation through open-air cathode microbial fuel cell with kitchen waste anaerobically digested effluent as substrate. Bioresour. Technol. 2016, 218, 902–908. [Google Scholar] [CrossRef] [PubMed]
  49. Cai, W.; Han, T.; Guo, Z.; Varrone, C.; Wang, A.; Liu, W. Methane production enhancement by an independent cathode in integrated anaerobic reactor with microbial electrolysis. Bioresour. Technol. 2016, 208, 13–18. [Google Scholar] [CrossRef] [PubMed] [Green Version]
  50. Asghar, A.; Salihoudin, A.; Aziz Abdul Raman, A.; MohdAshri Wan Daud, W. Cathode modification to enhance the performance of in-situ fenton oxidation in microbial fuel cells. Environ. Prog. Sustain. Energy 2017, 36, 382–393. [Google Scholar] [CrossRef]
  51. Lobry, J.R.; Flandrois, J.P.; Carret, G.; Pave, A. Monod’s bacterial growth model revisited. Bull. Math. Biol. 1992, 54, 117–122. [Google Scholar] [CrossRef] [PubMed]
  52. Bush, A.W.; Cook, A.E. The effect of time delay and growth rate inhibition in the bacterial treatment of wastewater. J. Theor. Biol. 1976, 63, 385–395. [Google Scholar] [CrossRef]
  53. Sheintuch, M.; Tartakovsky, B.; Narkis, N.; Rebhun, M. Substrate inhibition and multiple states in a continuous nitrification process. Water Res. 1995, 29, 953–963. [Google Scholar] [CrossRef]
  54. Fajardo, C.; Mora, M.; Fernández, I.; Mosquera-Corral, A.; Campos, J.L.; Méndez, R. Cross effect of temperature, pH and free ammonia on autotrophic denitrification process with sulphide as electron donor. Chemosphere 2014, 97, 10–15. [Google Scholar] [CrossRef] [PubMed]
Figure 1. Ammonium concentration (full symbol) and nitrite concentration (empty symbol) in test N1 (circle), N2 (square), and N3 (triangle).
Sustainability 10 01062 g001
Figure 2. Total Organic Carbon removal (%) in test N1 (◊), N2 (□), N3 (▲), and N4 (●).
Sustainability 10 01062 g002
Figure 3. Open Circuit Voltage (mV) against Ag/AgCl reference electrode in test N1 (◊), N2 (□), N3 (▲), and N4 (●).
Sustainability 10 01062 g003
Figure 4. Nitrite removal (%) in test D1 (♦), D2 (□), D3 (∆), D4 (●), D5 (○), and D6 (■).
Sustainability 10 01062 g004
Figure 5. Total Organic Carbon removal (%) in test D1 (♦), D2 (■), D3 (∆), D4 (●), D5 (○), and D6 (□).
Sustainability 10 01062 g005
Table 1. Operating condition in the experimental tests.
RunSynthetic WastewaterTOC/NAeration in Cathodic Chamber
NH4+-N [mg/L]NO2-N [mg/L]TOC [mg/L]
N1100-100.1Yes
N2100-350.35Yes
N3100-1001Yes
N4100-260026Yes
D1-540600.11Not
D2-5401200.22Not
D3-5401900.35Not
D4-5402800.52Not
D5-5404050.75Not
D6-5405401Not
Table 2. Nitritation tests: percentage of ammonium and Total Organic Carbon (TOC) removal and composition of the effluents (30 days).
Runt (NH4+/NO2 = 1) [d]NH4+ (%)TOC (%)Effluent Composition
TOC [mg/L]NH4+-N [mg/L]NO2-N [mg/L]TOC/N
N1107672.477.4824750.03
N2117281.026.6428700.07
N3156378.7921.0237600.21
N4--99.4314.7098-3.38
Table 3. Denitritation tests: percentage of nitrite and TOC removal and composition of the effluent (11 days).
RunNO2 (%)TOC (%)Effluent CompositionOCV Max [mV]
TOC [mg/L]NO2-N [mg/L]
D122.4018.6048.84419.04-
D240.5020.7095.16321.30-
D362.0017.87156.04205.20-
D479.0020.04223.89113.40-
D580.3018.55329.11106.405.3
D679.3069.86162.74117.3010.2
Table 4. Ammonium and organic carbon (TOC) removal data fitting using Monod, Blackman, and Tessier models.
RunMonodBlackmanTessier
μ * + k N Φ μ * * k N Φ μ * * k N Φ
N120.20184.000.8230.00199.701.3219.53214.320.92
AmmoniumN212.48131.421.6114.20110.691.8710.47130.361.73
RemovalN312.1999.871.4814.44100.381.049.7796.861.36
N4---------
N12.7975.930.243.1564.230.002.0464.710.06
TOCN23.6572.240.414.0564.230.003.3583.590.15
RemovalN35.0756.7115.004.0468.520.004.0860.9812.48
N4419.772045.0010,015.111.4760.000.00365.162574.586318.78
Table 5. Blackman-Blackman kinetic parameters for denitritation step.
Run μ * * * k N O k c Φ
D1128.92914.1266.8912.61
D2128.92914.7466.8913.34
D3150.51824.7770.6525.46
D4149.35854.7064.9924.44
D5119.65948.71762.4716.41
D6102.07963.4664.4210.73

