A Systems Analysis of Factors Influencing Household Solar PV Adoption in Santiago, Chile


1
Civil Engineering Department, Universidad Diego Portales, Santiago 8370191, Chile
2
Civil and Environmental Engineering, University of Washington, Seattle, WA 98195, USA
3
Civil and Environmental Engineering Department, University of South Florida, Tampa, FL 33620, USA
*
Author to whom correspondence should be addressed.
Sustainability 2018, 10(4), 1257; https://0-doi-org.brum.beds.ac.uk/10.3390/su10041257
Submission received: 6 March 2018
/
Revised: 10 April 2018
/
Accepted: 16 April 2018
/
Published: 19 April 2018
(This article belongs to the Special Issue Solar Photovoltaic Electricity)
Abstract
:Societal uptake of household solar photovoltaic (PV) technology is the result of a complex and interdependent array of technical, social, political and economic factors. This novel study employs a systems lens to examine both technical and non-technical barriers to renewables, with a focus on interactions that are empirically influential on PV uptake. Using local solar expert stakeholder input into a participatory systems approach, this study provides a structural analysis of factors influencing household solar adoption. The approach is applied and assessed for household solar PV systems in Santiago, Chile, to gain insight into the interconnected factors driving technology adoption. Barriers and motivations to adoption identified in a recent Delphi study for Santiago were used to create a list of factors thought by local experts to impact future adoption. These factors and their pairwise interactions were modeled using the impact matrix multiplication applied to classification (MICMAC) technique and analyzed within a four-hour workshop with eight solar experts in Santiago. Results from the analysis regarding factor influence, dependence and evolutionary trajectories were presented to experts and discussed at length. Salient discussion points focused on the need for attractive financial incentives, knowledge diffusion among potential consumers, and a maturing market that incites a cultural shift towards customers who desire energy independence. Intuitive and insightful programmatic areas were illuminated for policy and action in Santiago based on a systems-focused interpretation of factors in the form of short- and long-term strategies.
1. Introduction
The negative environmental impacts of fossil fuel combustion are well documented [1]. A significant percentage of global greenhouse gas emissions (GhG) are from fossil fuels used in the production of electricity [2]. For example, close to one-third of all U.S. GhG emissions are the result of electricity production [3]. Emissions will only increase as global electricity demand is projected to grow 80% by 2040 [4]. These factors make decarbonizing electricity production a critical component of climate-change mitigation [2]. However, even with broad recognition of how critical decarbonizing electricity production is, transitioning a society from fossil fuels to renewables is a complex task that may take decades to complete [5].
For the purposes of this paper, we follow the literature to define an energy transition as a societal change in the principal source of energy used to produce electricity; from fossil fuels to renewable energy-sourced electricity. Energy transitions have occurred at various points in history; an example is the industrial revolution, where traditional biomass gave way to coal and steam [6]. An energy transition is characterized by socio-technical complexity [5], where success is dependent on long-term changes occurring in energy production and distribution infrastructure, and end-use or consumption patterns. However, societal uptake of renewable energy technologies is constrained by economic, policy and societal acceptance challenges. For example, economic barriers include the higher capital costs associated with renewables [7], or additional expenditures required to integrate renewables into existing electricity-grid infrastructures [8]. Overcoming these market inequalities requires supportive policies [9]. However, policies designed to increase either electricity supply or demand are often enacted at different governmental levels [10]. This may result in conflicting policy goals, creating policy–policy interactions slowing the transition to renewables. An example would be a carbon cap-and-trade scheme that unintentionally incentivizes continued reliance on fossil fuels [11,12]. Examples of societal challenges include local community resistance to renewable-energy projects [13,14].
Considered in isolation, each economic, policy and societal dimension of an energy transition exhibits complexity. However, interactions between dimensions create additional complexity. Recent research identified interactions between factors within economic, political, social, technological and environmental dimensions with impacts on renewable energy-sourced electricity-diffusion rates [15,16,17]. For example, the initial high capital costs or cost reductions associated with solar photovoltaic (PV) market maturation impact which policy drivers are most effective as the market moves from nascent to fully developed. As well-designed and timed policies facilitate renewable technology diffusion and effective competition with the dominant fossil-fuel industry, social awareness of the technology grows, easing barriers to diffusion associated with unfamiliarity. Such interdependencies make it difficult to assess any single factor’s influence on the diffusion of renewables [5,18,19]. As a result, the transition to renewables has been defined as a complex system, [20,21,22]. The electricity system itself has been defined as a system of systems where electricity generation, distribution and consumption are composed of multiple, interdependent elements impacting the rate of renewable technology uptake [23].
Although significant bodies of research have been conducted within single academic disciplines (primarily economic and policy) seeking to understand and aid the transition to renewables, there is a knowledge gap with regard to systems level analyses [15]. In a systems perspective, a system is a set of interconnected elements serving some purpose [24]. Interdependencies between a system’s elements create complex behavior. Here, changing the value of an element may create further change in that same element (feedback loop), create change somewhere in the system at some later point in time (delay), or produce exponential change (non-linearities) [24]. A systems approach is holistic, focusing on the entire system, where overall performance is considered more than the sum of its parts. This is important for understanding energy-transition dynamic behavior over the time scale at which it plays out. A systems-level analysis is suitable for studying complex relationships between elements, non-linearities, feedback loops and delays [25]. Therefore, it is critical to study the evolution of an energy transition, where relationships between elements change as an emerging energy source first enters a market, and then ultimately proceeds to displace the dominant source.
Given the above, the aim of this study was to present and employ a practical and accessible technique for mapping economic, political, and societal interdependencies, as well as the evolution of their inferred impacts on household solar PV diffusion, demonstrated with application to Santiago, Chile. In addition, this study sought to compare, contrast and build upon the recent study by Walters et al. [26] that employed a Delphi panel of experts to reach consensus on the key factors driving the adoption of household solar in Santiago (see Hallowell and Gambatese [27] for detailed information on the Delphi process). Walters et al. [26] enumerated and scored important factors, and noted the potential for improved understanding of factor importance by identifying how the factors interacted as a system. To achieve this additional depth in understanding, this analysis uses the impact matrix multiplication applied to classification (MICMAC) technique, as it allows for the mapping of interrelationships of factors to infer key drivers in complex system evolution [28].
Three past studies in renewable energy have used a modified MICMAC within interpretive structural modeling (ISM) to gain insights into energy savings in China [29], and barriers to utility [30] and rural [31] scale solar power installations in India. While these excellent studies present a rigorous methodology based on ISM with useful outputs that inform energy policy in each country and regional context, they (i) do not perform full MICMAC matrix manipulations to quantify factor-interaction strengths and infer indirect interaction and feedback between factors to infer system evolution; (ii) do not discuss model outputs with experts; and (iii) present an approach that is not facilitated through a software program with an accessible graphical user interface [31]. Moreover, these approaches do not explicitly address factors influencing household-level solar adoption. The present study sets out to fill these gaps by evaluating factor importance and evolution for household solar adoption, demonstrated for Santiago, Chile, within a replicable process facilitated by the free software LIPSOR-EPITA-MICMAC version 6.1.2 [32]. In doing so, it presents a novel approach for examining the evolution of an energy transition which inputs expert stakeholder insight on how critical factors change over the transition timeline. This study attempts to answer the following research questions:
- (1)
- Which factors do experts think are most influential on adoption?
- (2)
- How does the influence of factors vary over time?
- (3)
- What factors are best suited to increase early market penetration, and which factors increase diffusion rates in more mature markets?
In the sections that follow, we present the landscape for solar PV adoption and diffusion in Chile, followed by a description of the method employed to bolster systems-based understanding on important drivers with a modeling workshop attended by eight Chilean solar experts. The results inform discussion on areas for policy and market interventions to promote and support household solar adoption programming in Santiago and point to further generalizable findings for the broader diffusion of household solar.
2. Santiago Context
By becoming a member of the Organization for Economic Cooperation and Development (OECD, Paris, France) in 2010, Chile officially committed to significantly decreasing its GhG emissions by transitioning to renewable-energy sources [33]. Chile has since led the way in South America for solar-energy production, setting ambitious targets to achieve 20% of energy by renewable sources by 2025, and 70% by 2050, primarily through solar-energy production [34,35]. Chile’s proposed economic and political mechanisms to reduce GhG emissions include a carbon tax of 5 US$/tCO2e on coal-fired thermal power plants (the principle energy source for large copper mines) over 50 MW in generation capacity [36].
Three unique drivers beyond those related to environmental stewardship exist in the Chilean context that motivates investment in solar-energy production. First, due in large part to increases in the economic livelihood of the population (with a current average yearly residential electricity consumption 1800 kWh [37]), a 7% annual growth in energy demand is expected [38]. Thus, as a country that depends primarily on conventional thermal electricity production using imported fossil fuel (60%) and hydroelectric power (34%), a timely need exists to both minimize dependency on imported fuel, while meeting the increasing energy demands of Chilean citizens and the escalating associated energy costs [39]. Second, Chile is endowed with high solar insolation levels throughout most of the country [39,40], the highest of which is present in the dry northern region of Atacama where the majority of Chilean solar plants are located [41]. Finally, due to a uniquely shaped geography, Chile’s electrical transmission network (SING: northern region; SIG: southern and metropolitan regions) is one of the most complicated in the world. Lowering the demand on these networks through PV energy generation could yield substantial benefits such as avoided energy costs, avoiding transmission losses, and improving grid resiliency [42].
In Santiago Chile, the market conditions supporting investment in residential solar PV appear favorable. These include consistently high levels of solar insolation [40], rapidly increasing retail electricity rates [36,38], and relatively low cost for PV (2.22 US$/W) [43]. Additionally, a recently established net billing law (Ley 20.571) offers excess energy injection rates [43] that result in pay-back periods of around six years, as well as a favorable levelized cost of electricity (LCE) of as little as 0.1 US$/kWh (depending on PV system size and discount rate) [37]. To capitalize on these advantageous conditions and further stimulate demand for residential solar PV, in 2015 the Ministry of Energy enacted a four-year US$13 million pilot program called the Plan Techo Solar Público (Public Solar Roof Plan (PTSP)) focused on increasing both visibility and education about the new net metering law by providing funds to public institutions, foundations, and non-profits for PV system installation [44].
Despite initiatives such as these, Santiago has seen a remarkably low diffusion of solar PV technology in the residential sector. Walters et al. [26] found that in 2016 a total of only 23 residential PV systems were formally registered—in a city of more than 6.7 million inhabitants. It is noted that while formal registration may not give an exact measure of the number of residential PV systems, this figure reveals strong evidence for a surprisingly low scale of diffusion in Santiago. Consequently, Chile provides a compelling case study to investigate the complex drivers influencing this contradiction. The literature indicates drivers of distributed electricity generation in developing household solar markets transcend the technical and economic to also include interconnected societal and political factors [15]. Thus, a systems-based understanding of socio-technical interconnections may yield improvements for policy practice in Chile and beyond. From this assertion, the aim of this case study is twofold: (i) to gain insight into the interconnections between drivers that influence household solar PV diffusion in Chile to inform both present and future strategic planning and policy; and in so doing (ii) build on existing theory using an approach that can be replicated in other, diverse contexts in order to offer similar insights into complex drivers of household solar adoption.
3. Materials and Methods
Below we detail how the data were collected and analyzed with MICMAC structural factor analysis. Figure 1 presents the various steps in the methodological framework. We began with findings from the Walters et al. [26] Delphi study that engaged experts to identify important factors via an online survey. Building on that past work, we used these factors in the MICMAC modeling workshop analyzed here. In the workshop, experts were asked to discuss the pairwise influence between these factors, along with resulting system evolution based on outputs from the MICMAC analysis. The key output from the workshop was a clearly defined set of action steps for policy and practice that considered both the short-term and long-term outcomes.
To better demonstrate the application of this research plan, we present both the theory behind the approach as well as the case study results as the outputs from the MICMAC factor mapping activity guided discussion within the workshop. Key insights and study implications based on these results are described in the Discussion section.
3.1. Impact Matrix Multiplication Applied to Classification (MICMAC) Analysis
The MICMAC technique is a form of structural factor analysis using impact matrix manipulation to ascertain indirect relationships and feedback between factors and infer the dynamic behavior and evolution of a system [45,46,47,48,49,50]. An impact matrix is a square matrix that houses all possible pairwise factor influences (or lack of influences) in a system (i.e., Factor A → Factor B). Mathematically, the MICMAC process entails iteratively multiplying the impact matrix with itself to simulate higher-order system behavior, assuming that a multiplicative amplification of factor influence strengths—assigned in the impact matrix as either 1: weak, 2: moderate, 3: strong—yields insight into indirect factor interaction and feedback [47,49,50]. After each impact matrix multiplication, the column sums and row sums are re-calculated until the results begin to stabilize and further iterations lead to similar resulting combinations and sums, usually after 7 or 8 iterations [45,47,49,50].
Calculating and comparing factor influence and dependence between the original impact matrix and the iteratively multiplied impact matrix infers factor and system evolution over the long term. Factor influence relates to how a particular factor causes a change in other factors to which it is connected. Contrarily, factor dependence is how the said factor is changed by the influence of other factors. An impact matrix is a useful way to calculate and organize factor influence and dependence mathematically. Summing the individual columns of the impact matrix calculates the dependence of a particular factor on other factors, while row sums calculate each factor’s influence on the other factors. The relative influence and dependence of factors on other factors provides a means to interpret key aspects regarding system evolution towards a differing end state. This evolution may be visually inferred within a four-quadrant chart called an influence map. The distribution of factors within one of the four quadrants of the influence map infers distinct aspects of factor impact and evolution based on varying levels of factor influence and dependence [45]. Factors within Quadrant II (called influent factors) houses factors that strongly drive system behavior but are not controlled by it, and are thus the most stable and impactful on system outcomes. Factors in Quadrant I are called relay factors. Relay factors are both highly influential and highly dependent on other factors and thus represent unstable and emergent outcomes within the system. As such, they generally serve as a target for policy [45]. Factors within Quadrant III are called autonomous factors and have very little influence or dependence on other factors and thus negligible influence on system behavior. Factors in Quadrant IV are known as result factors. These have very low influence, and their dependence is highly sensitive to the evolution of influent and relay factors and represent system outcomes. By assessing factor influence and dependence in this way, it is possible to support strategic decisions on which factors to target, or stabilize, to ensure system behavior remains optimal over the short and long term.
3.2. Data Collection and Analysis
The data analyzed in this paper are the result of a six-hour workshop conducted in the civil engineering department of the Universidad Diego Portales, Santiago, Chile. All research protocols were reviewed and approved by the ethical review board of the Universidad Diego Portales prior to undertaking data collection. Thirty experts were invited to participate. Experts were identified as individuals with more than five years of experience in renewable electricity specific to the Santiago metropolitan context. Ultimately, eight experts agreed to participate in the MICMAC workshop; three of whom had previously participated in the aforementioned Delphi study by Walters et al. [26] that generated the considered factors. The experts hold a wide range of expertise in the Santiago context, and included experts from the Ministry of Energy, the Chilean Electrical Utility (SEC, Santiago, Chile) and four private solar companies that dealt primarily in the sale of solar technology and installation services for utility-scale solar plants and PV for large public buildings.
The entire workshop was audio recorded with participant consent. It began with an overview of the 14 factors and their definitions. The 14 factors selected for this study (Table 1) come from a study by Walters et al. [26] that identified the barriers to household solar investment in Santiago. In their paper, a Delphi panel was used to discover and evaluate the importance of 26 factors contributing to or preventing the diffusion of household solar systems in Santiago, Chile. These factors were a combination of factors from the academic literature and others suggested by the nine experts who participated in that study. The authors assigned these factors to seven categories: Financial Motivations, Energy Supply Motivations, Environmental Motivations, Decision Makers’ Incomplete Knowledge, Technical Barriers, Financial Barriers, and Institutional Knowledge.
The MICMAC methodology of the present study did not permit pairwise consideration of all 26 factors because the methodology requires pairwise comparison of all included factors. Including all 26 factors would have required the experts to make 650 pairwise comparisons (number of comparisons equal to , where is the number of factors)—an amount the research team felt would lead to response fatigue and, therefore, would not optimize the collected data. As such, we chose the two most highly rated factors from each of the seven categories discovered in that past work. This instead required 182 pairwise comparisons, which the research team felt could be more reasonably and effectively evaluated in the span of the four-hour MICMAC workshop. To improve participant recall during the pairwise factor comparison step of the process, each expert was provided with a written list of the factors and their definitions. Next, the experts were asked to systematically and sequentially consider the pairwise interaction between each of 14 factors rating each pair as having an interaction of 0—no interaction; 1—weak interaction; 2—moderate interaction; and 3—strong interaction. Consensus on each factor’s influence was based on a majority agreement of five or more workshop participants.
Each pairwise comparison was recorded and analyzed in real-time using the LIPSOR-EPITA-MICMAC software, permitting presentation of results back to the experts for discussion almost immediately following the completion of the pairwise comparison activity.
4. Results
Table 2 shows the impact matrix which houses each of the 182 pairwise connections identified by the experts along with the calculation of direct influence and dependence. The influence graph and influence map with factor outputs were presented to experts to stimulate discussion on factor interaction and evolution. The researchers took detailed notes during the discussion of these results, which took approximately two hours. Audio recordings of the workshop allowed the researchers to revisit details of the conversation to help interpret the numerical and graphical results, as presented in the discussion section.
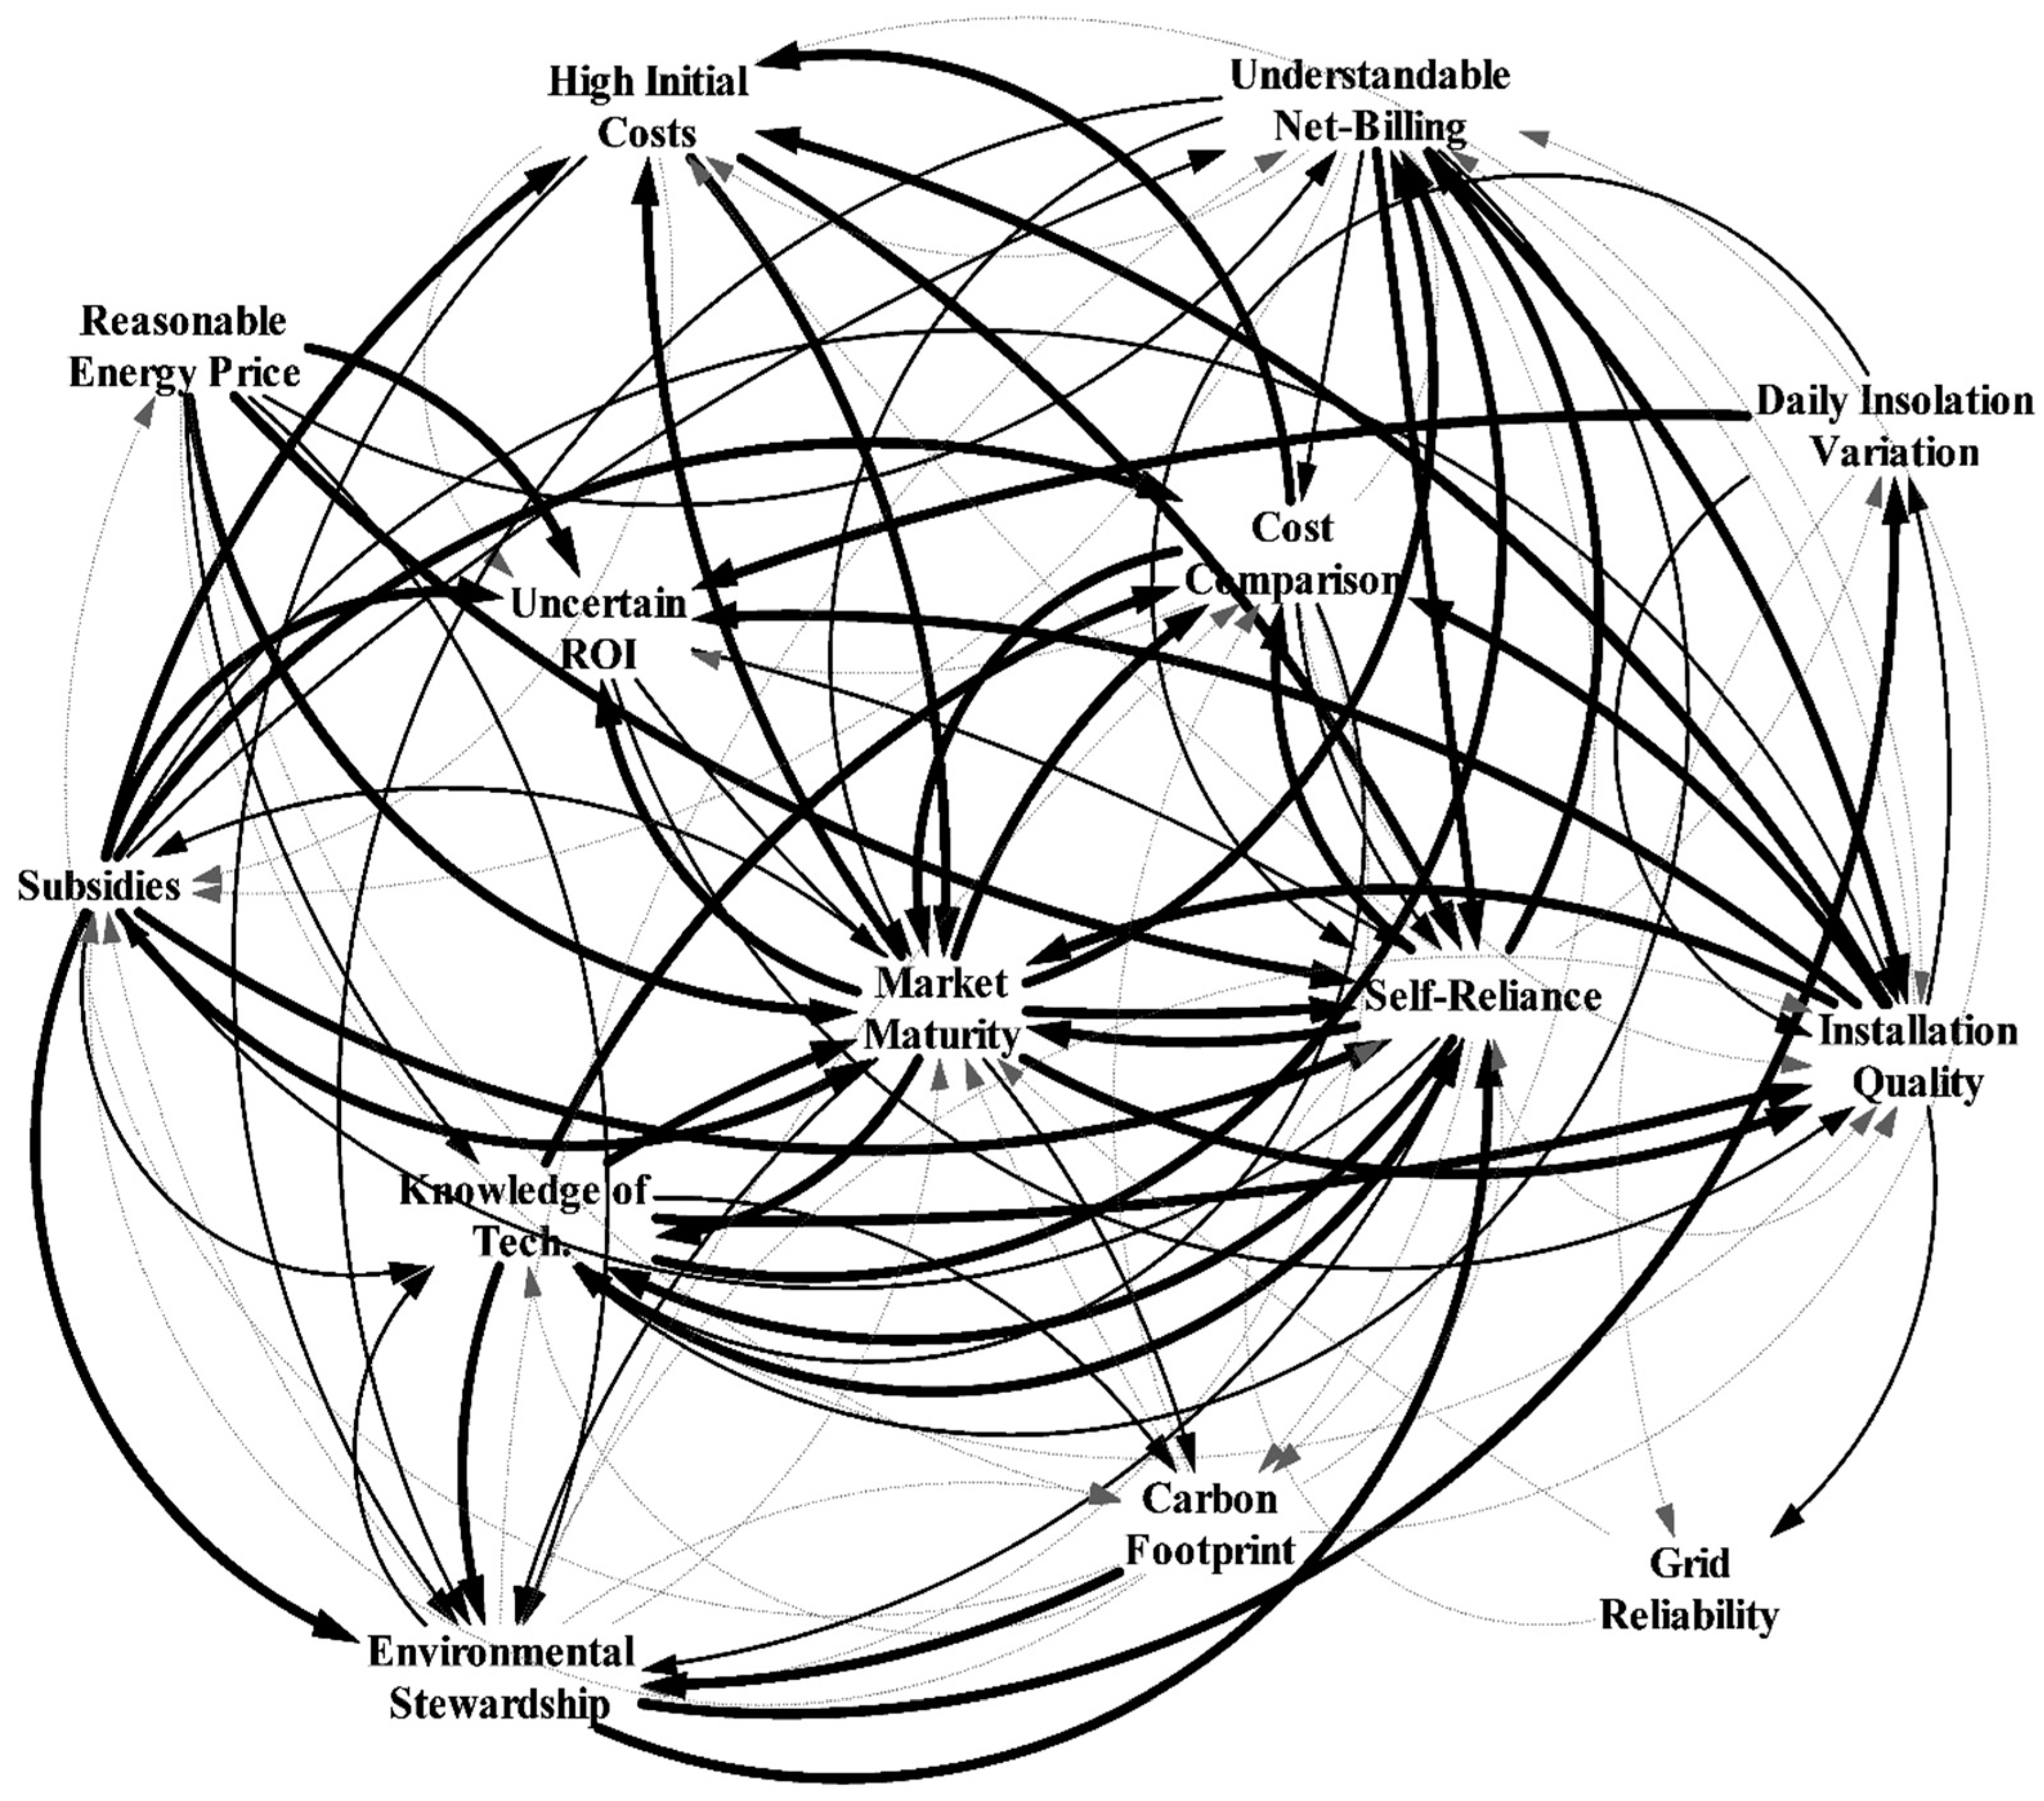
The influence graph (Figure 2) provided a visual representation of how experts reported factor interaction. In this figure, lines indicate interactions between factors. The relative thickness of each connecting line indicates the strength of the interactions as identified by the experts. Finally, the directionality of each interaction is indicated by the directionality of arrowheads. For example, the experts noted that the Installation Quality influences the High Initial Costs of household solar. While the position of each factor in the graph was chosen to most clearly show the graphical relationships, the dense network emphasizes the complexities of interactions between the various factors. It also enabled experts to identify factors a priori that were either highly influential (influent factor: strongly drive system behavior but are not controlled by it), highly dependent (result factor: highly sensitive to the evolution of influent and relay factors and represent system outcomes), or highly unstable (relay factor: both highly influential and highly dependent on other factors, and thus represent unstable and emergent outcomes (feedback) within the system) which are influenced by and influence many others. For example, we see Reasonable Energy Price has seven outgoing ties and only one incoming tie, indicating that it is an influent variable.
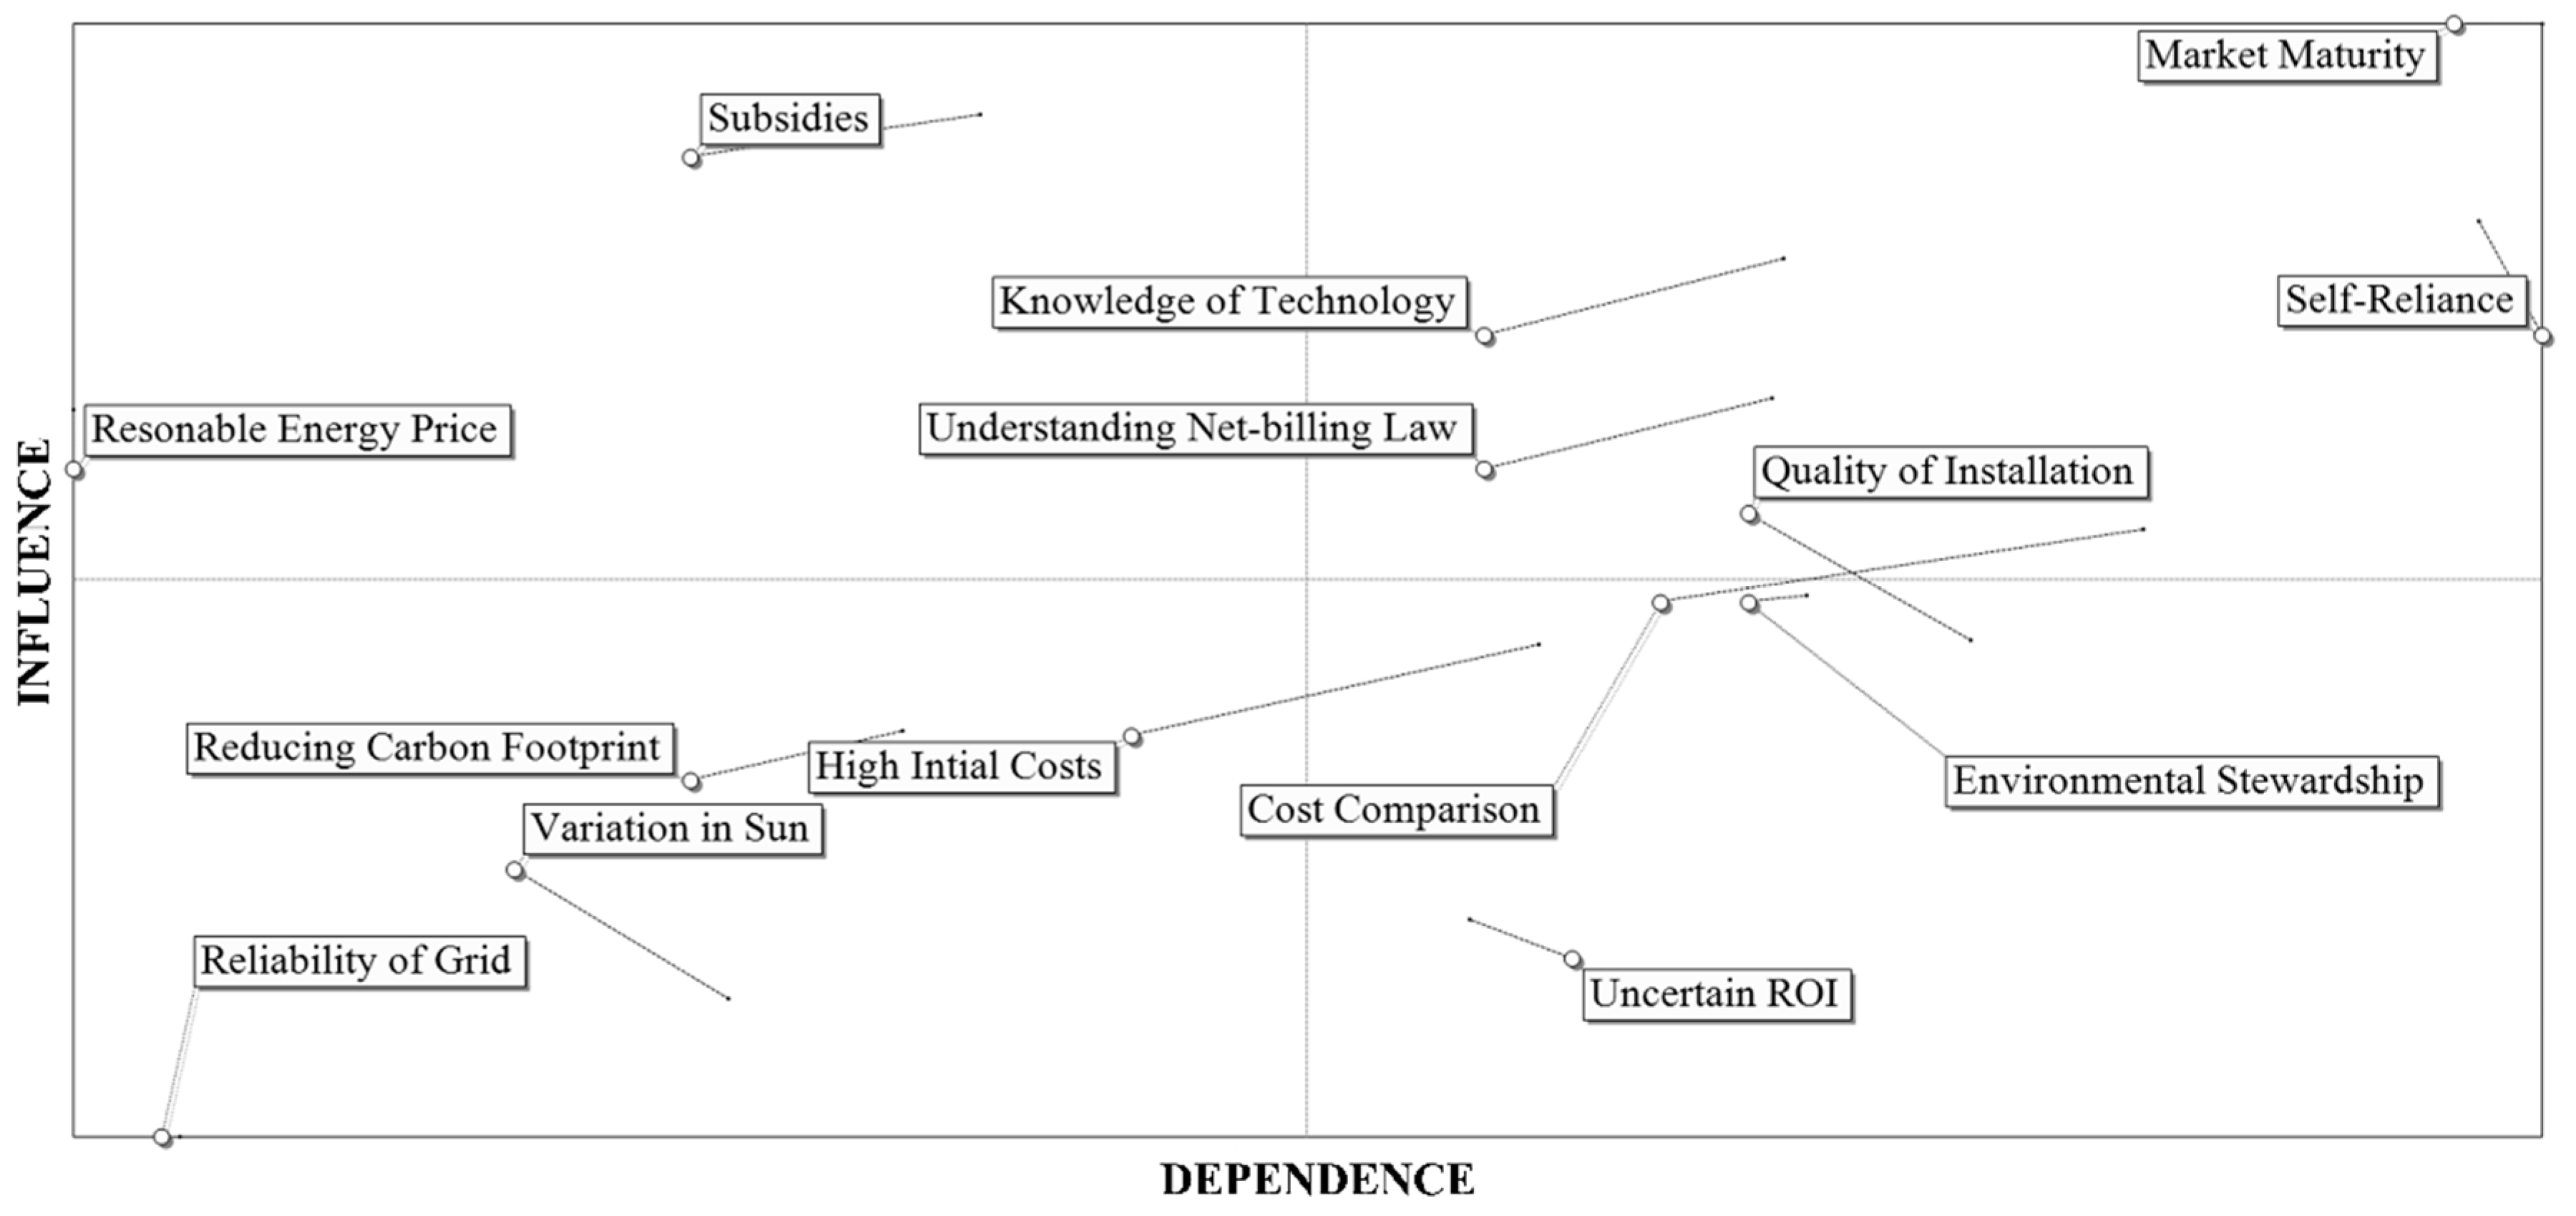
Data within the impact matrix (Table 2) allowed creation of an influence map (Figure 3), using LIPSOR-EPITA-MICMAC. This influence map was presented and explained to the experts in combination with the influence graph to illustrate and provoke discussion of factor importance on future household solar adoption in Santiago. In the influence map, indirect MICMAC displacements are noted with dashed lines extending from a dot. Displacements infer the extent of change in influence of each factor by comparing the direct influences to the indirect influences using MICMAC calculations. As noted on the figure, the vertical axis is a measure of the relative influence of one factor on other factors, meaning the factors that appear higher up on the figure are more influential in the system. For example, Market Maturity is expected to be particularly influential on solar adoption. In contrast, the horizontal axis is an indication of the relative dependence of each factor on other factors, meaning the factors that appear further right on the figure are the most dependent on other factor influences. As indicated in the map, a household’s desire for energy independence (Self-reliance) is expected to be particularly influenced by other factors. Interestingly, the most dependent factors (Market Maturity and Self-reliance) are also the most influential (relay factors). This denotes a level of instability in both of these factors; creating the most efficient leverage points for influencing overall system behavior. Making a change in influent factors such as subsidies would influence both Market Maturity and Self-reliance. This in turn would have downstream, systemic impacts on the other factors as a result of both factor’s high relative influence. Factors appearing in the lower-left quadrant (Grid Reliability, Daily Insolation Variation; autonomous factors) are reasonably stable with negligible influence on solar adoption, while factors in the lower right quadrant (Uncertain Return on Investment (ROI), Cost Comparison, and Environmental Stewardship; result or outcome factors) remain stable and dependent on other more influential factors. It is important to emphasize, however, that lower quadrant factors are not necessarily unimportant to the outcome of household solar adoption, but instead that their influence on outcomes may be lower compared to other factors. As we might expect, the low level of result factors in the model (factors with high dependence and low influence) reveals a high level of interdependence between factors.
The relative displacement of each factor may be interpreted as an indication of how each factor behaves in the wider system; in other words, its influence may be magnified or tempered depending on how it interacts with other factors. In this analysis, High Initial Costs, Cost Comparison, Understanding Net-billing Law, and Knowledge of Technology have the greatest displacements. Except for Cost Comparison and Daily Insolation Variation, all of these shift to become more influential on system outcomes, while nearly all also become more dependent. This shows a shift over time in the volatility of nearly all factors when considering indirect interaction and feedback inferring a higher level of complexity in policy and practice as time goes on.
5. Discussion
We begin the discussion section by describing how the expert participants interpreted the MICMAC model outputs, and their knowledge gained from the workshop. We then discuss the results as they relate to factor impacts on solar adoption for the short and long term. We finish by recommending an agenda for both short- and long-term policy and action for household solar programs in Santiago, supported by the solar diffusion literature.
5.1. Experts’ Interpretation of Results
Upon presentation of the full model influence graph, the experts unanimously agreed that they were “humbled” at seeing the mass of interdependent factors. Apart from this formative realization, the majority of system knowledge was obtained through analysis and interpretation of the influence map. Expert discussion on the influence map focused on two principle model insights which one expert described as “pillars” for successful household adoption. These two pillars were attractive subsidies and knowledge diffusion.
Based on the influence map, Subsidies (the availability of subsidies to finance the initial installation of the PV system) was the influent factor with the highest overall influence; implying a leverage point for system change. This interconnection between subsidies and other influential factors was indicated by an expert who remarked “the maturity of the market is propelled by subsidies from the state, promoting in large part improvements in the knowledge of the people, which causes a demand.” Referring to the influence map, the experts agreed that Market Maturity was both the most influential (high impact on diffusion) and the most dependent factor (impacted by other factors), which they acknowledged had a high potential for rippling effects throughout the factor system. This shifted the conversation to discussion on what a mature market for household solar in Santiago would look like. The experts highlighted market fortification through developing lists of skilled installers, companies, and prices to enable cost comparisons to increase consumer knowledge on technologies and services. They mentioned a practical step forward as educating and training local private energy suppliers and PV installation companies about PV. One expert mentioned this could extend past PV suppliers and installers to include conventional service personnel such as those in charge of air-conditioning system installation and repair, helping disseminate information to households on energy savings and benefits from installing a PV system. Experts also noted that households within a mature market would be better informed as to what they wanted to purchase. For example, one installer noted that they sold one PV system for every 100 price quotes. This participant perceived this as an indication of an immature market, where consumers do not know what is possible nor yet what they wanted from a PV system.
Conversation transitioned to discussion on the critical need for information diffusion to potential household customers. Experts noted that the influence map showed a large concentration of relay factors (both influential and dependent) related to consumer knowledge for decision support (Cost Comparison, Knowledge of Technology, Understanding Net-billing Law). This sparked discussion on a recent 100 kW PTSP (Plan Techo Solar Público) project installed on the roof of the Gabriela Mistra Cultural Center (GAM, Santiago, Chile), which the experts agreed was a successful step towards improved consumer awareness. As one expert mentioned, “no one in Santiago wants to read about solar—they want to see it”. However, for the most part, discussion regarding PTSP was not positive, indicating that it “lacked sufficient thrust” in promoting household solar by not intentionally targeting knowledge diffusion to potential household consumers. Instead, experts suggested demonstrations in schools, newspaper advertisements, interactive screens reporting energy savings, and returns from installations, sponsoring competitions that incentivize the use of renewables, or developing a highly visible identifying marker for public buildings that have installed PV. The overall outcome from this discussion was that consumer knowledge on PV technology was the most important yet underutilized leverage point for adoption.
Experts also noted aspects of the final model that accurately described the Santiago context, thereby supporting their confidence in the model outputs. For example, experts confirmed that public confidence in the electrical grid (Grid Reliability) should emerge as unimportant, as the Santiago grid is highly reliable and would not be expected to motivate the public. Experts noted that they had previously suspected education was an important and underemphasized component of PV promotion and adoption, an affirmed insight by the model that was seen as validating the results. The relative unimportance of High Initial Costs also made sense to the experts, despite the previous results from the Walters et al. [26] study (along with most in the sector) that indicated that high initial cost and other associated financial factors were the principal barriers for adoption of household solar. Conversely, the experts agreed that Santiago households looking to invest in solar were less swayed by initial costs, and were more influenced by an awareness of the technology itself. In addition, the results showed that environmental motivations are secondary to others when households make energy decisions. This aligned with the expert’s intuition on how environmental motivations often “piggy-back” on other more important drivers of adoption.
Experts indicated the modeling session was both illuminating and refreshing, as it provided an open forum between peers in a structured format that allowed for a systematic consideration of factors with clear, actionable outputs and interpretations. One expert remarked that the workshop showed him that he and his colleagues were more aligned on important steps forward than he had once thought. Our primary observation of the MICMAC workshop was that it allowed experts to target their discussions and discover key priorities for policy and action (subsidies and knowledge diffusion) amid the many competing factors. This shows both the utility and potential of the MICMAC approach for household solar PV adoption for different regional and country contexts.
5.2. Recommendations for Household Solar Diffusion in Santiago
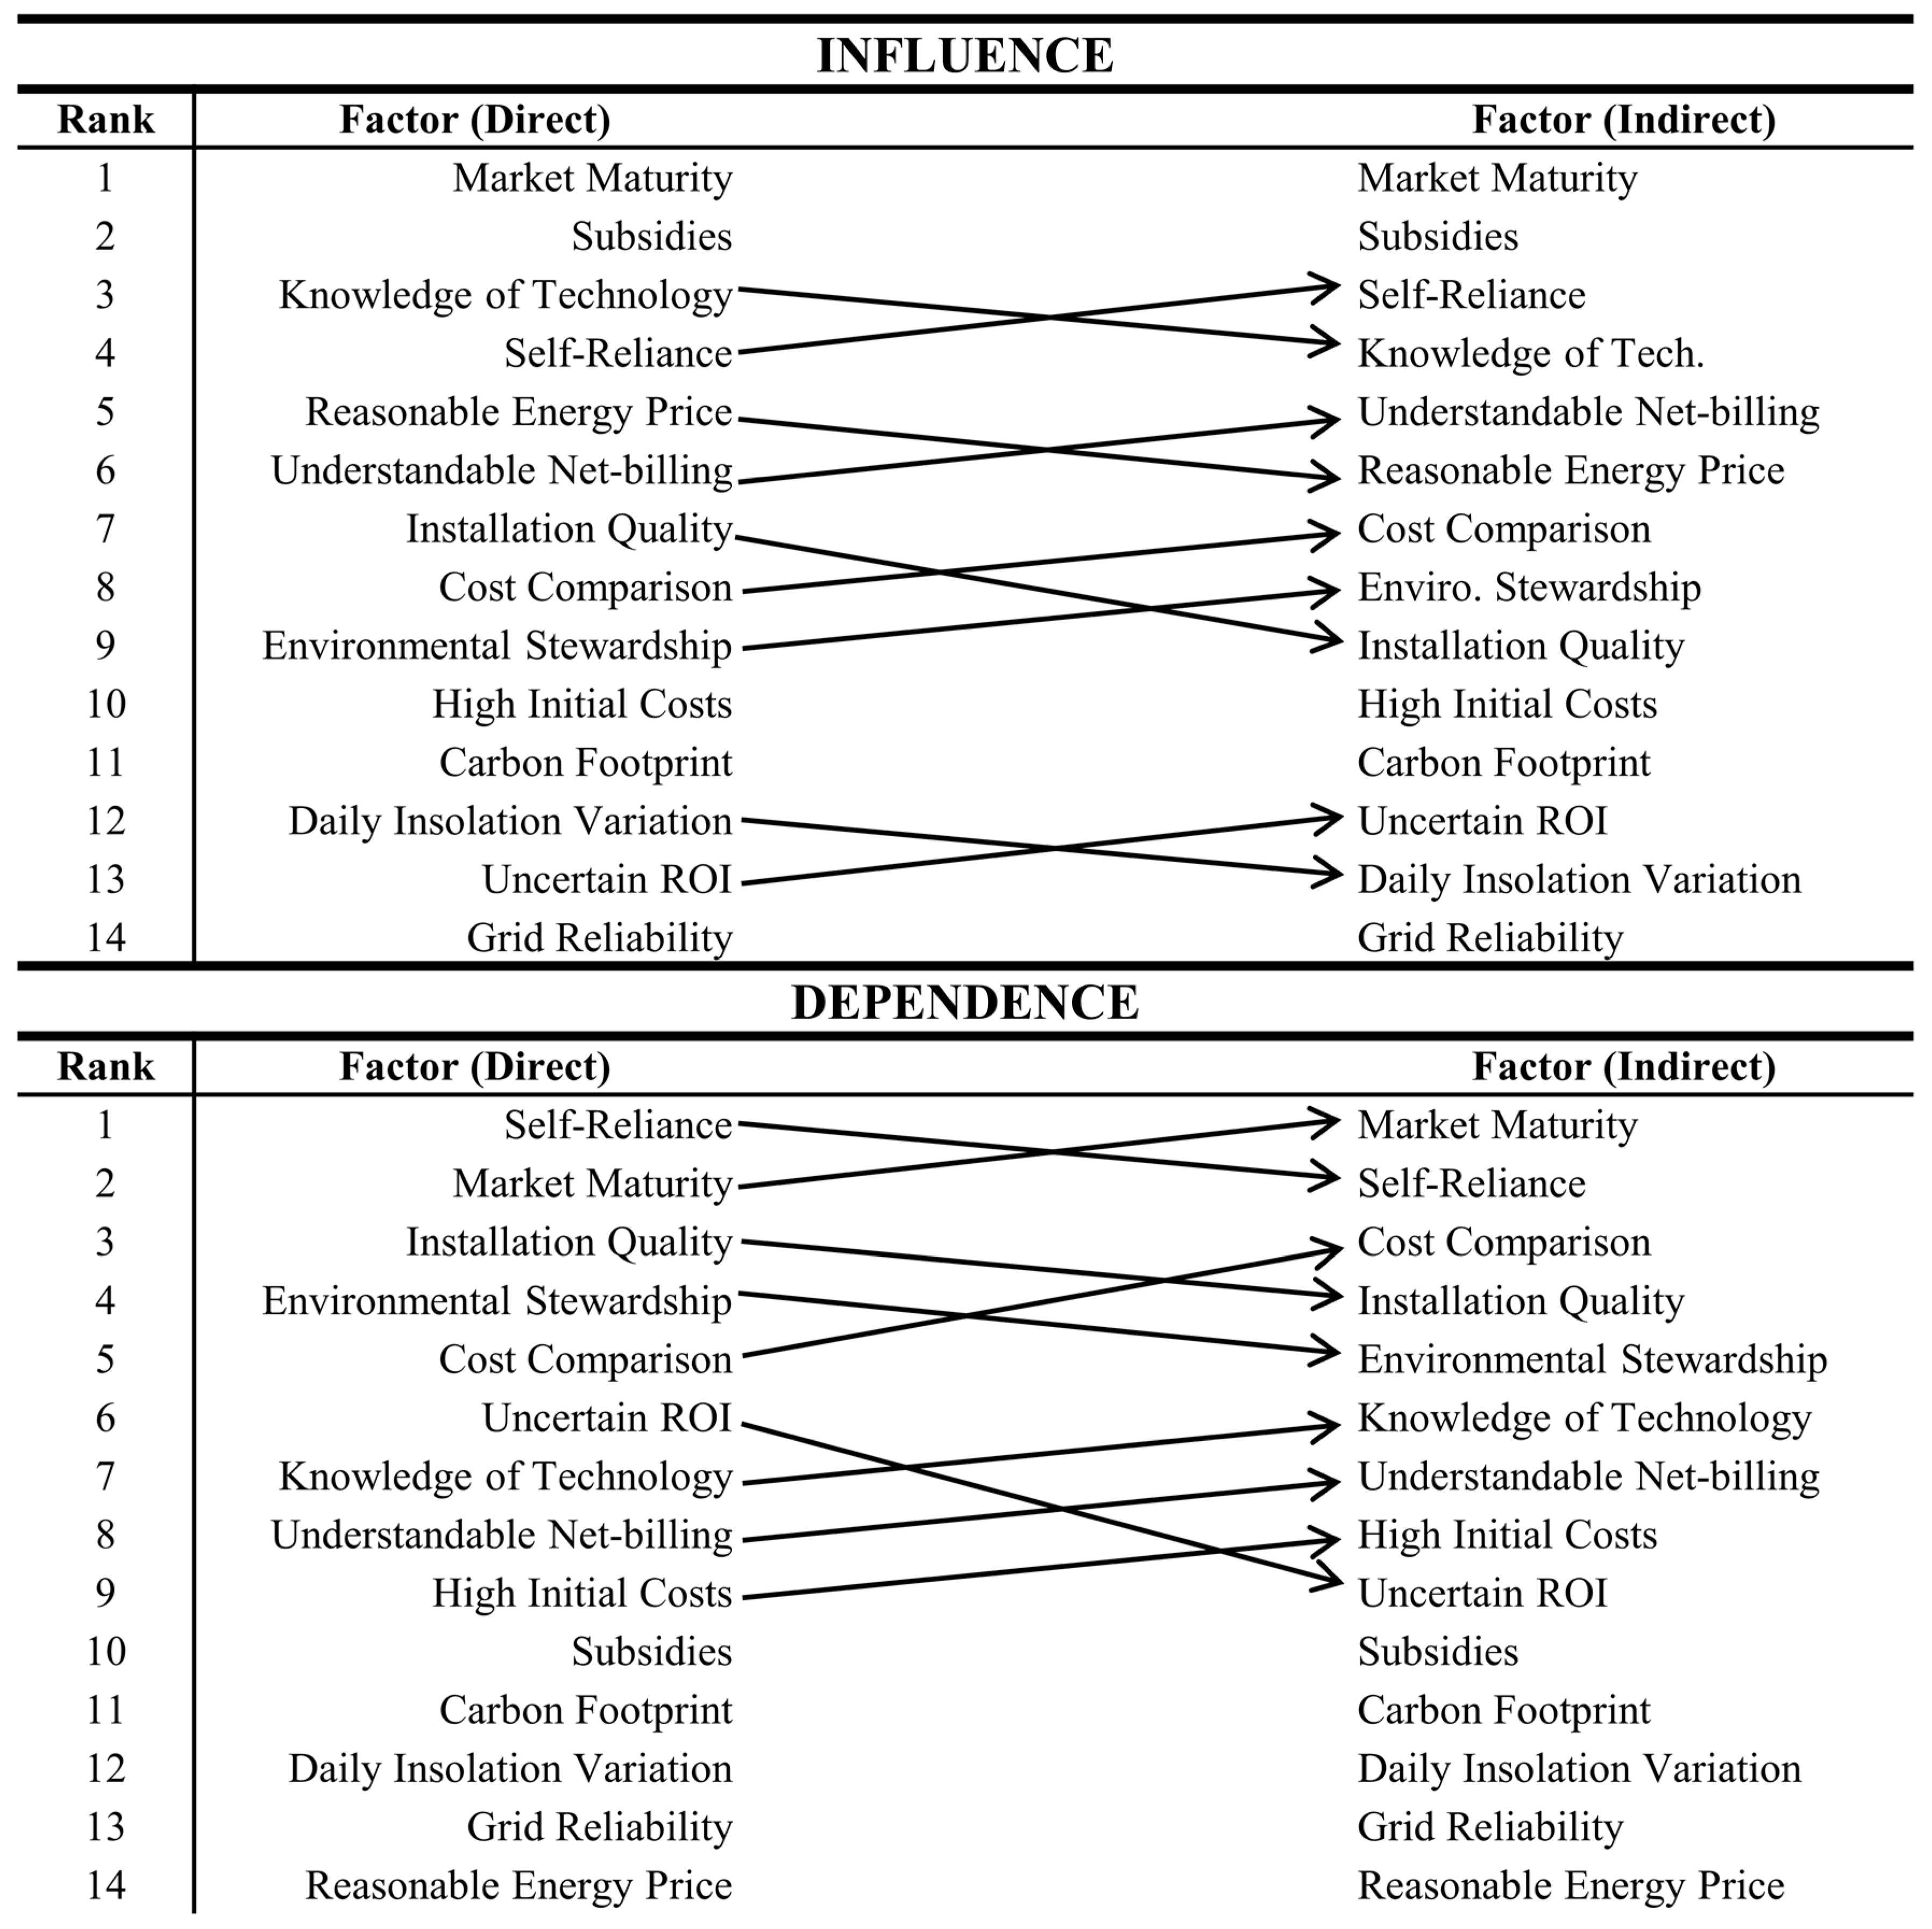
Further analysis of the results in combination with expert observations offers insights into solar PV adoption in Santiago regarding influential factors (research question 1), and points to short- and long-term areas for policy focus (research question 2) and strategic action (research question 3). MICMAC outputs offer a means to visually and quantitatively evaluate areas in the system in which to intervene and to infer which system components will evolve most over time. It is also possible to rank and prioritize both factor influence, dependence, and shifts over time, as inferred through indirect interactions and feedback (circular causality) from the impact matrix manipulation in the MICMAC analysis. These rankings and shifts (direct versus indirect) are shown within the re-ranking chart in Figure 4. Shifts are assumed to take place over time; however, the exact time must be assumed. For our purposes, we classify direct influence and dependence between factors as drivers of short-term solar uptake and resulting outcomes. In a similar way, indirect interactions between factors, derived from the MICMAC analysis, are drivers of long-term, sustained diffusion outcomes.
5.2.1. Short-Term: Initial Uptake
Looking at direct factor interaction reveals that the most influential factors for short-term diffusion are Market Maturity, Subsidies, and Knowledge of Technology. While Market Maturity is the most influential factor, it is not something that can be quickly or easily influenced by policy, given its abstract nature and high dependence on other factors. Thus, the best way to influence this contextual factor is indirectly, through other factors that the MICMAC model shows us are likely to be influential. Indeed, the model shows that Market Maturity has the highest dependence on other factors of any factor in the model. This can be seen in Table 2, which shows that High Initial Costs, Subsidies, Reasonable Energy Price, Cost Comparison, Knowledge of Technology, Installation Quality, and Self-reliance all have a strong (score of 3) influence on Market Maturity. This suggests that a focus on these factors will serve to advance the solar market in Santiago, and should be impactful components of short-term policy efforts. In turn, these efforts will provide the technical and institutional infrastructure to support long-term diffusion (discussed further below).
One of the influential short-term targets, Subsidies, emerged as having the second-highest overall system influence and overall low dependence on other factors. For policy makers, this suggests that providing attractive subsidies is a potentially important short-term systems leverage point that could build a healthy environment for market development. While the Chilean government has tended to avoid government subsidies for residential infrastructure programs [43], the MICMAC data support the idea that federal tax credits or other forms of subsidies could provide a strong motivation to households. We note, however, that subsidies are not always an ideal option to promote adoption because of their questionable efficacy in spurring diffusion [51], a high cost and burden on the taxpayer [51], as well as having the potential to disproportionately benefit the wealthy [52]. It is also possible a supply-side bias among the experts in this study may have driven their recommendations of subsidies. Instead, narrowing the gap between retail energy- and excess energy-generation rates (in Santiago, injection rates are currently half the retail rate) through either net-metering or feed-in tariff schemes, could shorten payback periods and more equitably incentivize households to invest [26,37,47,48]. Furthermore, if Chile imposes higher carbon taxes we would expect the economic incentive, both from the higher retail cost of electricity and higher injection rates, to further drive household investment in solar PV. A recent study by Benavidas et al. [36] predicts the LCE of coal technology in Chile will equal the LCE of solar PV (100 US$/MWh) if carbon taxes are greater than 30 US$/tCO2e. In the event that carbon taxes reach this level, we would expect precipitous impacts on electricity prices and a driving incentive for households to invest in solar.
Two of the other influential short-term factors (Knowledge of Technology and Cost Comparison) represent consumer knowledge. This suggests that consumer knowledge is another accessible systems leverage point with high influence on diffusion outcomes. For Santiago in particular, this is a logical result; as consumers become more aware of the favorable conditions for PV in Santiago, we would expect them to be more likely to adopt the technology. Regarding methods for this knowledge diffusion, the experts suggested thoughtfully displaying the attractive returns from excess generation at schools, within newspapers, and through sponsored competitions. A similar model to public solar PV display by the Ministry of Energy PTSP program could be applied for selected households to improve visibility and exploit peer effects and desire for self-reliance [53,54,55,56]. Another option could be the development of an internet-based platform to perform quick and easy installer and solar PV system cost comparisons (e.g., www.energysage.com, www.solarchoice.net.au). In sum, for the short term, likely leverage points for policy promoting diffusion within a continually maturing solar market for household PV technologies in Santiago would focus on subsidies and make information more available to customers [57].
5.2.2. Long-Term: Sustained Diffusion
Analysis of indirect influences through the MICMAC process yields insights into policy focus for long-term strategies by comparing factor influence and dependence between the original (direct) and iteratively multiplied (indirect) impact matrices. As previously mentioned, influence and dependence values, both for the original and MICMAC impact matrices, are calculated by summing row and column influences, respectively. With these calculations performed, Figure 4 shows the relative influence and dependence of factors before (direct: shorter-term strategies) and after (indirect: long-term strategies) MICMAC analysis. We see in the figure that some factors retain their key positions of influence and dependence over time; for example, the results imply the continued importance of ongoing innovation to offer attractive subsidies. Market Maturity also retains its high level of influence and dependence, again showing that it cannot be readily shaped by policy and, instead, is an indirect result of influencing other areas in the system. Other factors also shift in influence and dependence when indirect interactions are considered. For example, we see an increase in influence of Environmental Stewardship, Understanding of Net-billing, Self-reliance and Cost Comparison. We also see that these factors, for the most part, maintain their highly ranked levels of dependency, which shows the existence of circular causality or feedback. Of particular interest is the factor Self-reliance, which moves up in influence yet persists as the highest ranked factor in dependence over time. In fact, over time, two of the three most influential factors (Self-reliance and Market Maturity) are most readily influenced indirectly. As such, the model structure shows that they form key parts of system feedback loops. For example, the model suggests that an improved household understanding of the net-billing law would lead to future consumers who are more strongly motivated by energy independence. These same customers would be further empowered by a mature market that offers a diverse assortment of funding schemes, such as third party ownership or leasing [58] in conjunction with long-term maintenance programs that, in turn, would decrease consumer uncertainty and improve system functionality and longevity [53]. In sum, the model shows a subsequent rippling effect of sustained diffusion, where a stronger desire for energy independence, and a means to do so, fuels a solar market that continues to evolve and promote further household investment in solar PV.
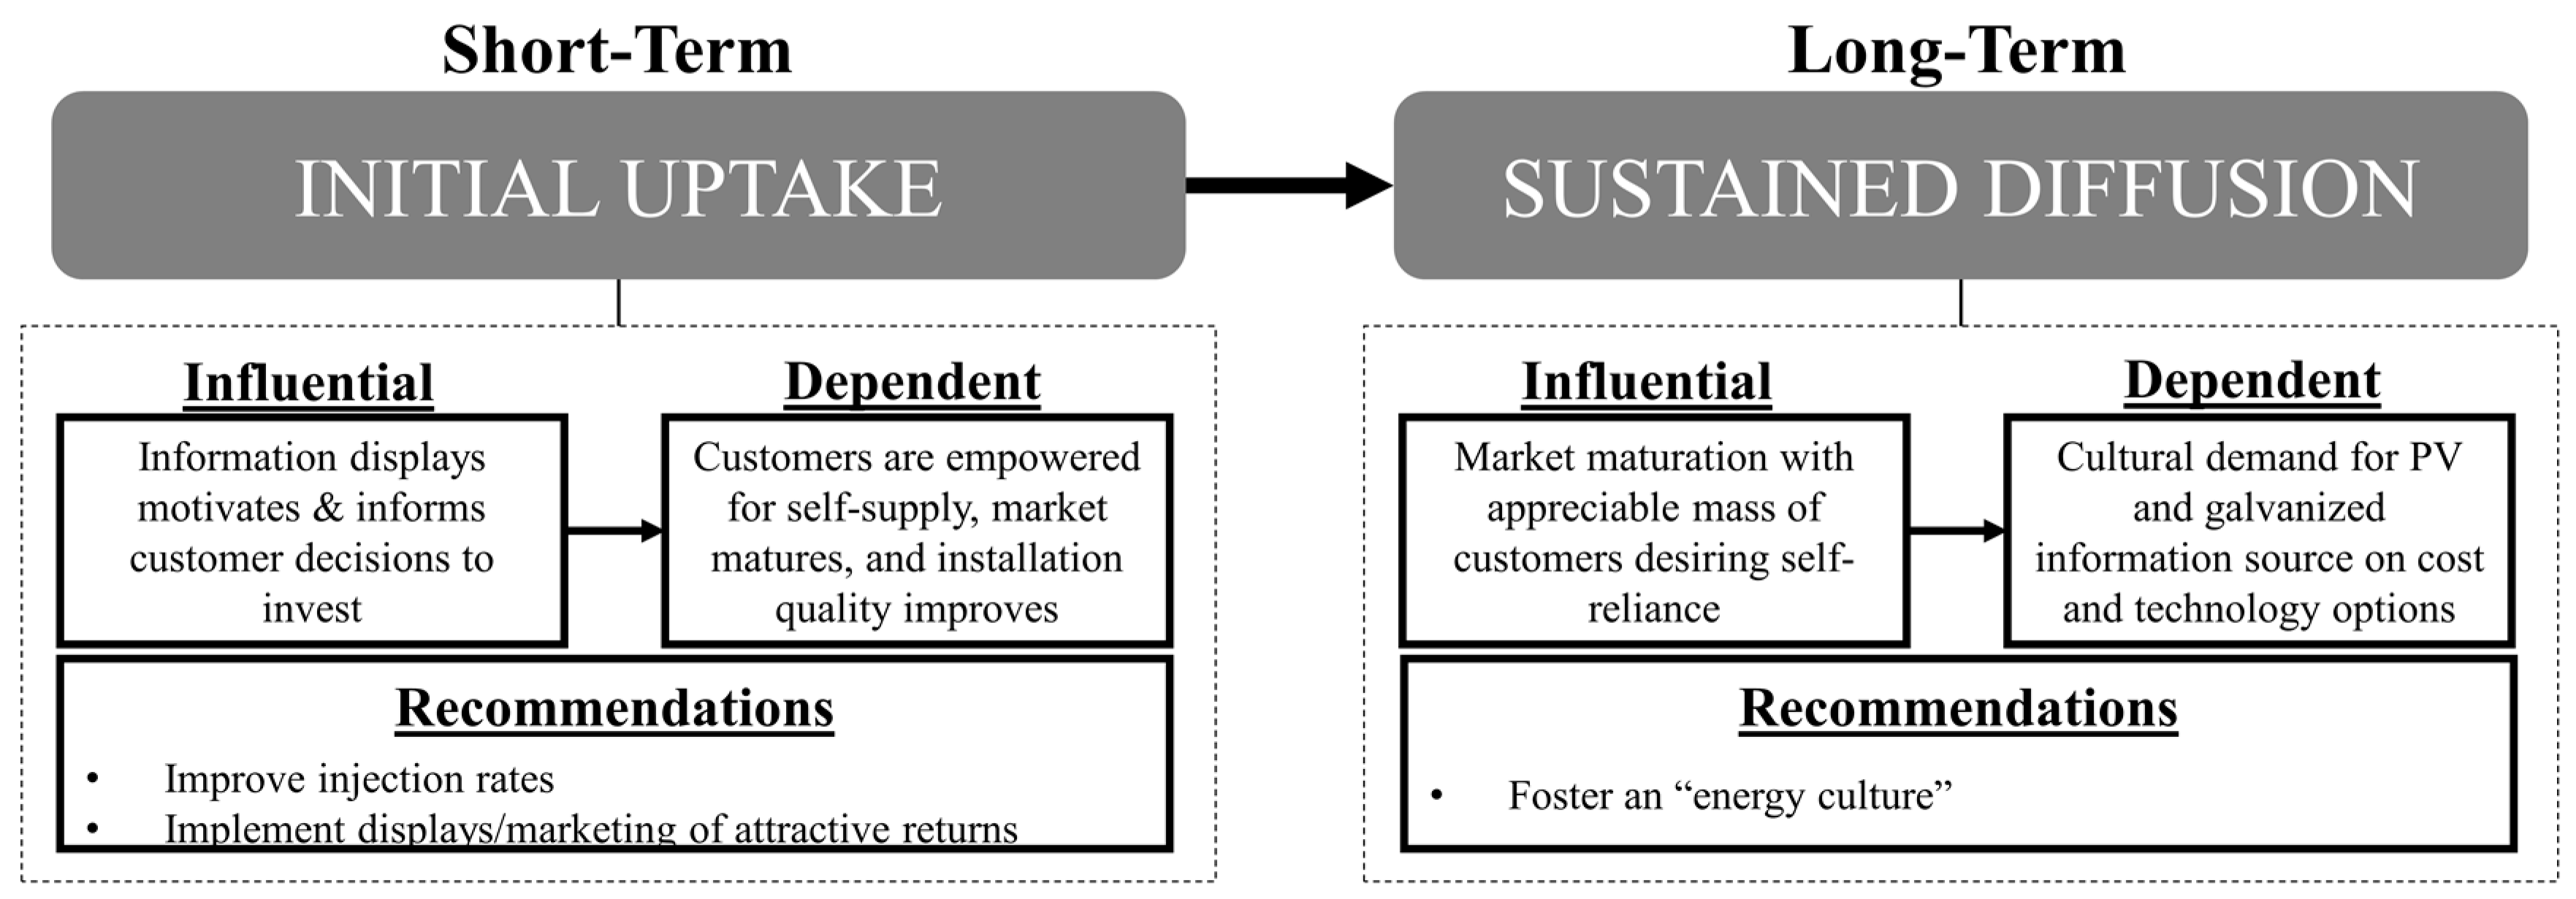
These dynamic insights point to the need for policy that cultivates a self-sustaining culture for solar PV. The literature also supports this. For example, Stephenson et al. [17,59] highlight the importance of championing an “energy culture”, comprised of the intermingling between household practices and norms and the availability of quality PV technology. In the model mapped here, these key components of an energy culture can be seen as part of both direct and indirect influences and feedback between a desire for energy independence (Self-reliance) and the enabling environment of the solar market (Mature Market). The MICMAC model demonstrates that short- and long-term policies exist within an interconnected system, meaning policy can be structured to both incite initial uptake and also promote sustained diffusion. In Santiago, short-term strategies (attractive subsidies and knowledge diffusion) link to establishing a mature solar market that emphasizes self-reliance as a means to develop cultural change (energy culture) towards solar (Figure 5).
5.3. Study Limitations
Limitations in research design potentially limit the generalizability of these results. First, we note an important limitation in the data, as it was based upon experts and not the households themselves. Second, all of the experts were male. While this represents an unfortunate bias in our collected data, it reflects the pool of individuals who met the study criteria as experts and the local industry demographics; for example, 93% of the identified pool of experts were male. Beyond gendered perspectives, any data collection effort that is founded on an expert panel is inherently limited to the knowledge of the participants. As described above, the expertise represented by this group was substantial; however, it is likely that additional people would have contributed other insights and further enriched the system representation. Still, there were no factors on which the experts were unable to come to agreement, and this is a good indication that the system model is a fair representation of the Santiago context. A linked limitation is that the systems model used just 14 factors to represent a complex reality. This type of simplification is unfortunately inherent to any model-building exercise. We addressed this limitation by selecting the factors based on literature, using local knowledge, and the work of Walters et al. [26]. By doing so, we modeled the most locally important influences in the system. This enabled us to target leverage points where policy or technical intervention may be able to substantially influence the system.
6. Conclusions
This paper makes three contributions to household solar-diffusion research and practice. The first is the presentation of the MICMAC research method, which rigorously integrates expert knowledge in an accessible and actionable systems model. This has the joint benefits of enabling researchers to study system complexity, and of enabling local decision-makers to discover practical leverage points that support effective policymaking. While MICMAC has been used previously to conduct high-quality energy research, to the best of our knowledge the existing works do not fully leverage the method’s potential to describe system feedback and evolution. In addition, the MICMAC method has never been applied to increasing knowledge regarding the diffusion of household solar PV systems. Given the accessible and adaptive nature of the approach, we anticipate that its application within different demographic, geographic and market contexts would afford similar levels of policy insights regarding the complex drivers of household solar adoption.
The second contribution is a demonstration of the MICMAC approach applied in the context of Santiago, Chile. In Santiago, we interpret influential and dependent factors as the interconnected social, cultural, institutional, technical and economic externalities that drive, and are driven by, the efficacy and scale of diffusion. The results presented here show a strong multifarious influence between market maturity and subsidies, consumer knowledge of PV system technology and cost, and consumer desire for grid independence or self-reliance. Evaluation of the direct influence and the dependence of factors offers insights for short-term strategies, namely focusing on solar programs to improve both customer knowledge and awareness. For the particular context of Santiago, Chile, examples of short-term strategies would be to provide customers easily digestible information to compare and contrast different types of solar-technology solution demonstrations and improve injection rates. These, coupled with other short-term strategies of attractive financial incentives and improving the quality of installation services, can aid solar-market maturation. Similarly, evaluation of indirect influences (influence chains and feedback) offered insights on how long-term strategies would leverage short-term strategies to strengthen market maturation, thus allowing consumers who desire self-reliance or energy independence sufficient opportunities to do so. The process-based nature of these recommendations shows the core utility of the approach in offering insights on leverage points that influence short- and long-term system evolution, enabling the creation of a systems continuum for sustained household diffusion.
Finally, the third contribution analytically generalizes the particular case study results by linking them back to the literature. At the highest level, the collected data show the extent of interdependencies of factors influencing the diffusion of household solar-electricity systems. The results support the existing literature, which indicates adoption results from a myriad of interconnected socio-economic, technical and institutional factors. This study also demonstrates effective leverage points vary depending on the extent of technology diffusion and institutionalization. While future research in different contexts is needed to determine locally important factors, the evidence presented here empirically indicates the importance of determining how those factors interact in practice. As such, this analysis provides insight into adoption complexity through analysis of factors as a system.
Acknowledgments
We would like to thank the eight experts who graciously spent many hours with us to share their knowledge. We would also like to thank Claudio Huepe, the Center of Energy and Sustainable Development, and the Civil Engineering Department at Universidad Diego Portales for providing material and logistical support for the workshop.
Author Contributions
We use the CRediT Taxonomy to describe author contributions. Jeffrey Walters led the research conceptualization, data collection and curation, methodology, project administration, formal analysis, the creation of visualizations, and the structure of the original manuscript draft. Jeffrey Walters and Jessica Kaminsky shared project supervision. Jessica Kaminsky was also responsible for methodology and funding acquisition. All authors were instrumental in project conceptualization, formal analysis, and preparation of the original draft, review, and manuscript editing.
Conflicts of Interest
The authors declare no conflict of interest.
References
- Bilen, K.; Ozyurt, O.; Bakırcı, K.; Karslı, S.; Erdogan, S.; Yılmaz, M.; Comaklı, O. Energy production, consumption, and environmental pollution for sustainable development: A case study in Turkey. Renew. Sustain. Energy Rev. 2008, 12, 1529–1561. [Google Scholar] [CrossRef]
- Intergovernmental Panel on Climate Change. Climate Change 2014: Synthesis Report; Pachauri, R.K., Mayer, L., Intergovernmental Panel on Climate Change, Eds.; Intergovernmental Panel on Climate Change: Geneva, Switzerland, 2015; ISBN 978-92-9169-143-2. [Google Scholar]
- Environmental Protection Agency. Environmental Protection Agency (EPA) Sources of Greenhouse Gas Emissions 2017; Environmental Protection Agency: Washington, DC, USA, 2017. [Google Scholar]
- International Energy Agency. International Energy Agency (France) World Energy Outlook 2014 Factsheet 2014; International Energy Agency: Paris, France, 2014. [Google Scholar]
- Sovacool, B.K. How long will it take? Conceptualizing the temporal dynamics of energy transitions. Energy Res. Soc. Sci. 2016, 13, 202–215. [Google Scholar] [CrossRef]
- Grubler, A. Energy transitions research: Insights and cautionary tales. Energy Policy 2012, 50, 8–16. [Google Scholar] [CrossRef]
- Edenhofer, O.; Pichs-Madruga, R.; Sokona, Y. Renewable Energy Sources and Climate Change Mitigation: Summary for Policymakers and Technical Summary: Special Report of the Intergovernmental Panel on Climate Change; Cambridge University Press: New York, NY, USA, 2011; ISBN 978-92-9169-131-9. [Google Scholar]
- Zahedi, A. A review of drivers, benefits, and challenges in integrating renewable energy sources into electricity grid. Renew. Sustain. Energy Rev. 2011, 15, 4775–4779. [Google Scholar] [CrossRef]
- Sovacool, B.K. Rejecting renewables: The socio-technical impediments to renewable electricity in the United States. Energy Policy 2009, 37, 4500–4513. [Google Scholar] [CrossRef]
- Del Río, P.; Cerdá, E. The policy implications of the different interpretations of the cost-effectiveness of renewable electricity support. Energy Policy 2014, 64, 364–372. [Google Scholar] [CrossRef]
- Nelson, H.T. Planning implications from the interactions between renewable energy programs and carbon regulation. J. Environ. Plan. Manag. 2008, 51, 581–596. [Google Scholar] [CrossRef]
- Tsao, C.C.; Campbell, J.E.; Chen, Y. When renewable portfolio standards meet cap-and-trade regulations in the electricity sector: Market interactions, profits implications, and policy redundancy. Energy Policy 2011, 39, 3966–3974. [Google Scholar] [CrossRef]
- Devine-Wright, P. Beyond NIMBYism: Towards an integrated framework for understanding public perceptions of wind energy. Wind Energy 2005, 8, 125–139. [Google Scholar] [CrossRef]
- Devine-Wright, P. Public engagement with large-scale renewable energy technologies: Breaking the cycle of NIMBYism: Breaking the cycle of NIMBYism. Wiley Interdiscip. Rev. Clim. Chang. 2011, 2, 19–26. [Google Scholar] [CrossRef]
- Gottschamer, L.; Zhang, Q. Interactions of factors impacting implementation and sustainability of renewable energy sourced electricity. Renew. Sustain. Energy Rev. 2016, 65, 164–174. [Google Scholar] [CrossRef]
- Ford, R.; Walton, S.; Stephenson, J.; Rees, D.; Scott, M.; King, G.; Williams, J.; Wooliscroft, B. Emerging energy transitions: PV uptake beyond subsidies. Technol. Forecast. Soc. Chang. 2017, 117, 138–150. [Google Scholar] [CrossRef]
- Stephenson, J.; Barton, B.; Carrington, G.; Gnoth, D.; Lawson, R.; Thorsnes, P. Energy cultures: A framework for understanding energy behaviours. Energy Policy 2010, 38, 6120–6129. [Google Scholar] [CrossRef] [Green Version]
- Wüstenhagen, R.; Wolsink, M.; Bürer, M.J. Social acceptance of renewable energy innovation: An introduction to the concept. Energy Policy 2007, 35, 2683–2691. [Google Scholar] [CrossRef]
- Polatidis, H.; Haralambopoulos, D.A. Renewable energy systems: A societal and technological platform. Renew. Energy 2007, 32, 329–341. [Google Scholar] [CrossRef]
- Eswarlal, V.K.; Dey, P.K.; Shankar, R. Analysis of interactions among variables of renewable energy projects: A case study on renewable energy project in India. J. Sci. Ind. Res. 2011, 70, 713–720. [Google Scholar]
- Musango, J.K.; Brent, A.C. A conceptual framework for energy technology sustainability assessment. Energy Sustain. Dev. 2011, 15, 84–91. [Google Scholar] [CrossRef]
- Gaziulusoy, A.I. A conceptual systemic framework proposal for sustainable technology development: Incorporating future studies within a co-evolutionary approach. Civ. Eng. Environ. Syst. 2007, 25, 301–311. [Google Scholar] [CrossRef]
- Pruyt, E.; Thissen, W. Transition of the European electricity system and system of systems concepts. In Proceedings of the SoSE’07 IEEE International Conference on System of Systems Engineering, San Antonio, TX, USA, 16–18 April 2007; IEEE: Piscataway, NJ, USA, 2007; pp. 1–6. [Google Scholar]
- Meadows, D.H. Thinking in Systems: A Primer; Earthscan: London, UK, 2009; ISBN 978-1-84407-726-7. [Google Scholar]
- Dale, M.; Krumdieck, S.; Bodger, P. Global energy modelling—A biophysical approach (GEMBA) Part 2: Methodology. Ecol. Econ. 2012, 73, 158–167. [Google Scholar] [CrossRef]
- Walters, J.P.; Kaminsky, J.; Huepe, C. Factors Influencing Household Solar Adoption in Santiago, Chile. J. Constr. Eng. Manag. 2018, 144, 05018004. [Google Scholar] [CrossRef]
- Hallowell, M.R.; Gambatese, J.A. Qualitative research: Application of the Delphi method to CEM research. J. Constr. Eng. Manag. 2009, 136, 99–107. [Google Scholar] [CrossRef]
- De Almeida, L.; Fatima, M.; Caldas de Moraes, C.A. Diffusion of Emerging Technologies for Sustainable Development: Prospective Assessment for Public Policies. J. Technol. Manag. Innov. 2013, 8, 20. [Google Scholar]
- Wang, G.; Wang, Y.; Zhao, T. Analysis of interactions among the barriers to energy saving in China. Energy Policy 2008, 36, 1879–1889. [Google Scholar] [CrossRef]
- Ansari, M.F.; Kharb, R.K.; Luthra, S.; Shimmi, S.L.; Chatterji, S. Analysis of barriers to implement solar power installations in India using interpretive structural modeling technique. Renew. Sustain. Energy Rev. 2013, 27, 163–174. [Google Scholar] [CrossRef]
- Sindhu, S.; Nehra, V.; Luthra, S. Identification and analysis of barriers in implementation of solar energy in Indian rural sector using integrated ISM and fuzzy MICMAC approach. Renew. Sustain. Energy Rev. 2016, 62, 70–88. [Google Scholar] [CrossRef]
- Godet, M. MICMAC Methodology 2003. Available online: http://en.laprospective.fr/methods-of-prospective/softwares/59-micmac.html (accessed on 10 April 2018).
- Grágeda, M.; Escudero, M.; Alavia, W.; Ushak, S.; Fthenakis, V. Review and multi-criteria assessment of solar energy projects in Chile. Renew. Sustain. Energy Rev. 2016, 59, 583–596. [Google Scholar] [CrossRef]
- International Renewable Energy Agency. IRENA Renewable Energy Policy Brief: Chile; International Renewable Energy Agency: Abu Dhabi, UAE, 2015. [Google Scholar]
- Chilean Ministry of Energy. Chilean Ministry of Energy Agenda de Energía: Un Desafío País, Progreso Para Todos 2014; Chilean Ministry of Energy: Santiago, Chile, 2014. [Google Scholar]
- Benavides, C.; Gonzales, L.; Diaz, M.; Fuentes, R.; García, G.; Palma-Behnke, R.; Ravizza, C. The Impact of a Carbon Tax on the Chilean Electricity Generation Sector. Energies 2015, 8, 2674–2700. [Google Scholar] [CrossRef]
- Watts, D.; Valdés, M.F.; Jara, D.; Watson, A. Potential residential PV development in Chile: The effect of Net Metering and Net Billing schemes for grid-connected PV systems. Renew. Sustain. Energy Rev. 2015, 41, 1037–1051. [Google Scholar] [CrossRef]
- Chilean Ministry of Energy. Energy for the Future: National Energy Strategy 2012–2030; Chilean Ministry of Energy: Santiago, Chile, 2012. [Google Scholar]
- Cáceres, G.; Nasirov, S.; Zhang, H.; Araya-Letelier, G. Residential Solar PV Planning in Santiago, Chile: Incorporating the PM10 Parameter. Sustainability 2014, 7, 422–440. [Google Scholar] [CrossRef]
- Escobar, R.A.; Cortés, C.; Pino, A.; Pereira, E.B.; Martins, F.R.; Cardemil, J.M. Solar energy resource assessment in Chile: Satellite estimation and ground station measurements. Renew. Energy 2014, 71, 324–332. [Google Scholar] [CrossRef]
- Cordero, R.R.; Damiani, A.; Seckmeyer, G.; Jorquera, J.; Caballero, M.; Rowe, P.; Ferrer, J.; Mubarak, R.; Carrasco, J.; Rondanelli, R.; et al. The Solar Spectrum in the Atacama Desert. Sci. Rep. 2016, 6. [Google Scholar] [CrossRef] [PubMed] [Green Version]
- Hansen, L.; Lacy, V.; Glick, D. A Review of Solar PV Benefit & Cost Studies; Rocky Mountain Institute: Boulder, CO, USA, 2013. [Google Scholar]
- Barret, D.; Dabrowski, A.; Deo, S.; Rahman, S.; Selle, C. Market Analysis of Residential Solar in Chile: Current State, Opportunities, and Economic Impact Assessment; ACESOL Asociación Chilena de Energía Solar: Santiago, Chile; Michigan’s Ross School of Business: Ann Arbor, MI, USA, 2016. [Google Scholar]
- Chilean Ministry of Energy. Ministry of Energy Memoria Programa Techos Solares Públicos 2017; Chilean Ministry of Energy: Santiago, Chile, 2017. [Google Scholar]
- Arcade, J.; Godet, M.; Meunier, F.; Roubelat, F. Structural Analysis with the MICMAC Method & Actors’ Strategy with MACTOR Method, 3rd ed.; The Millennium Project: Futures Research Methodolog; American Council for the UNU: Washington, DC, USA, 2009. [Google Scholar]
- Duperrin, J.C.; Godet, M. SMIC 74–A Method for Constructing and Ranking Scenarios. Futures 1975, 7, 302–312. [Google Scholar] [CrossRef]
- Godet, M. Introduction to la prospective: Seven key ideas and one scenario method. Futures 1986, 18, 134–157. [Google Scholar] [CrossRef]
- Gordon, T.J.; Stover, J. Cross-impact analysis. In Handbook of Futures Research Methodology Versio; Greenwood Press: Westport, CT, USA, 2003; Volume 2. [Google Scholar]
- Scholz, R.; Tietje, T. Embedded Case Study Methods: Integrating Quantitative and Qualitative Knowledge; Sage Publications, Inc.: Thousand Oaks, CA, USA, 2002. [Google Scholar]
- Godet, M. From Anticipation to Action: A Handbook of Strategic Prospective; Future-Oriented Studies; UNESCO Pub.: Paris, France, 1994; ISBN 978-92-3-102832-8. [Google Scholar]
- Crago, C.L.; Chernyakhovskiy, I. Are policy incentives for solar power effective? Evidence from residential installations in the Northeast. J. Environ. Econ. Manag. 2017, 81, 132–151. [Google Scholar] [CrossRef]
- Borenstein, S. Private Net Benefits of Residential Solar PV: The Role of Electricity Tariffs, Tax Incentives, and Rebates. J. Assoc. Environ. Resour. Econ. 2017, 4, S85–S122. [Google Scholar] [CrossRef]
- Bollinger, B.; Gillingham, K. Peer Effects in the Diffusion of Solar Photovoltaic Panels. Mark. Sci. 2012, 31, 900–912. [Google Scholar] [CrossRef]
- Rai, V.; Reeves, D.C.; Margolis, R. Overcoming barriers and uncertainties in the adoption of residential solar PV. Renew. Energy 2016, 89, 498–505. [Google Scholar] [CrossRef]
- Rai, V.; Robinson, S.A. Effective information channels for reducing costs of environmentally-friendly technologies: Evidence from residential PV markets. Environ. Res. Lett. 2013, 8, 014044. [Google Scholar] [CrossRef]
- Baranzini, A.; Carattini, S.; Péclat, M. What Drives Social Contagion in the Adoption of Solar Photovoltaic Technology? Grantham Research Institute on Climate Change and the Environment: London, UK, 2017. [Google Scholar]
- Margolis, R.; Zuboy, J. Nontechnical Barriers to Solar Energy Use: Review of Recent Literature; National Renewable Energy Laboratory Golden: Lakewood, CO, USA, 2006. [Google Scholar]
- Davidson, C.; Steinberg, D.; Margolis, R. Exploring the market for third-party-owned residential photovoltaic systems: Insights from lease and power-purchase agreement contract structures and costs in California. Environ. Res. Lett. 2015, 10, 024006. [Google Scholar] [CrossRef]
- Stephenson, J.; Barton, B.; Carrington, G.; Doering, A.; Ford, R.; Hopkins, D.; Lawson, R.; McCarthy, A.; Rees, D.; Scott, M.; et al. The energy cultures framework: Exploring the role of norms, practices and material culture in shaping energy behaviour in New Zealand. Energy Res. Soc. Sci. 2015, 7, 117–123. [Google Scholar] [CrossRef] [Green Version]
Figure 1.
Research plan and methodological framework.
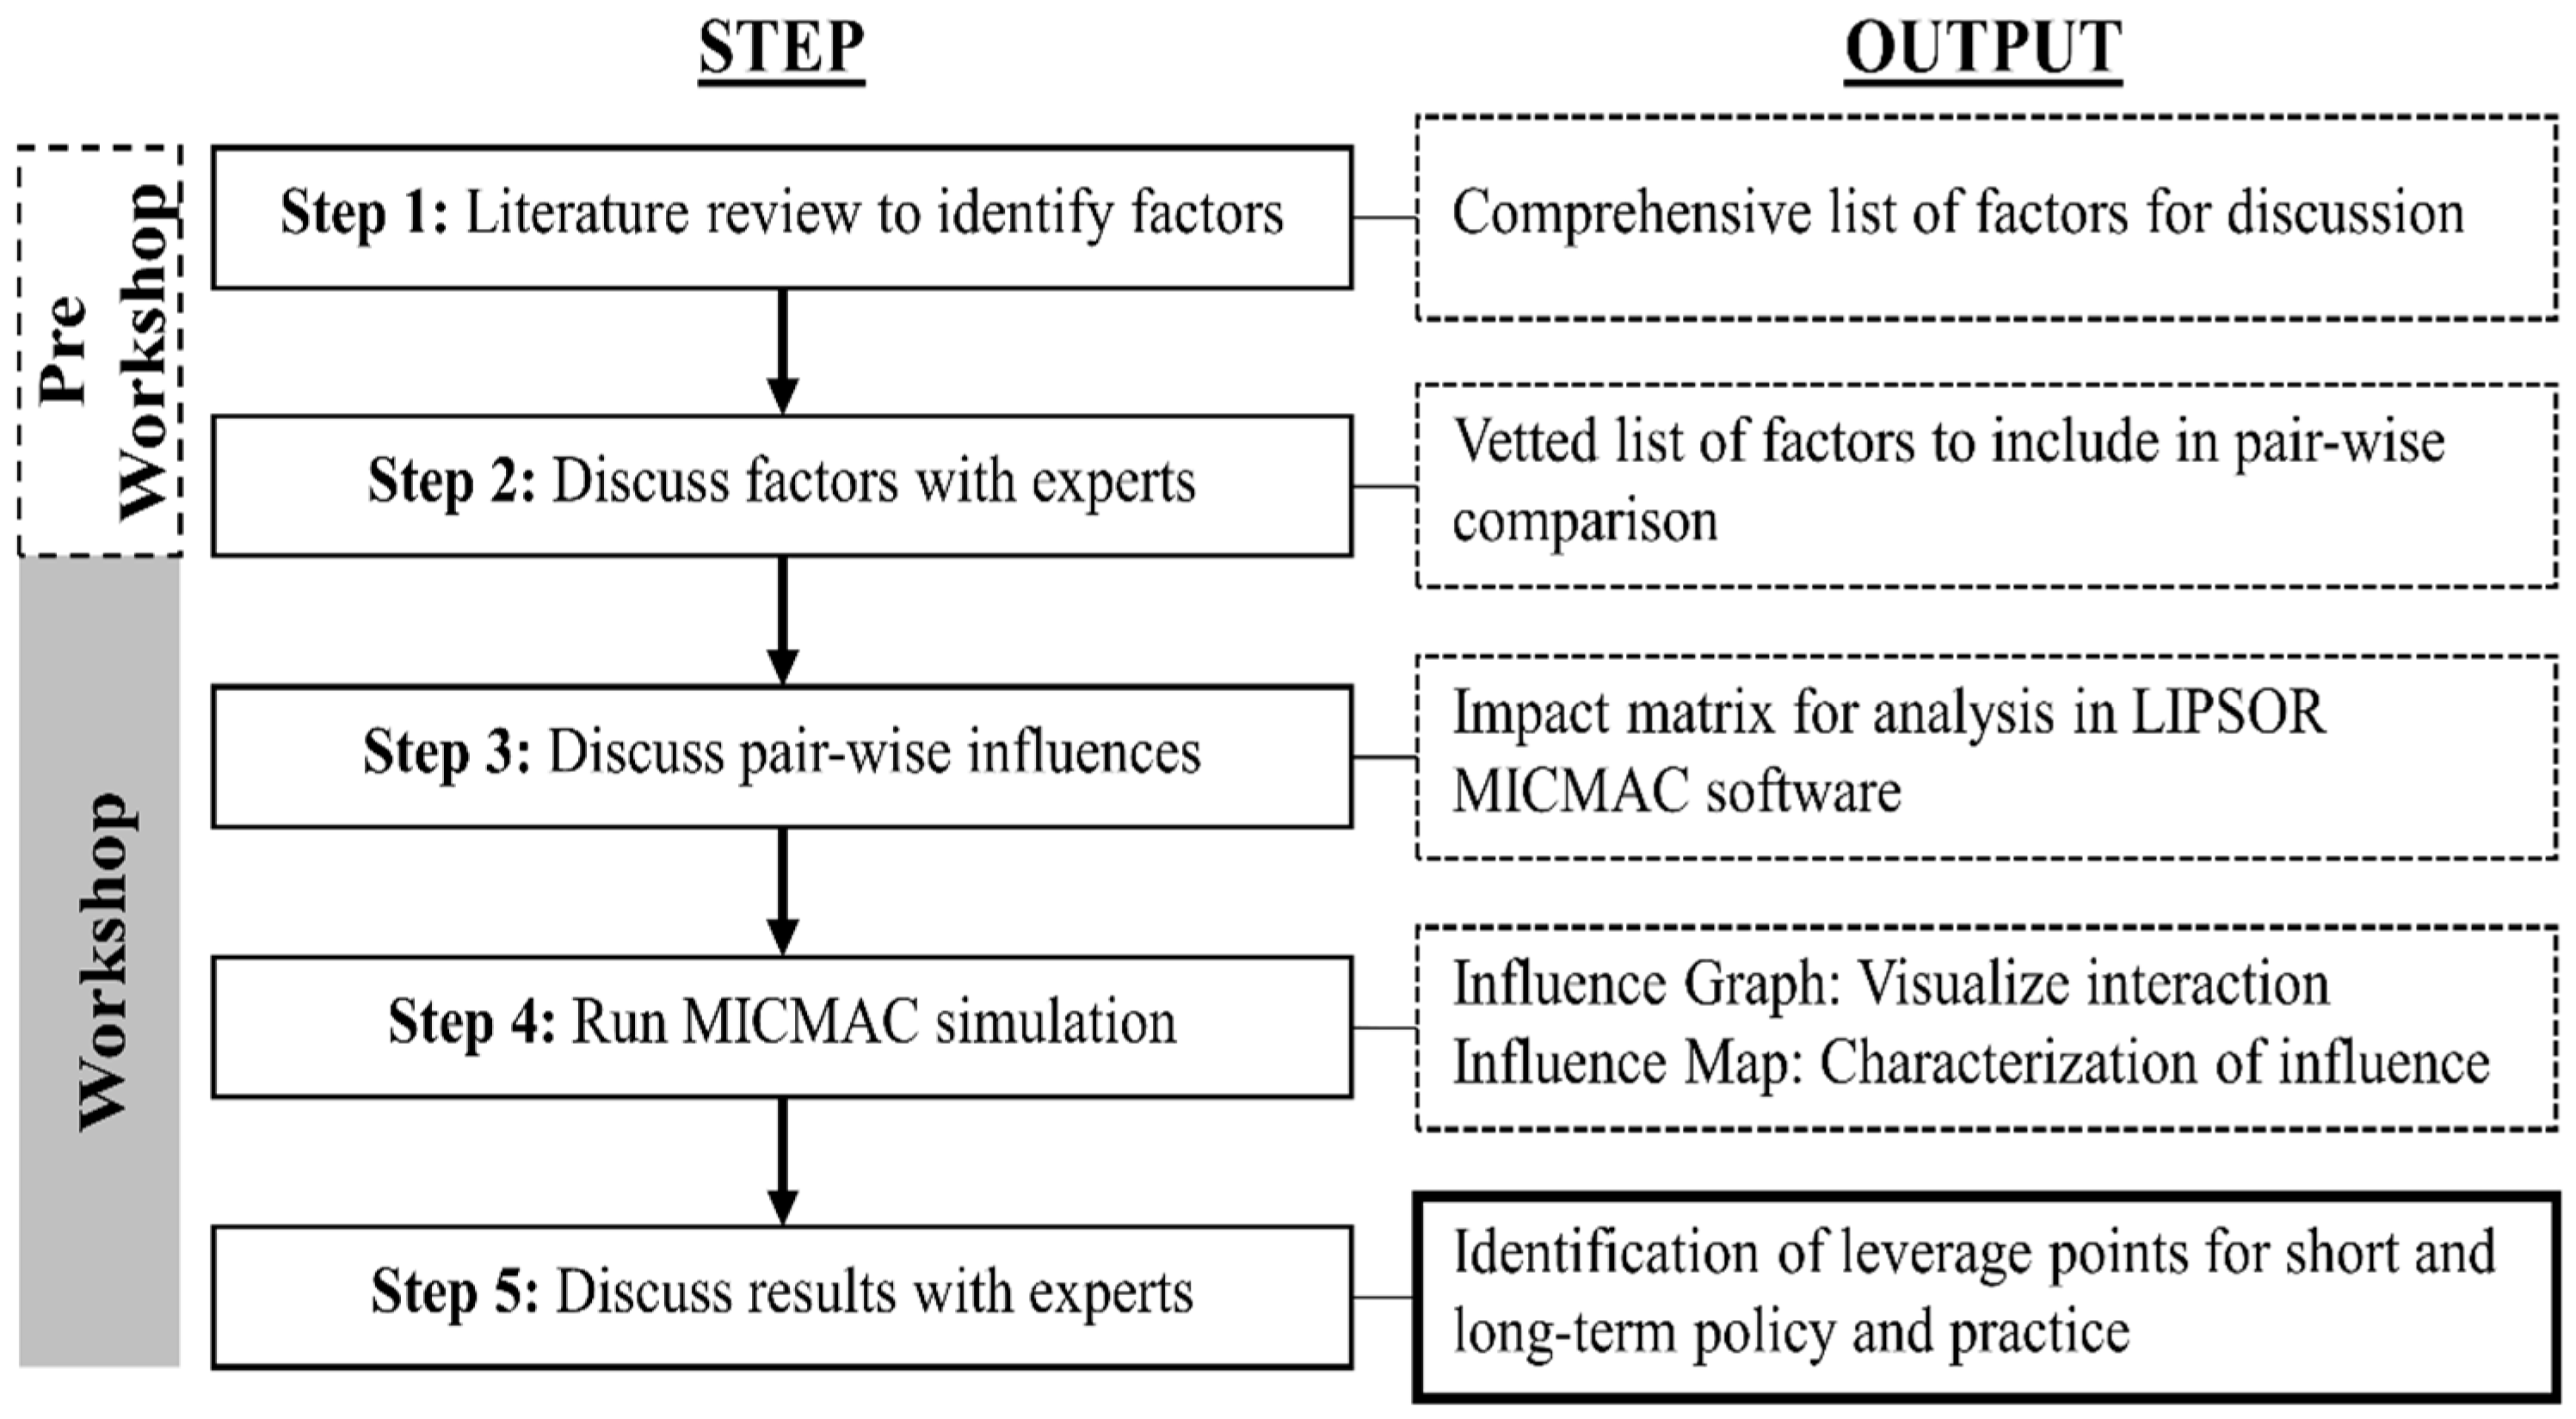
Figure 2.
Influence graph, where faint grey, thin black, and bold black represent 1—weak, 2—moderate, and 3—strong influence, respectively.
Figure 2.
Influence graph, where faint grey, thin black, and bold black represent 1—weak, 2—moderate, and 3—strong influence, respectively.

Figure 3.
Influence map with indirect (MICMAC) displacements (constructed in LIPSOR-EPITA-MICMAC). On this influence map, the small shaded dots mark each factor’s relative influence and dependence based on their direct interaction, while displacements, based on indirect interactions, are indicated by lines extending from the shaded dots.

Figure 4.
Re-ranking chart, showing the ranked influence and dependence for both direct and indirect factor interaction; lines represent inferred shifts in factor ranking (importance) over time.
Figure 4.
Re-ranking chart, showing the ranked influence and dependence for both direct and indirect factor interaction; lines represent inferred shifts in factor ranking (importance) over time.

Figure 5.
Model insights and recommendations for short-term and long-term solar programming in Santiago.
Figure 5.
Model insights and recommendations for short-term and long-term solar programming in Santiago.


Table 1.
Fourteen factors with their definitions, derived from Walters et al. [26].
Table 1.
Fourteen factors with their definitions, derived from Walters et al. [26].
| Factor Name | Factor Definition |
|---|---|
| High Initial Costs | The potential for high initial costs of installation for the photovoltaic (PV) system. |
| Uncertain Return on Investment (ROI) | There is uncertainty on whether the (client, user … etc.) will have a return on their investment, and how long it will take to realize this return. |
| Subsidies | The availability of subsidies to finance the initial installation of the PV system. |
| Reasonable Energy Price | A PV system could help the (user, client …) avoid increases in costs for conventional energy provided by the grid. |
| Cost Comparison | To be able to compare costs between different PV systems and installers. |
| Knowledge of Technology | The (user, client) are aware of the different PV technologies that exist, and their trade-offs. |
| Market Maturity | A market that has the capacity to offer special discounts, offers and promotions to finance a PV system. |
| Understandable Net-billing | To be able to understand the economic benefits that could be obtained due to the Chilean law for PV energy. |
| Daily Insolation Variability | Daily variation in the supply of electrical energy—the sun shines during the day, but more energy is used in the evening. |
| Installation Quality | To have confidence that the PV system installation process is of high quality and standards. |
| Grid Reliability | If the PV system is designed to work independent from the grid, one can always have electricity regardless of electrical outages. |
| Self-reliance | Users’ desire to have the ability to produce their own energy in place of having to depend on the grid. |
| Environmental Stewardship | Users’ desire to protect the environment through the use of clean energy. |
| Carbon Footprint | Users’ desire to reduce their carbon footprint through the use of clean energy. |
Table 2.
Impact matrix with pairwise influence and dependence calculations.
| INFLUENCE | ||||||||||||||||
|---|---|---|---|---|---|---|---|---|---|---|---|---|---|---|---|---|
| a | b | c | d | e | f | g | h | i | j | k | l | m | n | ΣI | ||
| DEPENDENCE | a | 1 | 1 | 0 | 0 | 0 | 3 | 0 | 0 | 1 | 0 | 3 | 2 | 0 | 11 | |
| b | 0 | 0 | 0 | 0 | 0 | 2 | 0 | 0 | 2 | 0 | 2 | 0 | 0 | 6 | ||
| c | 3 | 3 | 0 | 3 | 2 | 3 | 2 | 0 | 2 | 0 | 3 | 3 | 0 | 24 | ||
| d | 0 | 3 | 0 | 0 | 2 | 3 | 2 | 0 | 1 | 0 | 3 | 2 | 1 | 17 | ||
| e | 3 | 1 | 0 | 0 | 2 | 3 | 1 | 0 | 1 | 0 | 2 | 1 | 0 | 14 | ||
| f | 0 | 0 | 0 | 0 | 3 | 3 | 3 | 0 | 3 | 0 | 3 | 3 | 2 | 20 | ||
| g | 3 | 3 | 2 | 0 | 3 | 3 | 3 | 0 | 3 | 0 | 3 | 2 | 2 | 27 | ||
| h | 0 | 1 | 1 | 0 | 2 | 2 | 2 | 0 | 3 | 0 | 3 | 2 | 1 | 17 | ||
| i | 0 | 3 | 0 | 0 | 0 | 0 | 0 | 0 | 2 | 1 | 2 | 0 | 0 | 8 | ||
| j | 3 | 3 | 0 | 0 | 3 | 0 | 3 | 1 | 2 | 1 | 0 | 0 | 0 | 16 | ||
| k | 0 | 0 | 0 | 0 | 0 | 0 | 1 | 0 | 0 | 0 | 1 | 0 | 0 | 2 | ||
| l | 1 | 0 | 2 | 0 | 3 | 3 | 3 | 3 | 1 | 1 | 0 | 2 | 1 | 20 | ||
| m | 0 | 0 | 1 | 0 | 1 | 2 | 1 | 1 | 3 | 1 | 0 | 2 | 1 | 13 | ||
| n | 0 | 0 | 1 | 1 | 1 | 1 | 1 | 0 | 0 | 0 | 1 | 3 | 0 | 9 | ||
| ΣD | 13 | 18 | 8 | 1 | 19 | 17 | 28 | 16 | 6 | 20 | 3 | 30 | 17 | 8 | ||
a: High initial costs; b: Uncertain ROI; c: Subsidies; d: Reasonable energy price; e: Cost comparison; f: Knowledge of technology; g: Market maturity; h: Understandable net-billing; i: Daily insulation variability; j: Installation quality; k: Grid reliability; l: Self-reliance; m: Environmental stewardship; n: Carbon footprint; ΣI: Sum of influence; ΣD: Sum of dependence.
© 2018 by the authors. Licensee MDPI, Basel, Switzerland. This article is an open access article distributed under the terms and conditions of the Creative Commons Attribution (CC BY) license (http://creativecommons.org/licenses/by/4.0/).
Share and Cite
MDPI and ACS Style
Walters, J.; Kaminsky, J.; Gottschamer, L. A Systems Analysis of Factors Influencing Household Solar PV Adoption in Santiago, Chile. Sustainability 2018, 10, 1257. https://0-doi-org.brum.beds.ac.uk/10.3390/su10041257
AMA Style
Walters J, Kaminsky J, Gottschamer L. A Systems Analysis of Factors Influencing Household Solar PV Adoption in Santiago, Chile. Sustainability. 2018; 10(4):1257. https://0-doi-org.brum.beds.ac.uk/10.3390/su10041257
Chicago/Turabian StyleWalters, Jeffrey, Jessica Kaminsky, and Lawrence Gottschamer. 2018. "A Systems Analysis of Factors Influencing Household Solar PV Adoption in Santiago, Chile" Sustainability 10, no. 4: 1257. https://0-doi-org.brum.beds.ac.uk/10.3390/su10041257
Note that from the first issue of 2016, this journal uses article numbers instead of page numbers. See further details here.