Developing a Model of Factors Influencing the Quality of Service for Disabled Customers in the Condition s of Sustainable Development, Illustrated by an Example of the Silesian Voivodeship Public Administration


Abstract
:1. Introduction
- Principle 1, stating the right of a person to health and productive life in harmony with nature and defining a person as the subject of sustainable development.
- Principle 2, defining the sovereign rights of nations to use their natural resources, without causing damage to other countries.
- Principle 3, stating equal rights to the development of present and future generations.
- Principle 4, defining the role of environmental protection as an integral component of the sustainable development process.
- Principle 5, defining the necessity to include counteracting poverty in all its forms and pathologies in the sustainable development processes.
- Principle 7, specifying the obligation to national activities and cooperation for the balance of ecosystems.
- Principle 8, specifying the need for changes in consumption and production trends.
- Principle 10, defining the necessity of public participation in the management of environmental resources and decision-making processes in sustainable development.
- Principle 11, defining the directions of development of national legislation, integrating ecological and developmental aspects.
- Principle 13, on the liability and obligation to repair damages caused to the environment and to victims of a degraded environment
- Principle 16, on the obligation to bear the costs of counteracting pollution by the producer of the pollutants and on the internalization of external environmental costs in the prices of products, which translates into fees paid by the users of the environment
- Principle 17, on environmental impact assessment as a management instrument on a national and international scale.
- Principle 27, on the obligation of States and societies to cooperate in good faith and in a spirit of partnership in order to implement the principles of sustainable development.
- Guarantee to satisfy the basic needs of societies, in particular to a safe shelter, to ensure an appropriate biological minimum, including drinking water and sanitary needs in appropriate quantity and of appropriate quality and healthy food in the amount ensuring coverage of the body’s needs
- Guarantee of protection against the harmful effects on health and life of, first and foremost, pollution caused by economic activity, noise and vibration, ionizing and non-ionizing radiation, the effects of applications of genetically modified organisms, but also crime.
- Guarantee of the availability of education, at least in the basic scope and help in acquiring knowledge for the most talented individuals at higher levels of education.
- Guarantee of active health protection through prophylaxis, appropriate treatment conditions and prevention of diseases recognized as social.
- Guarantee of social care for the elderly, infirm and disabled persons, ensuring a certain social minimum and possibilities of functioning in the society.
- Guarantees of just distribution of income and social security measures that help to eliminate social differences, prevent the creation of large areas of poverty and marginalization of individuals and social groups.
- Guarantee of access to employment primarily by generating new jobs, supporting small and medium enterprises, access to training and courses raising qualifications and changing qualifications, access to cheap loans.
- Equitable access to the environment and its resources, to recreation in a healthy and uncontaminated environment.
- Inviolability and protection of private property, state property and social goods.
2. Materials and Methods
- Sensory impairment—a lack, damage to or disorder of sensory analyzers’ function (this category includes the blind, the visually impaired, the deaf, hard of hearing and people with visual and auditory perception disorders)—644 surveyed persons;
- intellectual impairment—intellectual and developmental disabilities—182 surveyed persons;
- social functioning impairment—disorders of neural and emotional balance—399 surveyed persons;
- communication impairment—hindered verbal contact (speech impediments, autism, stammering)—444 surveyed persons;
- motor impairment—people with motor organ dysfunction—1153 surveyed persons.
- B1—office localization (easiness of access),
- B2—appropriate number of parking places,
- B3—parking places for the disabled located near the office entrance,
- B4—clear marking of parking places for the disabled,
- B5—making sure that unauthorized persons do not occupy places for the disabled,
- B6—facilities for the disabled in the office,
- B7—lifts adapted to the needs of the disabled,
- B8—toilets adapted to the needs of the disabled,
- B9—handrails by the stairs,
- B10—system of ramps and driveways for the disabled,
- B11—doors with a width enabling entrance on a wheelchair,
- B12—anti-slip floor,
- B13—levelled thresholds and floors,
- B14—surface and curbs in the vicinity of the office adjusted to the needs of the disabled,
- B15—contains information for the disabled,
- B16—legible for the disabled with visual impairment,
- B17—municipal office does not have architectural barriers which would make it difficult for the disabled to get around,
- B18—general evaluation of architectural barriers in the office.
- above 0—very good;
- <0; −1)—good;
- <−1; −1.5)—average;
- <−1.5; −2)—bad;
- below −2—very bad.
- Identification of hidden factors for architectural barriers.
- Determining the level of quality of the client service in municipal offices of the Silesian Province with regard to architectural barriers, as evaluated by the disabled.
- Analysis of the influence of the degree of disability, its type and the age of the disabled person on the perception of the quality of service in relation to architectural barriers.
- What is the impact of the degree of disability on the evaluation level of quality with regard to architectonical barriers?
- What is the impact of the types of disability on the evaluation level of quality with regard to architectonical barriers?
- What is the impact of the age of the disabled on the evaluation level of quality with regard to architectonical barriers?
- What hidden factors can we identify in the case of architectural barriers in municipal offices services for peoples with disability?
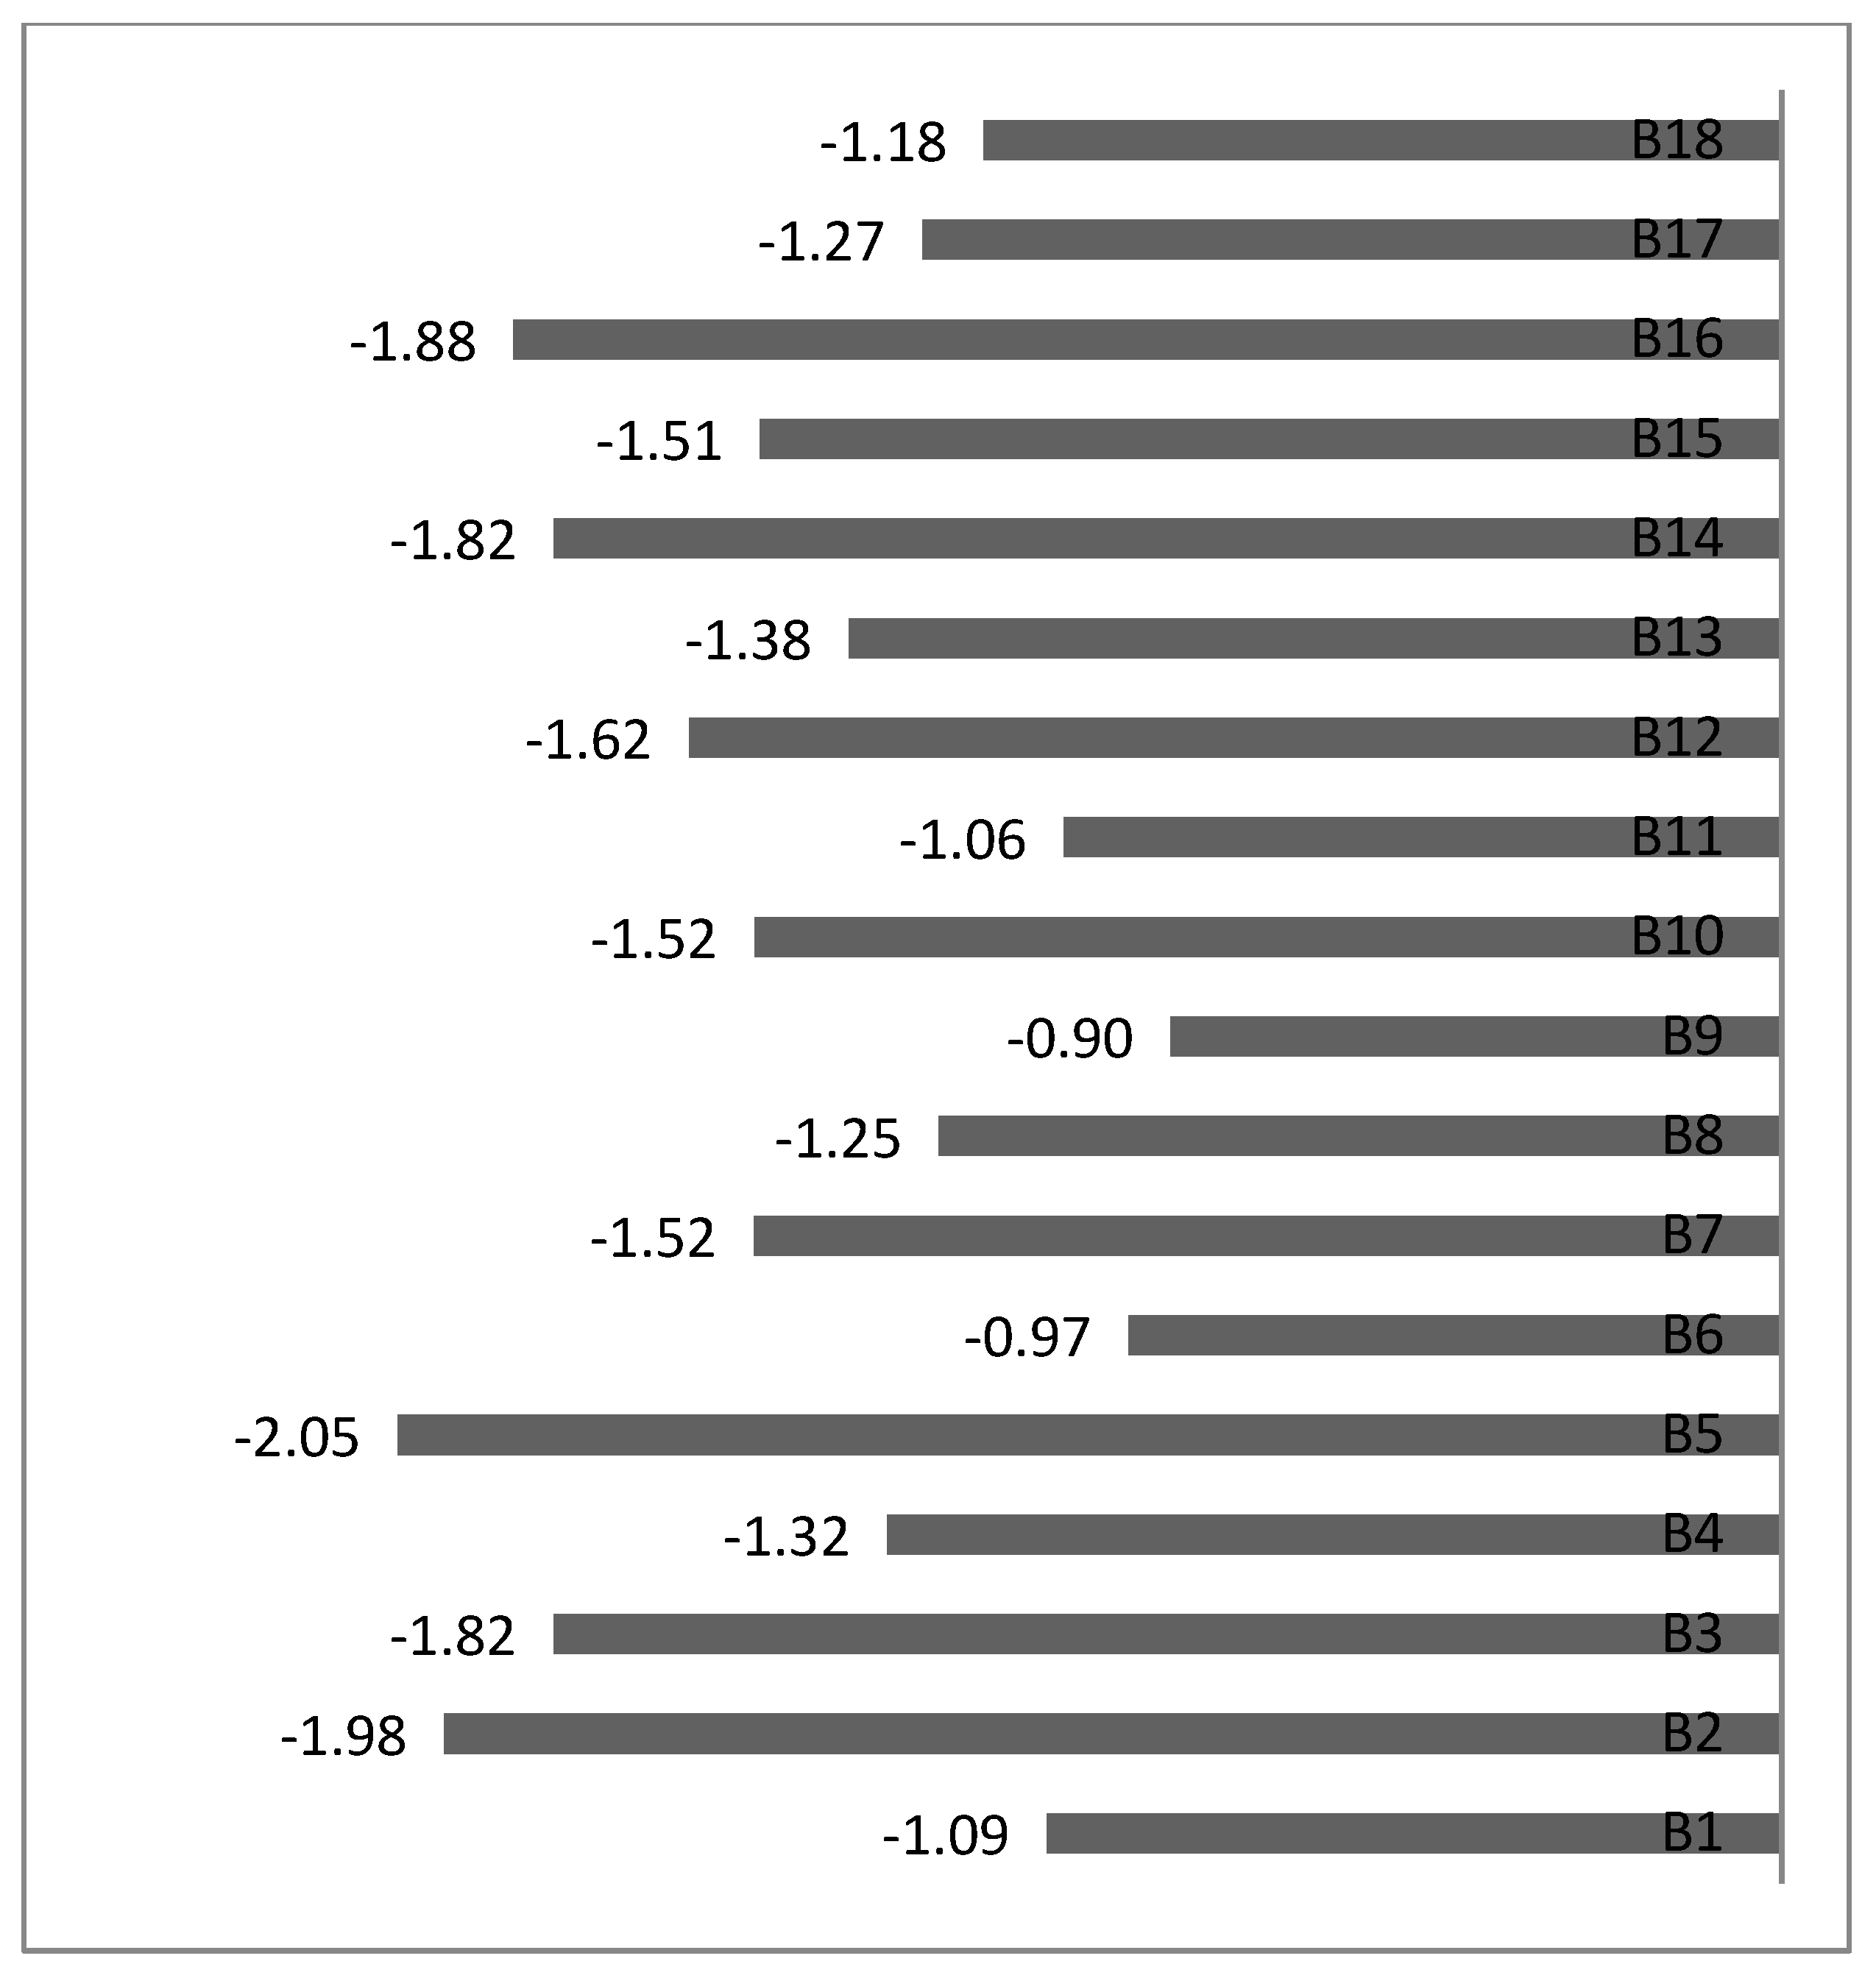
3. Results
- Appropriate number of parking places (−1.98);
- legibility of the office’s website for the disabled with visual impairment (−1.88);
- parking places located near the office entrance (−1.82);
- surfaces and curbs in the vicinity of the office adapter to the needs of the disabled (−1.82)
- anti-slip floor (−1.62);
- lifts adapted to the needs of the disabled (−1.52);
- system of ramps for the disabled (−1.52);
- the office’s website contains information that is important for the disabled (−1.51).
Hidden Factors for Architectural Barriers
- The last identified hidden factor accounts for 12% of variability and consists of three variables regarding facilities for the disabled in the office, lifts adapted to the needs of the disabled and the remaining architectural barriers. The factor was named other facilities for the disabled.
- In the further stage the total value of the examined variables was calculated for particular hidden factors. According to the adopted scale, two factors were evaluated on an average level, whereas the other two on a bad level. Factors considered as average include the disabled being able to freely move around the office and other facilities for the disabled. Both of them were given a score of –1.25. Factors which were considered bad were the ones related to parking places for the disabled (–1.79) as well as the website and surroundings of the office (−1.73).
4. Discussion
- for variable B14 persons with severe disability evaluate architectural barriers on a level of −1.81; in the case of people with moderate disability this score is −1.95, whereas in the case of persons affected by mild disability the score reaches −1.71;
- for variable B17 the score given by persons with severe disability is −1.41; people with moderate disability evaluate it on a level of −1.27, whereas in the case of persons affected by mild disability the score is −1.23.
5. Conclusions
Author Contributions
Funding
Conflicts of Interest
References
- Baena, I.B.; Garcia, J.L.; Ongena, Y. Evaluation of the convergence between “self-reporters” and “proxies” in a disability questionnaire by means of behavior coding method. Qual. Quant. 2012, 46, 1311–1322. [Google Scholar] [CrossRef]
- Belli, R.F.; Agrawal, S.; Bilgen, I. Health status and disability comparisons between CATI calendar and conventional questionnaire instruments. Qual. Quant. 2012, 46, 813–828. [Google Scholar] [CrossRef]
- Pieńkowski, D. Koncepcje sprawiedliwości w teorii ekonomii zrównoważonego rozwoju. In Teoretyczne Aspekty Ekonomii Zrównoważonego Rozwoju; Poskropko, B., Ed.; Wyd. Wyższej Szkoły Ekonomicznej w Białymstoku: Białystok, Poland, 2011. [Google Scholar]
- Pradela, A. Determinants of the employment of people with disabilities in Poland. In Proceedings of the SGEM Conference on Political Sciences, Law, Finance, Economics and Tourism, Albena, Bulgaria, 3–9 September 2014; STEF92 Technology: Albena, Bulgaria, 2014. [Google Scholar]
- Rostow, W.W. The Stages of Economic Growth: A Non-Communist Mainfesto; University Press: Cambridge, UK, 1999. [Google Scholar]
- Saint-Simon, C.H.; Thierry, A. De la Reorganistation de la Societe Europeenne, ou de la Necessite et des Moyens de Rassembler las Peoples de l’Europe en un Suel Politique en Conservant a Chacun son Independence Nationale; Bastion Books: Paris, France, 2008. [Google Scholar]
- Blanck, P.; Adya, M.; Myhill, W.N.; Samant, D.; Chen, P. Employment of people with disabilities—Twenty-five years back and ahead. Law Inequal. J. Theory Pract. 2007, 25, 323–353. [Google Scholar]
- Brundtland, G.H. Report of the World Commission on Environment and Development: Our Common Future; United Nations: New York, NY, USA, 1987; p. 247. [Google Scholar]
- Caulfield, J.L. Measuring autonomy in social security agencies: A four country comparison. Public Adm. Dev. Spec. Issue Symp. Auton. Organ. Public Sect. 2004, 24, 137–145. [Google Scholar] [CrossRef]
- Dołęga, J.F. Wybrane zasady filozofii zrównoważonego rozwoju. In Teoretyczne Aspekty Ekonomii Zrównoważonego Rozwoju; Poskrobko, B., Ed.; Wyd. Wyżej Szkoły Ekonomicznej: Białystok, Poland, 2001. [Google Scholar]
- E-Government for Sustainable Development. Raport of the Expert Grup Meeting, 10–11 May; United Nations: New York, NY, USA, 2017; Available online: https://publicadministration.un.org/en/cepa (accessed on 25 June 2018).
- Florczak, W. Wskaźniki zrównoważonego rozwoju. Wiad. Stat. 2008, 3, 14–34. [Google Scholar]
- Emerson, E.; Robertson, J.; Madden, R.; Graham, H.; Llewellyn, G.; Hatton, C. The health of disabled people and the social determinants of health. Public Health 2011, 125, 145–147. [Google Scholar] [CrossRef] [PubMed]
- Frankfort-Nachmias, C.; Nachmias, D. Metody Badawcze w Naukach Społecznych; Zysk i Spółka: Poznań, Poland, 2001. [Google Scholar]
- Hanes, L.; Nath, B. The Johannesburg Coference. Eviron. Dev. Sustain. 2003, 5, 7–39. [Google Scholar]
- Hahn, H.D.; Belt, T.L. Disability identity and attitudes toward cure in a sample of disabled activists. J. Health Soc. Behav. 2004, 45, 453–464. [Google Scholar] [CrossRef] [PubMed]
- International Classification of Impairments, Activities and Participation. A Manual of Disablement and Functioning BETA-1 Draft for Field Trials; World Health Organisation: Geneva, Switzerland, 1997. [Google Scholar]
- Frieske, K.W. Polowanie na jednorożca: Demokratyczna administracja publiczna? Samorz. Teryt. 2014, 5–12. Available online: http://bazekon.icm.edu.pl/bazekon/element/bwmeta1.element.ekon-element-000171262279 (accessed on 25 June 2018).
- Gierczyca, J. Zrównoważony rozwój we wspólnych politykach Unii Europejskiej. In Implementacyjne Aspekty Wdrażania Zrównoważonego Rozwoju; Kiełczewski, D., Ed.; Wyd. Wyższej Szkoły Ekonomicznej w Białymstoku: Białystok, Poland, 2011. [Google Scholar]
- Newcomer, K.; El Baradei, L.; Garcia, S. Expectations and capacity of performance measurement in ngo in the development context. Public Adm. Dev. 2013, 33, 62–79. [Google Scholar] [CrossRef]
- Kornik, S. Region Ekonomiczny w Nowych Realiach Społeczno-Gospodarczych; CedeWu: Warszawa, Poland, 2011; p. 194. [Google Scholar]
- Ustawa z dna 27 Sierpnia 1997 Roku o Rehabilitacji Zawodowej i Społecznej Oraz Zatrudnieniu Osób Niepełnosprawnych Dziennik Ustaw Nr 123. Poz. 776 z Późniejszymi Zmianami w 2002r. Available online: prawo.sejm.gov.pl/isap.nsf/DocDetails.xsp?id=WDU19971230776 (accessed on 25 June 2018).
- Vilaseca, R.; Olmos, J.G. Gender differences in positive perceptions, anxiety, and depression among mothers and fathers of children with intellectual disabilities: A logistic regression analysis. Qual. Quant. 2014, 44, 2241–2253. [Google Scholar] [CrossRef]
- Wartacz, R.; Szrek, A. Alternatywne rozwiązania barier infrastrukturalnych w obiektach użyteczności publicznej. Aktual. Probl. Biomech. 2012, 6, 151–156. [Google Scholar]
- Wolfensberger, W.; Thomas, S. Passing: A Tool for Analysing Service Quality According to Social Role Valorization Criteria. Ratings Manual, 3rd ed.; Syracuse University: Syracuse, NY, USA, 2007; pp. 58–62. [Google Scholar]
- Wolniak, R.; Skotnicka-Zasadzień, B.; Zasadzień, M. Evaluation of the level of quality with regard to architectural barriers according to the degree of disability. In Proceedings of the 3rd International Multidisciplinary Scientific Conference on Social Sciences and Arts SGEM 2016, Vienna, Austria, 6–9 April 2016; STEF92 Technology: Sofia, Bulgaria, 2016; pp. 499–506. [Google Scholar]
- Giorgetta, S. The Regiht to a healthy envrironment, human rights and sustainable development. Int. Environ. Agreem. Politics Law Econ. 2002, 2, 171–192. [Google Scholar] [CrossRef]
- Jasiak, A.; Swersda, D. Ergonomia Osób Niepełnosprawnych; Wyd. Politechniki Poznańskiej: Poznań, Poland, 2005. [Google Scholar]
- Kaleta, P.; Żurakowski, Z. Wpływ barier architektonicznych na możliwość kształtowania się osób niepełnosprawnych ruchowo w Zabrzu. Zesz. Nauk. Politech. Śląskiej Ser. Org. Zarz. 2012, 63, 167–188. [Google Scholar]
- Nagórny, W. Polityka społeczna a zrównoważony rozwój. Prace Naukowe Akad. Jana Długosza Częstoch. Ser. Pragm. Oikon. 2011, 5, 137–146. [Google Scholar]
- Ofori, G. Sustainable construction: Principles and a framework for attainment. Construct. Manag. Econ. 1998, 16, 141–145. [Google Scholar] [CrossRef]
- Navarro-Gallera, A.; Ruiz-Lozano, M.; Rios-Berjillos, A.; Tirado-Valencis, P. La responsabilidad social corporativa en los gobiernos locales: El caso de Reino Unido e Irlanda. Rev. Innov. 2004, 54, 89–106. [Google Scholar] [CrossRef]
- Paszkowicz, M.A.; Garbat, M. Bariery rozwoju kapitału ludzkiego osób niepełnosprawnych. Nierówności Społecz. Wzrost Gospod. 2005, 7, 111–119. [Google Scholar]
- Rabska, T. Administracja publiczna w świetle integracji z Unią Europejską. Samorz. Teryt. 2003, 3, 3–11. [Google Scholar]
- Raposo, M.; Rodrigues, R.; Dinis, A.; Paco, A.; Ferreira, J.J. The influence of competitiveness and regulations on entrepreneurial activity in emerging and advanced economies. Rev. Innov. 2014, 24, 113–128. [Google Scholar] [CrossRef]
- Wolniak, R.; Skotnicka-Zasadzień, B.; Zasadzień, M. Evaluation of architectural barriers with a division into types of disability and the age of disabled people. In Proceedings of the 3rd International Multidisciplinary Scientific Conference on Social Sciences and Arts SGEM 2016, Vienna, Austria, 6–9 April 2016; STEF92 Technology: Sofia, Bulgaria, 2016; pp. 471–478. [Google Scholar]
- Wolniak, R.; Skotnicka-Zasadzień, B. Ocena jakości obsługi klienta niepełnosprawnego w Urzędzie Miejskim w Zabrzu. Stud. Mater. Polskiego Stow. Zarządzania Wiedzą 2010, 45, 334–347. [Google Scholar]
- Stanisz, A. Przystępny Kurs Statystyki z Zastosowaniem Statistica PL. Tom 3. Analizy Wielowymiarowe; StatSof: Kraków, Poland, 2007. [Google Scholar]
- Shen, L.; Tam, V.; Tam, L.; Ji, Y. Project feasibility study: The key to successful implementation of sustainable and socially responsible construction management practice. J. Clean. Prod. 2010, 18, 254–259. [Google Scholar] [CrossRef]
- Abidin, N.Z. Investigating the awareness and application of sustainable construction concept by Malaysian developers. Habitat Int. 2010, 34, 421–426. [Google Scholar] [CrossRef]
- Akadiri, P.O.; Chinyio, E.A.; Olomolaiye, P.O. Design of a sustainable building: A conceptual framework for implementing sustainability in the building sector. Buildings 2012, 2, 126–152. [Google Scholar] [CrossRef]
- Zawiślak, A. Koncepcja jakości życia osób z upośledzeniem umysłowym w niektórych współczesnych ujęciach teoretycznych. In Jakość Życia a Niepełnosprawność; Palak, Z., Lewicka, A., Bujanowska, A., Eds.; Wyd. UMCS: Lublin, Poland, 2006; pp. 1–11. [Google Scholar]
- David, G.; Moultrie, C. Architectural design principles and processes for sustainability: Towards a typology of sustainable buildings design. Des. Princ. Pract. Int. J. 2011, 4, 623–634. [Google Scholar]
- Ding, G.K.C. Sustainable construction—The role of environmental assessment tools. J. Environ. Manag. 2008, 86, 451–464. [Google Scholar] [CrossRef] [PubMed] [Green Version]
- Kasprzyk, B. Aspekty funkcjonowania e-administracji dla jakości życia obywateli. Nierówności Społeczne Wzrost Gospod. 2011, 23, 343–353. [Google Scholar]
- Landman, M. Breking Thogh the Barriers to Sustainable Bulding. Instghts Form Building Professionals on Government Intiatives to Promote Environmentally Sound Practices; Tufts University: Medford, MA, USA, 1999. [Google Scholar]
- Miller, K.; Mont, D.; Maitland, A.; Altman, B. Results of a cross-national structured cognitive interviewing protocol to test measures of disability. Qual. Quant. 2011, 45, 801–815. [Google Scholar] [CrossRef]
- Sassi, P. Strategies for Sustainable Architecture; Taylor & Francis: New York, NY, USA, 2006. [Google Scholar]
- Wolniak, R.; Skotnicka-Zasadzień, B. Ocena czynników jakości usług w administracji samorządowej. Mark. Rynek 2010, 6, 32–36. [Google Scholar]
- Wolniak, R.; Skotnicka-Zasadzień, B.; Zasadzień, M. Evaluation of architectural barriers in municipal offices in the Silesian Province by the disabled. In Proceedings of the 2nd International Conference on Social, Education and Management, Bangkok, Thailand, 20–21 March 2016; DEStech Publications, Inc.: Lancaster, PA, USA, 2016; pp. 3–12. [Google Scholar]
- Wong, K.; Fan, Q. Building information modeling (BIM) for sustainable building design. Facilities 2013, 31, 138–157. [Google Scholar] [CrossRef]
- Sztando, A. Pomiar rezultatów programu rewitalizacji miasta. Samorz. Teryt. 2008, 9, 21–37. [Google Scholar]


| Specification | Number of People Surveyed | Percentage of Respondents | |
|---|---|---|---|
| Criterion of Division | Range | ||
| Sex | Woman | 1421 | 50% |
| Man | 1425 | 50% | |
| Education | Basic | 570 | 20% |
| Secondary | 1591 | 56% | |
| Higher | 651 | 23% | |
| No answer | 34 | 1% | |
| Degree of disability | Severe | 400 | 14% |
| Moderate | 1057 | 37% | |
| Mild | 1384 | 49% | |
| No answer | 5 | - | |
| Type of disability | Sensory impairment | 644 | 23% |
| Intellectual impairment | 182 | 6% | |
| Social functioning impairment | 399 | 14% | |
| Communication impairment | 444 | 16% | |
| Motor impairment | 1153 | 40% | |
| No answer | 24 | 1% | |
| Age | Below 20 years of age | 225 | 8% |
| 20–29 years | 763 | 27% | |
| 30–39 years | 758 | 27% | |
| 40–49 years | 641 | 13% | |
| 50 and more years | 459 | 21% | |
| Variables | Degree of Disability | ||
|---|---|---|---|
| Severe (N = 400) | Moderate (N = 1057) | Mild (N = 1384) | |
| B1 | −1.23 | −1.11 | −1.03 |
| B2 | −1.91 | −2.06 | −1.93 |
| B3 | −1.82 | −1.87 | −1.77 |
| B4 | −1.16 | −1.36 | −1.34 |
| B5 | −2.09 | −2.13 | −1.97 |
| B6 | −1.03 | −0.96 | −0.95 |
| B7 | −1.72 | −1.54 | −1.45 |
| B8 | −1.33 | −1.23 | −1.23 |
| B9 | −0.96 | −0.93 | −0.87 |
| B10 | −1.67 | −1.61 | −1.41 |
| B11 | −1.24 | −1.04 | −1.03 |
| B12 | −1.63 | −1.62 | −1.61 |
| B13 | −1.49 | −1.32 | −1.40 |
| B14 | −1.81 | −1.95 | −1.71 |
| B15 | −1.46 | −1.49 | −1.54 |
| B16 | −1.87 | −1.92 | −1.85 |
| B17 | −1.42 | −1.27 | −1.23 |
| B18 | −1.28 | −1.25 | −1.10 |
| Average | −1.51 | −1.48 | −1.41 |
| Variables | Type of Disability | ||||
|---|---|---|---|---|---|
| Sensory Impairment (N = 644) | Intellectual Impairment (N = 182) | Social Functioning Impairment (N = 399) | Communication Impairment (N = 444) | Motor Impairment (N = 1153) | |
| B1 | −0.99 | −1.34 | −1.14 | −1.26 | −1.02 |
| B2 | −1.78 | −1.95 | −2.08 | −1.94 | −2.06 |
| B3 | −1.73 | −2.05 | −1.94 | −1.77 | −1.78 |
| B4 | −1.21 | −1.47 | −1.39 | −1.36 | −1.32 |
| B5 | −1.96 | −1.91 | −2.07 | −2.25 | −2.01 |
| B6 | −0.88 | −1.18 | −0.98 | −1.03 | −0.94 |
| B7 | −1.52 | −1.62 | −1.49 | −1.39 | −1.57 |
| B8 | −1.26 | −1.49 | −1.23 | −1.31 | −1.18 |
| B9 | −0.77 | −1.09 | −0.95 | −0.89 | −0.92 |
| B10 | −1.36 | −1.51 | −1.51 | −1.40 | −1.64 |
| B11 | −0.96 | −1.39 | −1.12 | −1.22 | −0.98 |
| B12 | −1.57 | −1.87 | −1.72 | −1.47 | −1.61 |
| B13 | −1.35 | −1.63 | −1.56 | −1.39 | −1.29 |
| B14 | −1.70 | −1.56 | −1.73 | −1.63 | −2.03 |
| B15 | −1.40 | −1.15 | −1.48 | −1.36 | −1.69 |
| B16 | −1.76 | −1.72 | −1.86 | −1.66 | −2.05 |
| B17 | −1.22 | −1.73 | −1.29 | −1.25 | −1.22 |
| B18 | −1.07 | −1.22 | −1.19 | −1.21 | −1.20 |
| Average | −1.36 | −1.55 | −1.49 | −1.43 | −1.47 |
| Variables | Age Range | ||||
|---|---|---|---|---|---|
| Below 20 Years (N = 225) | 20−29 Years (N = 763) | 30−39 Years (N = 758) | 40−49 Years (N = 641) | 50 and More Years (N = 459) | |
| B1 | −0.83 | −0.94 | −1.01 | −1.27 | −1.33 |
| B2 | −1.78 | −1.89 | −1.94 | −2.16 | −2.03 |
| B3 | −1.57 | −1.79 | −1.75 | −2.01 | −1.82 |
| B4 | −1.17 | −1.34 | −1.27 | −1.53 | −1.18 |
| B5 | −1.65 | −2.03 | −2.11 | −2.21 | −1.93 |
| B6 | −1.02 | −0.99 | −0.94 | −0.96 | −0.95 |
| B7 | −1.44 | −1.40 | −1.49 | −1.68 | −1.57 |
| B8 | −1.09 | −1.10 | −1.17 | −1.43 | −1.42 |
| B9 | −0.71 | −0.85 | −0.85 | −1.01 | −1.03 |
| B10 | −1.39 | −1.48 | −1.46 | −1.62 | −1.59 |
| B11 | −1.09 | −1.01 | −1.07 | −1.04 | −1.16 |
| B12 | −1.35 | −1.50 | −1.70 | −1.71 | −1.68 |
| B13 | −1.06 | −1.25 | −1.39 | −1.50 | −1.57 |
| B14 | −1.51 | −1.65 | −1.85 | −1.96 | −1.98 |
| B15 | −1.25 | −1.35 | −1.51 | −1.59 | −1.79 |
| B16 | −1.74 | −1.94 | −1.78 | −1.85 | −2.03 |
| B17 | −1.11 | −1.15 | −1.23 | −1.38 | −1.46 |
| B18 | −1.08 | −1.11 | −1.16 | −1.29 | −1.20 |
| Average | −1.27 | −1.38 | −1.43 | −1.57 | −1.54 |
| Variables | Factor 1 | Factor 2 | Factor 3 | Factor 4 |
|---|---|---|---|---|
| B1 | 0.39 | 0.37 | 0.03 | 0.30 |
| B2 | 0.21 | 0.75 | 0.14 | 0.06 |
| B3 | 0.22 | 0.79 | 0.14 | 0.15 |
| B4 | 0.07 | 0.57 | 0.18 | 0.43 |
| B5 | 0.14 | 0.73 | 0.19 | 0.11 |
| B6 | 0.12 | 0.17 | 0.18 | 0.75 |
| B7 | 0.38 | 0.44 | −0.07 | 0.45 |
| B8 | 0.59 | 0.39 | −0.09 | 0.37 |
| B9 | 0.57 | 0.03 | 0.22 | 0.39 |
| B10 | 0.67 | 0.07 | 0.17 | 0.25 |
| B11 | 0.68 | 0.13 | 0.10 | 0.30 |
| B12 | 0.68 | 0.26 | 0.29 | −0.11 |
| B13 | 0.72 | 0.27 | 0.21 | 0.02 |
| B14 | 0.44 | 0.39 | 0.45 | 0.03 |
| B15 | 0.31 | 0.27 | 0.61 | 0.21 |
| B16 | 0.09 | 0.12 | 0.81 | 0.17 |
| B17 | 0.22 | 0.10 | 0.17 | 0.67 |
| B18 | 0.55 | 0.31 | −0.08 | 0.40 |
| Variance explained | 3.65 | 3.07 | 1.64 | 2.20 |
| Percentage share | 0.20 | 0.17 | 0.09 | 0.12 |
© 2018 by the authors. Licensee MDPI, Basel, Switzerland. This article is an open access article distributed under the terms and conditions of the Creative Commons Attribution (CC BY) license (http://creativecommons.org/licenses/by/4.0/).
Share and Cite
Wolniak, R.; Skotnicka-Zasadzień, B. Developing a Model of Factors Influencing the Quality of Service for Disabled Customers in the Condition s of Sustainable Development, Illustrated by an Example of the Silesian Voivodeship Public Administration. Sustainability 2018, 10, 2171. https://0-doi-org.brum.beds.ac.uk/10.3390/su10072171
Wolniak R, Skotnicka-Zasadzień B. Developing a Model of Factors Influencing the Quality of Service for Disabled Customers in the Condition s of Sustainable Development, Illustrated by an Example of the Silesian Voivodeship Public Administration. Sustainability. 2018; 10(7):2171. https://0-doi-org.brum.beds.ac.uk/10.3390/su10072171
Chicago/Turabian StyleWolniak, Radosław, and Bożena Skotnicka-Zasadzień. 2018. "Developing a Model of Factors Influencing the Quality of Service for Disabled Customers in the Condition s of Sustainable Development, Illustrated by an Example of the Silesian Voivodeship Public Administration" Sustainability 10, no. 7: 2171. https://0-doi-org.brum.beds.ac.uk/10.3390/su10072171