Has Economic Competition Improved China’s Provincial Energy Ecological Efficiency under Fiscal Decentralization?

1
School of Economics and Management, China University of Geosciences (Wuhan), No. 388 Lumo Road, Wuhan 430074, China
2
Research Centre of Resource and Environmental Economics, China University of Geosciences, Wuhan 430074, China
*
Authors to whom correspondence should be addressed.
Sustainability 2018, 10(7), 2483; https://0-doi-org.brum.beds.ac.uk/10.3390/su10072483
Submission received: 7 May 2018
/
Revised: 19 June 2018
/
Accepted: 10 July 2018
/
Published: 16 July 2018
(This article belongs to the Section Economic and Business Aspects of Sustainability)
Abstract
:The study of environmental-oriented total factor energy efficiency considering pollutants as a non-expected output has attracted wide attention, but few studies have included social welfare into the above framework for analyzing China’s provincial energy ecological efficiency (EEE). In addition, China’s fiscal decentralization and economic competition have created tremendous momentum for economic growth; however, research has been lacking on whether they have improved China’s energy utilization, pollution control and social welfare level. To fill these gaps, by applying the 2000–2016 panel data from 30 provinces and considering the social welfare condition, we use the slacks-based measure data envelopment analysis (SBM-DEA) method to calculate EEE and build empirical model to test the relation between EEE, fiscal decentralization and economic competition. The results reveal that, firstly, in the last 16 years EEE has been getting worse and the situation of the middle and western areas of China are poorer than in the eastern area, with the middle area still deteriorating further. Secondly, economic competition among local governments aggravates the provincial EEE in China, while the high degree of fiscal decentralization in state governments significantly contributes to improve the EEE; and the co-impact of economic competition on EEE has been negatively strengthened against the background of fiscal decentralization. Thirdly, the influence of economic competition on EEE presents a regional difference; economic competition makes the degree of EEE go down in the east and middle regions, while by contrast, economic competition has helped the EEE level in western regions. The conclusions point out that the temporal trend of EEE in various regions of China, and the economic competition actions adopted by most Chinese local governments to enhance their own financial strength, have not improved energy efficiency and pollution control capability, and has reduced the social welfare of the region. Accordingly, policy proposals are that the Chinese government can adjust the fiscal and tax revenue system and preferential tax system of the central government and local governments and curb competition between provincial jurisdictions.
1. Introduction
According to the British Petroleum(BP) world energy statistics yearbook 2016 [1], China produces an average of $10,000 in GDP and consumes about 2.9 tons of oil equivalent. The energy intensity is 2.1 times that of the United States, 3 times that of Germany, 3.1 times that of Japan, and 2.5 times that of Brazil. The Chinese government is actively improving the increasingly serious trend of resource shortage and environmental deterioration to achieve the goal of sustainable development while the economy is developing steadily. The 13th five-year plan in China clearly pointed out that green energy is a necessary condition for sustainable development, and must adhere to the basic state policy of saving resources, protecting the environment and residents’ welfare. Improving EEE is of great significance to promote the coordinated development of energy, economy, environment and society. It is necessary to conduct a comprehensive investigation on the institutional factors in the system to improve the EEE and promote the sustainable development of the economy.
Depending on the results of input-output analysis, many studies have been carried out on regional or sectoral energy efficiency. Compared with the calculation of single factor energy efficiency in the past, more input and output factors have been put into the energy evaluation framework, and they are more concerned about the relationship between energy use and greater economic input [2,3,4]. In recent years, numerous studies have suggested that unexpected output that represents environmental pollution and ecological damage is likely to cause energy efficiency losses because of the emissions of large amounts of carbon dioxide, nitrogen oxides, and sulfides that pollute the regional environment from energy use [5,6,7]. For example, Zhang et al. found that air pollution is the major source of pollution in China’s energy utilization process. About 70% of CO2 emissions, 90% of SO2 emissions, and 67% of NO2 emissions in the air come from the use of fossil fuels [8]. As a result, more and more ecological and environmental factors have been integrated into energy efficiency research, and the study of energy eco-efficiency has received increasing attention. Guan and Xu evaluated the provincial energy eco-efficiency in China from 1997 to 2012 to measure the “energy-economy-environment” system, and analyzed its spatial-temporal evolution characteristics [9]. Wang and Wu expanded the energy economic efficiency and energy environmental efficiency from the perspective of greening, constructed the theoretical framework of EEE, and proposed the development modes of “dual-low “, “economical”, “ecological” and “green” energy efficiency [10]. Zhao et al. took the Yangtze River Economic Belt as the research object, and calculated the level and convergence of the overall energy efficiency of the Yangtze River Economic Belt and its upper, middle and lower reaches, respectively [11]. However, in addition to considering the aforementioned environmental-oriented undesirable output, the local social welfare that is directly affected should be considered. Maintaining good social welfare is the ultimate goal of realizing sustainable economic, environmental and social development. Furthermore, residents are the direct stakeholders in environmental quality and energy utilization. Their quality of life, such as health, is harmed by pollutants in the process of energy consumption.
A large number of studies have analyzed the impact of industrial structure adjustment [12,13,14,15,16], technological progress [17,18,19], environmental regulation [20,21] and marketization [22,23] on energy efficiency. However, few works of research have focused on the special phenomenon in the process of China’s economic development: under the background of Chinese fiscal decentralization, various local governments have launched economic competitions through a series of methods, such as tax concessions and industrial subsidies, in order to promote local economic growth and revenue. Since 1994 in particular, China has formally implemented reform on its tax sharing system; the reordered central government and local government fiscal and tax allocation rights significantly affected the level of local development [24], and then on the allocation of resources and regional EEE has had a profound impact. While these changes affect economic development, they also affect regional energy intensity, pollution control and social welfare. There are different degrees of economic competition at different levels of fiscal decentralization among provinces. If local governments are pursuing short-term economic growth, they may neglect improvements in energy efficiency, controlling pollution, and enhancing social welfare. This may worsen local energy eco-efficiency. With the Chinese government putting the control of energy consumption, the improvement of environmental governance and residents’ welfare in a more prominent position, the evaluation system of local development and officials’ achievements has also changed. That is to say, more stringent energy-saving targets, pollution control and public service tasks have been implemented. Considering the impact of economic competition on China’s provincial EEE under fiscal decentralization will help to enrich the study of China’s energy, environment and social welfare.
As a whole, economic competition under different fiscal decentralization situations shows that it may have different effects on the provincial EEE in China. Accordingly, based on some social welfare index considerations, we want to attempt to answer: what is the level and tendency of China’s provincial energy eco-efficiency change by introducing social welfare? Does the interaction effect of fiscal decentralization and economic competition significantly affect China’s provincial energy eco-efficiency besides their single impact? What is the difference in the impact of economic competition under fiscal decentralization on EEE in various regions?
The reminder of this paper is organized in the following way. Section 2 reviews the extant literature and puts forward research hypotheses related to fiscal decentralization, economic competition and EEE. Section 3 calculates and describes the EEE value in various regions that contain eastern, middle and western districts in China by the SBM-DEA method. Section 4 reports the main empirical results and robustness analysis. Section 5 indicates the regional difference in the impact of economic competition on regional EEE. Finally, Section 6 concludes the paper and proposes some policy implications.
2. Literature Review and Research Hypothesis
2.1. The Definition of Energy Ecological Efficiency (EEE)
Research on energy efficiency is a hot topic in the field of energy economics. Judging from the different scope of energy efficiency definitions, energy efficiency can be defined as two types: single factor energy efficiency and total factor energy efficiency [2,25]. The single factor energy efficiency is mainly measured by the energy input-output ratio or output-to-energy input ratio [22]. However, it is only a simple proportional relationship between energy input and output. It does not consider the contribution of labor and capital to output and the substitution between different production factors. Total factor energy efficiency is based on neoclassical production theory and incorporates factors such as labor and capital into the analysis of efficiency. The substitution effect between energy and other factors of production are included, with comprehensive multi-dimensional features [26].
Although the total factor energy efficiency can better measure the energy utilization efficiency, it ignores the problem of environmental pollution in the process of energy utilization. Meeting environmental pollution control needs costs a significant amount. To accurately measure the “quality” of energy utilization, more and more scholars are trying to combine environmental pollution with total factor energy efficiency to carry out research [27,28,29]. We believe that even if environmental factors are combined with total factor energy efficiency, it is still difficult to fully observe energy efficiency because social welfare is also affected, namely social welfare and energy use, and environmental pollution should be equally included in energy efficiency measurement.
Schaltegger and Stumformally defined the connotation of ecological efficiency for the first time, that is, the ratio of economic growth to environmental impact [30]. As defined by the World Business Council for Sustainable Development (WBSCD), it is believed that ecological efficiency is to meet the needs of human society and improve the quality of life by providing competitive goods or services, while reducing the impact of this process on resources and ecology to within the carrying capacity of the Earth [31]. The Organization for Economic Co-operation and Development (OECD) believes that eco-efficiency is an efficiency that meets the needs of human society [32]. Some scholars hold that eco-efficiency is the ratio of changes in economic performance to changes in environmental performance [33,34].
From these definitions, we can see that eco-efficiency also defines material inputs, including economic inputs, and there is a clear link between other inputs and environmental performance and social welfare. Therefore, we suggest that the multi-dimensional variables (economic growth, environmental impact and social welfare) that embody ecological civilization will be integrated into China’s provincial EEE based on relatively mature energy economic efficiency (single economic output) and the energy environmental efficiency (both economic output and environmental performance) measurement framework. Energy eco-efficiency can be defined as controlling the impact of the entire energy development and utilization cycle on the environmental system within the range that the Earth can carry, while promoting economic growth and improving social welfare by providing energy goods and services with competitive advantages.
2.2. Fiscal Decentralization and EEE
Fiscal decentralization means that the central government grants certain local taxation and expenditure powers, and allows local governments to determine the scale and structure of their budgetary revenues and expenditures to a certain extent [35]. At present, many studies have focused on the impact of fiscal decentralization on national or regional environmental pollution, mainly grouping this into two aspects. The first is that based on the “rational person” hypothesis; fiscal decentralization lacks an incentive or restraint mechanism and it is difficult to control environmental problems caused by local government behaviors. The local government will decide whether to take actions depending on what type of public good environmental quality represents [36]. If it is a national public product, the local government expects that the central government will provide pollution control services and it is less motivated to control pollution. As investigated by Oates and Porterney, the collection of environmental information has a scale effect, and environmental information has a diffusion effect. Therefore, it is usually completed by institutions under the jurisdiction of the central government [37]. Decentralized local governments obtain information and related technologies from central government and implement environmental protection. Only when local governments can obtain higher returns, local governments will adopt stricter measures than the federal government to control pollution [38]. Helland and Whitford clearly discovered that the U.S. state government’s pollution control standards for the border areas are lower than the pollution control standards in the state, and there are cases where pollutants are emitted or transferred to neighboring areas [39]. However, as a matter of fact, China’s fiscal decentralization is not a fiscal decentralization in the full sense. It is not demand-oriented and has obvious characteristics of political vertical centralization [40]. The central government has higher authority over local governments at the level of public affairs. Local governments are led and appointed by the central government [35]. Even to a certain extent, local governments need to sacrifice some of their own interests. This obviously does not conform to the “rational person” hypothesis. Therefore, whether fiscal decentralization has a negative effect on the control of environmental pollution by local governments in China is still controversial.
Starting from empirical analysis, the second aspect asserts that fiscal decentralization is regarded as an important variable for explaining environmental pollution, and the relationship between fiscal decentralization and environmental pollution in China is observed [41,42,43]. Many studies support the idea that the improvement of fiscal decentralization level is not conducive to improving the local environment, but makes regional environmental quality significantly worse. Some of these studies have further analyzed the mechanism of fiscal decentralization affecting regional environmental quality [44,45]. They believe that local governments’ competition based on tax returns and political promotion is an important way to influence regional environmental quality under fiscal decentralization [46]. The effect of fiscal decentralization on local environmental quality does not play an independent role. The above research conclusions do not clearly explain why fiscal decentralization has damaged local environmental quality. In addition, it is believed that political promotion is a way to make fiscal decentralization negatively affect the quality of the environment. This simply regards fiscal decentralization and political decentralization as one, which is not conducive to truly observing the effects of fiscal decentralization.
The economic institutional situation plays a very important role in improving the quality of the environment. The influence of lobby groups [47], laws and regulations reform [48], an official’s selection [49], and corruption [50] are all manifestations of local institutional conditions, possibly producing impacts on environmental pollution and regional social welfare. Among numerous studies of economic regimes, there is little attention paid to the relationship between fiscal decentralization, energy efficiency and social welfare. Theoretically speaking, fiscal decentralization indicates that the higher-level government devolves fiscal power to the lower level government. As the central government’s information disadvantage increases the chance of misallocation of resources, the preference characteristics of local residents are simply ignored, and the huge financial burden leads to high costs [51]. Local governments have information advantages and can better represent the preferences of local residents. The transfer of fiscal income and spending power from central government to the local government will be more conducive to improving decision-making efficiency. Fiscal decentralization makes the transfer of local fiscal revenue and actual income gradually symmetrical. Local enthusiasm for the provision and improvement of public services is gradually increasing. It has a more sufficient capacity to improve energy use, environment quality and social welfare. To sum up, this paper puts forward the following hypothesis:
Hypothesis 1 (H1).
Local governments can provide more public services and technologies that meet local preferences and contribute to improved energy eco-efficiency.
2.3. Economic Competition and EEE
Breton [52] proposed a more accurate definition of “local government competition”, which refers to the behavior of governments in different regions within a country using means including tax, education, health care, social security, environmental policy, etc., to attract capital, labor and other liquidity factors to enhance the competitive advantage of each region.
Various factors follow the “voting with the feet” rule in the process of profit-seeking in the market. Economic competition is a mechanism for local governments to compete for factor endowments through a series of preferential conditions to achieve economic development goals or advantages. Therefore, the direct impact of economic competition on energy eco-efficiency is reflected in two aspects. First, it is a positive effect. Through the overflow effect of tax incentives and other means to attract technology and management experience of advanced projects and industries, economic competition may significantly improve the level of local knowledge and skills, promote the upgrading of production processes, and help to provide sufficient funds to support the change of an economic development environment, realize the transformation and upgrading of industry, and enhance the level of energy conservation and environmental governance, so as to achieve the improvement of EEE and promote regional green development.
Also, it may be a negative impact, that is, economic competition leads to an EEE “race to bottom” phenomenon [53]. This is a mainstream opinion among academics. The level of local environmental quality is subject to destructive inter-regional economic competition [54].
Wilson [55] and Rauscher [56] pointed out that to gain competitive advantage and broaden the tax base in economic competition, local governments may adopt strategies to reduce the tax burden, relax environmental regulations, or both. The low tax rate caused by tax competition is not conducive to the compensation of negative externalities of environmental pollution, and tax competition makes local governments adopt relaxed environmental policies. This kind of “inferior competition” finally led local governments to ignore the improvement of social welfare, energy conservation and environmental governance, which makes environmental quality decline and pollution intensify, and ultimately EEE deteriorates. In summary, this article proposes the following hypothesis:
Hypothesis 2 (H2).
Economic competition has a significant impact on energy eco-efficiency.
Hypothesis 2a (H2a).
The spillover effect of economic competition has promoted the improvement of energy eco-efficiency.
Hypothesis 2b (H2b).
Due to the vicious competition effect of “bidding”, economic competition is not conducive to the improvement of energy eco-efficiency.
2.4. Fiscal Decentralization, Economic Competition and EEE
At present, a lot of scholars have pointed out that some factors make a difference to energy efficiency or environmental pollutions [23,57]. It is one-sided to focus solely on the positive relationship between fiscal decentralization or economic competition and energy efficiency. To a certain extent, apart from the independent influence of fiscal decentralization and economic competition on EEE, there may also be interactions.
Yan [58] empirically found that fiscal decentralization is not the main reason for low investment in environmental pollution, for the key reason that government competition makes fiscal decentralization on the negative effect of environmental governance significantly enlarged by the provincial panel data of waste water, waste gas and solid waste in order to study the fiscal decentralization, government competition and environmental governance investment. In the context of fiscal decentralization, local governments often show enthusiasm for economic competition in the form of investment promotion and the introduction of capital to achieve economic development and enhance their own financial strength. Due to the limited local resources and input factors, economic competition can attract high economic benefits through tax incentives and promote the entry of employment projects. In the process of local economic competition, to enhance the attractiveness of regional investment, local governments lacking avenues tend to relax technical and environmental constraints, and even show strong interest in industries with low efficiency and serious pollution, if excessive energy consumption is introduced. Pollution-intensive enterprises have increased regional ecological pressure and social welfare losses, which further exacerbated the decline in regional energy eco-efficiency.
At the same time, there may also be an increase in the degree of economic competition that sets higher standards for the government’s administrative efficiency and management capabilities, forcing the government to decentralize government power, attach importance to the basic role of market allocation, expand fiscal expenditures, and improve the level of the regional public service and business development environment, encouraging enterprises to carry out production process improvement and technological innovation, reduce energy consumption and control environmental pollution. With the support of favorable policies, regional energy eco-efficiency has been greatly improved. Therefore, this article advances these hypothesis:
Hypothesis 3 (H3).
The interaction between fiscal decentralization and economic competition has a significant impact on energy eco-efficiency.
Hypothesis 3a (H3a).
At the background of fiscal decentralization, local government economic competition may curb the growth of energy eco-efficiency.
Hypothesis 3b (H3b).
Economic competition will weaken the preference of local governments for ineffective fiscal expenditure on economic development and promote the improvement of EEE.
3. Energy Eco-Efficiency Measurement and Regional Difference Analysis
3.1. Measurement Method and Index Selection
Guan and Xu [9] believe that the eco-efficiency of energy should consider environmental factors and ecological efficiency by focusing on energy resources. Wang and Wu [10] suggested that factors such as ecological well-being and social welfare should be integrated into the measurement of energy efficiency. At present, some important methods for estimating and evaluating energy efficiency are Data Envelopment Analysis (DEA) and Stochastic Frontier Analysis (SFA), among which DEA is the main method to solve the problems of inconsistent input and output data. Compared with other research methods, DEA has two major advantages: on the one hand, DEA can calculate the input-output indexes of decision-making units with different units, and it does not need to process the data dimensionless before fitting. On the other hand, DEA obtains the optimal weight of the decision unit according to the original data of the decision unit. It does not need to make the weighting assumption for the decision unit in advance and avoid the subjective factors in the hypothesis process, so as to make the evaluation result more objective.
As energy efficiency research increasingly focuses on unfavorable factors such as environmental pollution and ecological damage, the SBM-DEA [59] model that incorporates undesired outputs has also received constant attention from the academic community in energy efficiency measurement. Therefore, the paper decides to use the SBM-Undesirable model with undesired outputs to measure energy eco-efficiency. The specific mathematical model is as follows:
where is the target value of the SBM-Undesirable function, is the slack variable of the input variable, and represent the slack variable of expected and undesired output respectively, represents the input matrix, represents the expected output, represents undesired output, represents the expected output matrix, and represents the undesired output matrix. If = 1, and = = = 0, it indicates that the decision unit has efficiency. Otherwise, it indicates that the decision unit has insufficient efficiency. The current input and output have room for improvement.
This paper selects the panel data for 30 provinces in China (excluding Hong Kong, Macao, Taiwan, and Tibet) during 2000–2015. Each province is considered as a decision-making unit (DMU), including input variables and output variables. In selecting input-output factors, results from the aforementioned literature [5,6,7,8,9,10,11,27,28,29] and the connotations of the issue studied are both considered. In other words, input-output factors are selected in the framework of sustainability development. The availability of data is also considered. All variables are listed as follows.
3.1.1. Input Indicators
- (1)
- Energy. There are many kinds of energy consumption in China, including coal, oil, natural gas, nuclear energy, water energy, wind energy, solar energy and so on. Since every province has different resource endowments and different types of energy consumption account for different proportions of the energy system, it is not appropriate to use certain specific energy consumption to represent all of China’s regional energy inputs. We select total energy consumption as energy input, which is the total energy consumed by various industries and households in a certain area (country, region) in a certain period. The unit is 10,000 tons of standard coal. This part of the data comes from the 2001–2016 China Energy Statistical Yearbook. [60]
- (2)
- Labor. Employees mainly refer to those who have reached the age of 16 and could participate in social work for gaining remuneration or making income. The employment personnel can better reflect the actual use of labor resources in the current year. Therefore, this paper selects the number of employed persons as the measurement index for measuring labor input. Given the difference between annual statistical data and actual annual labor, we specifically take the average of the final number of employees in a year and the final number of employees in a previous year [61]. Data is offered by the China Statistical Yearbook (2001–2016) [62].
- (3)
- Capital. Unavailable in statistical yearbooks, capital stock is indirectly calculated by the perpetual inventory method proposed by Shan [63]. We also assume that the discount rate of total fixed assets varies from province to province [64]. All data are obtained from the China Statistical Yearbook (2001–2016) and are at constant prices for the year 2000 [62].
3.1.2. Output Indicators
- (1)
- Regional GDP (GDP). Strictly speaking, factor input can produce diverse desirable outputs, thus requiring the classification and aggregation of different outputs in practice. Hence, regional GDP, a variable for aggregate outputs in this paper, is taken as the proxy variable for desirable outputs [65]. All data on regional GDP are obtained from the China Statistical Yearbook (2001–2016) [62] and are at constant prices for the year 2000.
- (2)
- Social welfare index. At present, the measurement indicators of social welfare mainly include the human development index (HDI) of the United Nations Development Program and the life expectancy per capita [66]. However, due to lack of statistics, continuous data on life expectancy per capita in 30 provinces in China between 2000 and 2015 cannot be obtained. Hence, according to the 13th five-year plan on employment, education, culture, social security, medical care, housing and other social welfare systems, we respectively select the employment rate, the number of years of education per capita, the total number of books printed per capita, the rate of participation in social security, the rate of ownership of the number of health technical personnel, and the newly-increased construction area per capita, and calculate the six variables in the social welfare index by using the entropy method. All data come from the China Statistical Yearbook (2001–2016) [62].
- (3)
- Undesirable outputs. Since the 10th five-year plan, the Chinese government has viewed sulfur dioxide (SO2) and chemical oxygen demand (COD) as two main environmental pollutants and set a 10% reduction in the total discharge of major pollutants (SO2 and COD) as one of its energy efficiency goals in the 11th five-year plan. In addition, extensive attention has been paid to global climate change in recent years (mainly focusing on greenhouse gases such as CO2). The Chinese government has made a commitment to achieve a 40–45% reduction in carbon dioxide emissions per unit of GDP by 2020, as compared to the level in 2005. Thus, we choose SO2, COD, and CO2 as undesirable environmental outputs. Data on SO2 and COD are obtained from the China Statistical Yearbook on the Environment (2001–2016), and CO2 emissions are estimated using the conversion standard of the Intergovernmental Panel on Climate Change (IPCC) (2006) and based on energy fuel (mainly coal, coke, crude oil, gasoline, kerosene, diesel oil, fuel oil, and natural gas) consumption. Data on energy fuel consumption are obtained from the China Energy Statistical Yearbook (2001–2016) [60].
3.2. Regional Difference Analysis on Energy Eco-Efficiency
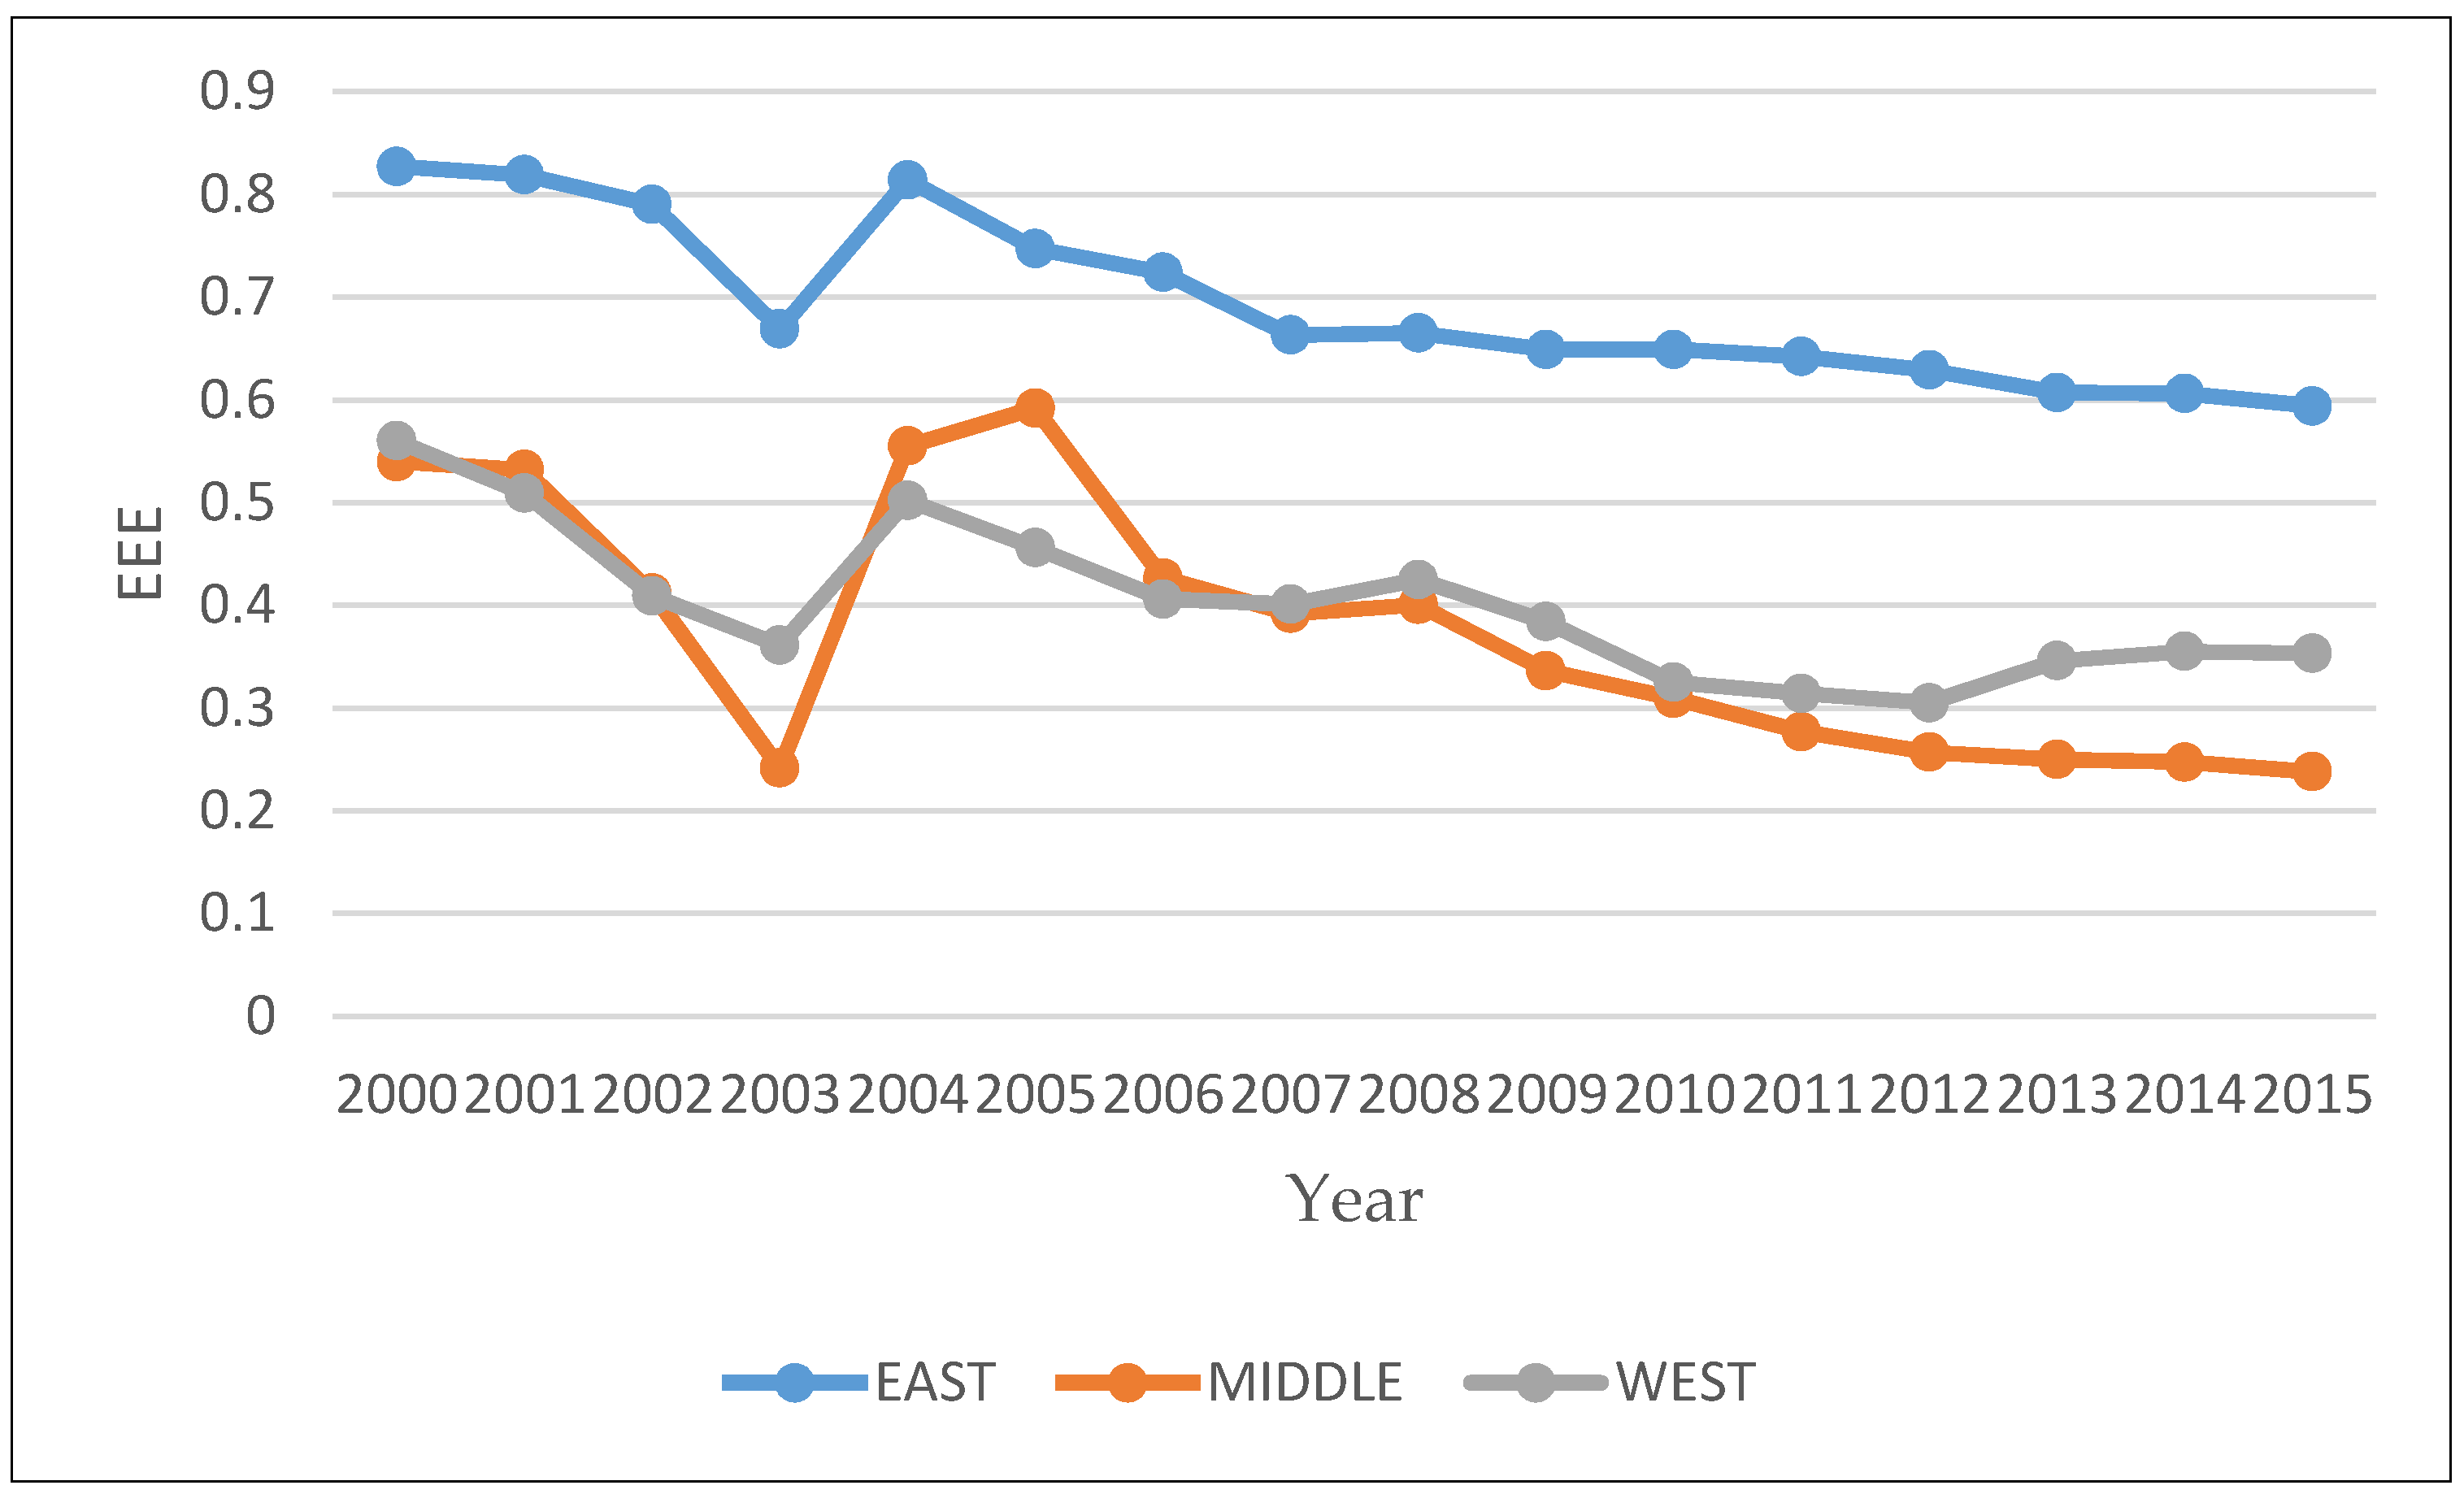
For analyzing and judging the needs of energy eco-efficiency changes and regional differences in China, 30 provinces and cities are divided into eastern, middle and western regions according to the standards of the seventh five-year plan (1986) of the fourth session of the sixth people’s congress of China. Figure 1 is a line graph of the time series of energy eco-efficiency changes in the three major regions during 2000–2015. From the perspective of time change, the energy eco-efficiency of the eastern, central and western regions of China showed a declining trend overall from 2000 to 2015, despite a brief rebound in 2003–2004. Among them, the energy efficiency of the eastern region has converged between 0.600 and 0.700 since 2006, and the central region has recovered slightly since 2012, while the worsening trend in the western region is particularly serious. From the regional cross–section, China’s EEE presents obvious spatial differences. The energy eco-efficiency values in the eastern and central regions were higher than those in the western regions during the whole 16 years. Taking the 2014 energy eco-efficiency value as an example, Guangdong, Beijing, Hainan and other provinces in the eastern region are at the best frontier value, the central regions of Hebei, Anhui, and Hubei are relatively poor, while the western regions of Xinjiang, Guangxi, and Shanxi are Yunnan and other provinces are in the worst area.
We believe that the reasons for the above phenomena are closely related to the regional economic level, factor endowment, and social development level. The eastern region has a high level of economic development, an obvious industrial transformation effect, strong technical strength, a high level of urbanization to promote the level of regional social welfare, and the economic, social and energy-environment system presents a good coordinated development trend; Due to the relatively low level of technology in the central region, high-energy-consuming industries such as coal and steel account for relatively high proportions, making energy eco-efficiency further decline. However, because of the backward level of economic development, unreasonable industrial structure and the absorption of more industries with insufficient technical content, the EEE in the western region is low and continues to deteriorate.
4. Empirical Analysis
4.1. Model Settings
To verify the correctness of the theoretical assumptions, we set EEE as the explained variable, and the fiscal decentralization level and economic competition intensity as the core explanatory variables. In term of model setting, we have mainly learned from He et al. [57], Deng and Xu [67]. The specific econometrics model is as follows:
In addition, this paper not only focuses on fiscal decentralization and economic competition on the impact of energy eco-efficiency, but also in-depth analysis through the economic competition mechanism, and fiscal decentralization on the impact of energy eco-efficiency changes. Therefore, this paper discusses whether the economic competition will change the impact of fiscal decentralization on EEE by the intersection of fiscal decentralization and economic competition. The new model is designed to:
In both models above, where represents the explained variable, represents the model control variable, subscript i represents the province, t represents the time, is the model coefficient, is the random error term.
4.2. Sample Selection and Variable Settings
This part of the sample also contains panel data from 2000 to 2015 in 30 provincial-level administrative regions other than the Tibet Autonomous Region, Hong Kong, Macau, and Taiwan Provinces. All data comes from China Statistical Yearbook [62], China Environmental Statistics Yearbook [68], China Tax Yearbook [69], New China Statistical Data Collection for 50 Years, China Economic Database (CEIC) [70], National Bureau of Statistics, and EPS Database [71].
Explained variables: energy eco-efficiency. This indicator utilizes the energy eco-efficiency value calculated by SBM-DEA.
Explanatory variables: economic competition (com). Driven by the development of GDP, China’s local governments compete for capital, talent and other liquidity factors of production and carry out various forms of economic competition; the intergovernmental horizontal competition is mainly manifested in tax competition [72]. Most of the literature on tax competition mainly adopts the proportion of tax revenue to GDP as the index to measure the actual tax or tax rate [73,74]. The reason lies in the fact that since China carried out the reform of tax-sharing system in 1994, the central government retains the tax collection and legislative power, and the local government has little power to make decisions on tax revenue in practical sense. The purpose of tax competition is to increase the fiscal revenue of the government at the corresponding level [75]. The expansion of their fiscal capacity depends on the growth of tax revenue of the government at the same level. The basis of tax revenue is the tax rate and the tax base. But the tax base in a certain period is difficult to adjust on a large scale.
The tax competition between local governments in China is manifested in tax competition, that is, through various forms of actual tax incentives to attract more working capital. Some scholars take advantage of regional actual tax burdens or preferential tax levels to express tax competition among local governments [76], and the key to showing this index is to accurately measure the effective tax burden of capital. This paper makes use of the calculation methods of Wang and Cui [77] and Wang [66] for reference to calculate the effective capital tax rate of the whole country and the effective capital tax rate of each region, respectively. The difference between the two represents the degree of tax preference of each region. The greater the difference, the greater the tax competition between local governments. The specific formula is: Capital income effective tax rate = Capital Tax/Capital Income. Capital Income = Capital Tax + Operating Surplus − Planned Subsidies to Loss-suffering. From the current stage of China’s tax structure, capital tax primarily includes land use tax, land value-added tax, farmland occupation tax, property tax, vehicle and vessel use and license tax, deed tax, stamp duty, resource tax, urban maintenance and construction tax, enterprise income tax, business tax, value-added tax and personal income tax.
Fiscal decentralization (fd). There are two main methods to estimate the level of fiscal decentralization in China [51]. One is to calculate the fiscal revenue and expenditure and use the fiscal revenue and expenditure proportion of the next level of government to indicate the degree of fiscal decentralization. The other is to utilize the marginal added value measurement of its own income. Since the reform of China’s tax distribution system, fiscal power has been concentrated mainly in the central government, and the share of the central government’s fiscal revenue has increased significantly, making it difficult to express the degree of fiscal decentralization in China through local fiscal revenue as a share of national fiscal revenue. Thus, most of the current literature represents the level of fiscal decentralization by fiscal expenditure decentralization. This paper studies the methods from He and WU [78], and measures the fiscal decentralization level by the ratio of the per capita provincial fiscal expenditure to the per capita total expenditure, which overcomes the interference of the provincial population size and the central transfer payment on fiscal decentralization, and reflects the fiscal decentralization degree of the provinces more scientifically.
These control variables are listed as follows. Firstly, Openness (open) that is indicated by the total amount of import and export trade in region is usually used to explain the various degrees of openness to foreign countries. More global trade may make some impacts on energy consumption and environmental pollution in developing countries. Because of shortages of labor, capital and other factors in these countries, they improve their energy efficiency and the governance of controlling pollution by attracting a lot of advanced technology and senior specialists from developed countries. Although it has some certain advantages, environmental and technical deregulation in local officials are also seriously harmful to enhance the level of energy and environment. Secondly, there is the degree of marketization (market) that is calculated by the percentage of the industrial output value of non-state owned enterprises in total industrial output. It means that if the higher the value, the less monopoly and the more equal competition could be in a district. With more environmental attention and pressure coming from customers and regulations, this forces enterprises to focus on improving the ability of technology to meet these needs in fierce market competition. Thirdly, there is the degree of technology (tec) that is presented by the research and development (R&D) expenditures accounting for the GDP. Larger scale input in R&D means more staff knowledge of technical renovation. This is beneficial to decline the energy consumption rate and pollutant emission. Fourthly, there is the real average GDP (ave_gdp). It represents usually the development level of a country or province. The more the index, it proves that the area stays in a good economic condition and the local government could support much fund on declining energy intensity and improving social welfare and pollution abatement. Fifthly, there is investment in fixed assets (invest) that is measured by total social fixed asset investment scale in all provinces. If much investment is poured into infrastructure and heavy chemistry, it may aggravate the pollution level and energy use. But, if the investment that is utilized in lower pollution and energy consumption sectors, it will be helpful to facilitate the EEE [79]. Sixthly, there is the industrial profit margin (ir) that is explained by the sales revenue margin to measure the average profit margin of industrial enterprises above a designated size [80]. If the value is higher, it shows that companies have such better profitability that they are subject to put more capital into upgrading their manufacturing process. It raises the level of energy efficiency and pollution control, in fact. Last, there is the provincial government consumption expenditure in the provincial GDP ratio (gs) to measure the size of the government, including culture, education, science and health services and administrative fees [81]. The higher the ratio, the more attention paid to promoting to public service levels, education or academic levels [82]. Those may drive the local government to take actions on energy saving and pollution control. In order to solve the effect of the inflation and price changes, we have adjusted all aforementioned control variables, starting with 2000 as the base year. All variables are listed in Table 1.
4.3. Result Analysis
To use the panel data model more accurately, this paper firstly uses the F-test to determine whether to use a pooled model or a fixed-effects regression model. If the test result rejects the pooled regression model, the Hausman test should be used to determine whether to establish the random effect or the fixed effect model. In Table 1, Model 1 and Model 2 are mixed regression and random effects models respectively. Models 3, 4 and 5 use panel data, whence the empirical model needs to be Hausman tested to determine whether to use a fixed effect or a random effect model. Table 1 shows that the F test of Model 1 rejects the hypothesis of pooled regression, while Prob(H) in Models 3, 4 and 5 are all less than 1%, so the fixed effect models should be adopted. The results of each model indicate that the sign direction of the regression coefficient of each economic variable is consistent, and these results are slightly different. The specific coefficient results are shown in Table 1.
According to the results of the model estimation in Table 1, whether Models 1, 2 or 5 reflect the regression coefficient of the fiscal decentralization index is significantly positive, indicating that the higher the level of financial autonomy in various provinces in China, the more the local government tends to develop the local economy. Selecting industries or projects with low energy consumption and environmental pollution is more conducive to improving energy eco-efficiency in different regions.
These results are shown in Table 1. Economic competition has a significant negative impact on energy eco-efficiency. The higher the level of tax concessions formed by reducing the actual tax burden, the more the local government has also relaxed its environmental supervision, ignored environmental governance and continued a “race to the bottom” of environmental pollution, resulting in a continued reduction of energy eco-efficiency in each province. The cross terms of fiscal decentralization and economic competition show a significant negative impact on the energy eco-efficiency of each province. This explains that to continue to promote regional economic development, local governments have expanded or consolidated investment promotion through tax incentives and other measures. On the other hand, they have reduced the intensity of environmental supervision, and local governments have also increased the degree of fiscal decentralization to further increase fiscal revenue. They prefer to give priority to GDP, ignoring high energy consumption and environmental pollution and choosing projects that can generate high returns for regional economic development. Therefore, the fact is that local economic competition has promoted the negative effect of fiscal decentralization on energy eco-efficiency in all provinces. That is, through economic competition, the extent to which local government’s fiscal decentralization deteriorates energy eco-efficiency is strengthened.
By further observing the control variables, we can see: the regression coefficient of open is significantly positive. The reason may be that constantly opening foreign trade has increased regional technological capabilities and factor productivity under the influence of technology spillovers, further reducing energy consumption and pollutant emissions. The regression coefficient of the market is significantly negative, which may be due to the extensive operation mode, low technical level, high energy consumption and serious pollution emission of non-state-owned enterprises represented by small and medium-sized enterprises, which reduce the level of regional EEE. The invest is significantly negative, indicating that local governments will need a large amount of energy resources investment by expanding the scale of infrastructure construction, and will produce significant pollution emissions, deteriorating regional EEE. The ir is significantly positive. This may be due to the improvement of the company’s operating level and profitability. It will favor the selection of low-energy and low-pollution green technologies, which will help improve energy eco-efficiency. The gs is significantly positive. It is possible that with the local government investing more funds to improve the overall welfare level of the region, residents are more concerned about and tend to use energy-saving and green energy sources, thereby increasing the regional energy eco-efficiency. Both tec and ave_gdp are significantly positive, suggesting that as local governments pay attention to the promotion of technological innovation and the improvement of residents’ material living standards, they will help further reduce energy consumption levels and environmental pollution, and promote the progress of EEE.
4.4. Robustness Analysis
To observe whether the above results are disturbed by endogenous problems, panel data which contains the period of 2000–2015 is divided into 2000–2007 and 2008–2015. All the main and control variables remain the same as in former models, while they are tested by a fixed effect model considering robustness standard error for proving the reliability of the results. In addition, both 2000–2007 and 2008–2015 are checked by fixed effect models about fd, com and fd*com.
The results of Table 2 and Table 3 are mostly similar. The level of fiscal decentralization has significantly positive impact upon China’s provincial ecological efficiency, however, the economic competition and the interaction between the two are negatively correlated with the ecological efficiency degree. This indicates that economic competition between provincial governments damages China’s ecological efficiency in the long term. With regard to the effect of control variables on EEE level, the significance of coefficient of open, market and gs are different in the two periods. Specifically speaking, in terms of the open aspect, after China attended the world trade organization (WTO), many foreign companies gradually moved their manufacturing bases to China. Technology and knowledge spillovers from this process help Chinese local government improve their energy utilization and pollution level before 2008. With the great progress on China’s economic strength, greater attention has been given to high-value sectors so that a large number of foreign corporations are fit for China’s investment and promotion standards. In particular, after the outbreak of the US subprime mortgage crisis in 2008, the international trade scale keeps at a relatively low rate of increase, which also has an impact on China’s foreign trade to a certain degree. This lets open produce a weaker influence than before. About the market aspect, it is amazing that in 2008–2015 the coefficient of market is significantly negative. Although market-oriented reform is always focused on by the Chinese central government, many non-owned companies are relatively small and lack sufficient capital. Also, due to the existence of economic competition, regional barriers in factor flow have impeded free competition. Therefore, the market makes negative impact on EEE. With more work done on the citizens welfare aspect about gs, whether it is government assessment needs or active behavior, those measures produce a strong impact on EEE in 2008–2015. Other control variables, such as tec, ave_gdp, invest, also have a strong effect on China’s provincial energy ecological efficiency EEE. Obviously, as the key variables, the impact coefficient of economic competition and fiscal decentralization and its significance are consistent with those mentioned in Table 3, proving the robustness of the empirical analysis.
5. Regional Economic Competition and EEE
In this paper, the regional dummy variables (DumE, DumM, DumW) are introduced in the regression model to attempt to analyze the regional differences in the impact of economic competition on energy efficiency in China’s provinces. According to Zhang and Gong [52], the dummy variables are assigned to 1 for the provinces in eastern, middle and western China and 0 for the provinces in other regions. The geographic vector difference virtual vectors corresponding to the eastern, middle and western provinces are (1,0,0), (0,1,0), (0,0,1). We design the model as:
where subscript i represents province, t represents time, , , , is model coefficient, is random error term.
Model 12 is shown in Table 4 and is a pooled regression model, and F-test rejects the assumption of pooled regression. The Prob (Hausman) in models 14 and 15 is less than 1%. Therefore, the fixed effect model is used in this paper. All test results are shown in Table 4.
According to the estimation results, whether including all control variables or excluding some control variables, economic competition in the eastern and middle regions has a significant negative impact on the realization of energy ecological efficiency EEE, while economic competition in the western region has a significant positive impact on EEE. The reason is possibly that because of the original economic strength in the western region is weak, the industrial structure is deformed, and local government makes full use of a series of policies such as tax incentives to attract better projects from the eastern and central regions to the west. The technology spillover effect embedded in business invitation and investment attraction improves the western region’ management ability and technical level accordingly, thus improving the EEE of the western region, such as Guizhou province, by vigorously attracting “cloud technology + big data” project landing, which not only promotes the economic development of Guizhou but also protects the ecological environment of the region. In the eastern and central regions, due to the relatively high level of economic development, preferential economic competition through taxation has attracted more projects, employment and other factors to flow to them. The excessive consumption of energy resources has resulted in a diseconomy of scale and has caused further environmental pressure. Furthermore, due to the lack of outdated production capacity and the pace of industrial upgrading, the factor productivity and technological level have not made great progress. With the growth of economic strength, it has not further improved energy eco-efficiency.
6. Conclusions
This paper constructs a theoretical framework to further explore the relationship and impact mechanisms of fiscal decentralization, economic competition, and China’s energy eco-efficiency. Based on provincial panel data from 2000 to 2015 in China, the SBM-DEA method was used to measure the energy eco-efficiency in China. We also launched an empirical analysis by econometric models. We asked whether fiscal decentralization and economic competition promote or inhibit energy eco-efficiency. Is there a regional difference? At the same time, we also observed the indirect effects of fiscal decentralization and economic competition on energy eco-efficiency and their effects. Our study draws the following conclusions: (1). According to the analysis on overall and regional efficiency, the trend of China’s energy eco-efficiency has been declining from 2000 to 2015. The level of the eastern region is better than that of the central and western regions. The energy eco-efficiency in the central region has further deteriorated; (2). under the control of other factors, fiscal decentralization has a significant positive impact on energy eco-efficiency, which supports the Hypothesis 1, while economic competition has a negative impact on energy eco-efficiency and Hypothesis 2b is tested. In the context of fiscal decentralization, the local government’s economic competition makes the local government in energy consumption and environmental regulation “race to the bottom”, hindering the improvement of energy eco-efficiency. Accordingly, Hypothesis 3a is true. The main results are also supported by a robustness test; (3). At the regional level, there is a negative correlation between economic competition and energy eco-efficiency in eastern and central China. Economic competition restrains the improvement of energy eco-efficiency in eastern and central China, and it shows a significant positive effect on energy eco-efficiency in western China. Economic competition promotes the improvement of energy eco-efficiency in western China.
Based on theoretical and empirical analysis, these above conclusions have strong practical significance at the policy level. To avoid the local government’s utilitarian goal for short-term economic development, the evaluation and promotion mechanism of local government officials in China needs to be reformed, putting the assessment of environmental governance and public service work in a higher position; the central government should strictly regulate economic competition between local governments and restricts local governments’ blind pursuit of GDP-oriented supremacy. According to the difference of regional development levels, the central government gives the local government a certain degree of financial autonomy, and flexibly adjusts the fiscal and tax sharing between the central and local governments; local governments should actively adjust the tax preferential system, especially the central and western regions which should give priority to the use of preferential policies to attract technology and management experience of advanced projects and industries, not only in line with local economic development, but also in keeping with energy conservation and consumption reduction, and environmental and livelihood welfare improvement. Local governments continue to increase investment in social and people’s livelihoods and technological innovation in terms of fiscal expenditure, encourage enterprises to actively improve production processes, and focus on the technology-leading role of enterprises attracting investment to strengthen communication as well as learning, with the eastern region gaining experience in advanced energy conservation and environmental governance. To further clarify, the rights and responsibilities of the central government and local governments in economic, environmental and people’s livelihood affairs, strengthen the central government’s assessment, audit and supervision of local government environmental pollution control.
Author Contributions
The initial idea for the paper came from M.Z. and he had the main responsibility for the research design, data collection and writing the article, with others contributing to it. T.W. calculated the results of China’s energy ecological efficiency by SBM-DEA, while M.Z. analyzed major parts related to those results. L.Y. and X.-B.X. gave many suggestions and support to guide discussion and revision.
Acknowledgments
The authors gratefully acknowledge the financial support provided by the National Natural Science Foundation of China (Grant No. 71273246) and the crucial project of philosophical and social science study of the ministry of education in China (Grant No. 12JZD034).
Conflicts of Interest
The authors declare no conflict of interest.
References
- BP. Statistical Review of World Energy. Available online: https://www.bp.com/en/global/corporate/energy-economics/statistical-review-of-world-energy.html (accessed on 12 July 2017).
- Wei, Y.M.; Liao, H. Seven Energy Efficiency Indicators and Their Measurement Approaches. China Soft Sci. 2010, 1, 128–137. [Google Scholar]
- Hu, J.L.; Wang, S.C. Total-factor Energy Efficiency of Regions in China. Energy Policy 2006, 34, 3206–3217. [Google Scholar] [CrossRef]
- Zhang, D.G.; Lu, Y.Q. Impact of market segmentation on energy efficiency. China Popul. Resour. Environ. 2017, 27, 65–72. [Google Scholar]
- Yuan, X.L.; Zhang, B.S.; Yang, W.P. The Total Factor Energy Efficiency Measurement of China Based on Environmental Pollution. China Ind. Econ. 2009, 2, 76–86. [Google Scholar] [CrossRef]
- Zhang, N.; Kong, F.; Yu, Y. Measuring ecological total-factor energy efficiency incorporating regional heterogeneities in China. Ecol. Indic. 2015, 51, 165–172. [Google Scholar] [CrossRef]
- Li, J.; Lin, B. Ecological total-factor energy efficiency of China’s heavy and light industries: Which performs better? Renew. Sustain. Energy Rev. 2017, 72, 83–94. [Google Scholar] [CrossRef]
- Zhang, W.; Wu, W.Y. Research on total-factor energy efficiency of metropolitan regions of Yangtze River Delta based on environment performance. Econ. Res. J. 2011, 10, 95–109. [Google Scholar]
- Guan, W.; Xu, S.T. Study on spatial pattern and spatial effect of energy eco-efficiency in China. Acta Geogr. Sin. 2015, 70, 980–992. [Google Scholar] [CrossRef]
- Wang, X.L.; Wu, C.Y. International Comparison on Energy Eco-efficiency under Perspective of Greenization: Empirical Study Based on Panel Data of G20. Technol. Econ. 2015, 34, 70–77. [Google Scholar]
- Zhao, X.; Sun, X.; Tao, R. Energy Eco-Efficiency Evaluation and Convergence Analysis of the Yangtze River Economic Belt from the Perspective of Capacity Reduction. J. Taiyuan Univ. Technol. 2016, 5, 45–50. [Google Scholar]
- Richard, G.; Adam, B. The Induced Innovation Hypothesis and Energy-saving Technological Change. Q. J. Econ. 1999, 114, 941–975. [Google Scholar] [CrossRef]
- Shi, D. The Improvement of Energy Consumption Efficiency in China’s Economic Growth. Econ. Res. J. 2002, 9, 36–43. [Google Scholar]
- Wu, Q.S.; Cheng, J.H. Changes and Factors Decomposition of Chinese Energy Consumption Intensity: 1980—2004. Econ. Theory Bus. Manag. 2006, 10, 34–40. [Google Scholar]
- Lv, M.Y.; Chen, W.X. The study on the impact of industrial structure upgrading on energy efficiency in China based on the data from 1978 to 2013. Resour. Sci. 2016, 38, 1350–1362. [Google Scholar]
- Jiang, X.; Duan, Y.; Green, C. Regional disparity in energy intensity of China and the role of industrial and export structure. Resour. Conserv. Recycl. 2017, 120, 209–218. [Google Scholar] [CrossRef]
- Fisher-Vanden, K.; Jefferson, G.H.; Jingkui, M.; Jianyi, X. Technology Development and Energy Productivity in China. Energy Econ. 2006, 28, 690–705. [Google Scholar] [CrossRef]
- Wang, B.B.; Qi, S.Z. Biased Technological Progress, Factor Substitution and China’s Industrial Energy Intensity. Econ. Res. J. 2014, 2, 115–127. [Google Scholar]
- Fan, R.G.; Luo, M.; Zhang, P.F. A study on evolution of energy intensity in China with heterogeneity and rebound effect. Energy 2016, 99, 159–169. [Google Scholar] [CrossRef]
- Li, J. Can Environmental Regulation Promote the Efficiency of Enterprise Technology Innovation? Econ. Issues China 2013, 4, 38–44. [Google Scholar] [CrossRef]
- Li, B.; Qi, Y.; Li, Q. Fiscal Decentralization, FDI and Green Total Factor Productivity—A Empirical Test Based on Panel Data Dynamic GMM Method. J. Int. Trade 2016, 7, 119–129. [Google Scholar] [CrossRef]
- Lin, B.Q.; Du, K.R. The Energy Effect of Factor Market Distortion in China. Econ. Res. J. 2013, 9, 125–136. [Google Scholar]
- Pan, X.F.; Peng, X.X.; Li, B. Market Distortion, Technical Progress and Energy Efficiency: Policy Choice Based on the provincial Heterogeneity. J. World Econ. 2017, 40, 91–115. [Google Scholar]
- Chen, K.; Hillman, A.L.; Gu, Q.Y. Fiscal Re-centralization and behavioral Change of Local Governments: From the Helping Hand to the Grabbing Hand. China Econ. Q. 2002, 2, 111–130. [Google Scholar] [CrossRef]
- Yang, H.L.; Shi, D. Energy-Efficiency Methods and Comparing the Energy Efficiencies of Different Areas in China. Econ. Theory Bus. Manag. 2008, 3, 12–20. [Google Scholar]
- Lin, B.Q.; Yang, L.S. The potential estimation and factor analysis of China’s energy conservation on thermal power industry. Energy Policy 2013, 62, 354–362. [Google Scholar] [CrossRef]
- Lin, B.Q. The theoretical exploration of scientific outlook on development from the perspective of energy economics. Econ. Res. J. 2012, 3, 154–159. [Google Scholar]
- Hu, B.D. Measuring plant level energy efficiency in China’s energy sector in the presence of allocates inefficiency. China Econ. Rev. 2014, 31, 130–144. [Google Scholar] [CrossRef]
- Lu, W.; Su, M.; Zhang, Y.; Yang, Z.; Chen, B.; Liu, G. Assessment of energy security in China based on ecological network analysis: A perspective from the security of crude oil supply. Energy Policy 2014, 74, 406–413. [Google Scholar] [CrossRef]
- Schaltegger, S.; Sturm, A. Ökologische Rationalität: Ansatzpunkte zur Ausgestaltung von ökologieorientierten Managementinstrumenten. Die Unternehmung 1990, 4, 273–290. [Google Scholar]
- World Business Council for Sustainable Development. Eco-Efficient Leadership for Improved Economic and Environmental Performance; World Business Council for Sustainable Development: Geneva, Switzerland, 1995. [Google Scholar]
- OECD. Eco-Efficiency; Organization for Economic Cooperation and Development: Paris, France, 1998. [Google Scholar]
- Müller, K.; Sturm, A. Standardized Eco-Efficiency Indicators—Report 1: Concept Paper; Ellipson: Basel, Switzerland, 2001; Volume 1, p. 72. [Google Scholar]
- Scholz, R.W.; Wiek, A. Operational Eco-efficiency: Comparing Firms’ Environmental Investments in Different Domains of Operation. J. Ind. Ecol. 2005, 4, 155–170. [Google Scholar] [CrossRef]
- Oates, W.E. An Essay on Fiscal Federalism. J. Econ. Lit. 1999, 3, 1120–1149. [Google Scholar] [CrossRef]
- Oates, W.E. The Arsenic Rule: A Case for Decentralized Standard Setting? Resources 2002, 147, 16–18. [Google Scholar]
- Oates, W.E.; Portney, P.R. The Political Economy of Environmental Policy. Handb. Environ. Econ. 2003, 1, 325–354. [Google Scholar] [CrossRef] [Green Version]
- Gray, W.; Shadbegian, R.J. Optimal Pollution Abatement-Whose Benefits Matter and How much? J. Environ. Econ. Manag. 2004, 3, 510–534. [Google Scholar] [CrossRef]
- Helland, E.; Whitford, A.B. Pollution Incidence and Political Jurisdiction: Evidence from the TRI. J. Environ. Econ. Manag. 2003, 3, 403–424. [Google Scholar] [CrossRef]
- Blanchard, O.; Shleifer, A. Federalism with and without Political Centralization: China Versus Russia. IMF Staff Pap. 2001, 48, 171–179. [Google Scholar] [CrossRef]
- Zhang, K.Z.; Wang, J.; Cui, X.Y. Fiscal Decentralization and Environmental Pollution: From the Perspective of Carbon Emission. China Ind. Econ. 2011, 10, 65–75. [Google Scholar] [CrossRef]
- Xue, G.; Pang, X.Z. An Empirical Analysis on the Impact of Fiscal Decentralization on Environmental Pollution in China. China Popul. Resour. Environ. 2012, 1, 83–89. [Google Scholar]
- Ma, X.Y.; Li, Q.Y.; Guo, Y.Y. Theoretical and Empirical Analysis of China’s Fiscal Decentralization and Environmental Pollution—Based on Provincial Static and Dynamic Panel Data Model. Econ. Surv. 2013, 5, 122–127. [Google Scholar] [CrossRef]
- Oates, W.E. Fiscal and regulatory competition: Theory and evidence. Perspekt. Wirtsch. 2002, 4, 377–390. [Google Scholar] [CrossRef]
- Sigman, H. Decentralization and environmental quality: An international analysis of water pollution levels and variation. Land Econ. 2014, 90, 114–130. [Google Scholar] [CrossRef]
- Zhou, L.A. Governing China’s Local Officials: Analysis of Promotion Tournament Model. Econ. Res. J. 2007, 7, 36–50. [Google Scholar]
- Tosun, J. Political parties and marine pollution policy: Exploring the case of Germany. Mar. Policy 2011, 35, 536–541. [Google Scholar] [CrossRef] [Green Version]
- Wang, A.L. The search for sustainable legitimacy: Environmental, law and bureaucracy in China. Harv. Environ. Law Rev. 2013, 36, 367–382. [Google Scholar] [CrossRef]
- Qiao, K.Y. The re-examination of promotion mechanism of Chinese officials: Evidence from provincial and municipal governments. J. Financ. Econ. 2013, 4, 123–133. [Google Scholar]
- Lopez, R.; Mitra, S. Corruption, pollution and the Kuznets environment curve. J. Environ. Econ. Manag. 2000, 40, 137–150. [Google Scholar] [CrossRef]
- Zhang, Y.; Gong, L.T. The Fenshuizhi Reform, Fiscal Decentralization, and Economics Growth in China. China Econ. Q. 2005, 5, 75–108. [Google Scholar] [CrossRef]
- Breton, A. Competitive governments: An economic theory of politics and public finance. Public Choice 1996, 2, 223–227. [Google Scholar]
- Li, X.J.; Zhao, N. How Tax Competition Influences Environmental Pollution—An Analysis from the Pollutant Properties of Spillover. Financ. Trade Econ. 2017, 11, 131–146. [Google Scholar]
- Cumberland, J.H. Efficiency and Equity in Interregional Environment Management. Int. Reg. Sci. Rev. 1981, 2, 325–358. [Google Scholar]
- Wilson, J.D. Theories of Tax Competition. Natl. Tax J. 1999, 52, 269–304. [Google Scholar]
- Rauscher, M. Economic Growth and Tax Competition Leviathans. Int. Tax Public Financ. 2005, 12, 457–474. [Google Scholar] [CrossRef]
- He, J.; Liu, L.L.; Zhang, Y.J. Tax Competition, Revenue Decentralization and China’s Environmental Pollution. China Popul. Resour. Environ. 2016, 26, 1–7. [Google Scholar]
- Yan, W.J. Fiscal Decentralization, Government Competition and Environmental Pollution Disposal Investment. Financ. Trade Res. 2012, 23, 91–97. [Google Scholar] [CrossRef]
- Cooper, W.W.; Seiford, L.M.; Tone, K. Data Envelopment Analysis: A Comprehensive Text with Models, Applications, References and DEA-Solver Software, 2nd ed.; Springer: New York, NY, USA, 2007; p. 368. [Google Scholar]
- National Bureau of Statistics of China China Energy Statistical Yearbook Available online:. Available online: http://tongji.cnki.net/kns55/Navi/HomePage.aspx?id=N2016120537&name=YCXME&floor=1 (accessed on 17 June 2017).
- Wang, Z.; Feng, C. A performance evaluation of the energy, environmental, and economic efficiency and productivity in China: An application of global data envelopment analysis. Appl. Energy 2015, 147, 617–626. [Google Scholar] [CrossRef]
- National Bureau of Statistics of China. China Statistical Yearbook. Available online: http://www.stats.gov.cn/english/statisticaldata/annualdata/ (accessed on 20 June 2017).
- Shan, H.J. Reestimating the capital stock of China: 1952–2006. J. Quant. Tech. Econ. 2008, 10, 17–31. [Google Scholar] [CrossRef]
- Wu, Y.R. The Role of Productivity in China’s Growth: New Estimates. China Econ. Q. 2008, 7, 827–842. [Google Scholar] [CrossRef]
- Kuosmanen, T.; Kortelainen, M. Stochastic non-smooth envelopment of data: Semi-parametric frontier estimation subject to shape constraints. J. Prod. Anal. 2012, 38, 11–28. [Google Scholar] [CrossRef] [Green Version]
- Liu, G.P.; Zhu, Y. Total Factor Wellbeing Performance of Chinese Provincial Region within the Limitation of Carbon Emission. Soft Sci. 2014, 28, 88–93. [Google Scholar] [CrossRef]
- Deng, Y.P.; Xu, H.L. Foreign Direct Investment, Local Government Competition and Environmental Pollution: Empirical Analysis on Fiscal Decentralization. China Popul. Resour. Environ. 2013, 23, 155–163. [Google Scholar]
- National Bureau of Statistics of China. China Environmental Statistics Yearbook. Available online: http://tongji.cnki.net/kns55/Navi/HomePage.aspx?id=N2011010074&name=YHJSD&floor=1 (accessed on 30 June 2017).
- National Bureau of Statistics of China. China Tax Yearbook. Available online: http://tongji.cnki.net/kns55/navi/HomePage.aspx?id=N2011040004&name=YZGRE&floor=1 (accessed on 26 June 2017).
- CEIC. China Economic Database. Available online: https://www.ceicdata.com/zh-hans/products/china-economic-database (accessed on 13 June 2017).
- EPS. EPS China Data. Available online: http://www.epschinadata.com/ (accessed on 15 June 2017).
- Wang, J.J.; Tong, J.Z.; Li, X. Tax Competition, Fiscal Pressure and the Non-Tax Revenue Expansion of Local Governments. Financ. Trade Econ. 2014, 35, 27–38. [Google Scholar]
- Shen, K.R.; Fu, W.L. Tax Competition, Region Game and Their Efficiency of Growth. Econ. Res. J. 2006, 6, 16–26. [Google Scholar]
- Wang, F.R.; Miao, M. Tax Competition, Regional Environment and Inter-regional Capital Flow: An Empirical Research Based on the perspective of Inter-Province M&A. Econ. Res. J. 2015, 2, 16–30. [Google Scholar]
- Cui, Y.F.; Liu, X.C. Provincial Tax Competition and Environmental Pollution: Based on Panel Data from 1998 to 2006 in China. J. Financ. Econ. 2010, 4, 47–56. [Google Scholar] [CrossRef]
- Fang, H.S.; Zhang, J. Chinese Local Government, Soft Budget Constraint and Expansion-biased Fiscal Behavior. Econ. Res. J. 2009, 12, 4–16. [Google Scholar]
- Wang, B.; Cui, Z.W. Effective Tax Rates, Investment and Economic Growth: An Empirical Investigation in China. Manag. Rev. 2012, 24, 3–12. [Google Scholar] [CrossRef]
- He, J.; Wu, Z.Y. Fiscal Decentralization, Economic Growth and Urban-Rural Income Gap: An Analysis Based on Inter-Provincial Panel Date. Contemp. Financ. Econ. 2013, 5, 27–38. [Google Scholar] [CrossRef]
- Zeng, K.; Eastin, J. Do developing countries invest up? The environmental effects of foreign direct investment from less-developed countries. World Dev. 2012, 40, 2221–2233. [Google Scholar] [CrossRef]
- Wang, C.F.; Wang, T. RMB Exchange Rate, Foreign Demands and Profit Margin of China’s Industry Sectors. J. Quant. Tech. Econ. 2013, 3, 53–65. [Google Scholar] [CrossRef]
- Zhou, L.A.; Tao, J. Government Size, Market Development and Corruption. Econ. Res. J. 2009, 1, 57–69. [Google Scholar]
- Yang, Z.H. An Investigation on the Nonlinear Relationship between Government Size, Expenditure Growth and Economic Growth. J. Quant. Tech. Econ. 2011, 6, 77–92. [Google Scholar] [CrossRef]
Figure 1.
Temporal trend of energy ecological efficiency (EEE) in eastern, middle and western China.
Figure 1.
Temporal trend of energy ecological efficiency (EEE) in eastern, middle and western China.


Table 1.
Descriptive statistics of variables.
| Variable | Mean | Std. Dev. | Min | Max | Observations |
|---|---|---|---|---|---|
| EEE | 0.501 | 0.290 | 0.012 | 1 | 480 |
| fd | 0.506 | 0.177 | 0.148 | 0.906 | 480 |
| com | −0.013 | 0.069 | −0.243 | 0.095 | 480 |
| open | 0.345 | 0.800 | 0.006 | 14.722 | 480 |
| market | 0.417 | 0.217 | 0.030 | 1.968 | 480 |
| ave_gdp | 17,664.32 | 12,304.36 | 2759 | 79,132.93 | 480 |
| tec | 0.092 | 0.016 | 0.048 | 0.131 | 480 |
| invest | 0.572 | 0.220 | 0.252 | 1.328 | 480 |
| ir | 0.060 | 0.034 | −0.007 | 0.223 | 480 |
| gs | 0.192 | 0.085 | 0.077 | 0.628 | 480 |
Table 2.
Regression results.
| Variables | Model 1 | Model 2 | Model 3 | Model 4 | Model 5 |
|---|---|---|---|---|---|
| fd | 0.482 *** (3.21) | 0.475 *** (3.18) | 0.435 ** (2.59) | 0.308 ** (2.28) | |
| com | −0.606 *** (−2.69) | −0.607 *** (−2.79) | −0.794 *** (−5.12) | −0.607 *** (−7.78) | |
| fd*com | −1.570 * (−1.66) | −1.735 * (−1.89) | −1.458 * (−2.09) | ||
| open | 0.028 ** (2.14) | 0.030 ** (2.39) | 0.033 * (1.89) | 0.033 (1.78) | 0.031 * (1.82) |
| market | −0.283 *** (−4.26) | −0.310 *** (−4.64) | −0.333 *** (-4.62) | −0.394 *** (−6.50) | −0.380 *** (−4.50) |
| tec | 0.073 *** (6.35) | 0.067 *** (5.44) | 0.049 *** (7.16) | 0.032 ** (2.77) | 0.044 *** (5.06) |
| ave_gdp | 7.15 × 10⁻⁶ *** (3.35) | 7.62 × 10⁻⁶ *** (3.39) | 1.41 × 10⁻⁵ *** (5.87) | 1.58 × 10⁻⁵ *** (10.01) | 1.19 × 10⁻⁵ *** (4.92) |
| invest | −0.568 *** (−6.96) | −0.543 *** (−6.32) | −0.435 *** (−4.00) | −0.401 ** (−3.45) | −0.388 *** (−3.48) |
| ir | 0.036 (0.10) | 0.417 (1.01) | 0.293 (1.03) | 0.719 ** (2.38) | 0.794 ** (2.97) |
| gs | 0.887 *** (3.60) | 1.059 *** (4.10) | 1.708 *** (11.25) | 1.178 *** (11.22) | 1.369 *** (9.28) |
| R-squared | 0.570 | 0.571 | 0.579 | 0.585 | |
| F | 0.0000 | 0.0000 | 0.0000 | 0.0000 | 0.0000 |
| Hausman | 0.0000 | 0.0000 | 0.0000 | ||
| Observations | 480 | 480 | 480 | 480 | 480 |
Note: *, **, and *** are significant at the levels of 10%, 5%, and 1%, respectively; the t-test value is in parentheses.
Table 3.
Robustness check results on 2000–2007 and 2008–2015.
| 2000–2007 | 2008–2015 | |||||
|---|---|---|---|---|---|---|
| Variables | Model 6 | Model 7 | Model 8 | Model 9 | Model 10 | Model 11 |
| fd | 0.517 * (2.42) | 0.431 ** (2.26) | 0.598 *** (4.74) | 0.521 *** (6.20) | ||
| com | −0.675 *** (−3.86) | −0.543 ** (−2.89) | −0. 833 *** (−5.72) | −0.494 *** (−5.62) | ||
| fd*com | −1.073 ** (−2.39) | −1.717 *** (−4.15) | ||||
| open | 0.398 ** (5.65) | 0.439 *** (11.53) | 0.475 *** (11.73) | 0.014 (1.24) | 0.014 (1.01) | 0.013 (1.24) |
| market | −0.224 (−2.23) | −0.065 (−1.03) | −0.147 (−1.80) | −0. 414 *** (−6.50) | −0. 474 *** (−9.88) | −0.453 *** (−7.77) |
| tec | 0.108 *** (6.14) | 0.067 ** (5.44) | 0.123 *** (8.51) | 0. 045 *** (7.70) | 0.020 * (2.10) | 0.040 *** (5.97) |
| ave_gdp | 1.79 × 10−5 * (2.57) | 1.82 × 10⁻⁵ *** (6.12) | 2 × 10⁻⁵ *** (6.25) | 6.67 × 10⁻⁶ *** (6.38) | 9.83 × 10⁻⁶ *** (31.43) | 5.01 × 10⁻⁶ *** (7.37) |
| invest | −0.451 ** (−3.21) | −0.456 *** (−6.06) | −0.438 *** (−7.94) | −0. 425 ** (−4.22) | −0.369 ** (−3.21) | −0.364 *** (−3.21) |
| ir | 0.127 (0.34) | 0.415 (0.92) | 0.367 (0.84) | 1.023 (1.89) | 0.680 (1.21) | 0.594 (1.13) |
| gs | 0.449 (1.06) | 0.021 (0.56) | 0.442 (1.51) | 1.660 *** (11.86) | 1.078 *** (30.20) | 1.435 *** (13.95) |
| R-squared | 0.461 | 0.454 | 0.517 | 0.521 | 0.522 | 0.537 |
| F | 0.0000 | 0.0000 | 0.0000 | 0.0000 | 0.0000 | 0.0000 |
| Hausman | 0.0000 | 0.0000 | 0.0003 | 0.0000 | 0.0000 | 0.0001 |
| Observations | 240 | 240 | 240 | 240 | 240 | 240 |
Note: *, **, and *** are significant at the levels of 10%, 5%, and 1%, respectively; the t-test value is in parentheses.
Table 4.
Regression results of economic competition on EEE—eastern, middle and western China.
| Variables | Model 12 | Model 13 | Model 14 | Model 15 |
|---|---|---|---|---|
| DumE*com | −0.892 ** (−2.66) | −0.869*** (−3.63) | −1.276*** (−9.10) | −1.310 *** (−9.35) |
| DumM*com | −0.782 (−1.40) | −0.835 ** (−2.32) | −0.698 *** (−3.88) | −0.697 *** (−3.75) |
| DumW*com | 1.437 (1.86) | 1.501996 *** (4.87) | 0.8472537 *** (4.07) | 0.846 *** (4.04) |
| fd | 0.572 ** (2.26) | 0.521 *** (3.74) | 0.253 * (2.15) | 0.279 ** (2.35) |
| market | −0.207 * (−1.99) | −0.234 *** (−3.96) | −0.360 *** (−5.80) | −0.360 *** (−5.70) |
| tec | 0.084 ** (2.53) | 0.076 ** (6.62) | 0.030 ** (2.27) | 0.028 * (2.13) |
| ave_gdp | 8.78 × 10⁻⁶ ** (2.17) | 9.41 × 10⁻⁶ *** (4.53) | 1.06 × 10⁻⁵ *** (5.13) | 1.06 × 10⁻⁵ *** (5.06) |
| invest | −0.565 ** (−2.48) | −0.5652029 *** (−6.92) | −0.399 *** (−3.30) | −0.417 *** (−3.38) |
| ir | −0.384 (−0.57) | −0.153 (−0.44) | 0.789 ** (2.82) | 0.742 ** (2.57) |
| gs | 1.218 ** (2.57) | 1.384 *** (5.76) | 1.616 *** (9.40) | 1.651 *** (9.56) |
| open | 0.035 (1.24) | 0.038 *** (2.85) | 0.029 (1.70) | |
| R-squared | 0.5404 | 0.6183 | 0.6118 | |
| F | 0.0000 | 0.0000 | 0.0000 | 0.0000 |
| Hausman | 0.0000 | 0.0000 | ||
| Observations | 480 | 480 | 480 | 480 |
Note: *, **, and *** are significant at the levels of 10%, 5%, and 1%, respectively; the t-test value is in parentheses.
© 2018 by the authors. Licensee MDPI, Basel, Switzerland. This article is an open access article distributed under the terms and conditions of the Creative Commons Attribution (CC BY) license (http://creativecommons.org/licenses/by/4.0/).
Share and Cite
MDPI and ACS Style
Zhou, M.; Wang, T.; Yan, L.; Xie, X.-B. Has Economic Competition Improved China’s Provincial Energy Ecological Efficiency under Fiscal Decentralization? Sustainability 2018, 10, 2483. https://0-doi-org.brum.beds.ac.uk/10.3390/su10072483
AMA Style
Zhou M, Wang T, Yan L, Xie X-B. Has Economic Competition Improved China’s Provincial Energy Ecological Efficiency under Fiscal Decentralization? Sustainability. 2018; 10(7):2483. https://0-doi-org.brum.beds.ac.uk/10.3390/su10072483
Chicago/Turabian StyleZhou, Min, Teng Wang, Liang Yan, and Xiong-Biao Xie. 2018. "Has Economic Competition Improved China’s Provincial Energy Ecological Efficiency under Fiscal Decentralization?" Sustainability 10, no. 7: 2483. https://0-doi-org.brum.beds.ac.uk/10.3390/su10072483
Note that from the first issue of 2016, this journal uses article numbers instead of page numbers. See further details here.