Simplified Analytical Model and Shaking Table Test Validation for Seismic Analysis of Mid-Rise Cold-Formed Steel Composite Shear Wall Building

Abstract
:1. Introduction
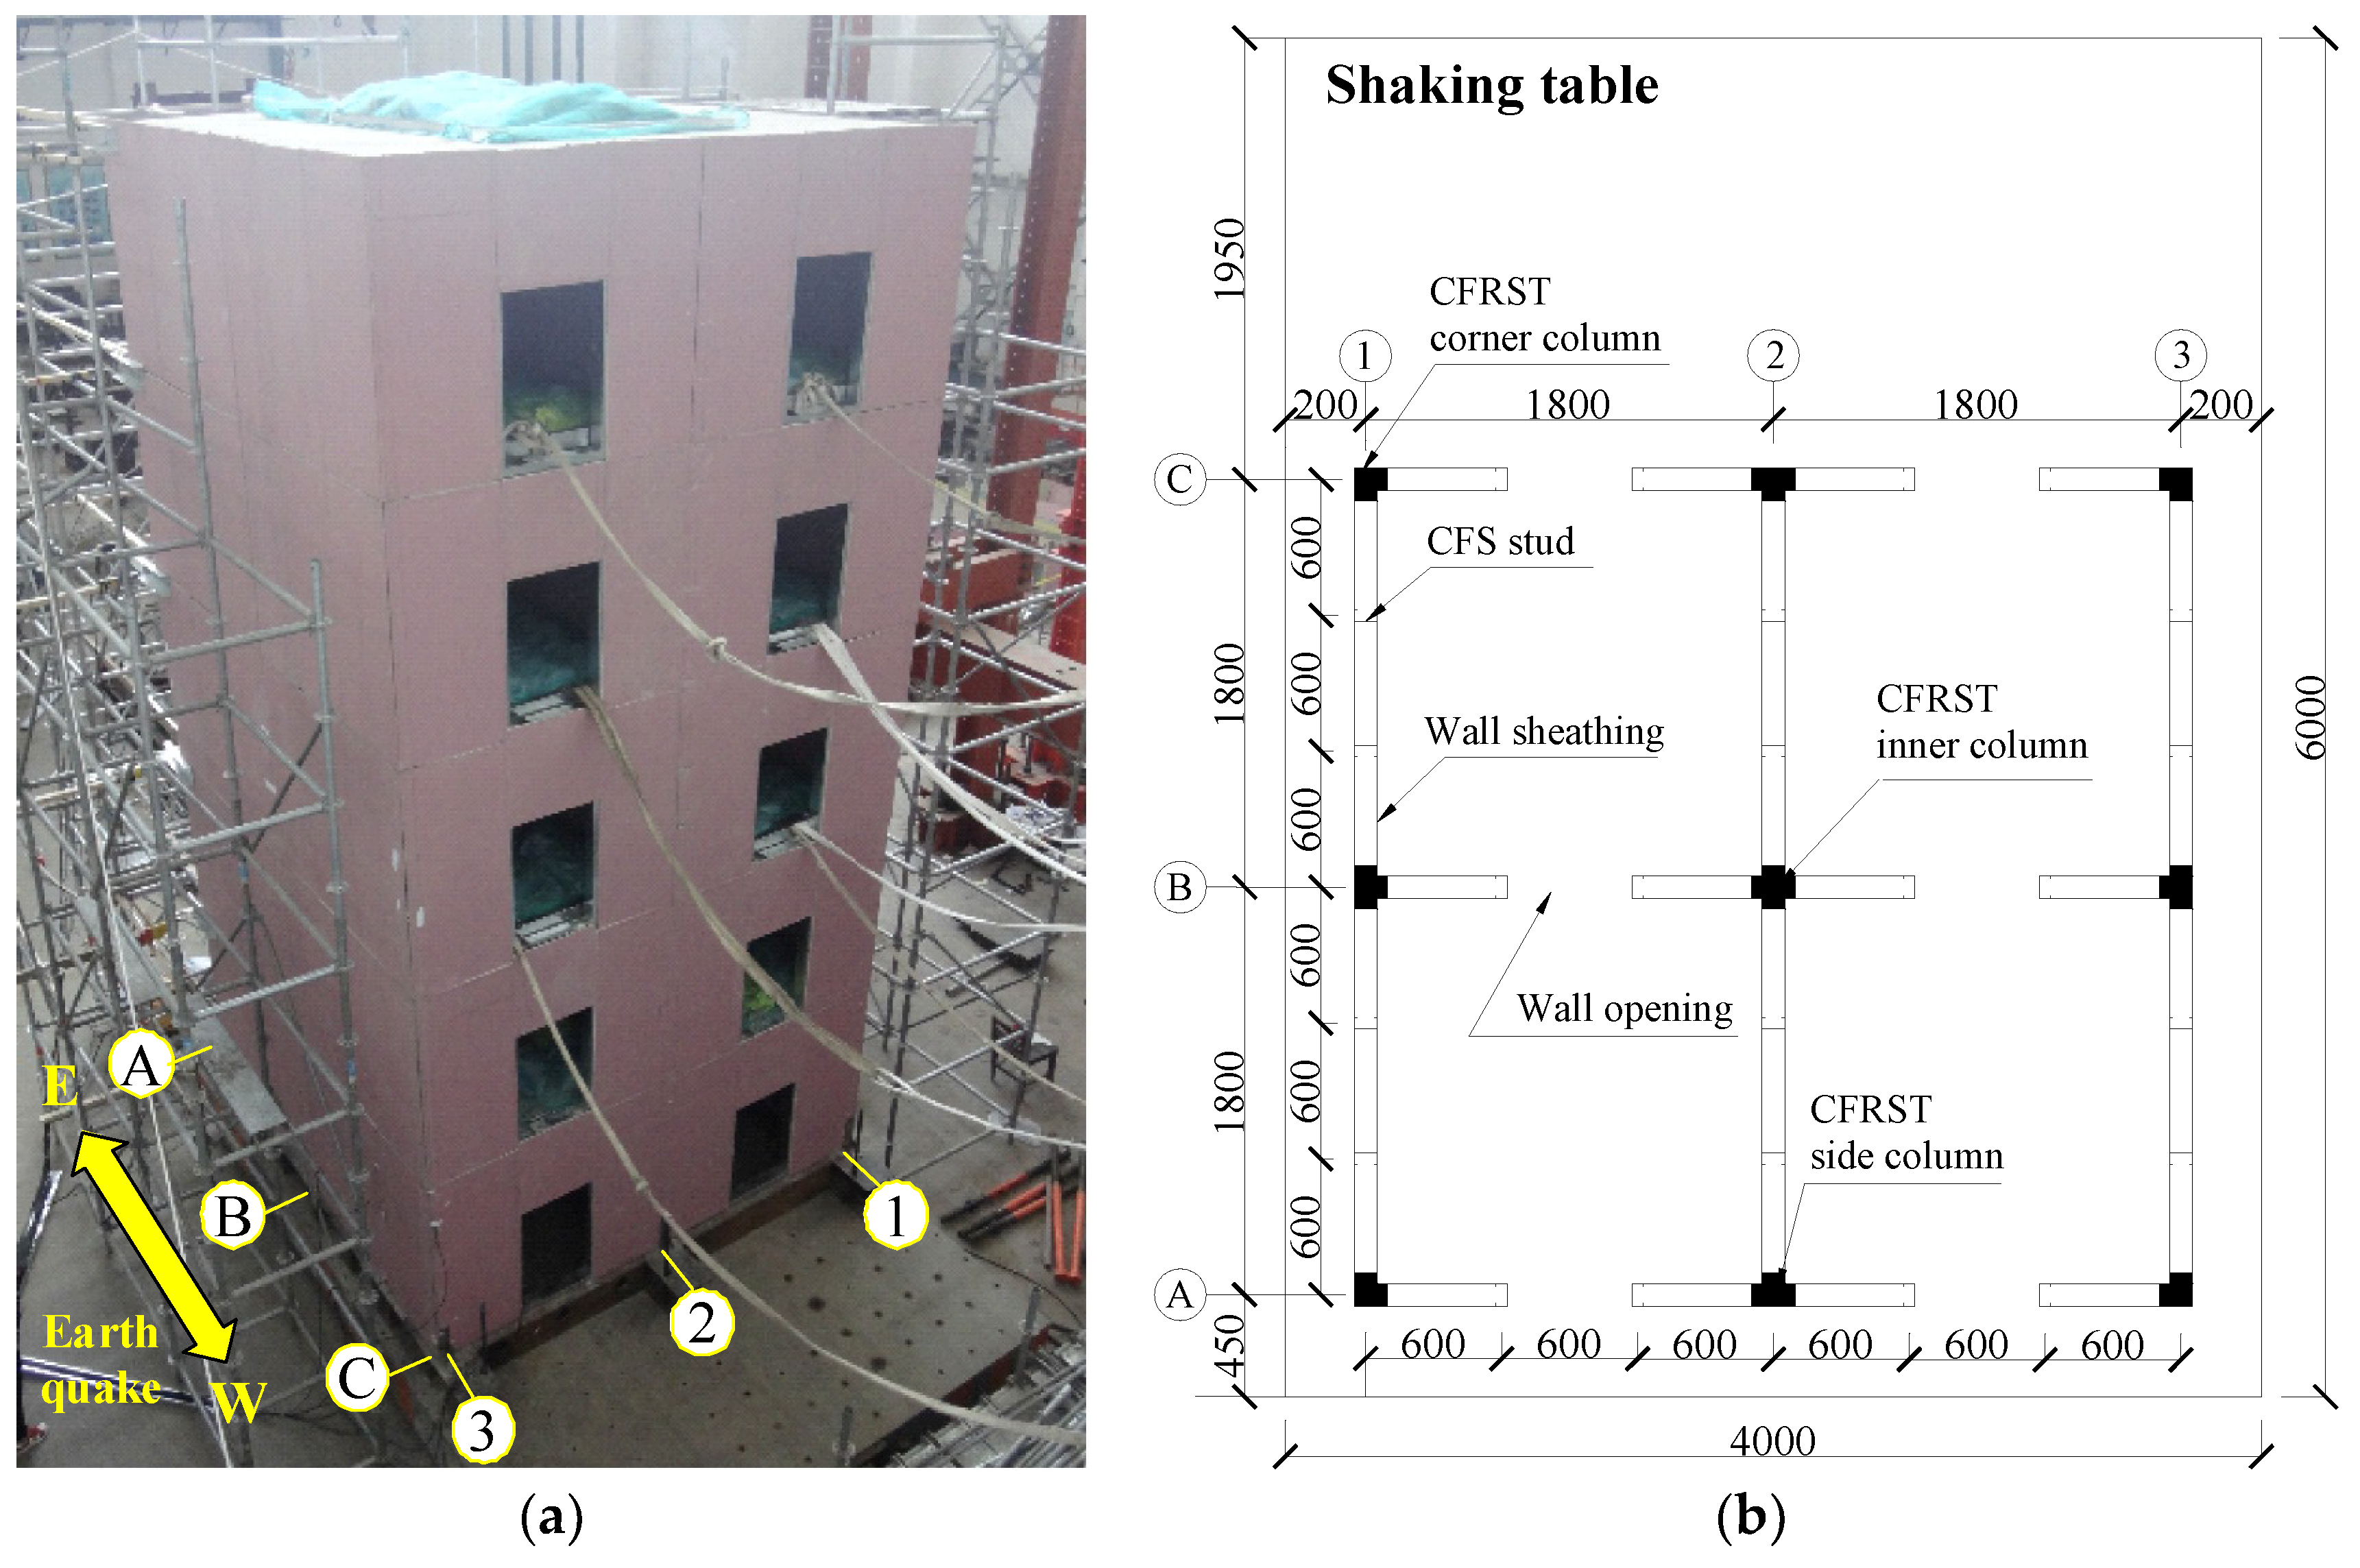
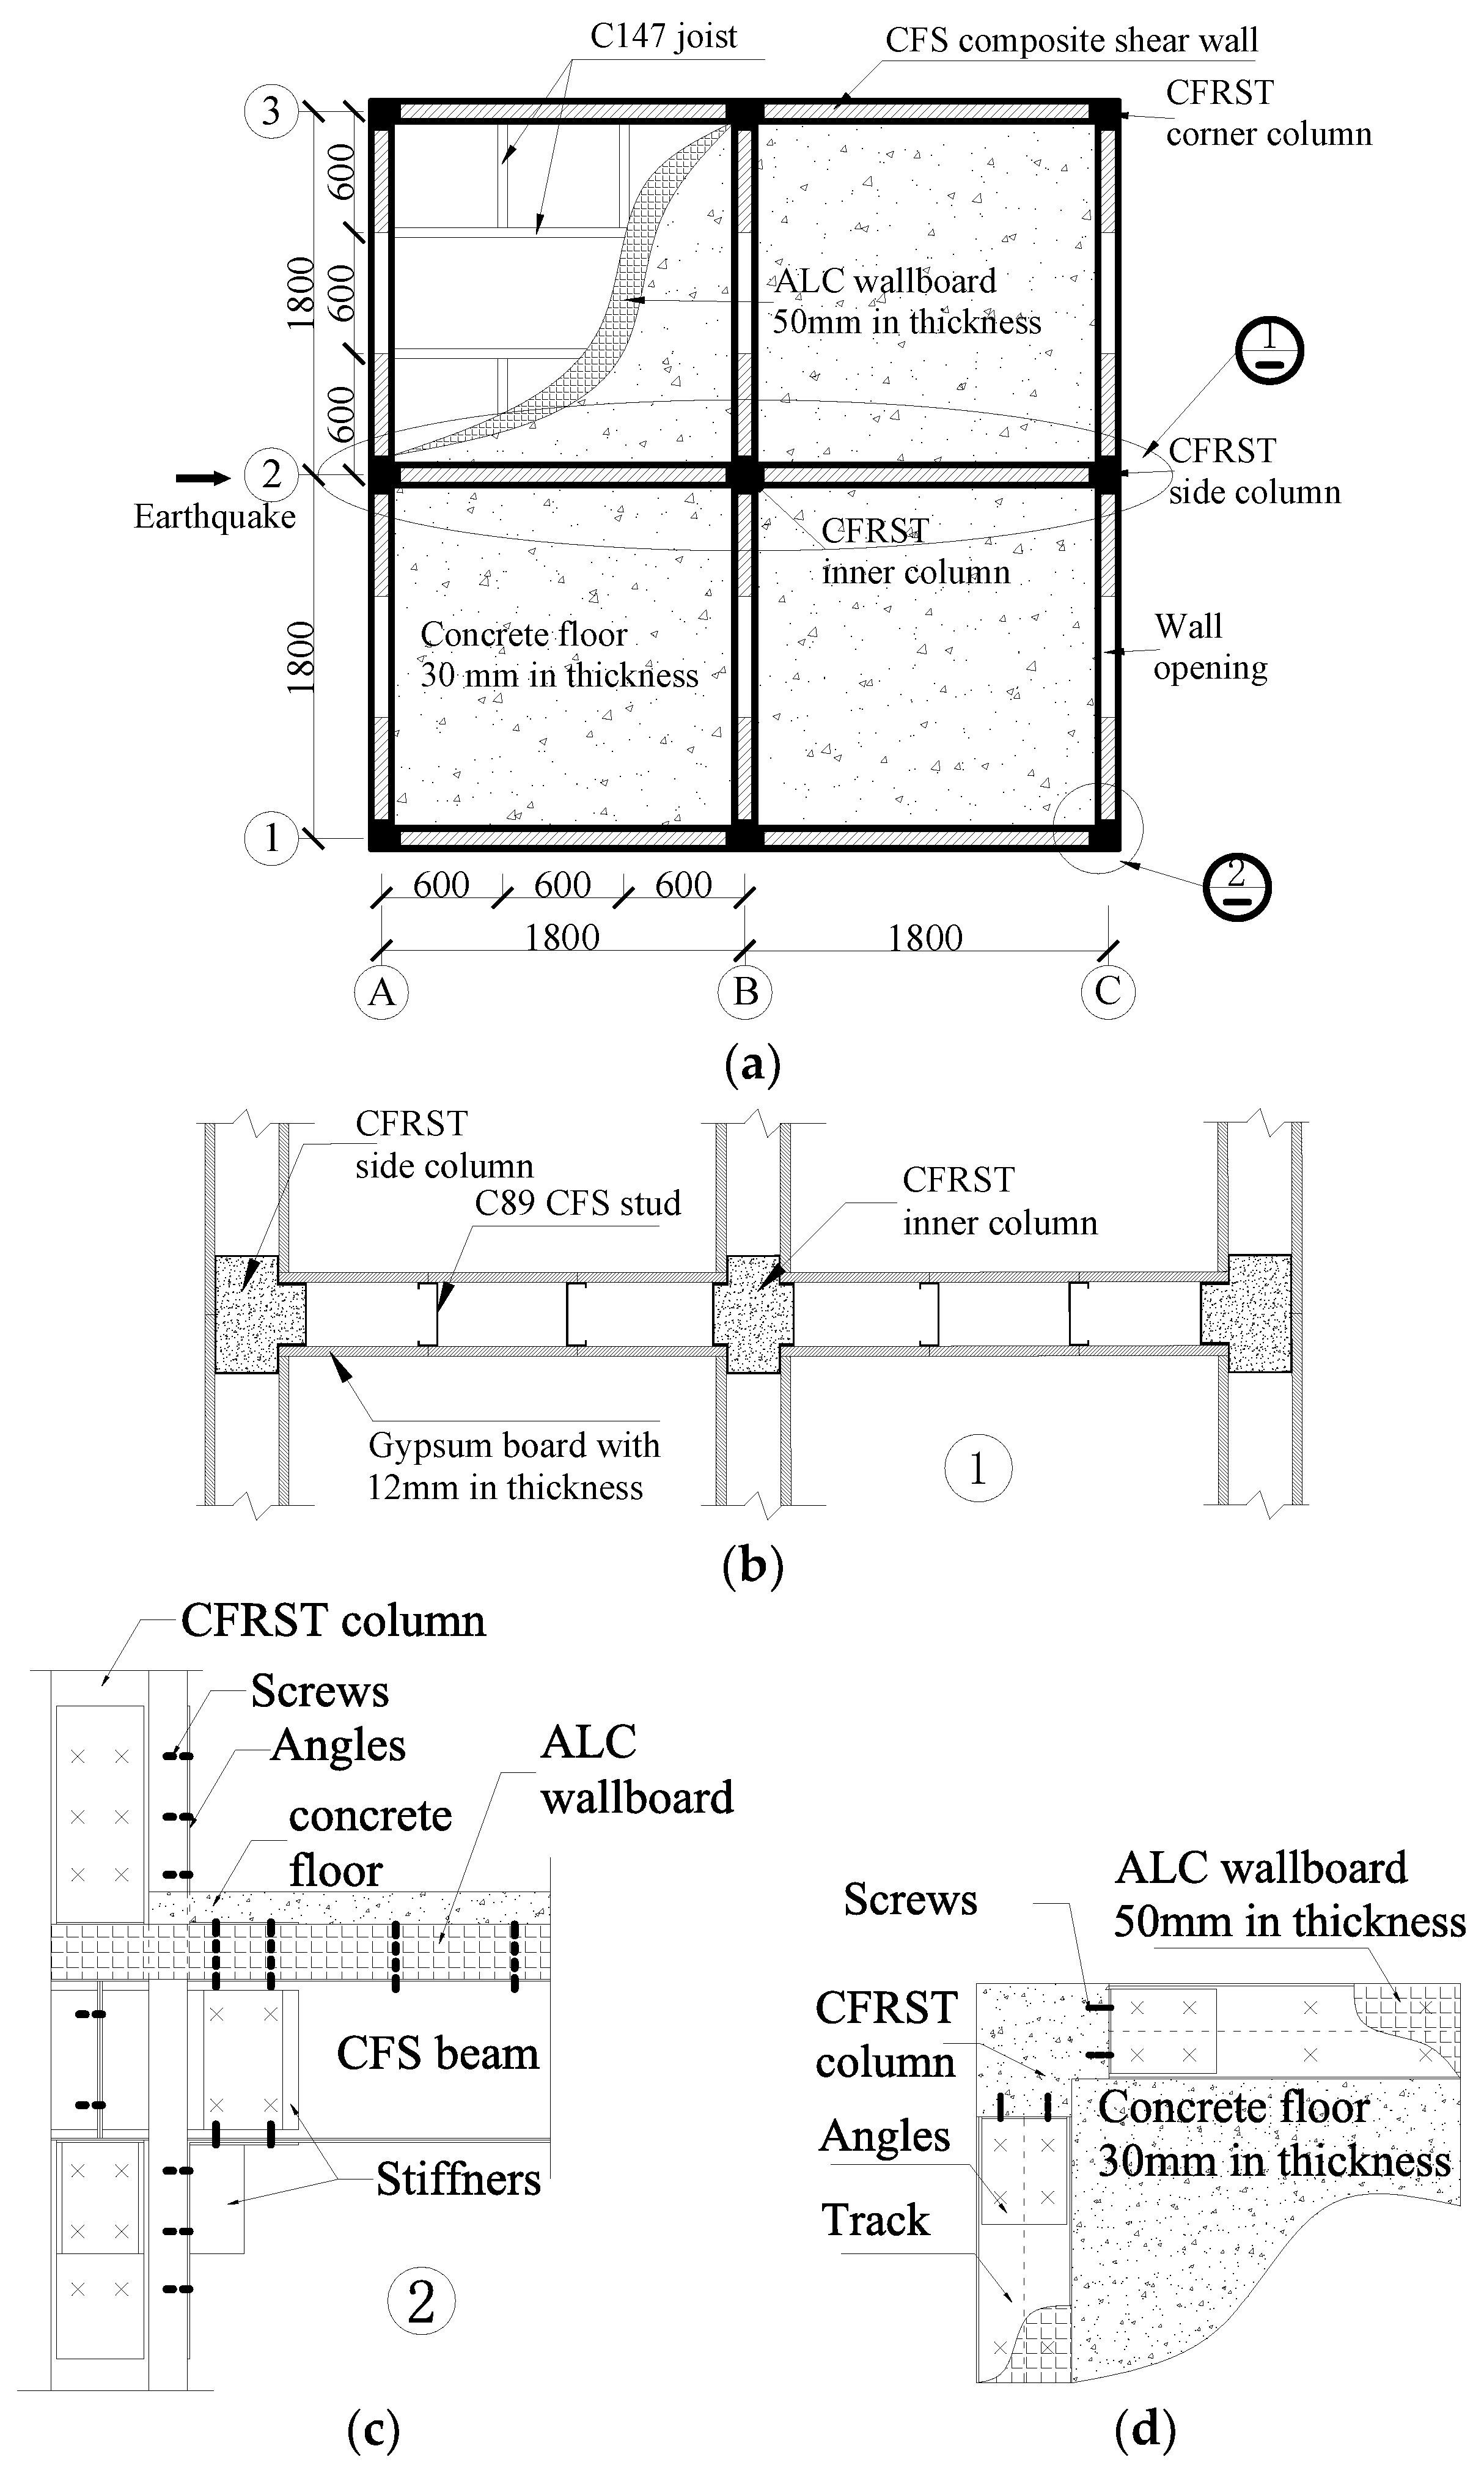
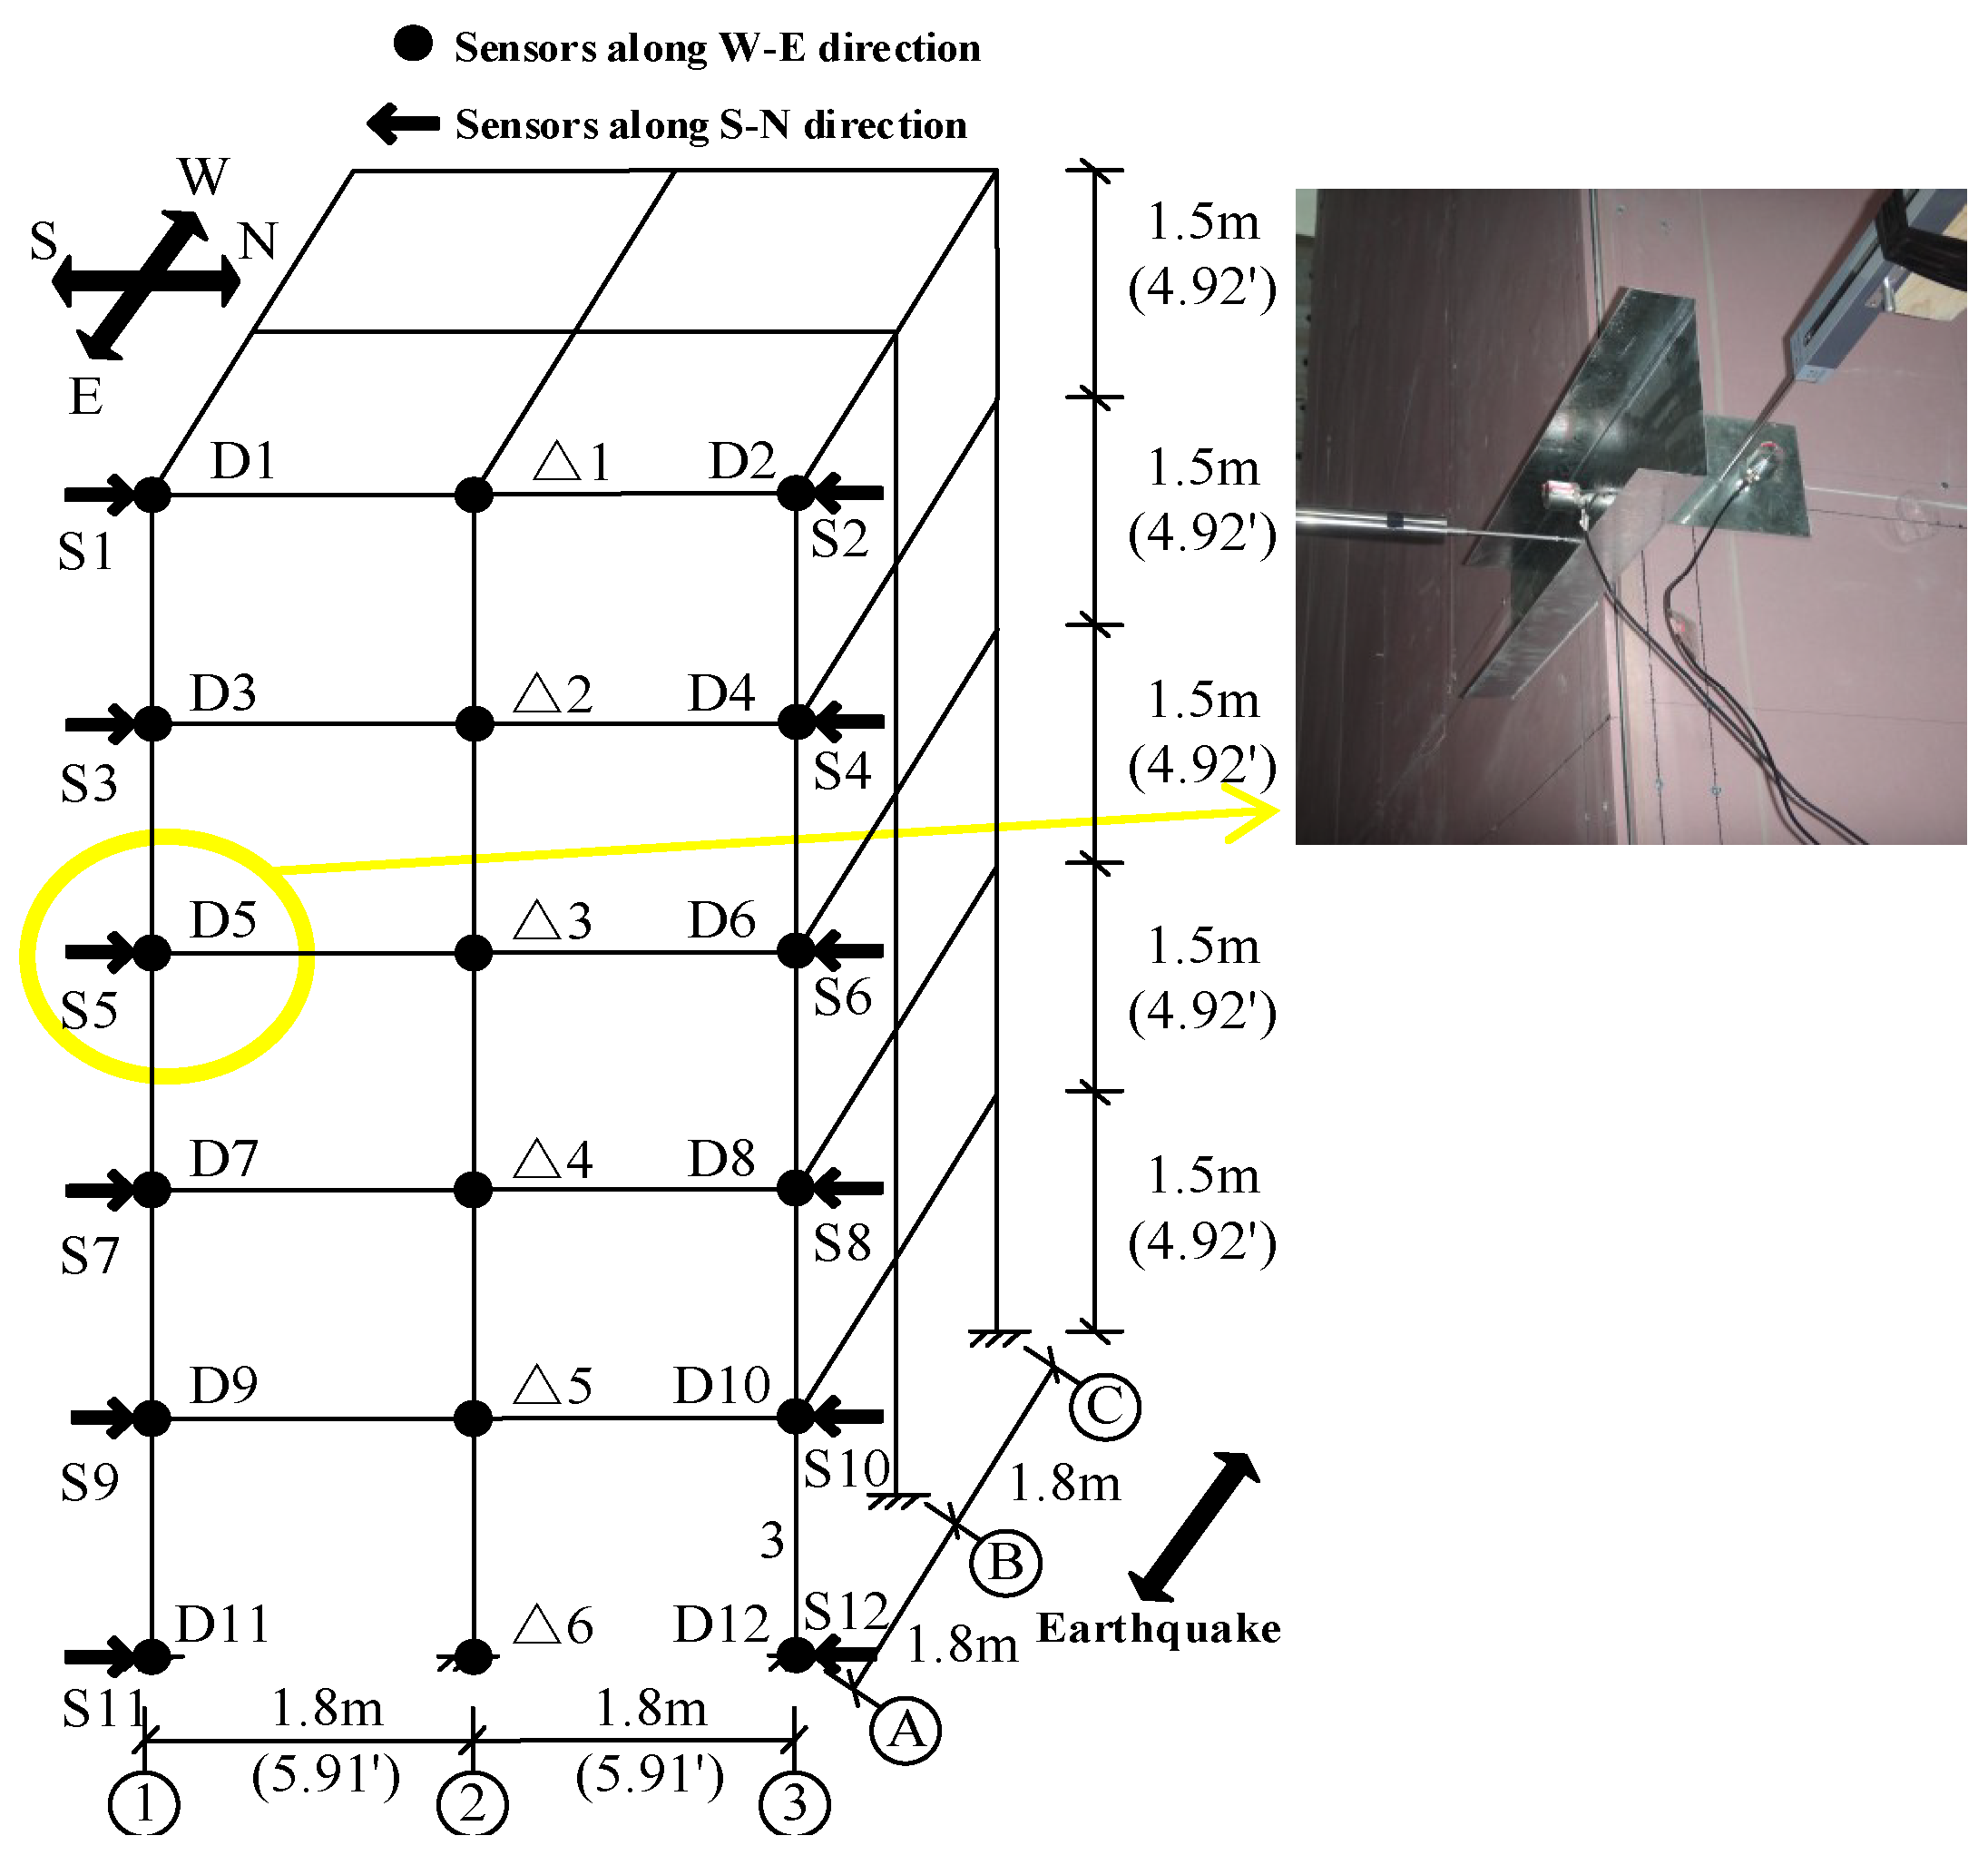
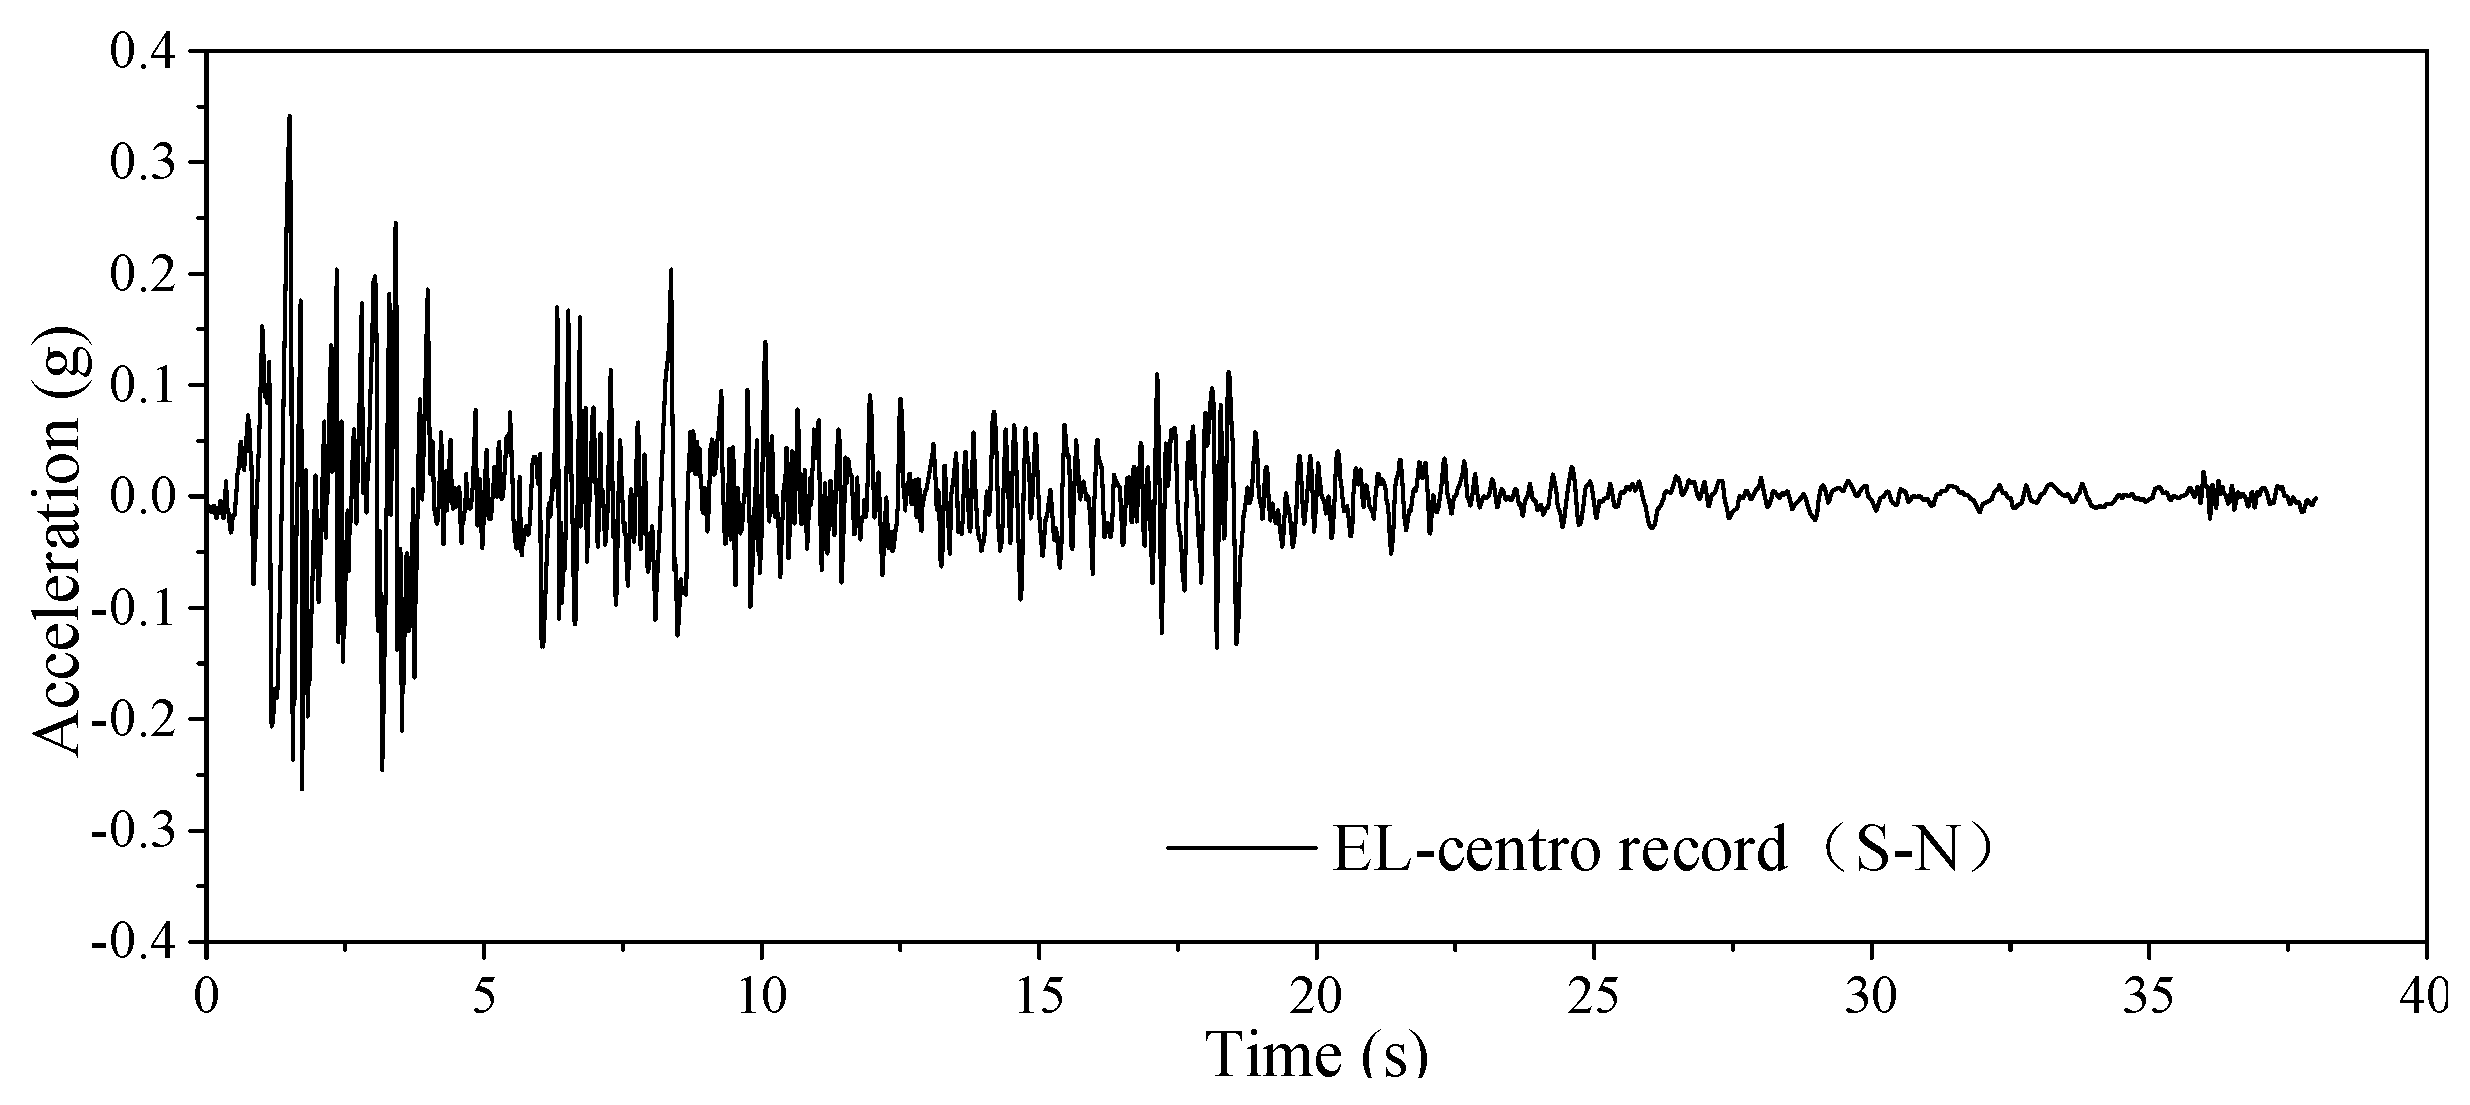
2. A Five-Story Shaking Table Test Model
3. Simplified Analytical Model of the Test Specimen
- (1)
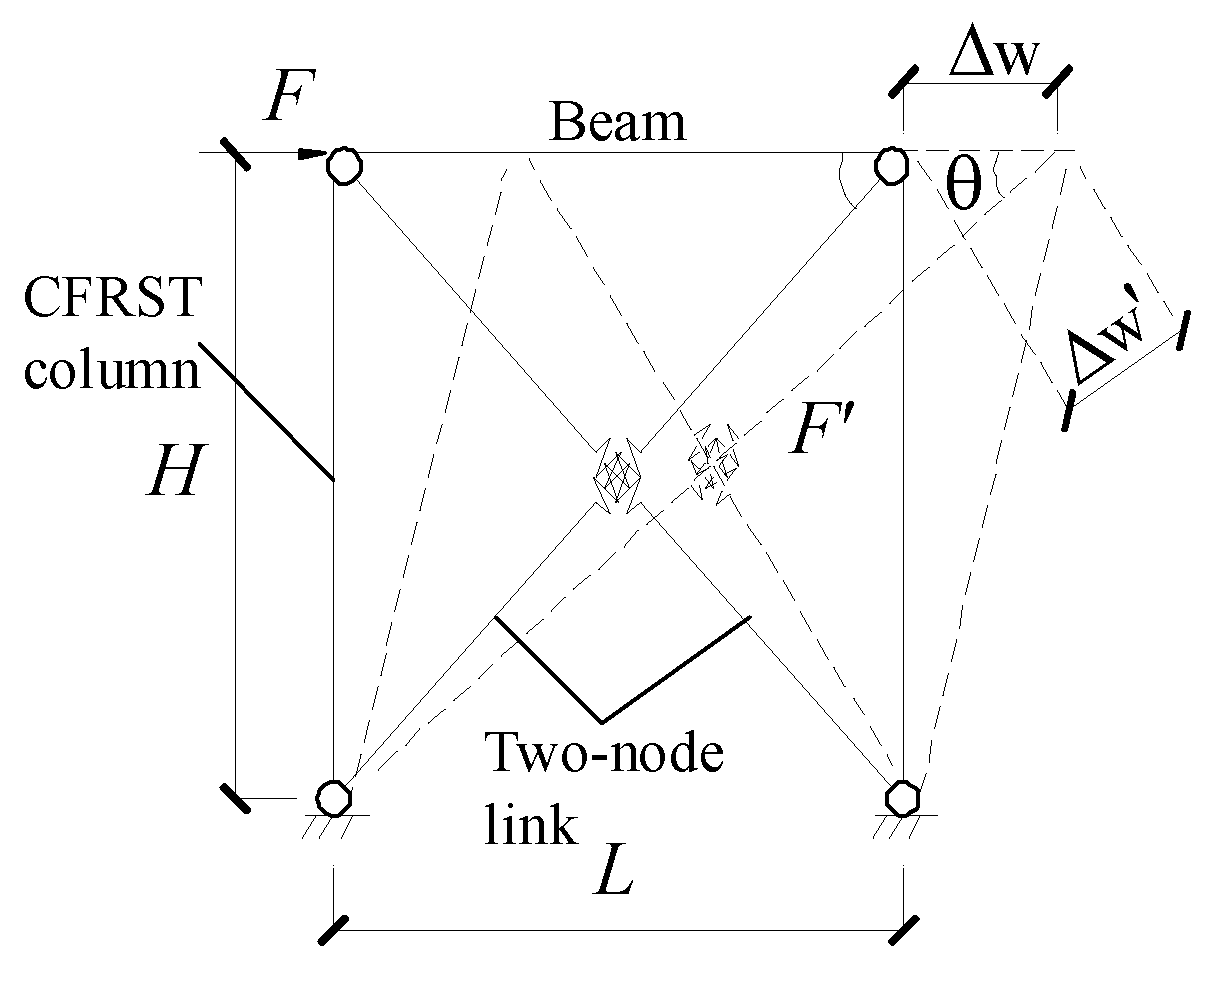
- A build-up section beam is idealized as two crossed rigid links, and such links are pinned with CFRST columns. The CFS composite floor system is idealized as a rigid plane, and the rigid plane is pinned with the CFRST columns.
- (2)
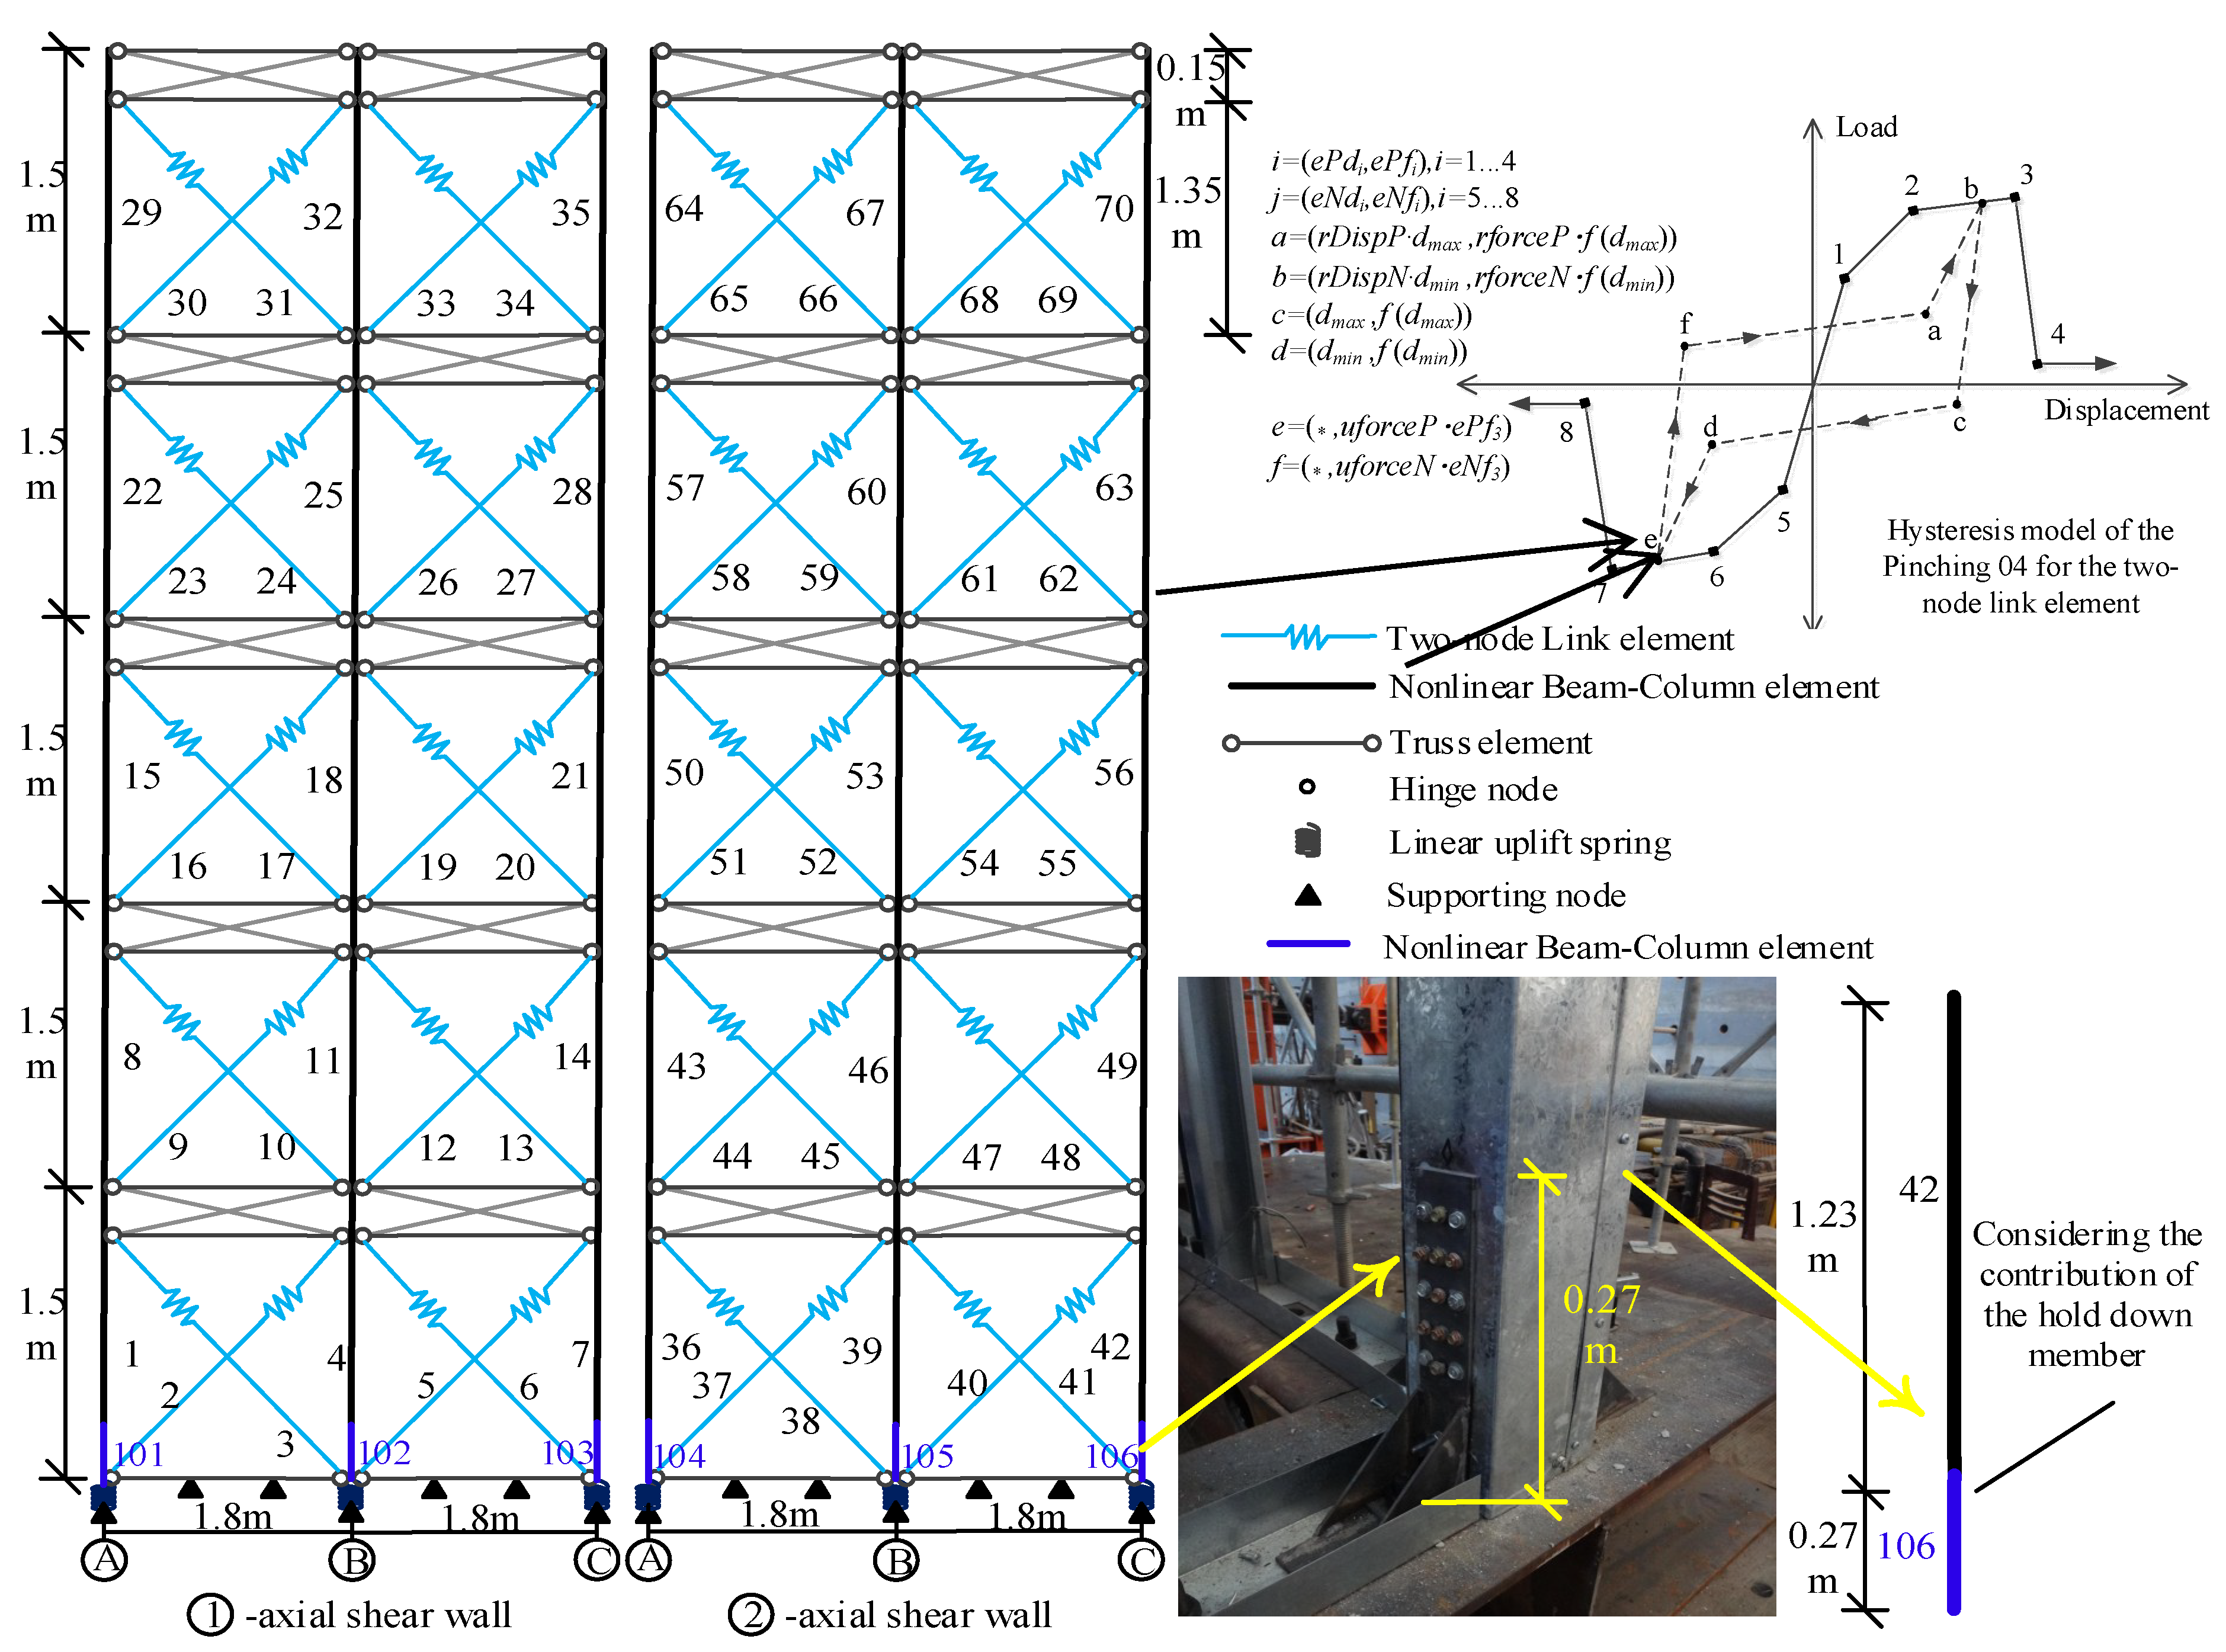
- A CFS composite shear wall (including the sheathing wallboards and the CFS studs) is idealized as two crossed nonlinear springs, and the hysteretic characteristics of the composite shear wall are represented by the nonlinear springs.
- (3)
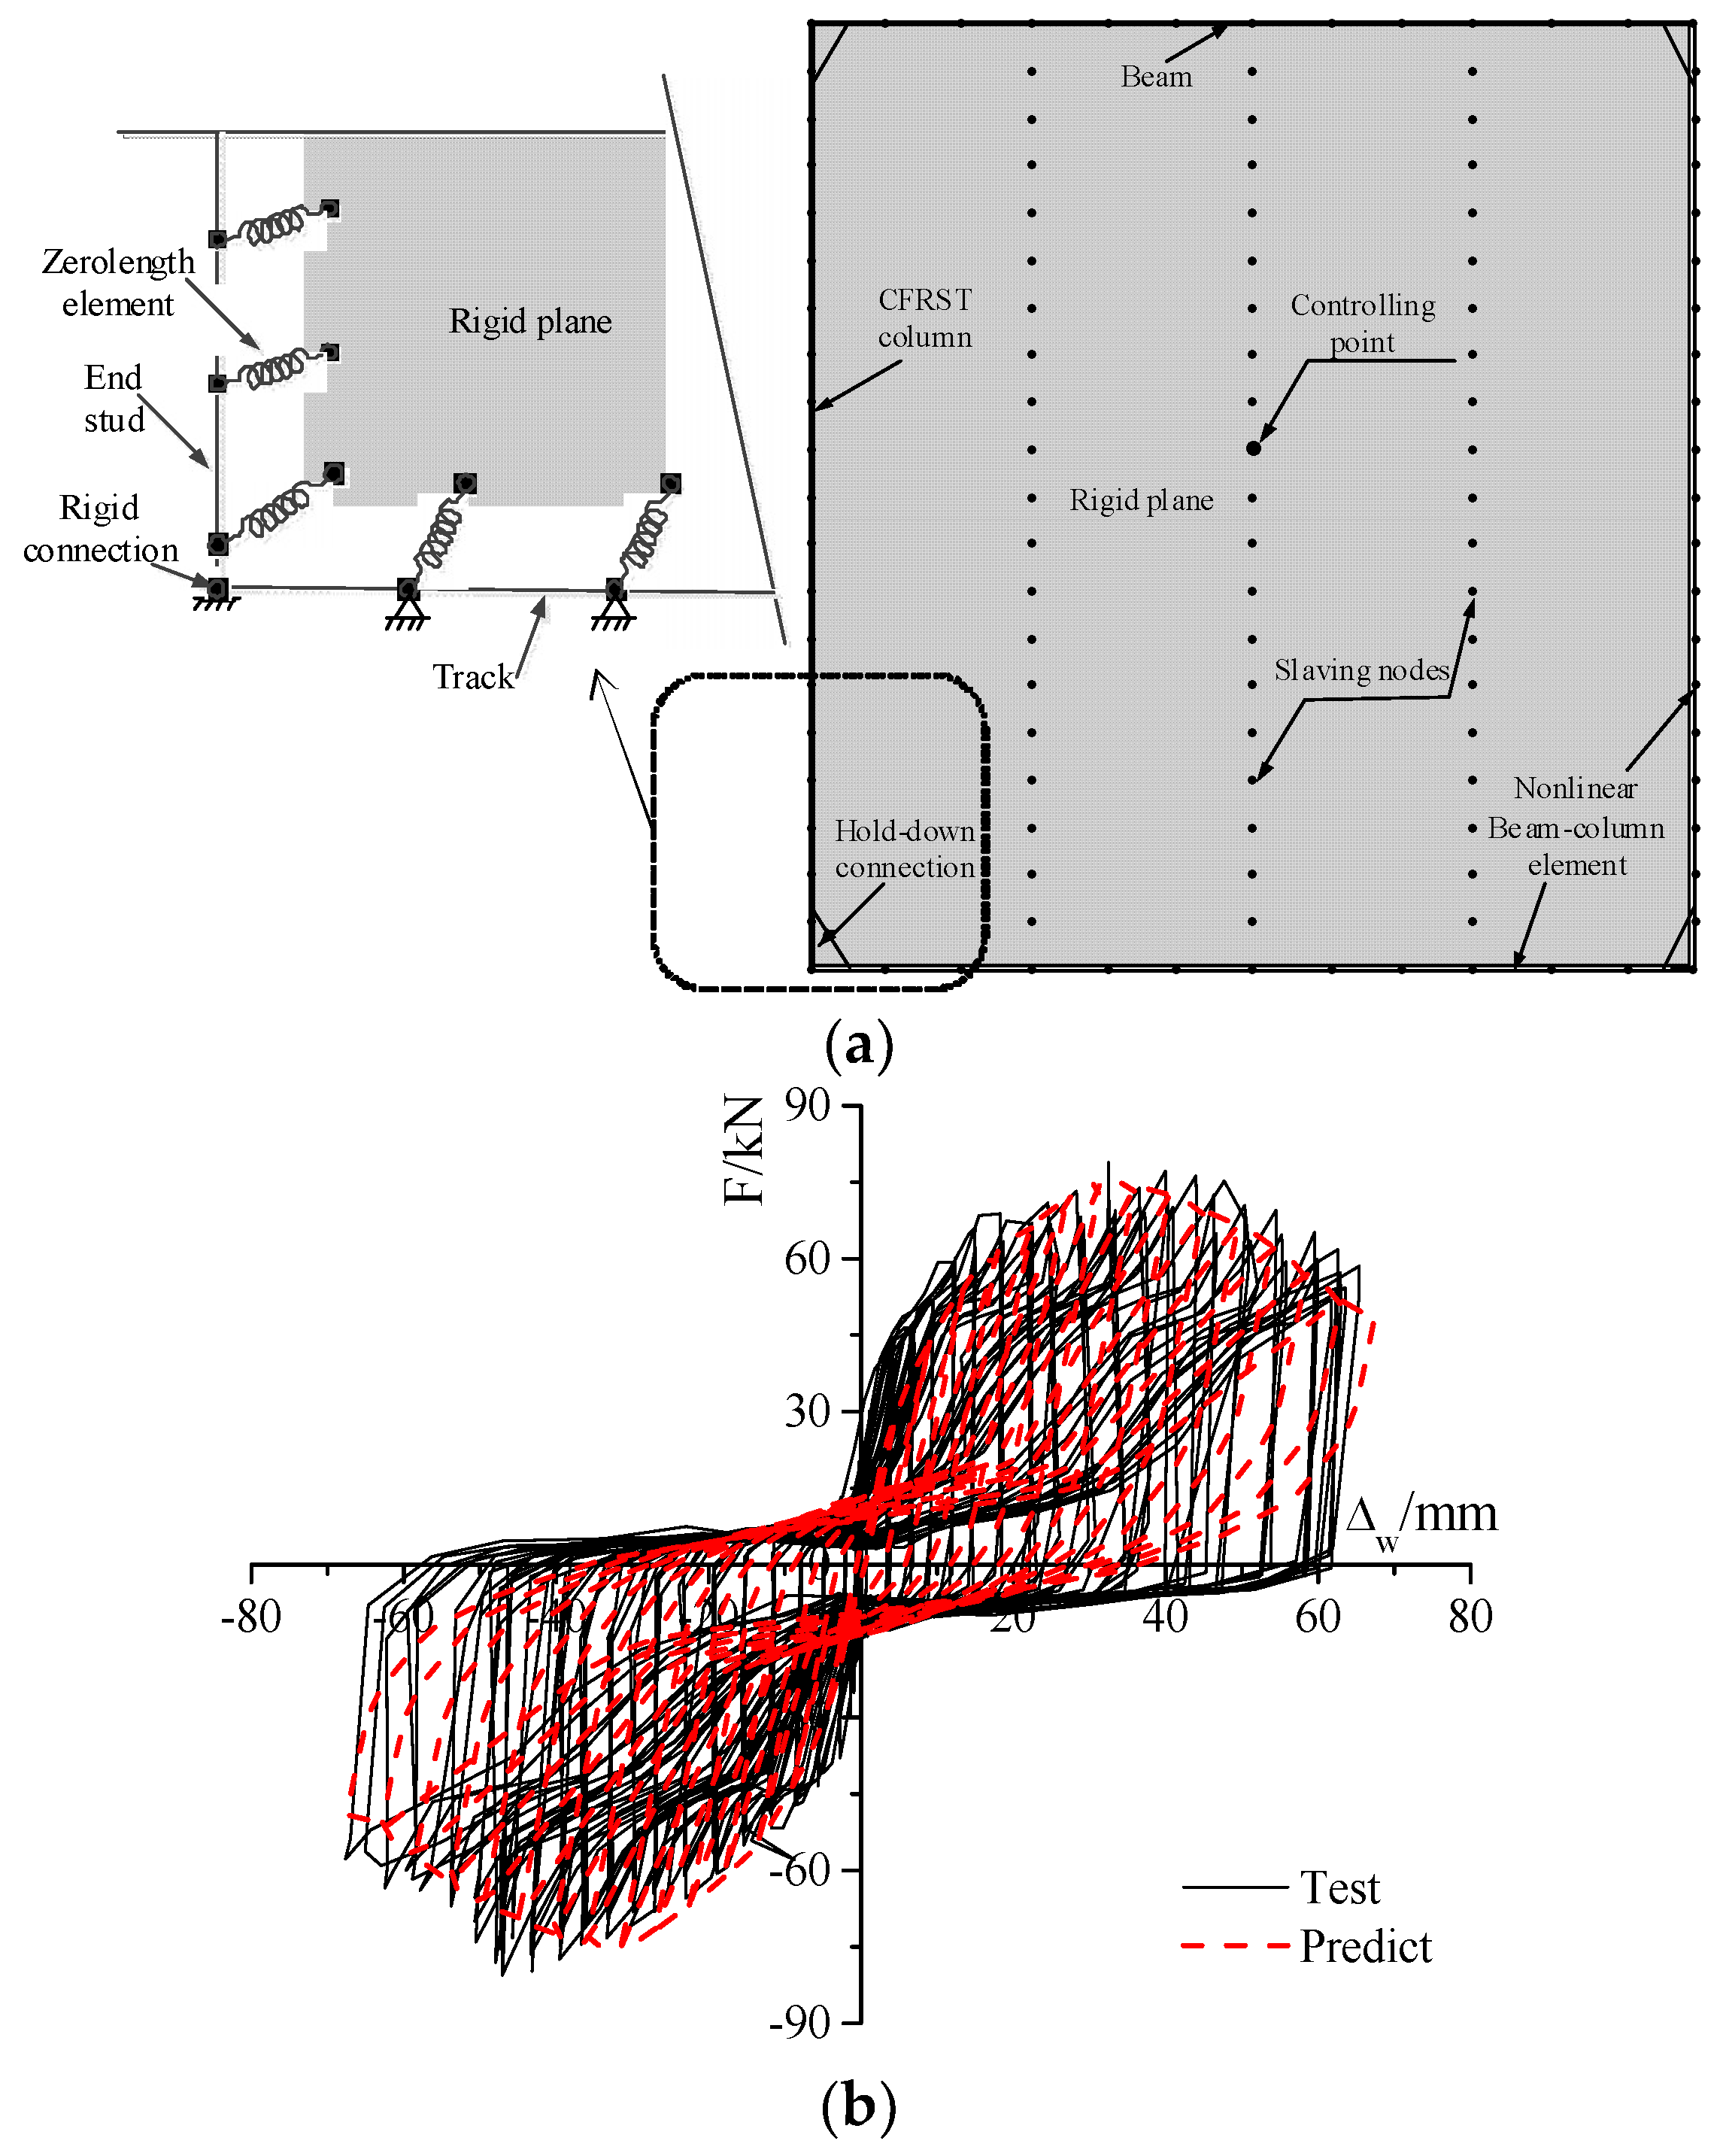
- The hold-down connections at the ends of the CFRST columns are idealized as rigid connections, and the uplift behavior of the hold-down connections is modeled by an axial linear spring according to suggestions of previous study [26]. Thus, in the simplified model, three rotational freedoms and two translation freedoms are restrained, and the axial translation freedom is restrained by the axial linear spring.
3.1. Modeling the CFRST Column
3.2. Modeling the CFS Composite Shear Wall
3.3. Modeling the Hold-Down Connections
3.4. Modeling the Composite Floor System
3.5. Mass and Damping Ratio of the Building
4. Validation of Simplified Models by Shaking Table Test
5. Conclusions
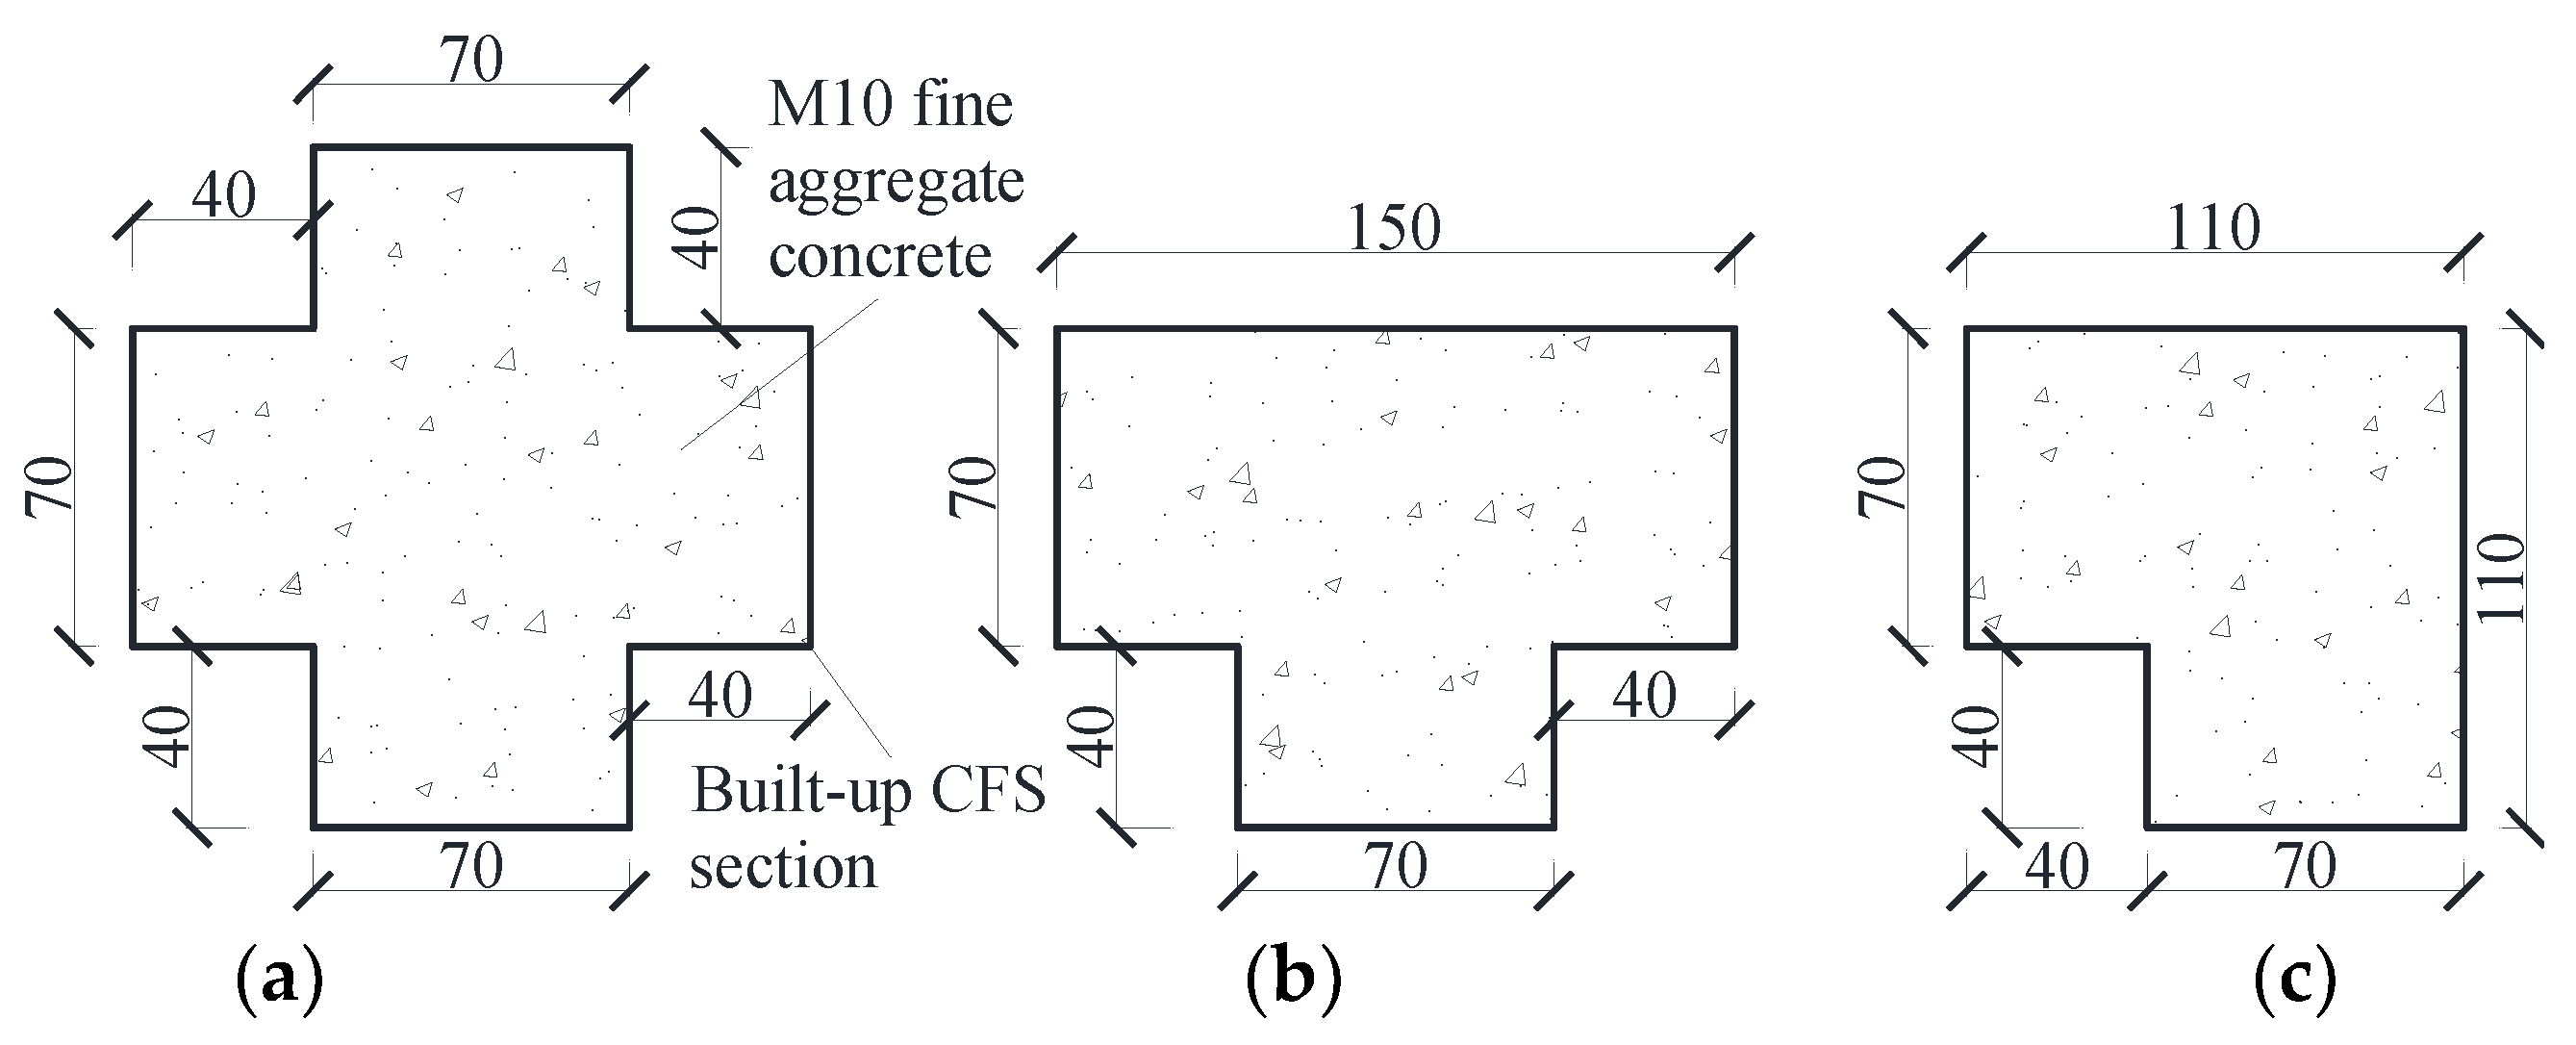
- The nonlinear mechanical behavior of the CFRST columns is considered in the simplified model, including the bucking behavior and the yielding of materials. A build-up section with “new material” is proposed to model the CFS tube and infilled concrete, and the equivalent stiffness principle is used to determine the section parameters. The material property of the “new material” is modeled by an elastic-perfect plastic model, and the equivalent yield strength is determined by AISC-LRFD guidance. Besides, the contribution of the hold-down connections on the lateral stiffness and axial strength of the column base of the CFRST columns is also considered in the simplified model, and the strengthened region (270 mm in height) is separately modeled with the CFRST column. Among the “+”-shape inner CFRST columns, the “T”-shape side CFRST columns, and the “L”-shape corner CFRST columns, their strengthened regions are modeled individually in the simplified model.
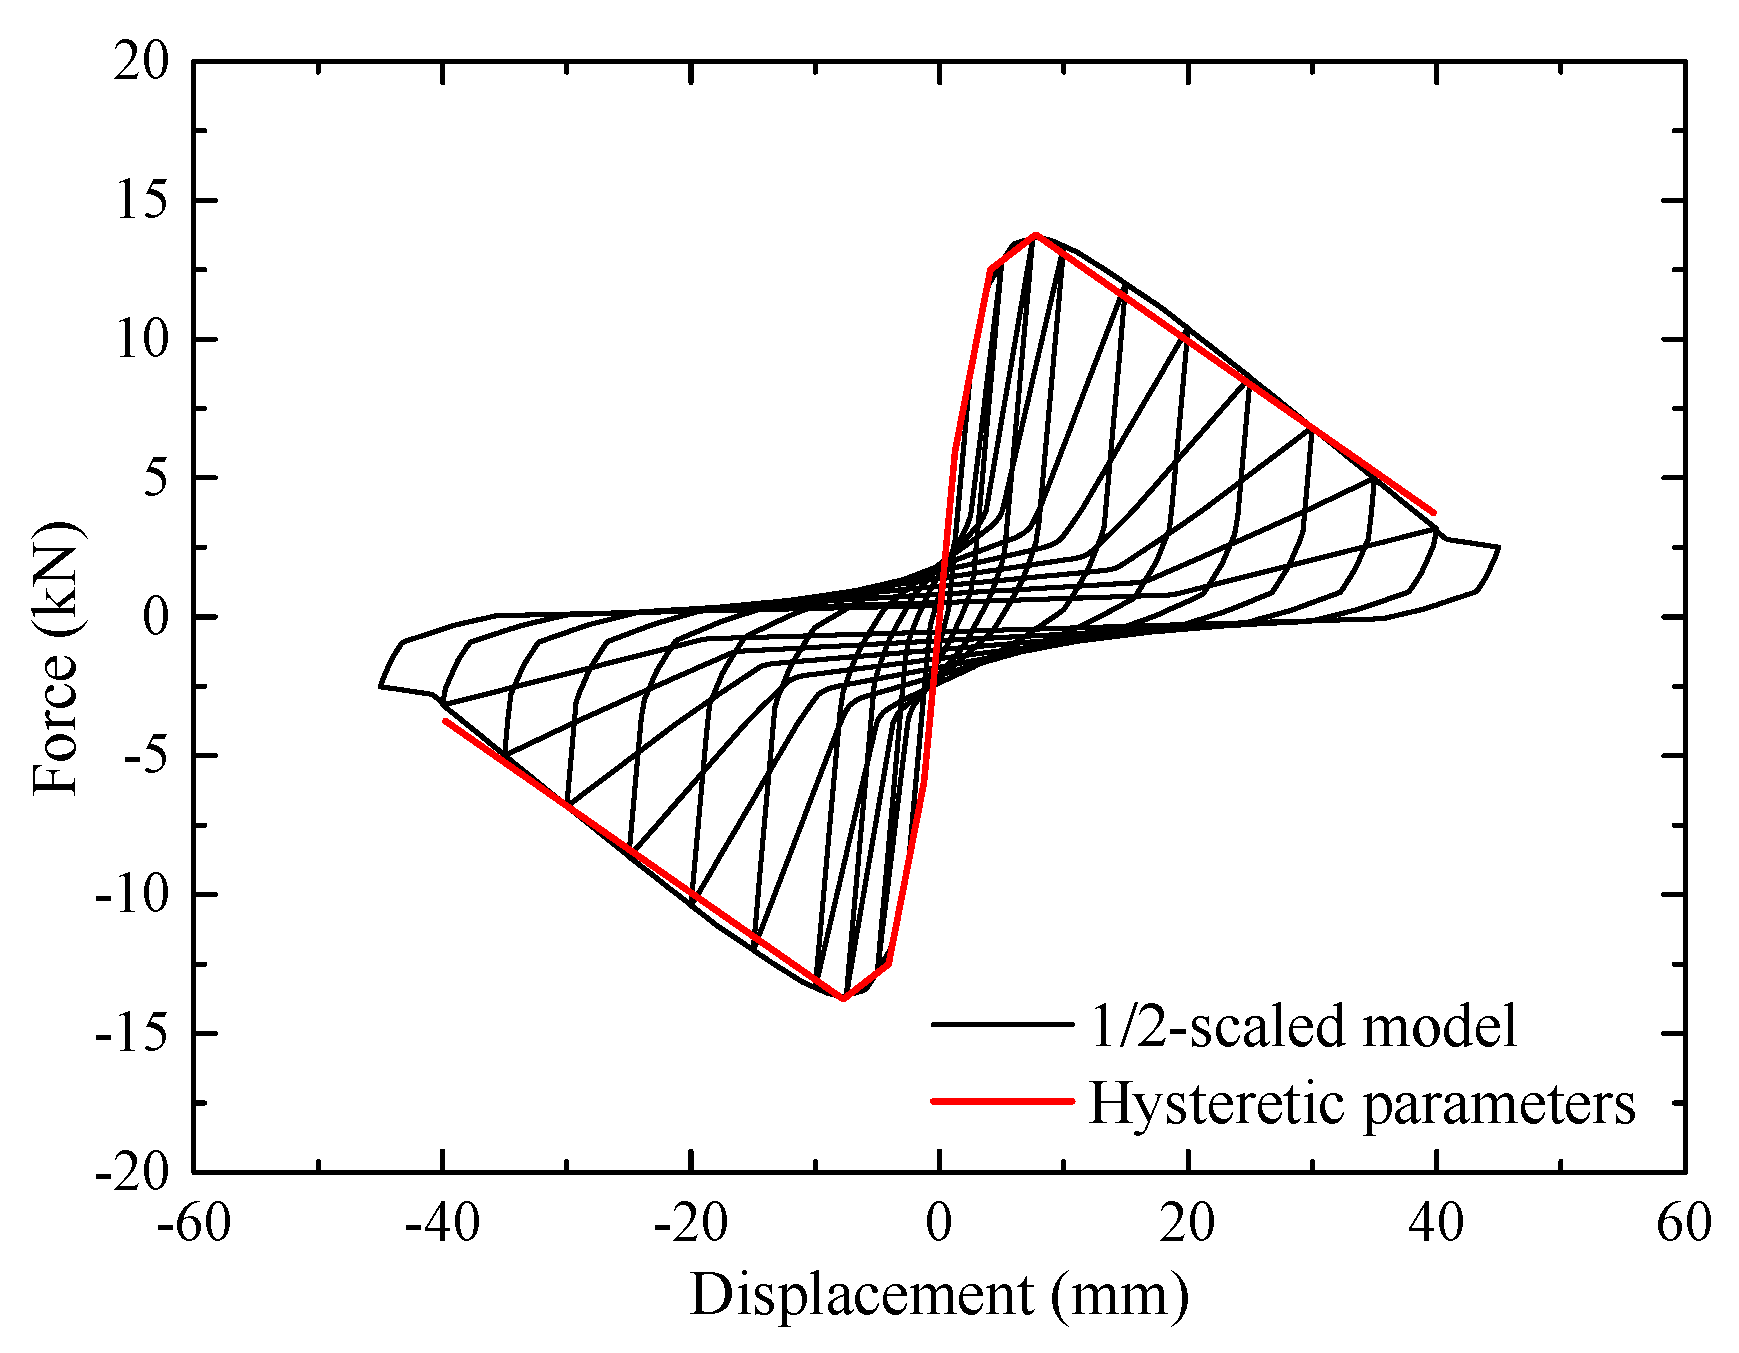
- Two crossed nonlinear springs with hysteretic parameters are used in the simplified model to model the hysteretic behavior of a composite CFS shear wall subjected to earthquakes, and such behaviors are modeled by Pinching04 material. Two crossed rigid trusses are used to model a CFS beam. The fastener-based modeling method is used to determine the hysteretic parameters of the 1:2-scaled composite shear walls due to no cyclic test data for them.
- A linear spring is used to model the uplift behavior of a hold-down connection in the simplified model, and the stiffness of this linear spring is determined by the cyclic test results of the composite shear walls. The stiffness of this linear spring is determined according to the numbers of hold-down connections for the CFRST inner columns, side columns, and corner columns, respectively.
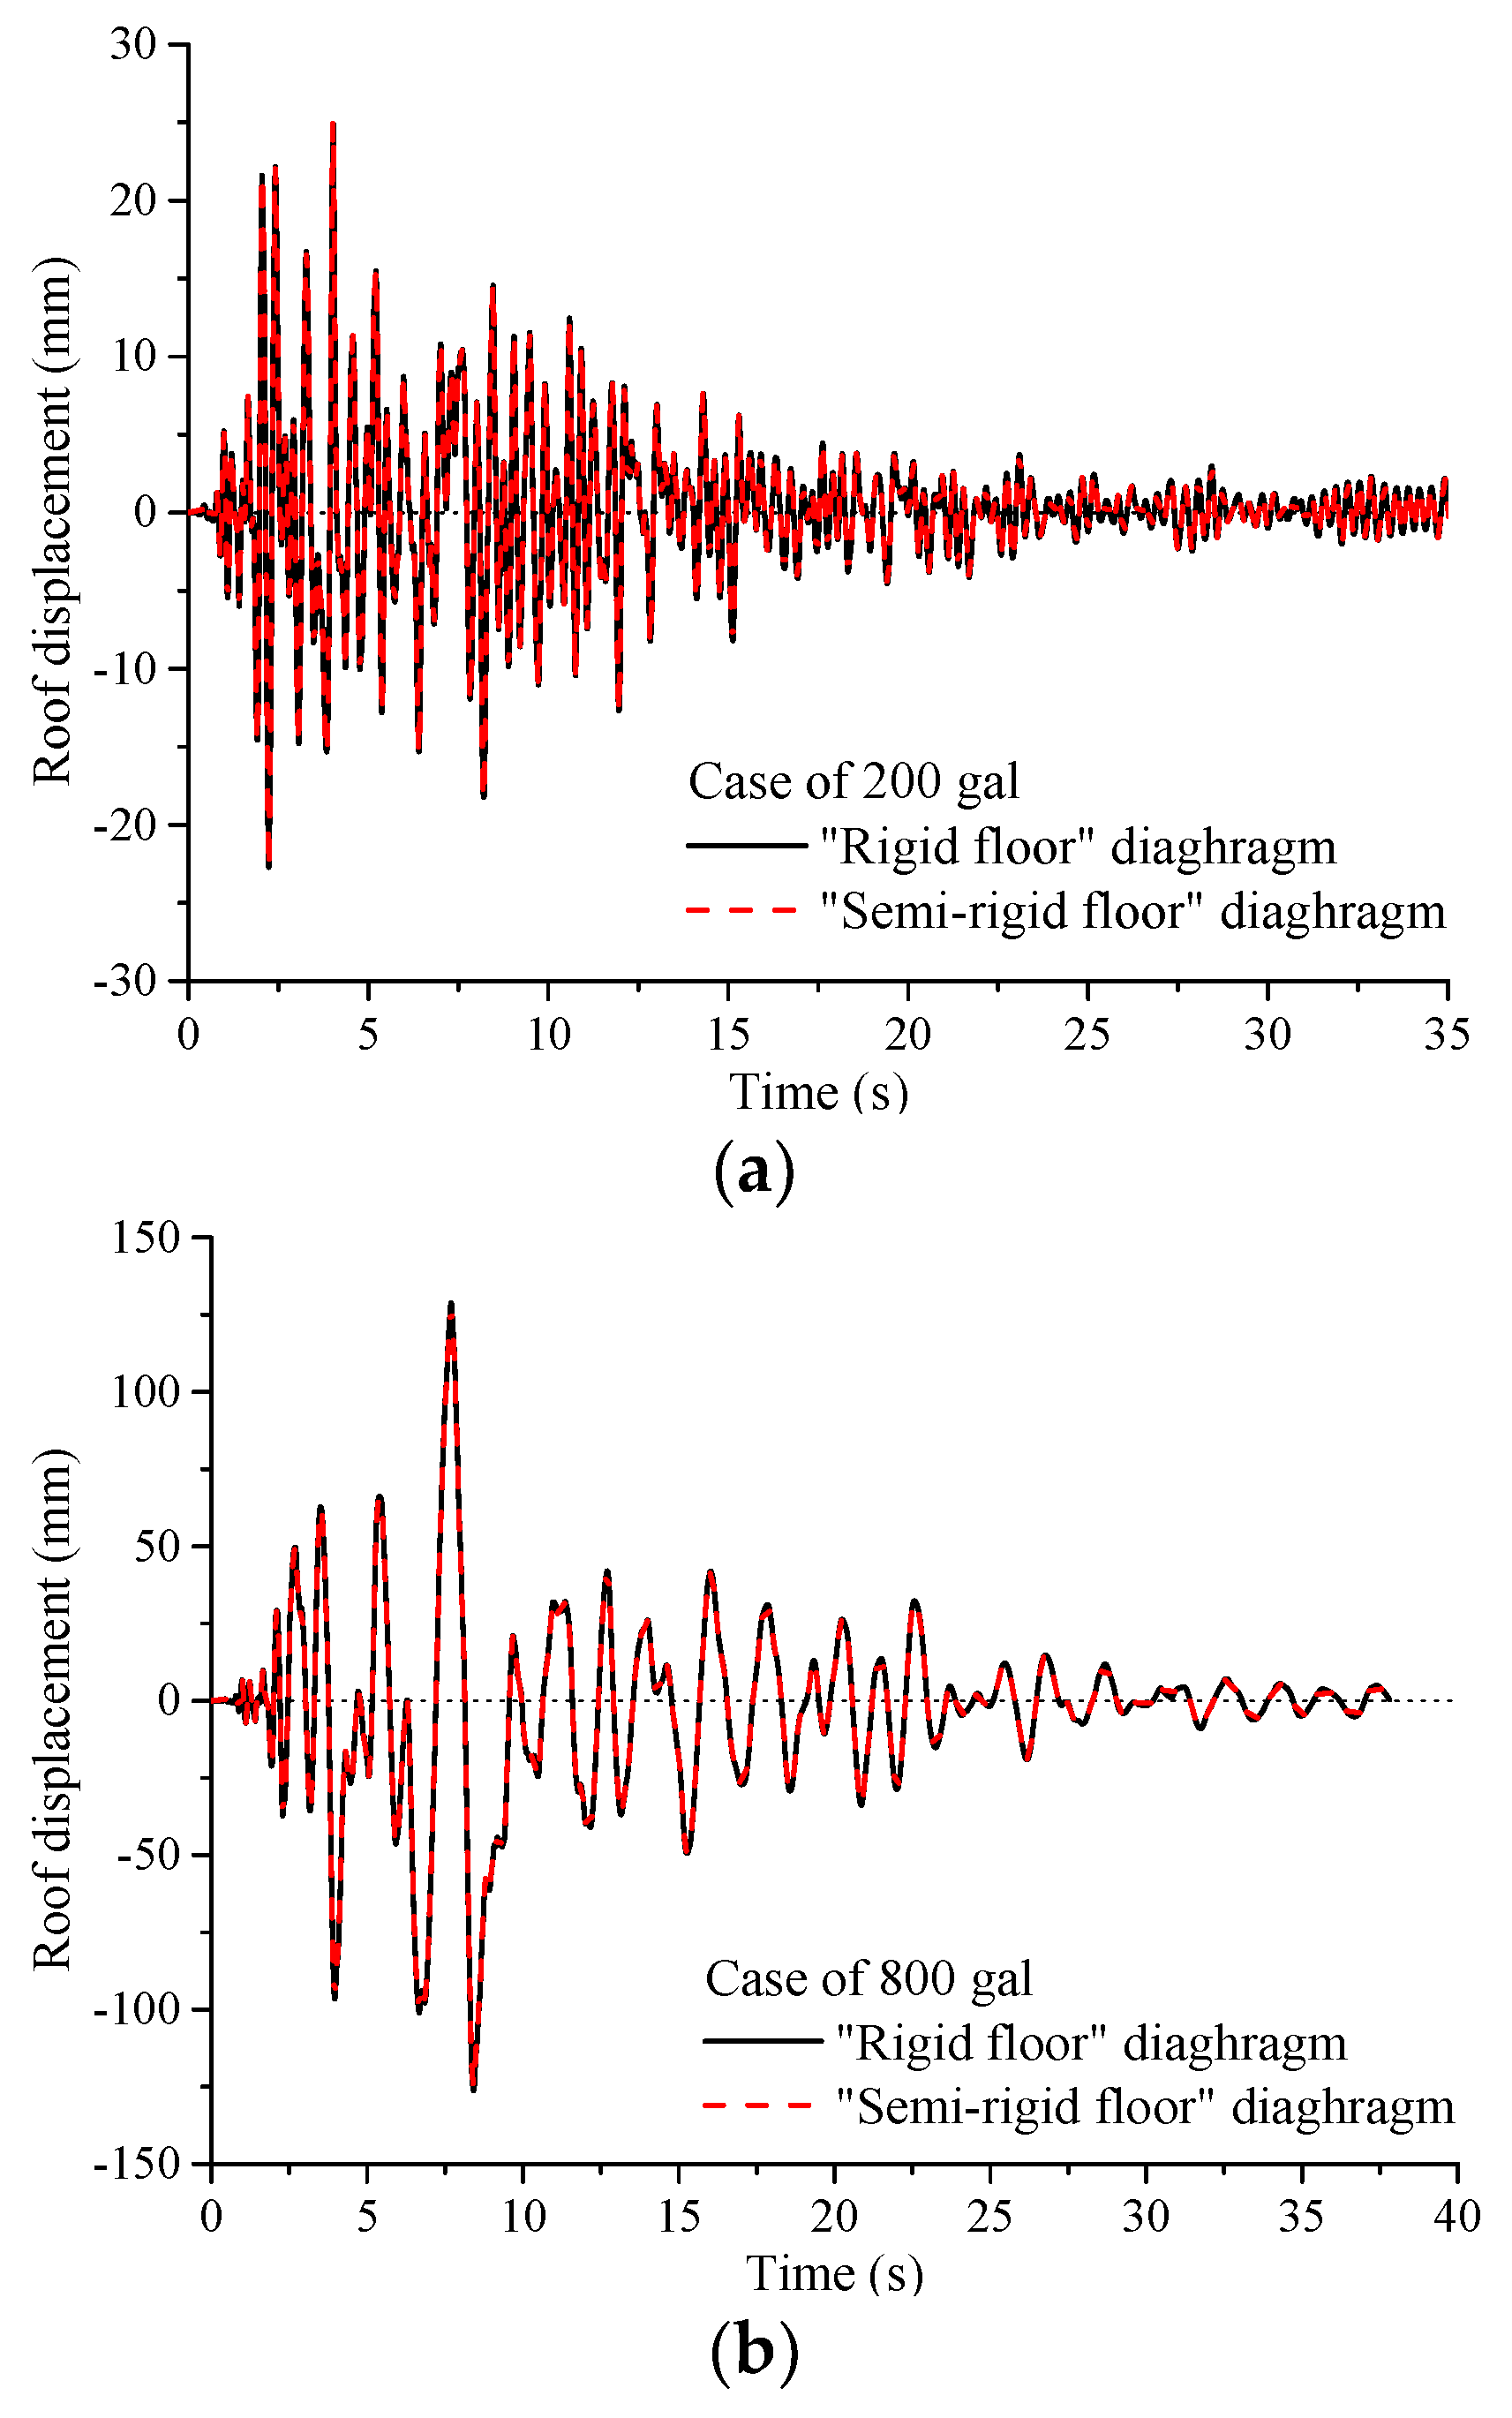
- To improve the computational efficiency of the simplified model, the rigid diaphragm method is used to model the composite floor system, and such a method is demonstrated by example analyses.
Author Contributions
Acknowledgments
Conflicts of Interest
References
- Ye, J.H. An introduction of mid-rise thin-walled steel structures: Research progress on cold-formed steel-framed composite shear wall systems. J. Harbin Inst. Technol. 2016, 48, 1–9. [Google Scholar]
- Schafer, B.W.; Ayhan, D.; Leng, J.; Liu, P.; Padilla-Llano, D.; Perterman, K.D.; Stehman, M.; Buonopane, S.G.; Eatherton, M.; Madsen, R.; et al. Seismic responses and engineering of cold-formed steel framed building. Structures 2016, 8, 197–212. [Google Scholar] [CrossRef]
- Serrette, R.; Encalada, J.; Juadines, M.; Nguyen, H. Static racking behavior of plywood, OSB, gypsum, and fiberboard walls with metal framing. J. Struct. Eng. 1997, 123, 1079–1086. [Google Scholar] [CrossRef]
- Al-Kharat, M.; Rogers, C.A. Inelastic performance of cold-formed steel strap braced walls. J. Constr. Steel Res. 2007, 63, 460–474. [Google Scholar] [CrossRef]
- Balh, N.; DaBreo, J.; Ong-Tone, C.; El-Saloussy, K.; Yu, C.; Rogers, C.A. Design of steel sheathed cold-formed steel framed shear walls. Thin-Walled Struct. 2014, 75, 76–86. [Google Scholar] [CrossRef]
- Shamim, I.; Roger, C.A. Steel sheathed/CFS framed shear walls under dynamic loading: Numerical modelling and calibration. Thin-Walled Struct. 2013, 71, 57–71. [Google Scholar] [CrossRef]
- Zeynalian, M.; Ronagh, H.R. Seismic performance of cold formed steel walls sheathed by fibre-cement board panels. J. Constr. Steel Res. 2015, 107, 1–11. [Google Scholar] [CrossRef]
- Yu, C. Shear resistance of cold-formed steel framed shear walls with 0.686 mm, 0.762 mm, and 0.838 mm steel sheet sheathing. Eng. Struct. 2010, 32, 1522–1529. [Google Scholar] [CrossRef]
- Landolfo, R.; Fiorino, L.; Della Corte, G. Seismic behavior of sheathed cold-formed structures: Physical tests. J. Struct. Eng. 2006, 132, 570–581. [Google Scholar] [CrossRef]
- Fiorino, L.; Della Corte, G.; Landolfo, R. Experimental tests on typical screw connections for cold-formed steel housing. Eng. Struct. 2007, 29, 1761–1773. [Google Scholar] [CrossRef]
- Macillo, V.; Fiorino, L.; Landolfo, R. Seismic response of CFS shear walls sheathed with nailed gypsum panels: Experimental tests. Thin-Walled Struct. 2017, 120, 161–171. [Google Scholar] [CrossRef]
- Fiorino, L.; Shakeel, S.; Macillo, V.; Landolfo, R. Seismic response of CFS shear walls sheathed with nailed gypsum panels: Numerical modelling. Thin-Walled Struct. 2018, 122, 359–370. [Google Scholar] [CrossRef]
- Fiorino, L.; Macillo, V.; Landolfo, R. Shake table tests of a full-scale two-story sheathing-braced cold-formed steel building. Eng. Struct. 2017, 151, 633–647. [Google Scholar] [CrossRef]
- Fiorino, L.; Iuorio, O.; Macillo, V.; Landolfo, R. Performance-based design of sheathed CFS buildings in seismic area. Thin-Walled Struct. 2012, 61, 248–257. [Google Scholar] [CrossRef]
- Kechidi, S.; Bourahla, N. Deteriorating hysteresis model for cold-formed steel shear wall panel based on its physical and mechanical characteristics. Thin-Walled Struct. 2016, 98, 421–430. [Google Scholar] [CrossRef]
- Kechidi, S.; Bourahla, N.; Castro, J.M. Seismic design procedure for cold-formed steel sheathed shear wall frames: Proposal and evaluation. J. Constr. Steel Res. 2017, 128, 219–232. [Google Scholar] [CrossRef]
- Fülop, L.A.; Dubina, D. Design criteria for seam and sheeting-to-framing connections of cold-formed steel shear panels. J. Struct. Eng. 2006, 132, 582–590. [Google Scholar] [CrossRef]
- Dubina, D. Behavior and performance of cold-formed steel-framed houses under seismic action. J. Constr. Steel Res. 2008, 64, 896–913. [Google Scholar] [CrossRef]
- Peterman, K.D.; Stehman, M.J.; Madsen, R.L.; Buonopane, S.G.; Nakata, N.; Schafer, B.W. Experimental seismic responses of a full-scale cold-formed steel-framed building. I: System-level response. J. Struct. Eng. 2016, 142, 04016127. [Google Scholar] [CrossRef]
- Peterman, K.D.; Stehman, M.J.; Madsen, R.L.; Buonopane, S.G.; Nakata, N.; Schafer, B.W. Experimental seismic responses of a full-scale cold-formed steel-framed building. II: Subsystem-level response. J. Struct. Eng. 2016, 142, 04016128. [Google Scholar] [CrossRef]
- Leng, J.Z.; Peterman, K.D.; Bian, G.B.; Buonopane, S.G.; Schafer, B.W. Modeling seismic responses of a full-scale cold-formed steel-framed building. Eng. Struct. 2017, 153, 146–165. [Google Scholar] [CrossRef]
- Smith, B.H.; Arwade, S.R.; Schafer, B.W.; Moen, C.D. Design component and system reliability of a low-rise cold formed steel framed commercial building. Eng. Struct. 2016, 127, 434–446. [Google Scholar] [CrossRef]
- Wang, X.; Pantoli, E.; Hutchinson, T.C.; Restrepo, J.I.; Wood, R.L.; Hoehler, M.S.; Grezesik, P.; Sesma, F.H. Seismic performance of cold-formed steel wall systems in a full-scale building. J. Struct. Eng. ASCE 2015, 141, 04015014. [Google Scholar] [CrossRef]
- Ye, J.H.; Wang, X.X.; Jia, H.Y.; Zhao, M.Y. Cyclic performance of cold-formed steel shear walls sheathed with double-layer wallboards on both sides. Thin-Walled Struct. 2015, 92, 146–159. [Google Scholar] [CrossRef]
- Wang, X.X.; Ye, J.H. Reversed cyclic performance of cold-formed steel shear walls with reinforced end studs. J. Constr. Steel Res. 2015, 113, 28–42. [Google Scholar] [CrossRef]
- Wang, X.X.; Ye, J.H.; Yu, Q. Improved equivalent bracing model for seismic analysis of mid-rise CFS structures. J. Constr. Steel Res. 2017, 136, 256–264. [Google Scholar] [CrossRef]
- Ye, J.H.; Jiang, L.Q.; Wang, X.X. Seismic failure mechanism of reinforced cold-formed steel shear wall based on structural vulnerability analysis. Appl. Sci. 2017, 7, 182. [Google Scholar] [CrossRef]
- Ye, J.H.; Jiang, L.Q. Collapse mechanism analysis of a steel-moment frame based on structural vulnerability theory. Arch. Civ. Mech. Eng. 2018, 18, 833–843. [Google Scholar]
- American Iron and Steel Institute (AISI). North American Standard of Cold-Formed Steel Framing–Lateral Design; AISI S400; AISI: Washington, DC, USA, 2015. [Google Scholar]
- Code for Seismic Design of Buildings (GB 50011-2010); China Architecture & Building Press: Beijing, China, 2016. (In Chinese)
- Technical Specification for Low-Ries Cold-Formed Thin-Walled Steel Buildings (JGJ 227-2011); China Environmental Science Press: Beijing, China, 2011. (In Chinese)
- Pacific Earthquake Engineering Research Center. Open System for Earthquake Engineering; Pacific Earthquake Engineering Research Center, University of California: Berkley, CA, USA, 2006. [Google Scholar]
- Padilla-Llano, D.A. A Framework for Cyclic Simulation of Thin-Walled Cold-Formed Steel Members in Structural Systems; Virginia Polytechnic Institute and State University: Blacksburg, VA, USA, 2015. [Google Scholar]
- AISC-LRFD. Load and Resistance Factor Design Specification for Structural Steel Buildings; American Institute of Steel Construction: Chicago, IL, USA, 1999. [Google Scholar]
- Tao, Z.; Uy, B.; Liao, F.Y.; Han, L.H. Nonlinear analysis of concrete-filled square stainless steel stub columns under axial compression. J. Constr. Steel Res. 2011, 67, 1719–1732. [Google Scholar] [CrossRef]
- Buonopane, S.G.; Bian, G.; Tun, T.H.; Schafer, B.W. Computationally efficient fastener-based models of cold-formed steel shear walls with wood sheathing. J. Constr. Steel Res. 2015, 110, 137–148. [Google Scholar] [CrossRef]
- Ye, J.H.; Chen, W.; Wang, Z. Fire-resistance behavior of a newly developed cold-formed steel composite floor. J. Struct. Eng. 2017, 143, 04017018. [Google Scholar] [CrossRef]


| Items | Parameters | Symbols | Similarity Factors |
|---|---|---|---|
| Geometric parameters | Length | SL | 1/2 |
| Area | SA | 1/4 | |
| Drift ratio | Sα | 1 | |
| Material parameters | Strain | Sε | 1 |
| Elastic modulus | SE | 1 | |
| Stress | Sσ | 1 | |
| Poisson’s ratio | Sμ | 1 | |
| Mass density | Sρ | 2 | |
| Load parameters | Concentrated force | SP | 1/4 |
| Area load | Sq | 1 | |
| Dynamic parameters | Period | ST | |
| Frequency | Sf | ||
| Acceleration | Sa | 1 | |
| Gravity acceleration | Sg | 1 | |
| Damping ratio | SC | 1/21.5 |
| Items | Constitutive | Stiffness | Load Capacity |
|---|---|---|---|
| Axial force | Elastic-perfect plastic | EA | P |
| Strong axis moment | Elastic-perfect plastic | EIx | Mnx |
| Weak axial moment | Elastic-perfect plastic | EIy | Mny |
| Torque | Elastic | GJ | ∞ |
| Items | Middle Region of the Column | Bottom Region of the Column | ||||||
|---|---|---|---|---|---|---|---|---|
| Em/MPa | Ae/mm2 | fey/MPa | Iex/mm4 | Em/MPa | Aes/mm2 | Iesx/mm4 | ||
| Inner column | 4.26 × 10⁵ | 565.7 | 411.1 | 1.27 × 10⁶ | 4.26 × 10⁵ | 952.6 | 2.74 × 10⁶ | |
| Side column | Strong axial | 3.92 × 10⁵ | 528.1 | 369.3 | 1.04 × 10⁶ | 3.92 × 10⁵ | 818.3 | 2.63 × 10⁶ |
| Weak axial | 3.92 × 10⁵ | 528.1 | 383.0 | 1.30 × 10⁶ | 3.92 × 10⁵ | 818.3 | 2.24 × 10⁶ | |
| Corner column | 3.76× 10⁵ | 473.4 | 324.5 | 0.73 × 10⁶ | 3.76× 10⁵ | 666.7 | 1.71 × 10⁶ | |
| Hysteretic Parameters of Shear Walls | ||||||||||||
|---|---|---|---|---|---|---|---|---|---|---|---|---|
| Equivalent members of the shear walls | Item | epdi/mm i = 1–4 | epfi/kN i = 1–4 | rDispP | rforceP | uforceP | aKlimit = 0.5 | aDlimit = 0.2 | aFlimit = 0.05 | |||
| aK1,2 | aK3,4 | aD1,2 | aD3,4 | aF1,2 | aF3,4 | |||||||
| Axial of 1, 2, 3 | 1.96, 4.15, 8.95, 50.52 | 5.88, 8.14, 9.96, 2.44 | 0.3 | 0.3 | 0.05 | 0.5 | 1.5 | 0.4 | 1.5 | 0.4 | 1.5 | |
| Axial of A, B, C | 1.67, 5.02, 10.56, 45.30 | 4.23, 5.68, 7.84, 2.79 | 0.3 | 0.3 | 0.05 | 0.5 | 1.5 | 0.4 | 1.5 | 0.4 | 1.5 | |
| Cases | Items | Maximum Drift of the First Story (mm) | Cumulative Energy of the Shear Wall in the First Story (kJ) | Maximum Roof Drift (mm) | Cumulative Energy of the Whole Structure (kJ) |
|---|---|---|---|---|---|
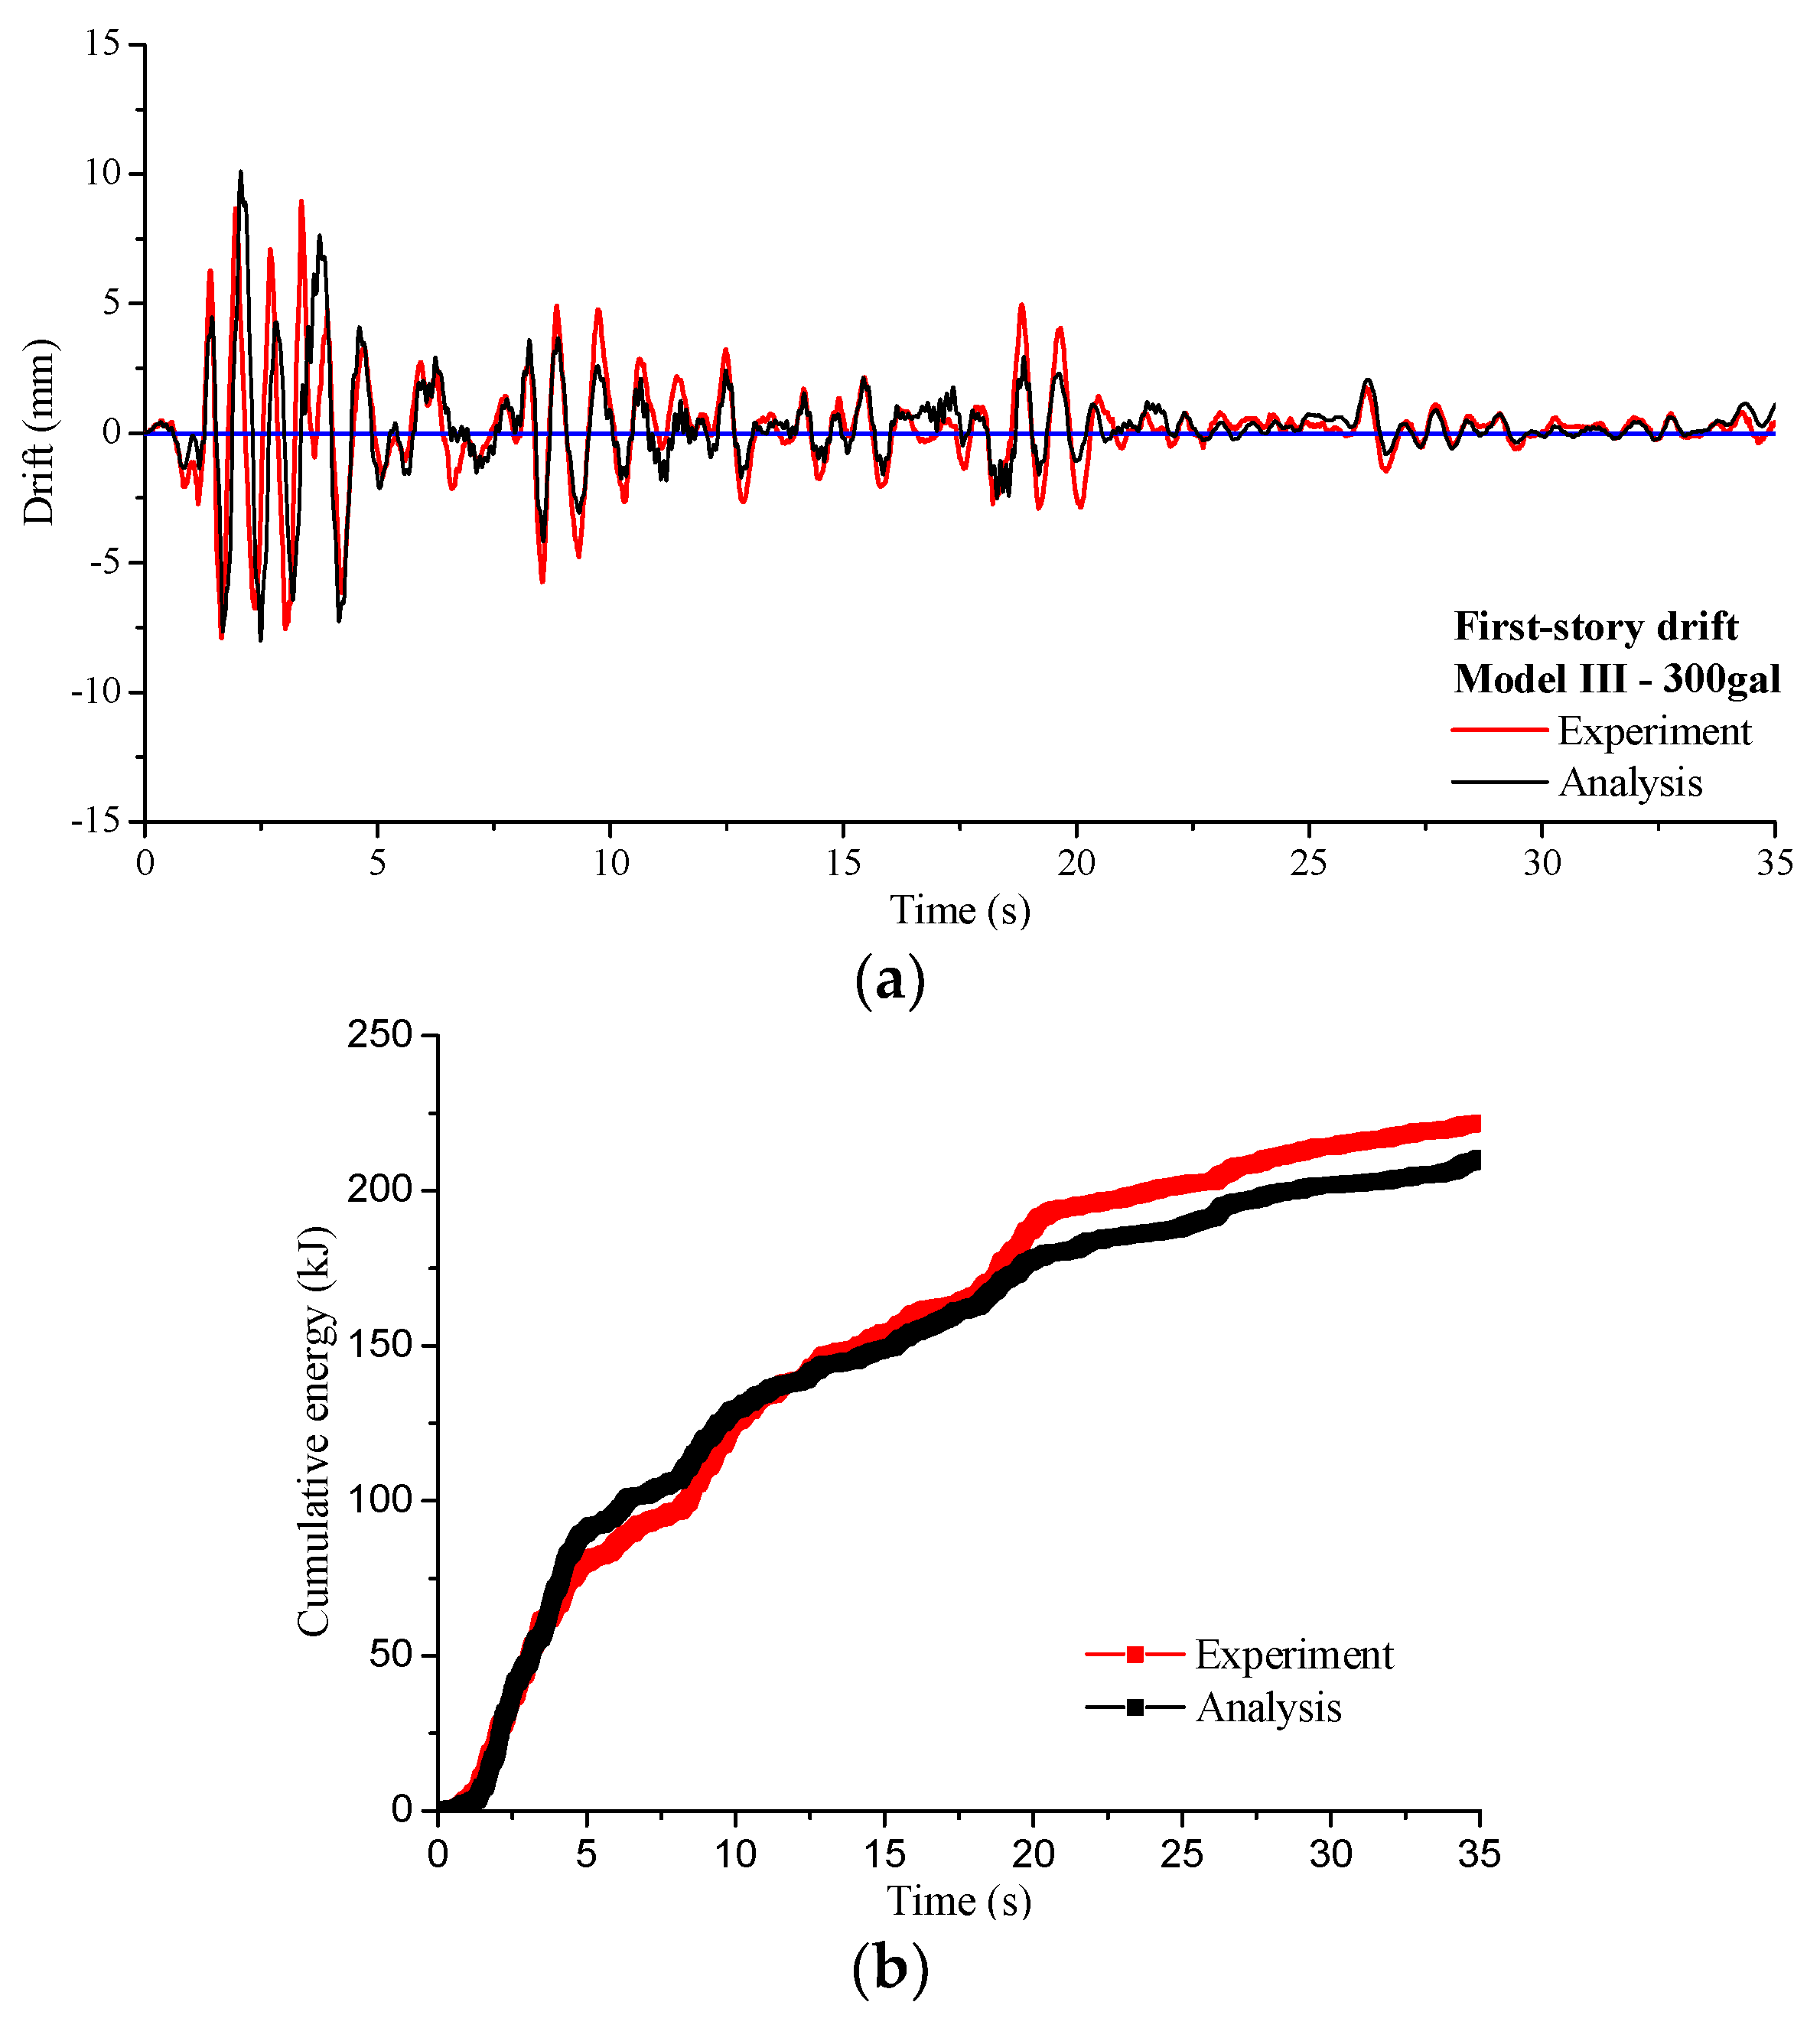
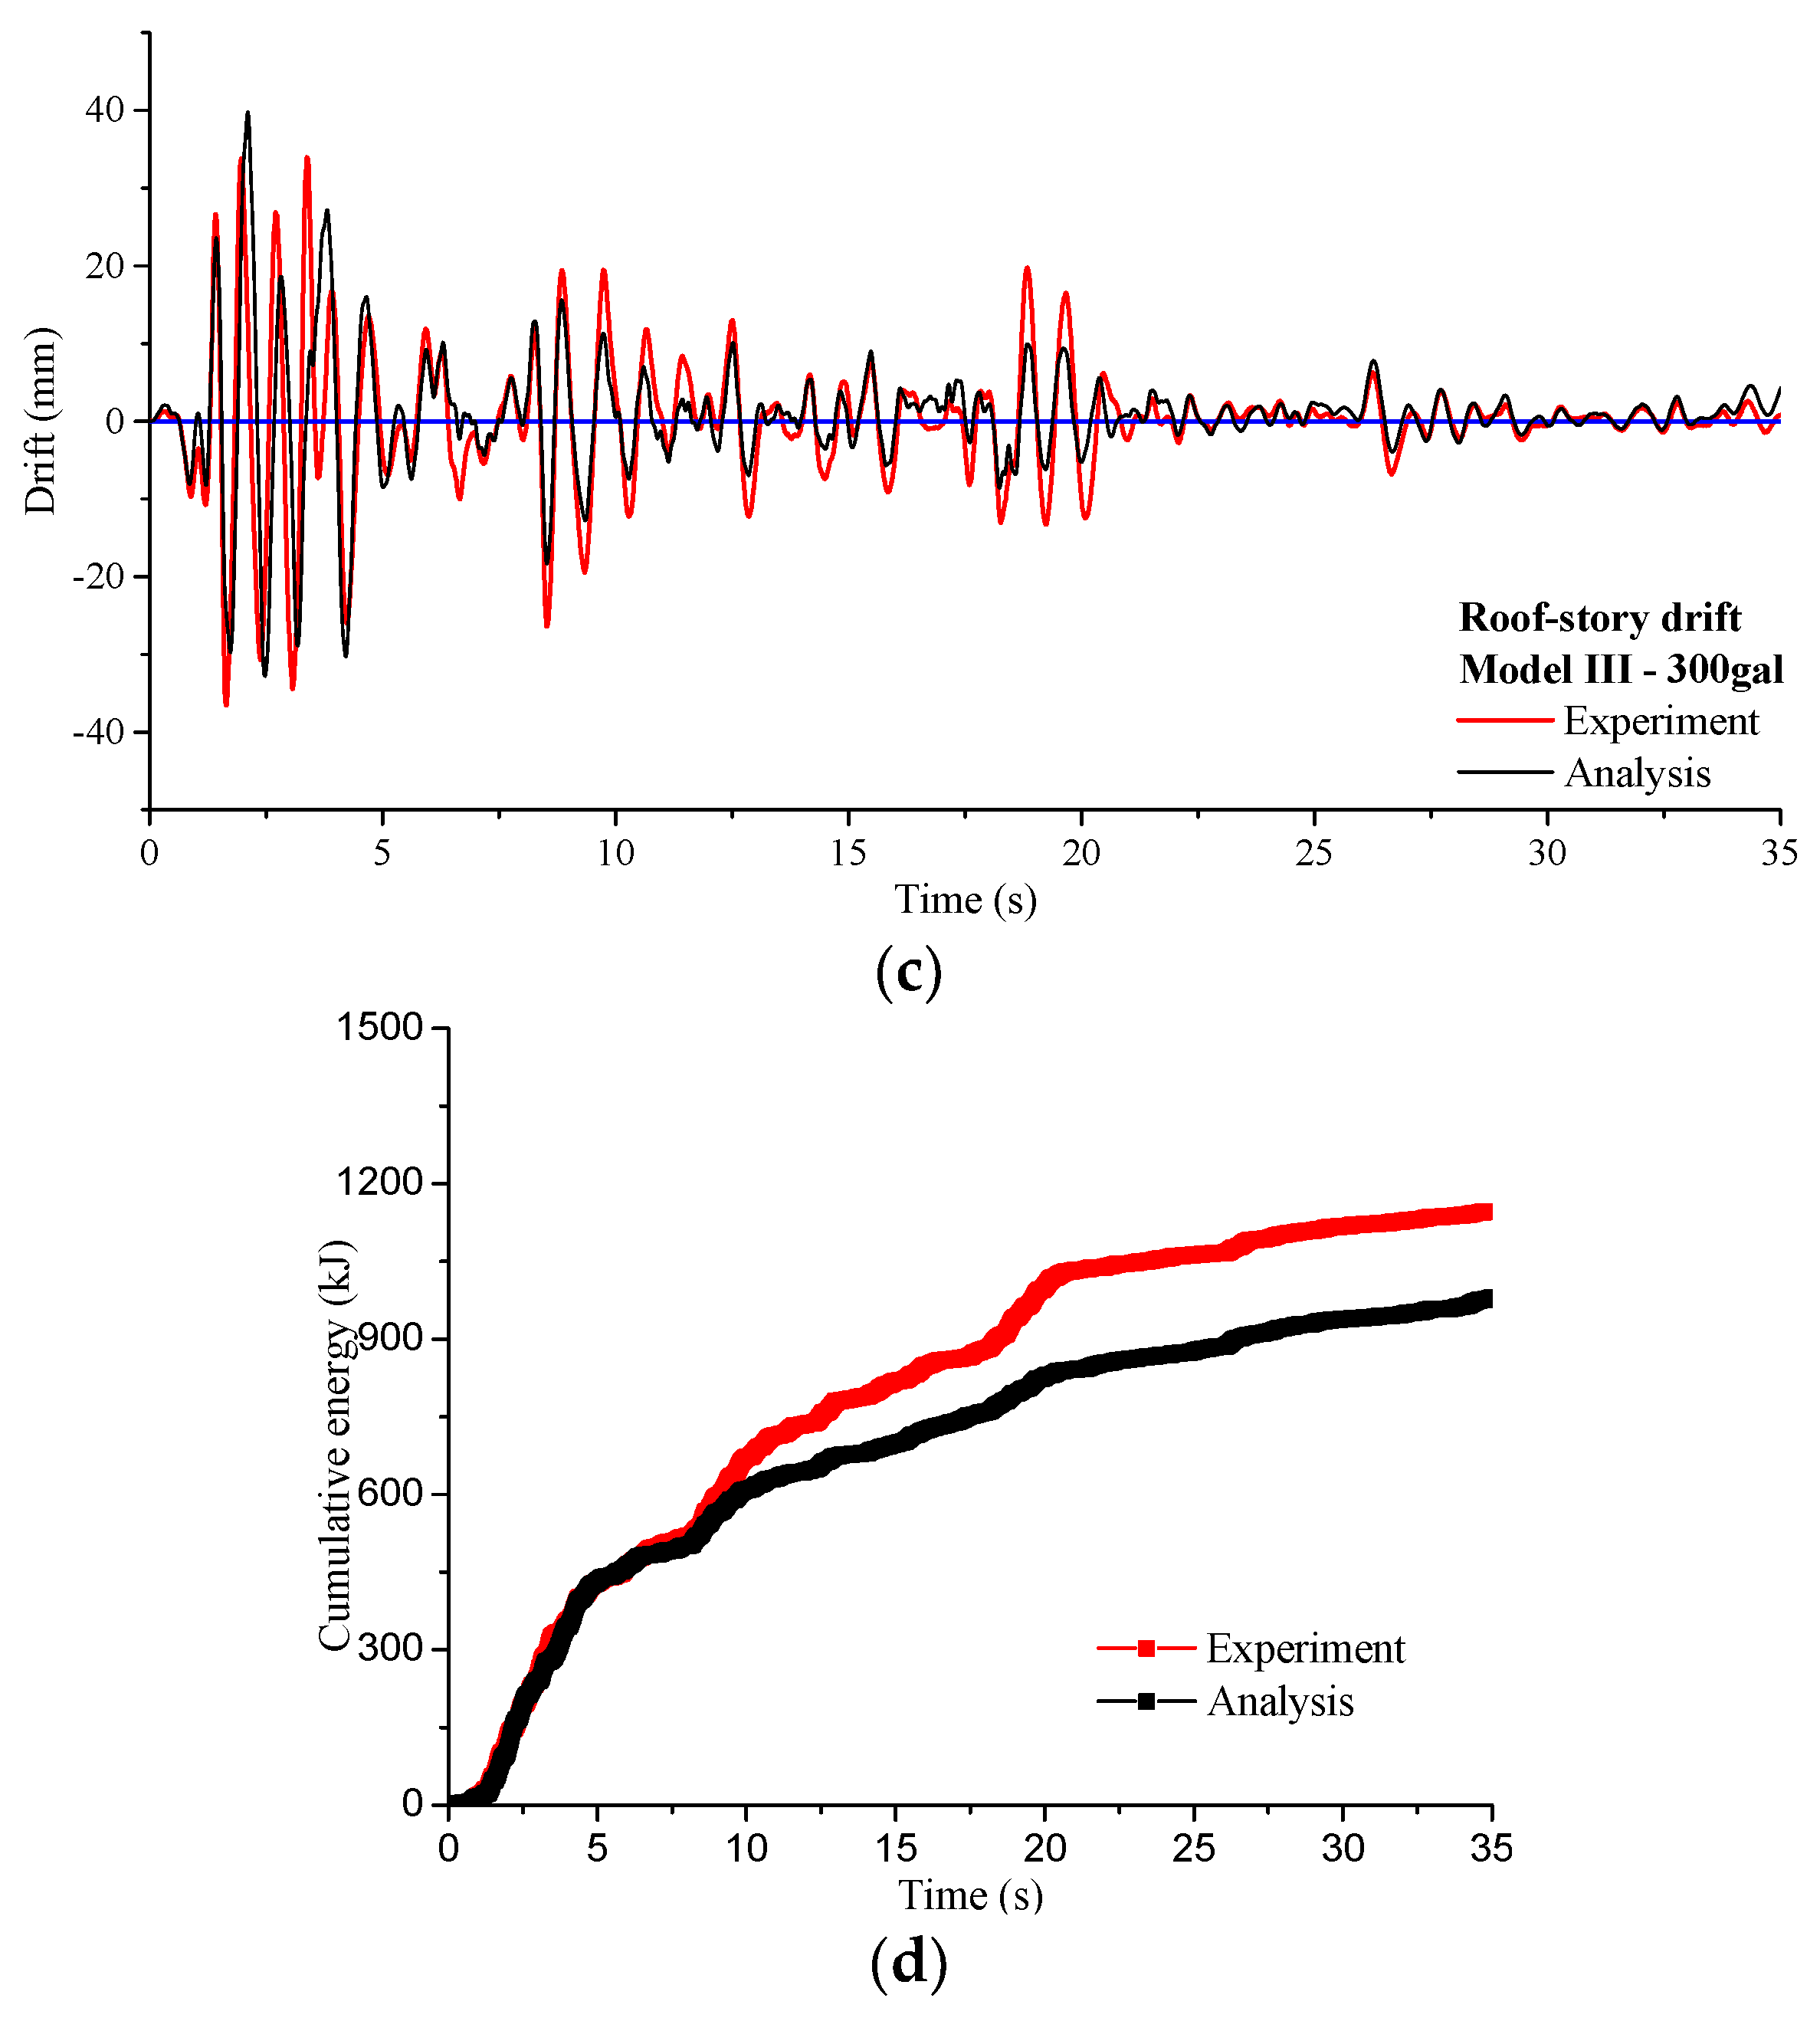
| 300 gal | Test | 8.98 | 221.72 | 36.76 | 1146.33 |
| Analysis | 10.09 | 210.15 | 39.65 | 981.60 | |
| Error | 12.3% | 5.2% | 7.9% | 14.4% | |
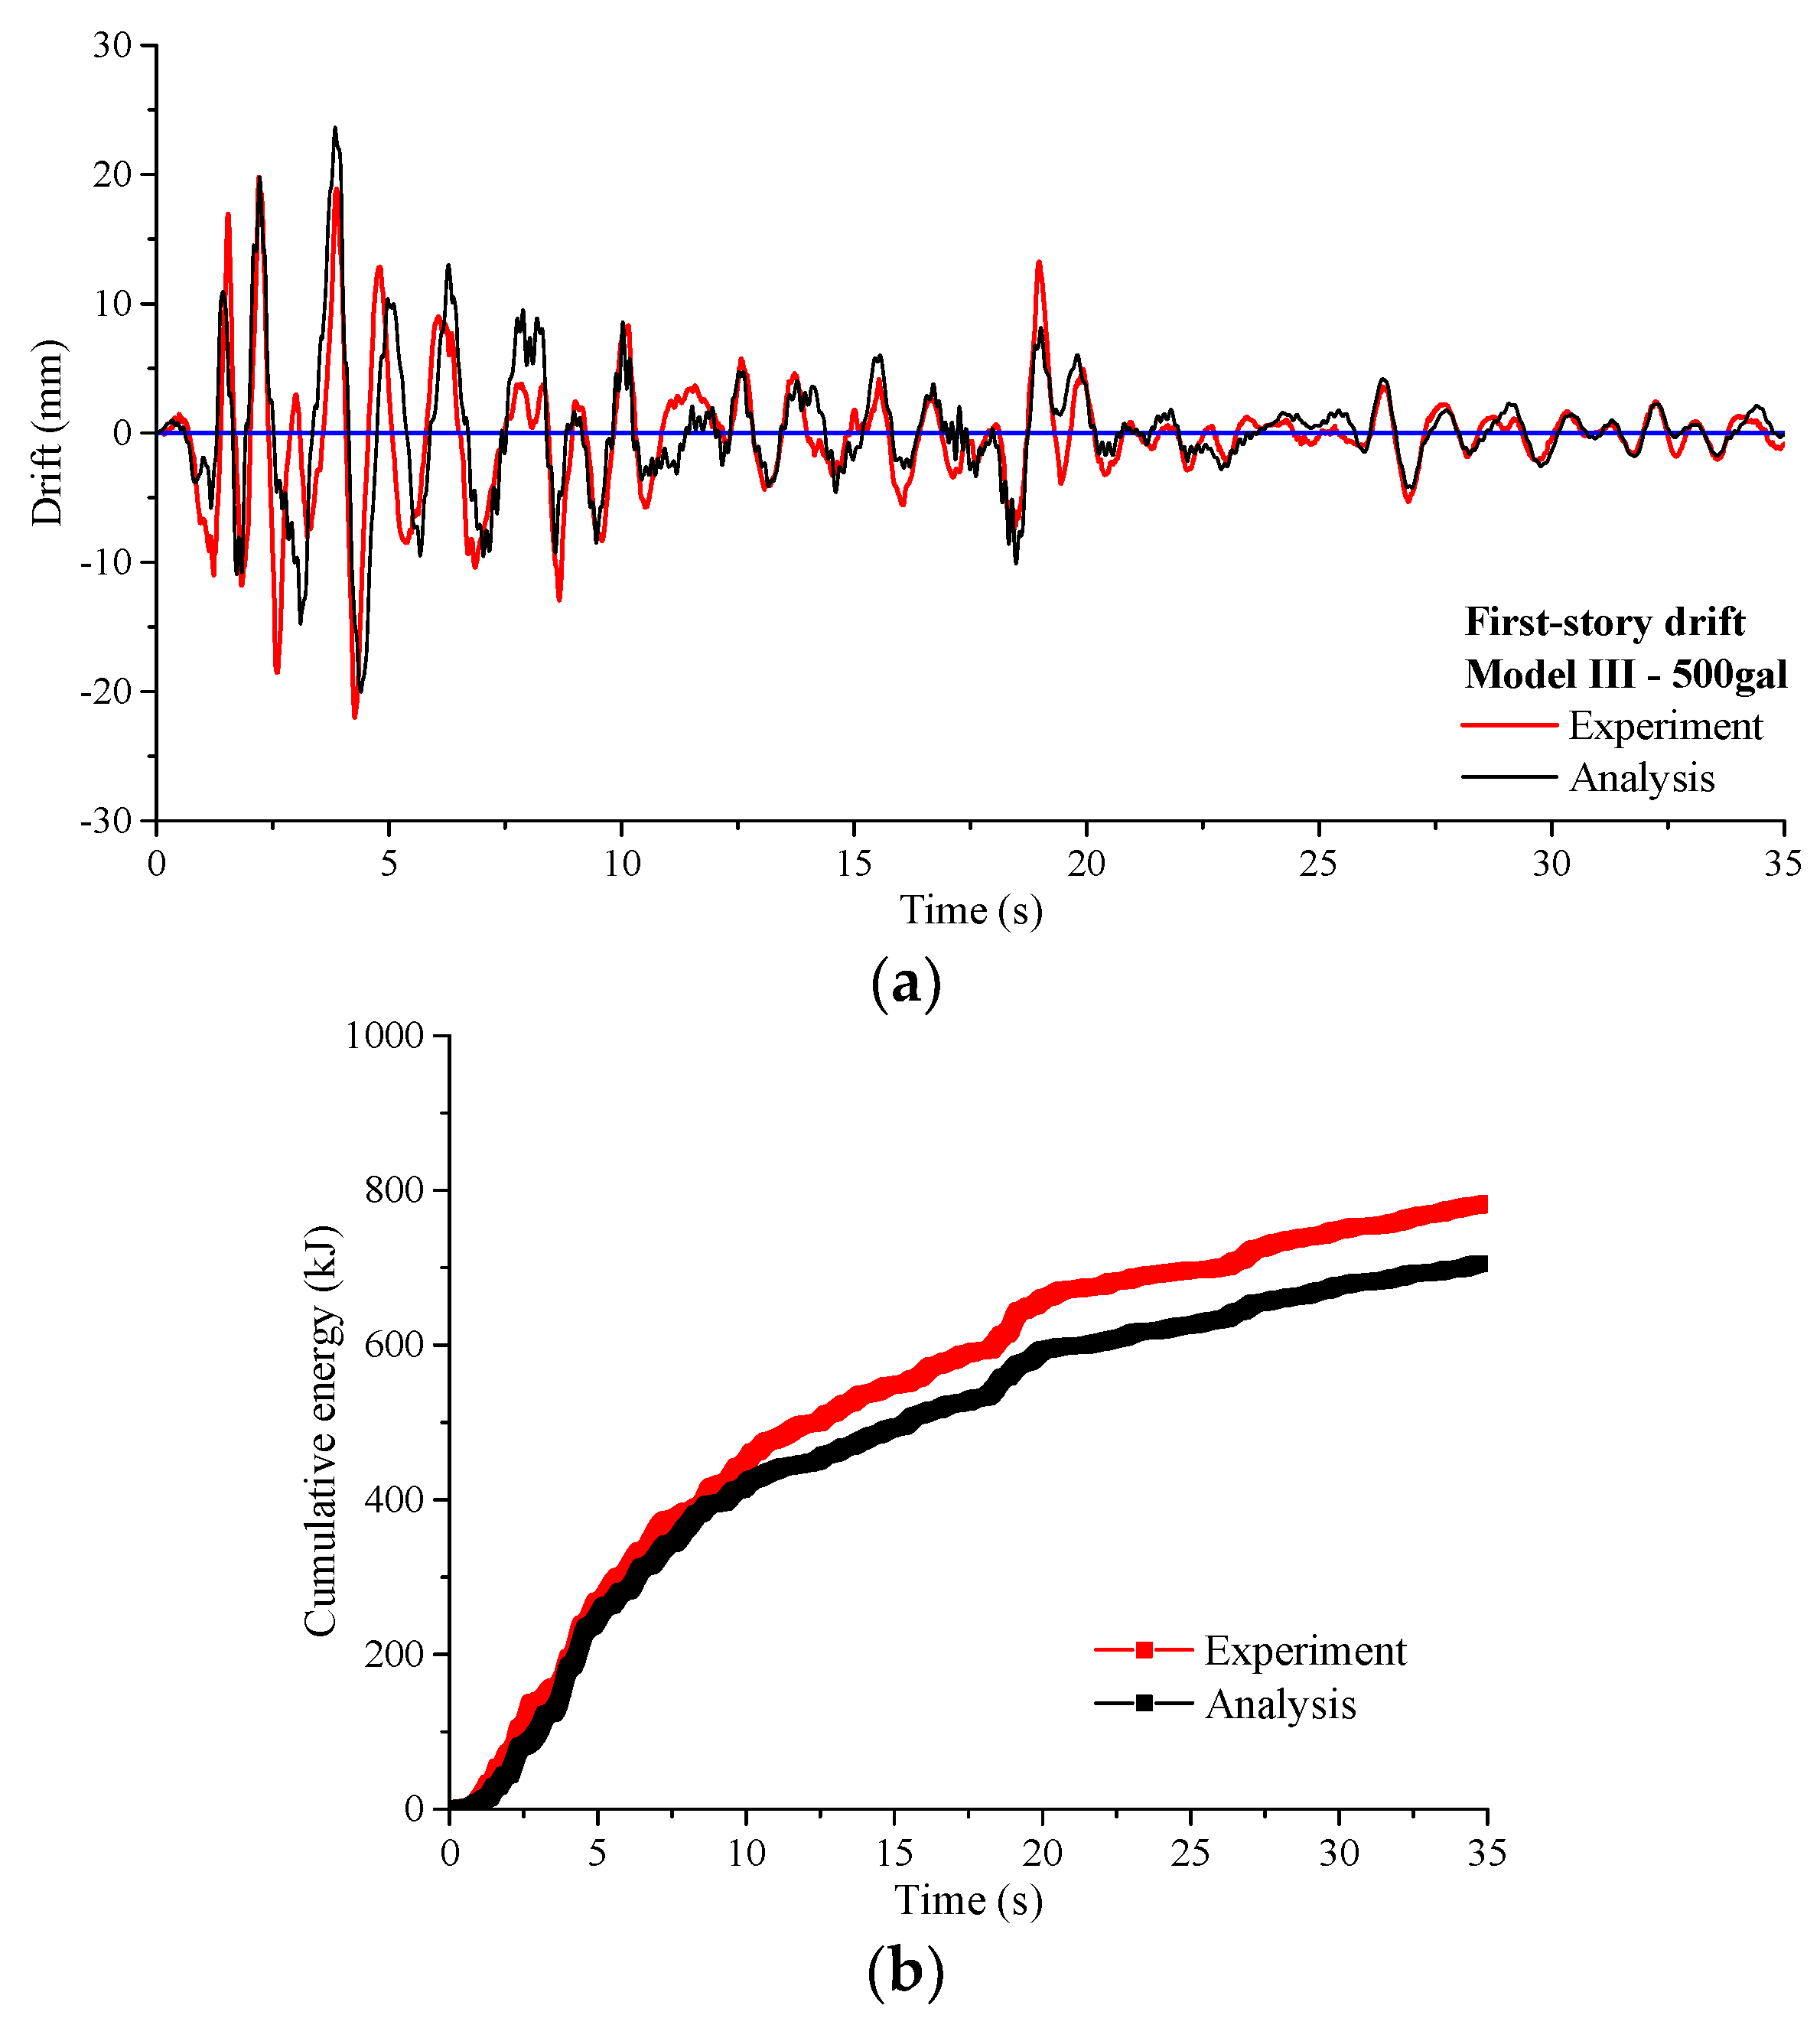
| 500 gal | Test | 22.20 | 783.43 | 82.09 | 2703.41 |
| Analysis | 23.52 | 705.19 | 86.35 | 2317.30 | |
| Error | 5.9% | 10.0% | 5.2% | 14.3% | |
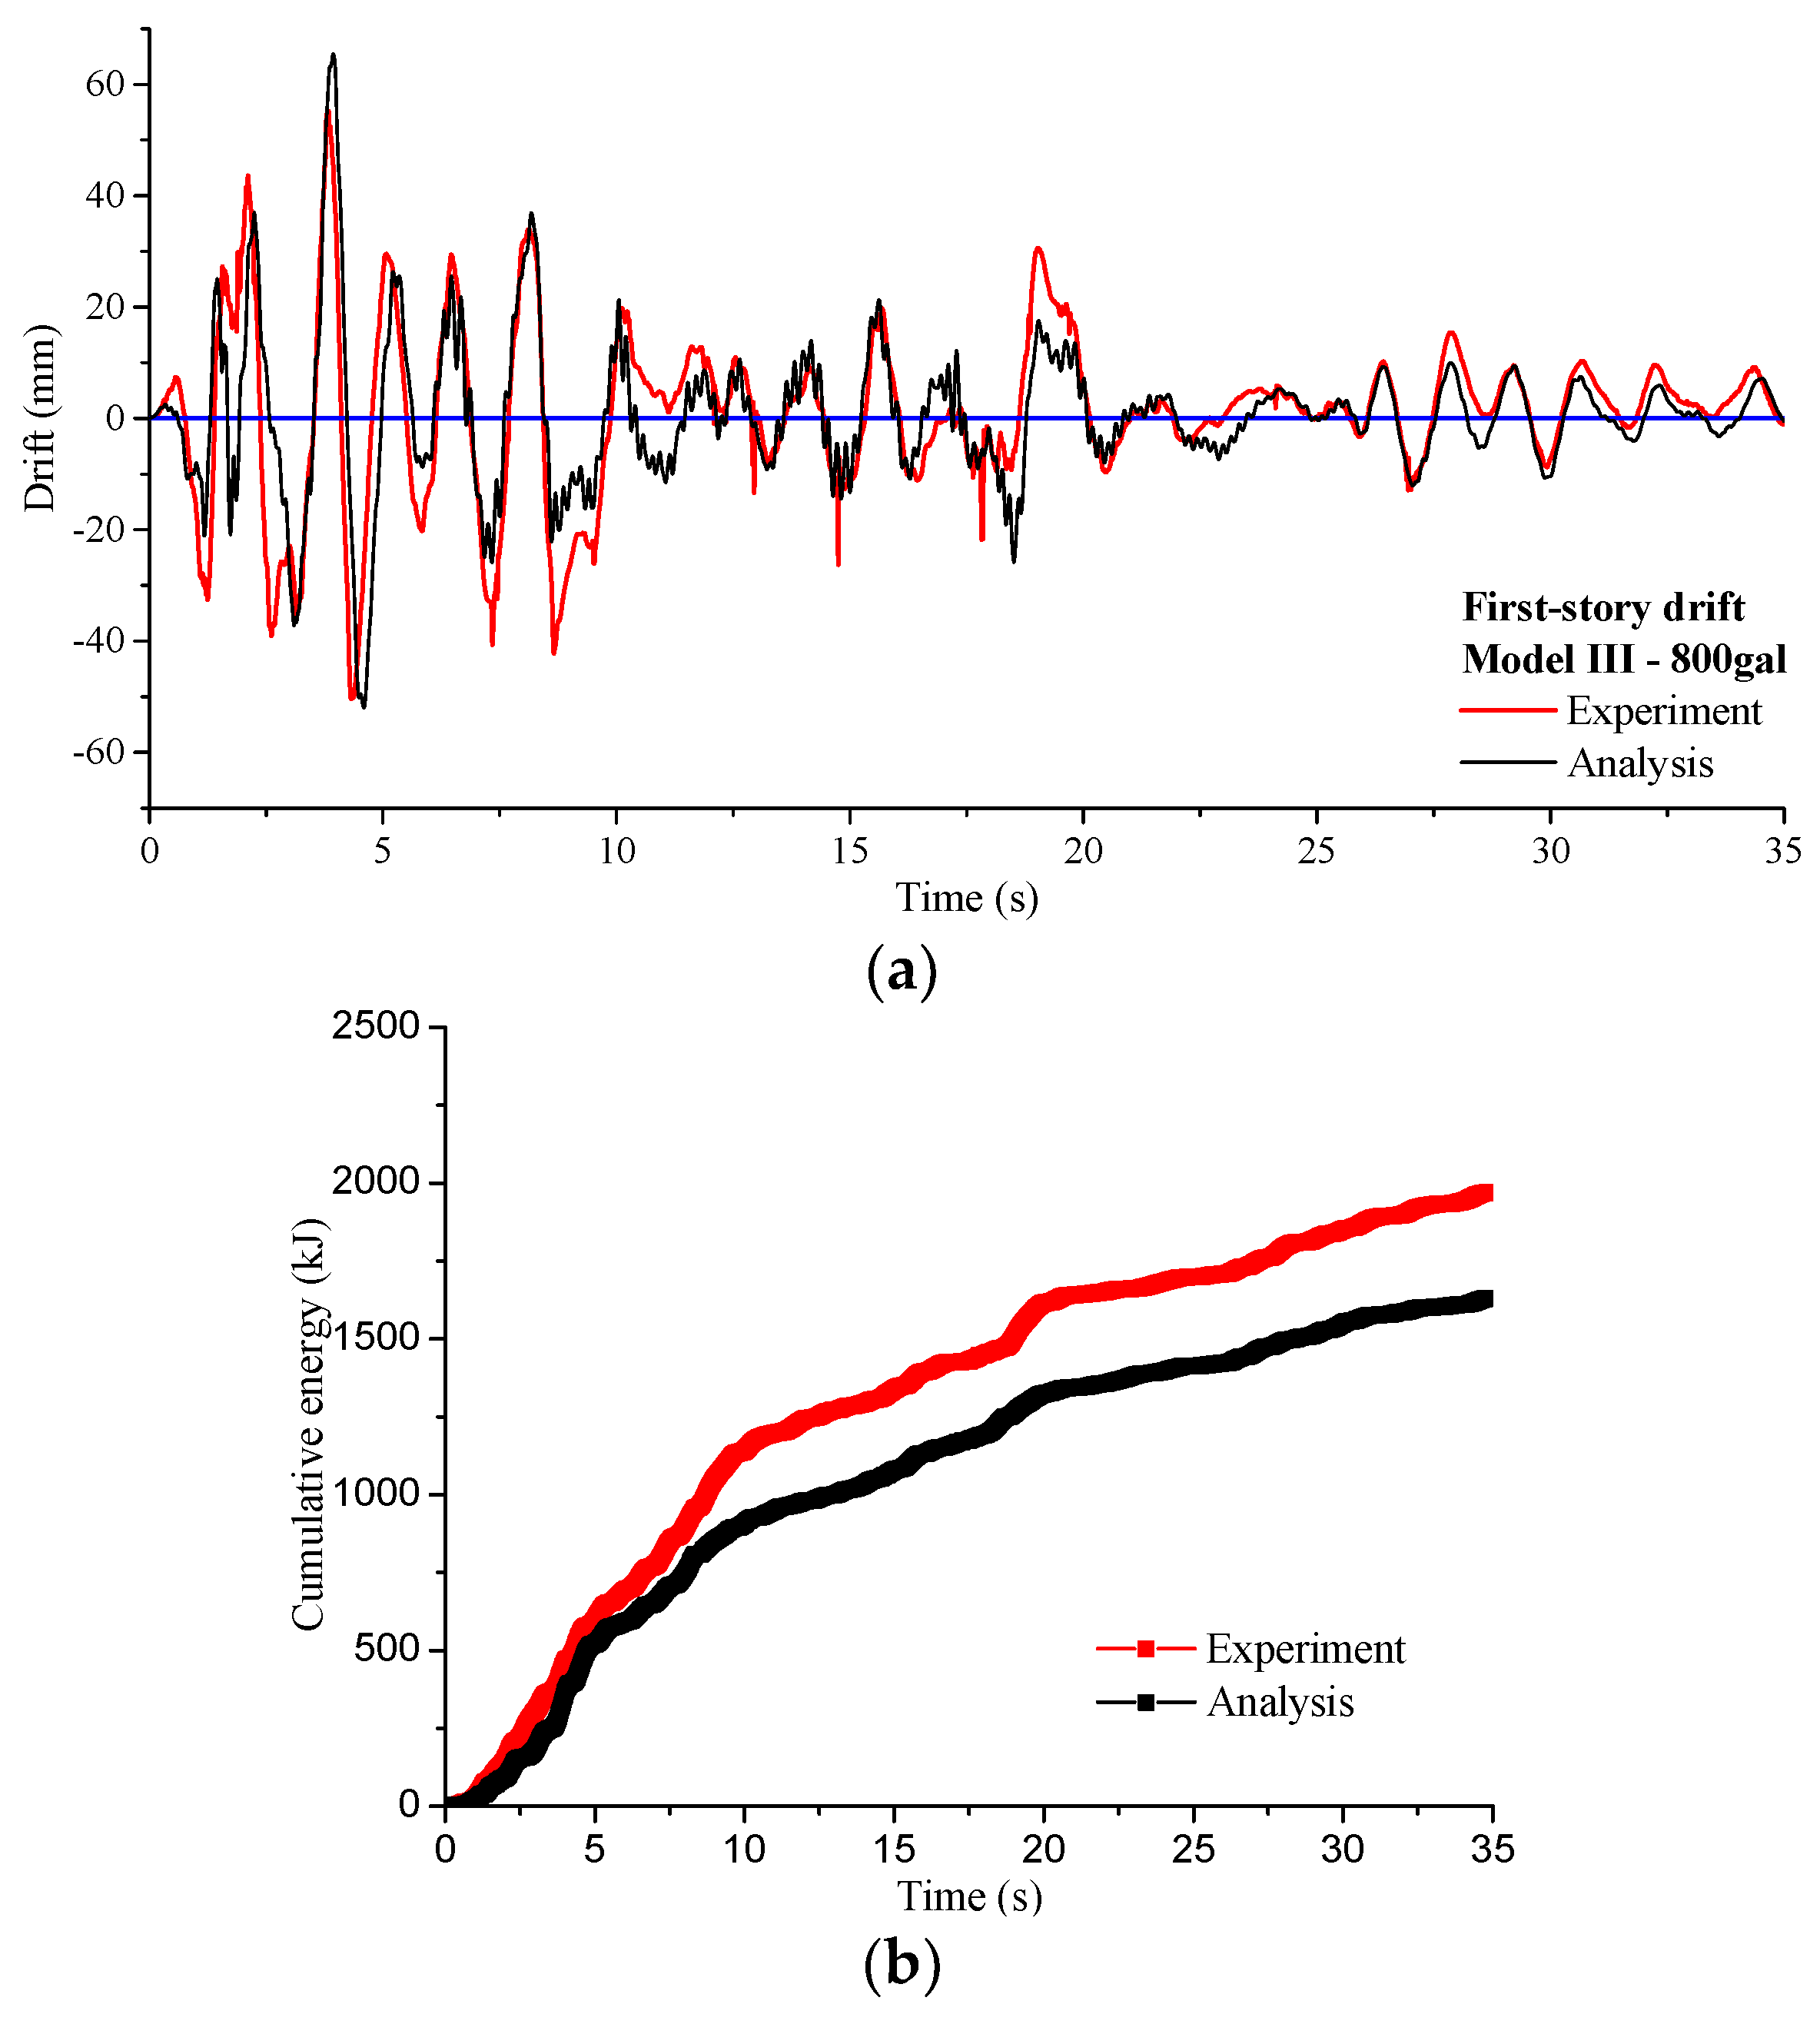
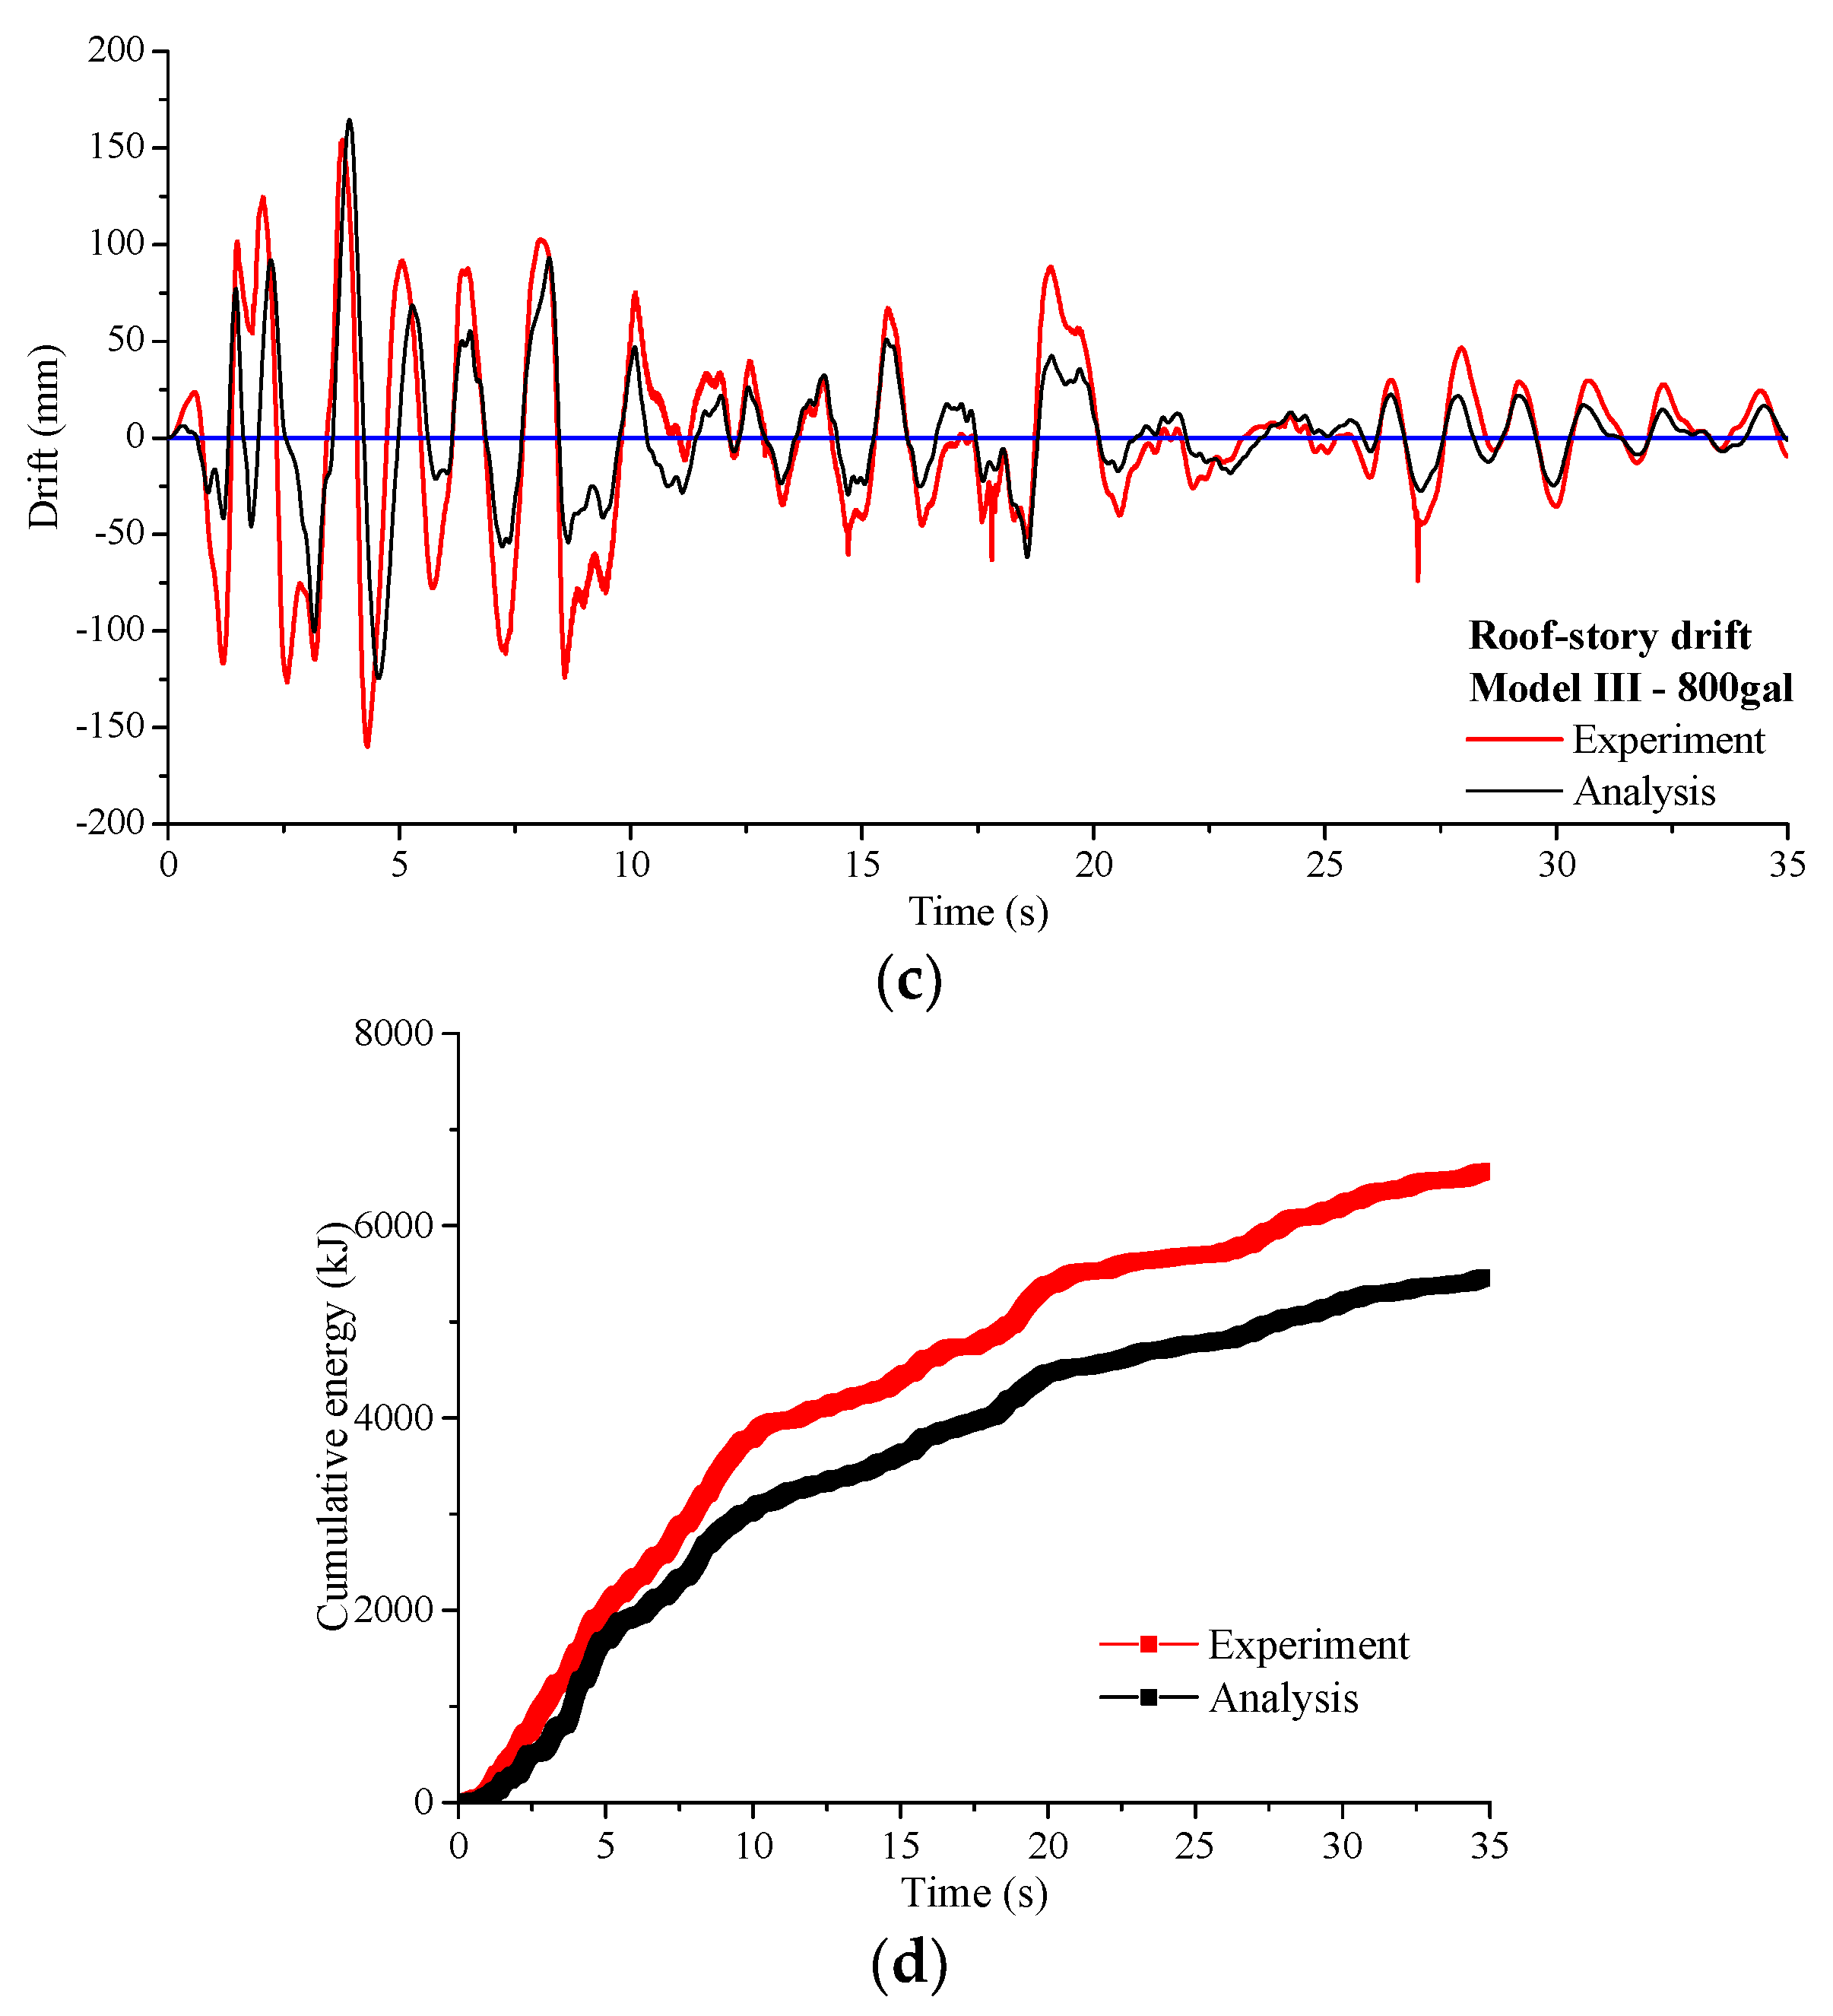
| 800 gal | Test | 55.66 | 1969.88 | 165.05 | 6559.92 |
| Analysis | 65.41 | 1631.09 | 153.47 | 5457.08 | |
| Error | 17.5% | 20.8% | 7.0% | 16.8% |
© 2018 by the authors. Licensee MDPI, Basel, Switzerland. This article is an open access article distributed under the terms and conditions of the Creative Commons Attribution (CC BY) license (http://creativecommons.org/licenses/by/4.0/).
Share and Cite
Ye, J.; Jiang, L. Simplified Analytical Model and Shaking Table Test Validation for Seismic Analysis of Mid-Rise Cold-Formed Steel Composite Shear Wall Building. Sustainability 2018, 10, 3188. https://0-doi-org.brum.beds.ac.uk/10.3390/su10093188
Ye J, Jiang L. Simplified Analytical Model and Shaking Table Test Validation for Seismic Analysis of Mid-Rise Cold-Formed Steel Composite Shear Wall Building. Sustainability. 2018; 10(9):3188. https://0-doi-org.brum.beds.ac.uk/10.3390/su10093188
Chicago/Turabian StyleYe, Jihong, and Liqiang Jiang. 2018. "Simplified Analytical Model and Shaking Table Test Validation for Seismic Analysis of Mid-Rise Cold-Formed Steel Composite Shear Wall Building" Sustainability 10, no. 9: 3188. https://0-doi-org.brum.beds.ac.uk/10.3390/su10093188