Modified S2CVA Algorithm Using Cross-Sharpened Images for Unsupervised Change Detection


1
Department of Civil Engineering, Chungbuk National University, Chungdae-ro 1, Seowon-Gu, Cheongju Chungbuk 28644, Korea
2
Agency for Defense Development, Yuseong-gu, Daejeon 34186, Korea
*
Author to whom correspondence should be addressed.
Sustainability 2018, 10(9), 3301; https://0-doi-org.brum.beds.ac.uk/10.3390/su10093301
Submission received: 13 July 2018
/
Revised: 11 September 2018
/
Accepted: 13 September 2018
/
Published: 15 September 2018
(This article belongs to the Special Issue Sustainable Applications of Remote Sensing and Geospatial Information Systems to Earth Observations)
Abstract
:This study aims to reduce the false alarm rate due to relief displacement and seasonal effects of high-spatial-resolution multitemporal satellite images in change detection algorithms. Cross-sharpened images were used to increase the accuracy of unsupervised change detection results. A cross-sharpened image is defined as a combination of synthetically pan-sharpened images obtained from the pan-sharpening of multitemporal images (two panchromatic and two multispectral images) acquired before and after the change. A total of four cross-sharpened images were generated and used in combination for change detection. Sequential spectral change vector analysis (S2CVA), which comprises the magnitude and direction information of the difference image of the multitemporal images, was applied to minimize the false alarm rate using cross-sharpened images. Specifically, the direction information of S2CVA was used to minimize the false alarm rate when applying S2CVA algorithms to cross-sharpened images. We improved the change detection accuracy by integrating the magnitude and direction information obtained using S2CVA for the cross-sharpened images. In the experiment using KOMPSAT-2 satellite imagery, the false alarm rate of the change detection results decreased with the use of cross-sharpened images compared to that with the use of only the magnitude information from the original S2CVA.
1. Introduction
With the launch of various optical satellite sensors, such as KOMPSAT-2/3/3A, WorldView-2/3/4, Pléiades, and Skysat, remotely sensed satellite images are being increasingly used in different applications and fields [1]. Change detection is one such remote sensing application. It involves analyzing a changed area due to disasters, deforestation, hazards, and urban development by determining differences in the spatial and spectral characteristics among multitemporal satellite images of the area [2]. Specifically, change detection can be used in sustainable applications in environmental engineering, ecology, and urban sciences through Earth observations. Change detection can generally be of the supervised or unsupervised type. Supervised change detection involves classifying each satellite image and analyzing the change class using classification results [3]. However, it has some drawbacks; for example, high-accuracy classification data are required to obtain high-confidence change detection results, and user intervention is required when generating training datasets [4]. Therefore, unsupervised change detection has attracted increased interest in recent years. In this technique, multitemporal satellite images of the same area are analyzed to detect the presence or absence of changes without user intervention. Several unsupervised change detection methods applicable to satellite images with various spatial resolutions, such as image differencing, image rationing, image-transformation-based techniques and change vector analysis (CVA), have been developed [5]. Notably, CVA can be easily applied to various multitemporal satellite images using the magnitude and direction of the difference between multitemporal images to estimate the changed area [6]. CVA has also been extended to develop additional techniques. Chen et al. [7] extended CVA to calculate spectral vector directions in multispectral images. Carvalho Júnior et al. [8] extended the spectral measures used for remote sensing data analysis to CVA to effectively apply CVA to multispectral images. Wu et al. [9] demonstrated that subspace-based change detection (SCD) has the same characteristics as the spectral angle mapper (SAM) and extended SCD to adaptive SCD (ASCD) and local SCD (LSCD). Bovolo and Bruzzone [10] transformed the magnitude and direction of CVA into the polar domain and proposed a compressed CVA method (C2VA) to effectively extract the changed area in polar coordinates. The sequential spectral CVA (S2CVA) technique was developed to analyze the transition of a changed area and increase the change detection accuracy of CVA and C2VA [11]. S2CVA uses the same method as C2VA to estimate the magnitude of the spectral change vector; however, it uses the reference vector to calculate the direction of the spectral change vector. In S2CVA, the reference vector used to calculate the direction of the spectral change vector is assumed to be the vector with the highest weight in the spectral change vector, and it is calculated using the principal component of the spectral change vector.
When pixel-based change detection techniques are applied to satellite images, false alarms often occur due to the effects of relief displacement and nadir angle differences among multitemporal images [6]. Such issues are especially common in high-resolution satellite images compared to low-spatial resolution satellite images [12]. To solve this problem, various change detection algorithms have been proposed. Im et al. [13] proposed an object-based change detection algorithm using correlation, slope and intercept image analysis. Object-based Iteratively Reweighted-Multivariate Alteration Detection (IR-MAD) has been applied to KOMPSAT satellite imagery to increase the change detection accuracy [14]. Peng and Zhang [15] developed an object-based change detection method based on the combination of segmentation optimization and multi-feature fusion. Furthermore, to increase the change detection accuracy, Zhang et al. [16] applied a deep-learning-based change detection algorithm to multi-spatial resolution remote sensing images. Seo et al. [17] generated a simulated image based on random forest regression to maintain the radiometric and phenological homogeneity conditions of multitemporal images. In addition to various change detection algorithms, cross-sharpening methods provide many advantages for minimizing false alarms in the unsupervised change detection of high-resolution satellite images. Wang et al. [18] applied an object-based change detection method using four images generated via cross-sharpening. Byun et al. [19] applied cross-sharpening techniques using near-infrared (NIR) bands to effectively detect the changed area in a flood region. Wang et al. [20] confirmed that the change detection accuracy can be increased by applying the IR-MAD technique to cross-sharpened images.
In this study, we improved the performance of S2CVA using a cross-sharpening technique. First, we determined how the magnitude information changes when the CVA technique is applied to a cross-sharpened image. In addition, we reduced the false detection rate in change detection by integrating the magnitude and direction information of S2CVA based on cross-sharpened multitemporal images. We applied the proposed method to KOMPSAT-2 satellite images and evaluated the change detection results. The remainder of this paper is organized as follows. Section 2 explains the image fusion and cross-sharpening techniques used in this study. Section 3 analyzes the characteristics of the direction information generated by cross-sharpening in the S2CVA technique and describes a method to reduce false alarms. Section 4 present the experimental results and discuss the use of KOMPSAT-2, respectively. Finally, the conclusions are presented in Section 5.
2. Sharpening
2.1. General Pan-Sharpening
Pan-sharpening is a technique in which a high-spatial-resolution multispectral image is produced by fusing the spatial properties of a panchromatic image and the spectral properties of a multispectral image [21]. Pan-sharpening is defined in Equation (1) [22].
where is a panchromatic image with a high spatial resolution; is the interpolated image with image size ; is the injection gain; is a synthetic intensity image with a low spatial resolution; is the number of spectral bands; and is the pan-sharpened multispectral image of the nth band. Pan sharpening can be divided into component substitution (CS)-based and multiresolution analysis (MRA)-based techniques according to the method of calculating in Equation (1) [23]. MRA-based algorithms generate a synthetic intensity image by applying a filtering technique to and produce a high-frequency image by subtracting from the panchromatic image [24]. Unlike MRA-based algorithms, which extract a high-frequency image from the panchromatic image, CS-based algorithms produce a virtual intensity image using weighted combinations of multispectral images or multiple linear regressions between the panchromatic and multispectral images and extract a high-frequency image via subtraction from the panchromatic image [25]. One advantage of MRA-based algorithms is that the possibility of spectral distortion is reduced [26]. However, when the geometric characteristics between the panchromatic and multispectral images do not match, the spatial details are relatively low compared with those provided by the CS-based algorithm because aliasing occurs due to spatial frequency differences [27]. Overall, the CS-based algorithm provides more spatial details but also more spectral distortion than does the MRA-based algorithm [28].
2.2. Cross-Sharpening
When a change detection method is applied to multitemporal satellite images with a high spatial resolution and inconsistent geometrical characteristics, unchanged regions will be detected as changed regions due to geometrical errors and object relief displacement because most change detection techniques statistically analyze differences in the values of pixels at the same position in images [29]. To minimize change detection errors due to the geometrical characteristics of high-spatial-resolution satellite images, Wang et al. [18] proposed change detection using cross-sharpening. Cross-sharpening is a method of generating a fused image pair with similar geometric characteristics using multispectral and panchromatic images with the same or different acquisition times. It is assumed that a satellite sensor that simultaneously provides both panchromatic and multispectral images is used to acquire a multitemporal image for change detection in a study area. When the panchromatic image obtained at time , that is, a point in time before the change, is defined as , the multispectral image is defined as , and the panchromatic and multispectral images obtained at time are respectively defined as and ; thus, the fused multispectral image at each time produced by the specific pan-sharpening algorithm is defined as shown in Equation (2).
When the nadir angle of and is different, the spatial positions of some objects, such as apartments and high-rise buildings, are different due to relief displacement. When performing change detection using general sharpened images and , the objects or regions associated with the abovementioned spatial displacement may be detected as changed regions, and this issue poses a problem. Cross-sharpening has been applied to minimize spatial dissimilarities between multitemporal images caused by nadir angle and relief displacement differences, as defined in Equation (3) [18].
In Equations (2) and (3), four cross-sharpened images are generated according to the spatial characteristics of the panchromatic images used in the cross-sharpening process. For example, and , which are general pan-sharpened images generated by Equation (1), will have different spatial characteristics for each object based on the original high-spatial-resolution multitemporal panchromatic image. This result occurs because the spatial characteristics of the sharpened images are affected by and . By contrast, because and Ft1t2 are sharpened by , both images have similar spatial characteristics. These results are the same for Ft2t1 and , and applying unsupervised change detection to a combination of four cross-sharpened images (, and ) can reduce the influence of the geometrical errors that may occur in and . Moreover, for effective change detection, the generated cross-sharpened images can be modified to have similar statistical characteristics by adjusting the histograms of various radiometric calibration methods [30,31,32,33,34]. In addition, the accuracy of change detection using cross-sharpened images can be influenced by the pan-sharpening algorithm applied for cross-sharpened image generation.
3. Modified S2CVA Algorithm
3.1. S2CVA
S2CVA is a modified version of C2VA used in the generation of direction information for changed and unchanged areas. S2CVA is proposed to eliminate information loss caused by the compression of multispectral information. An advantage of S2CVA is that it can grasp not only the change in area but also the land cover trends via hierarchical analysis [35]. This method uses all the bands of a given multispectral image. In addition, S2CVA represents the trend in a region as a 2-D polar coordinate system that is compressed by the configuration of the magnitude and direction θ. The magnitude indicates the spectral value of the multitemporal image, and the direction is generated based on the spectral angular distance for a given pixel. and are calculated using Equations (4)–(6) [35].
where and are multitemporal images, is the difference image of the multitemporal images, is the difference image of the th ( band, and is the th component of the reference vector . The reference vector is defined as an eigenvector resulting from applying principal component analysis to . Therefore, is the first eigenvector of the covariance matrix of , as given in Equation (7). is decomposed into eigenvalues and eigenvectors according to Equation (8) [35].
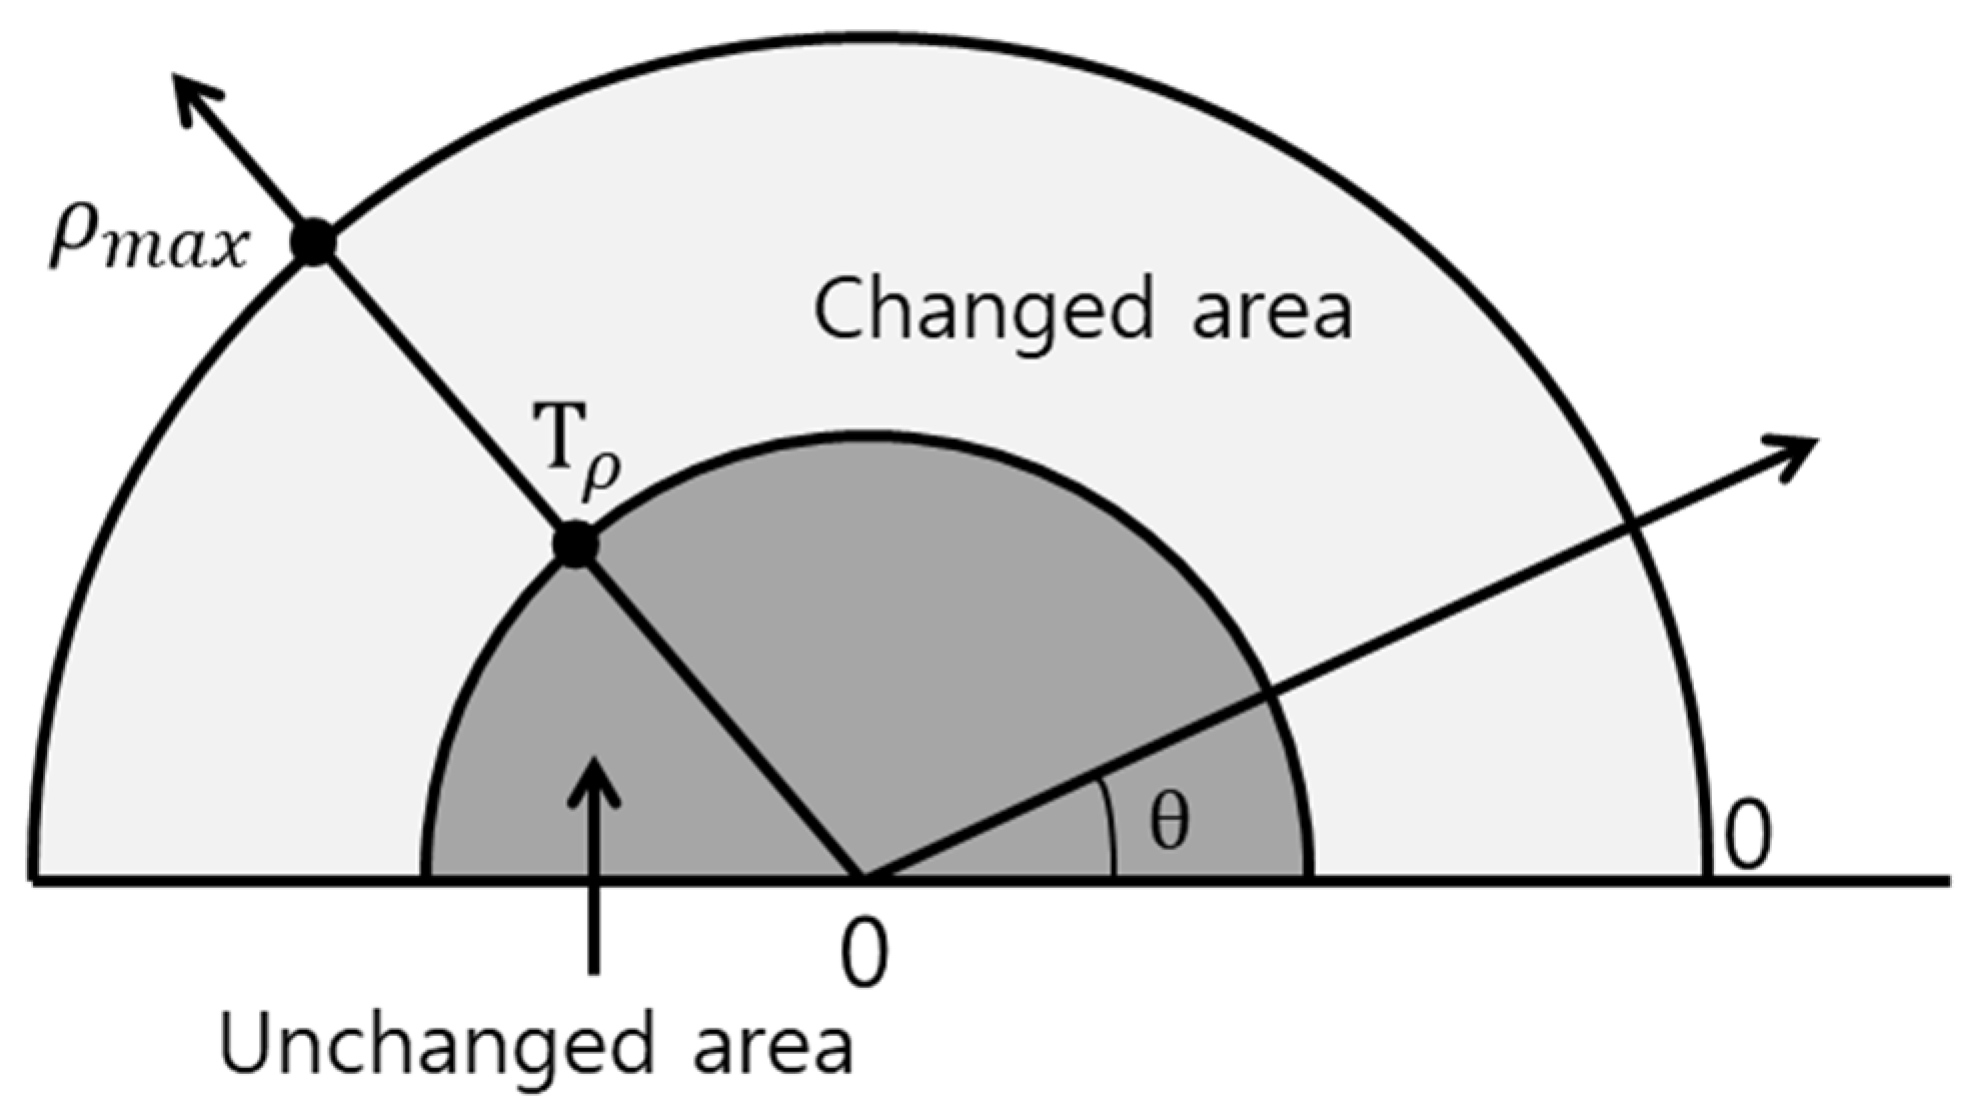
where is a diagonal matrix in which the eigenvalues are sorted in descending order and is a matrix of eigenvectors used to determine the reference vector . The results of applying the S2CVA method to multitemporal images using Equations (4)–(5) comprise the magnitude and direction and can be expressed as a 2-D polar coordinate system, as shown in Figure 1 [35,36].
In Figure 1, is the maximum value of and , the threshold value of , where determines the change. Liu et al. [35] performed change detection using the value generated by the S2CVA method and analyzed the land cover changes by classifying the direction according to the relevant values. The experiment indicated that the changed region could be divided into several sectors based on the range value based on the aspect of the changed region.
3.2. Modified S2CVA to Reduce False Alarms Using the Direction Vector for Cross-Sharpened Images
In this study, we improved the change detection performance by reducing false alarms using the direction calculated by S2CVA. As noted above, the two products of S2CVA, that is, magnitude and direction, can be used to estimate the primary changed region and analyze changed area patterns, respectively. When change detection is performed using multitemporal images with different seasonal characteristics, non-changed vegetation or soil areas may be considered changed areas [36]. However, this categorization is likely to have a certain direction value based on changes in the land cover pattern [37]. Therefore, some false alarms can be eliminated by using direction values when the direction values of these incorrectly categorized areas display a certain pattern. Cross-sharpened images emphasize the miscategorization of trends based on S2CVA products. Some areas recognized as false alarms, such as those influenced by seasonal effects, vegetation growth, and unchanged regions among regions with very high magnitudes, are spectrally distorted in the cross-sharpened image. Specifically, in these regions, the spectral pattern of the difference image in S2CVA is similar to the reference vector. Therefore, the changed area can be relatively small in the direction image. Although changed areas have low direction values, these areas have large magnitudes and therefore remain changed areas. Thus, the S2CVA directions in the cross-sharpened images can be used to determine the changed area. The direction vector is assumed to extract the changed region in a manner similar to the magnitude vector [38], and it can be used as the weight value. To use the direction vector as a weight for the magnitude vector, the range of the direction vector values must first be adjusted from 0 to 1, and the cumulative distribution function (CDF) must be applied to adjust the values:
where is the adjusted direction value; is the probability of . for all values of direction information; and is a random variable with a real range. The adjusted direction vector used as a weight value for the magnitude vector is given by Equation (10):
where is the weighted magnitude vector that, in this study, is used to evaluate the performance of unsupervised change detection.
4. Experimental Results and Discussion
We performed unsupervised change detection using high-resolution images generated by cross-sharpening. The S2CVA method was applied for change detection, and the change magnitude and direction vector values were calculated. The S2CVA direction vector was used to reduce false alarms from regions categorized as changed by the S2CVA magnitude vector. To evaluate the performance of change detection, we compared the change detection results produced using the existing pan-sharpening images and the cross-sharpening images only.
4.1. Materials and Study Areas
In this study, high-resolution KOMPSAT-2 satellite images comprising panchromatic and multispectral bands were acquired. Table 1 shows the specifications of the KOMPSAT-2 satellite imagery.
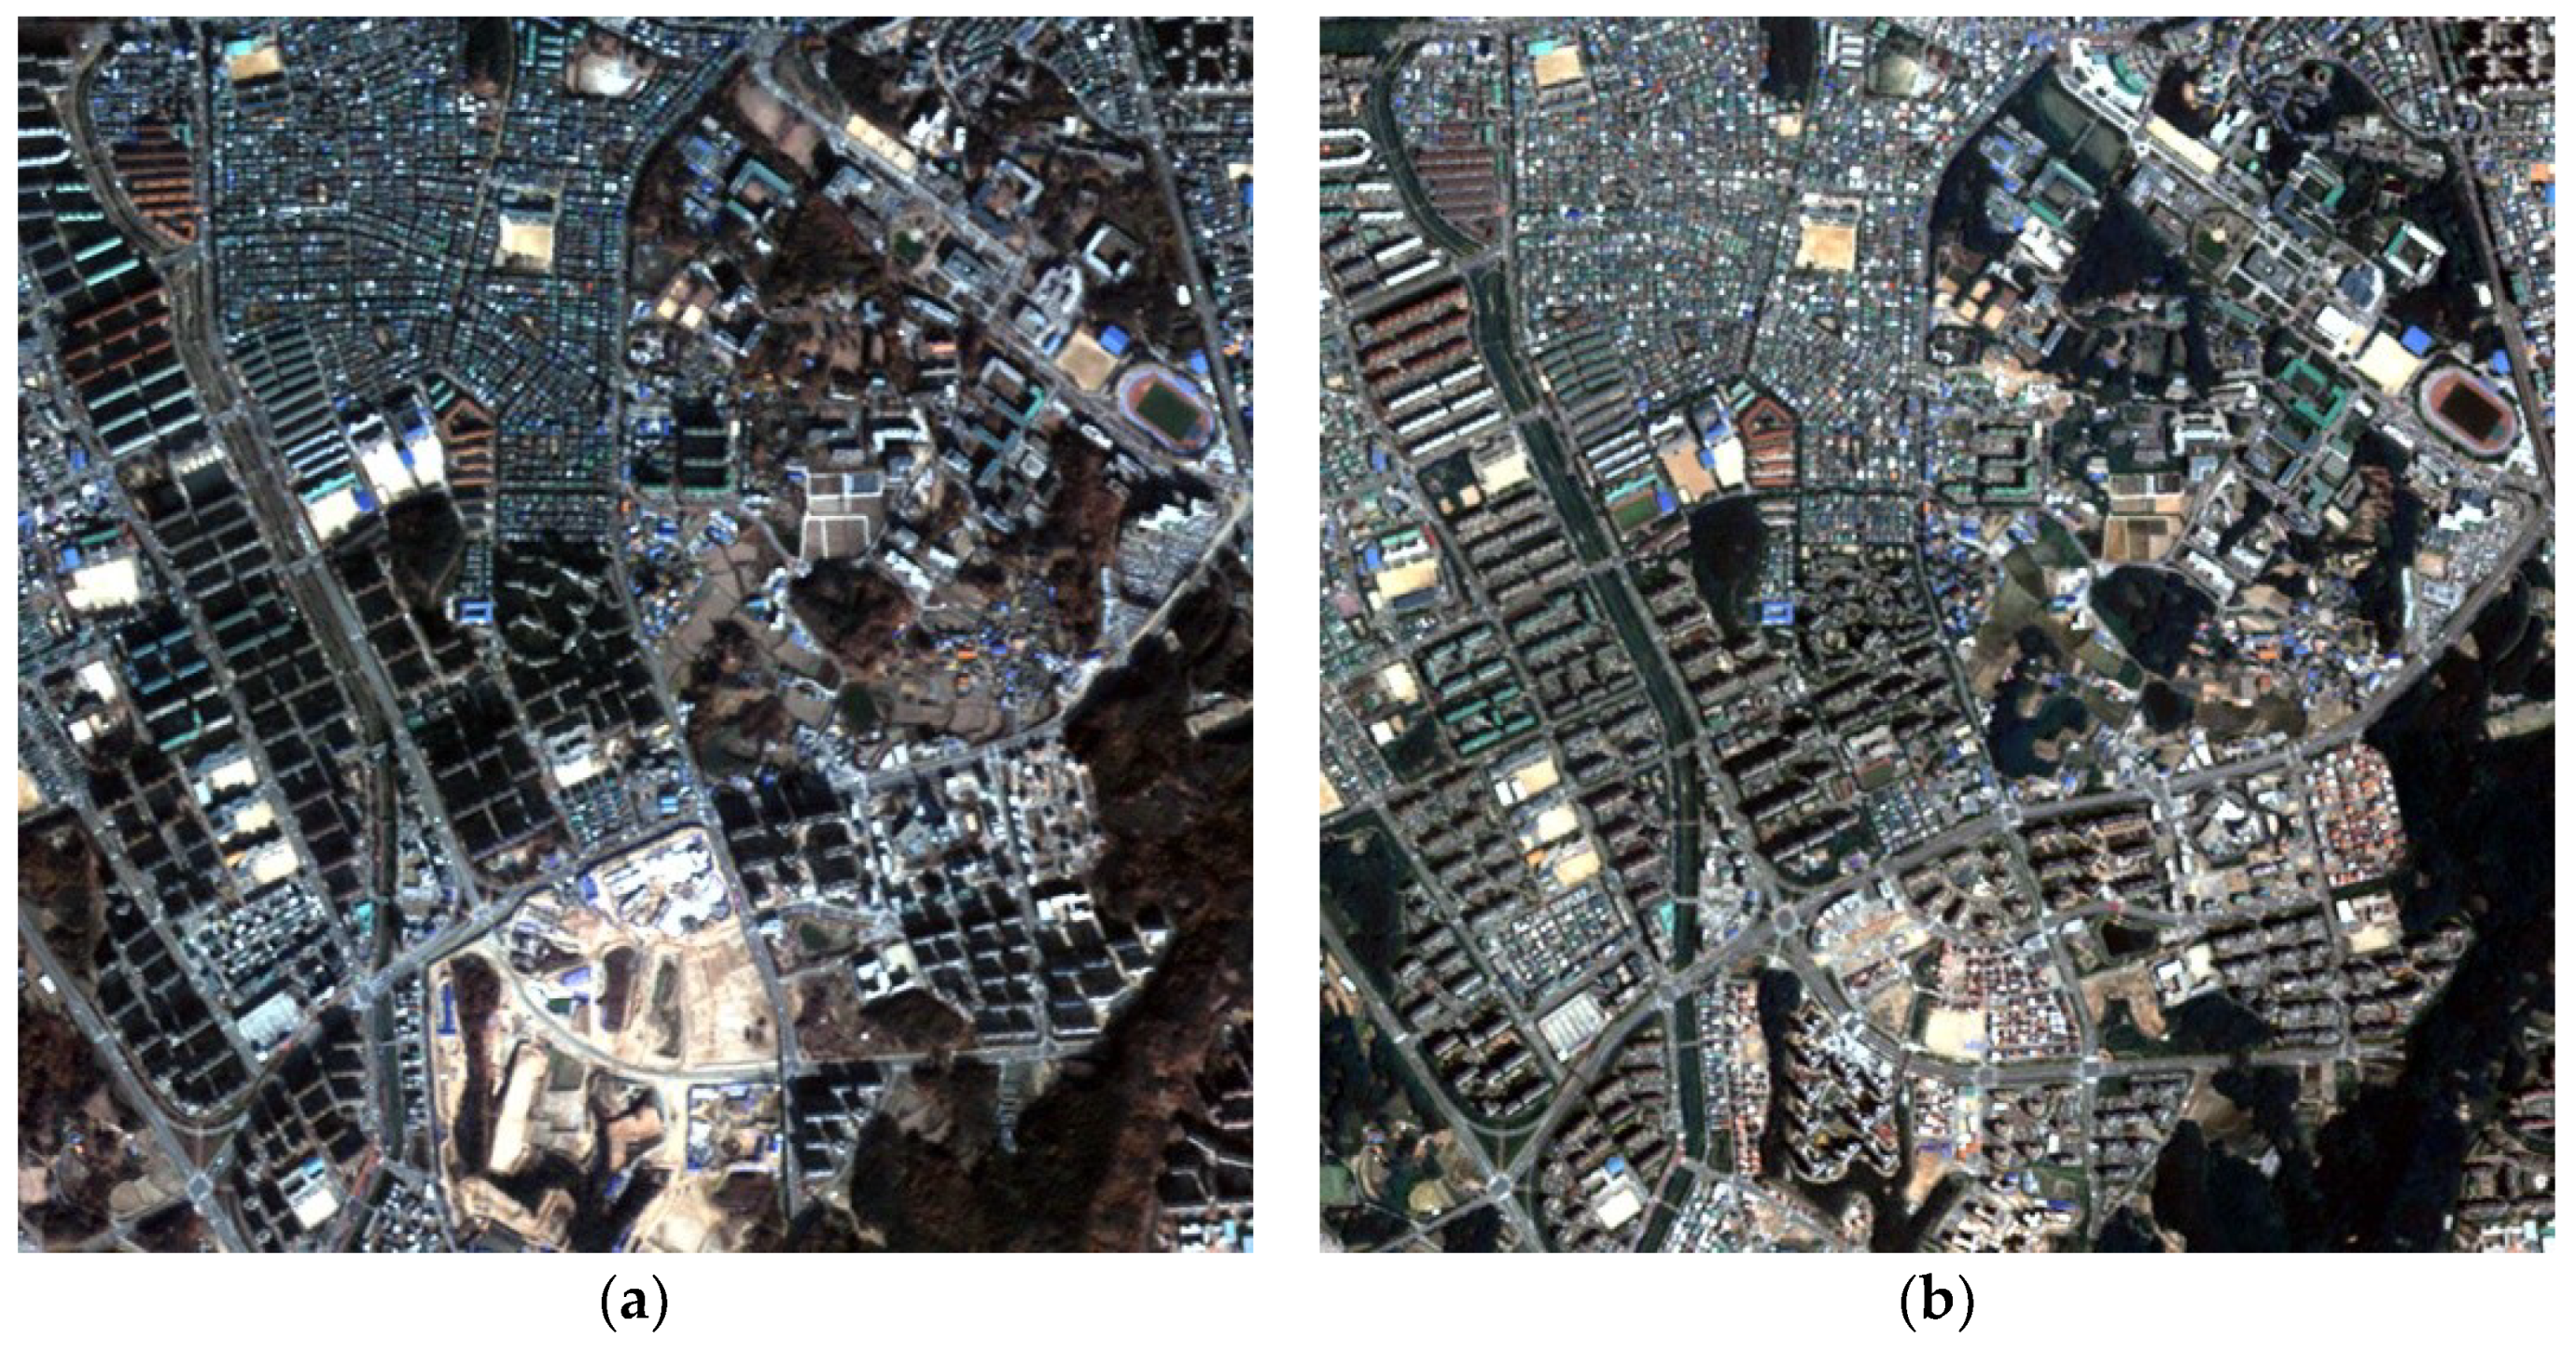
The study areas were selected from two regions, namely, Cheongju and Daejeon, South Korea, which are both under development. Table 2 describes the experimental datasets, and Figure 2 shows images of Sites 1 and 2.
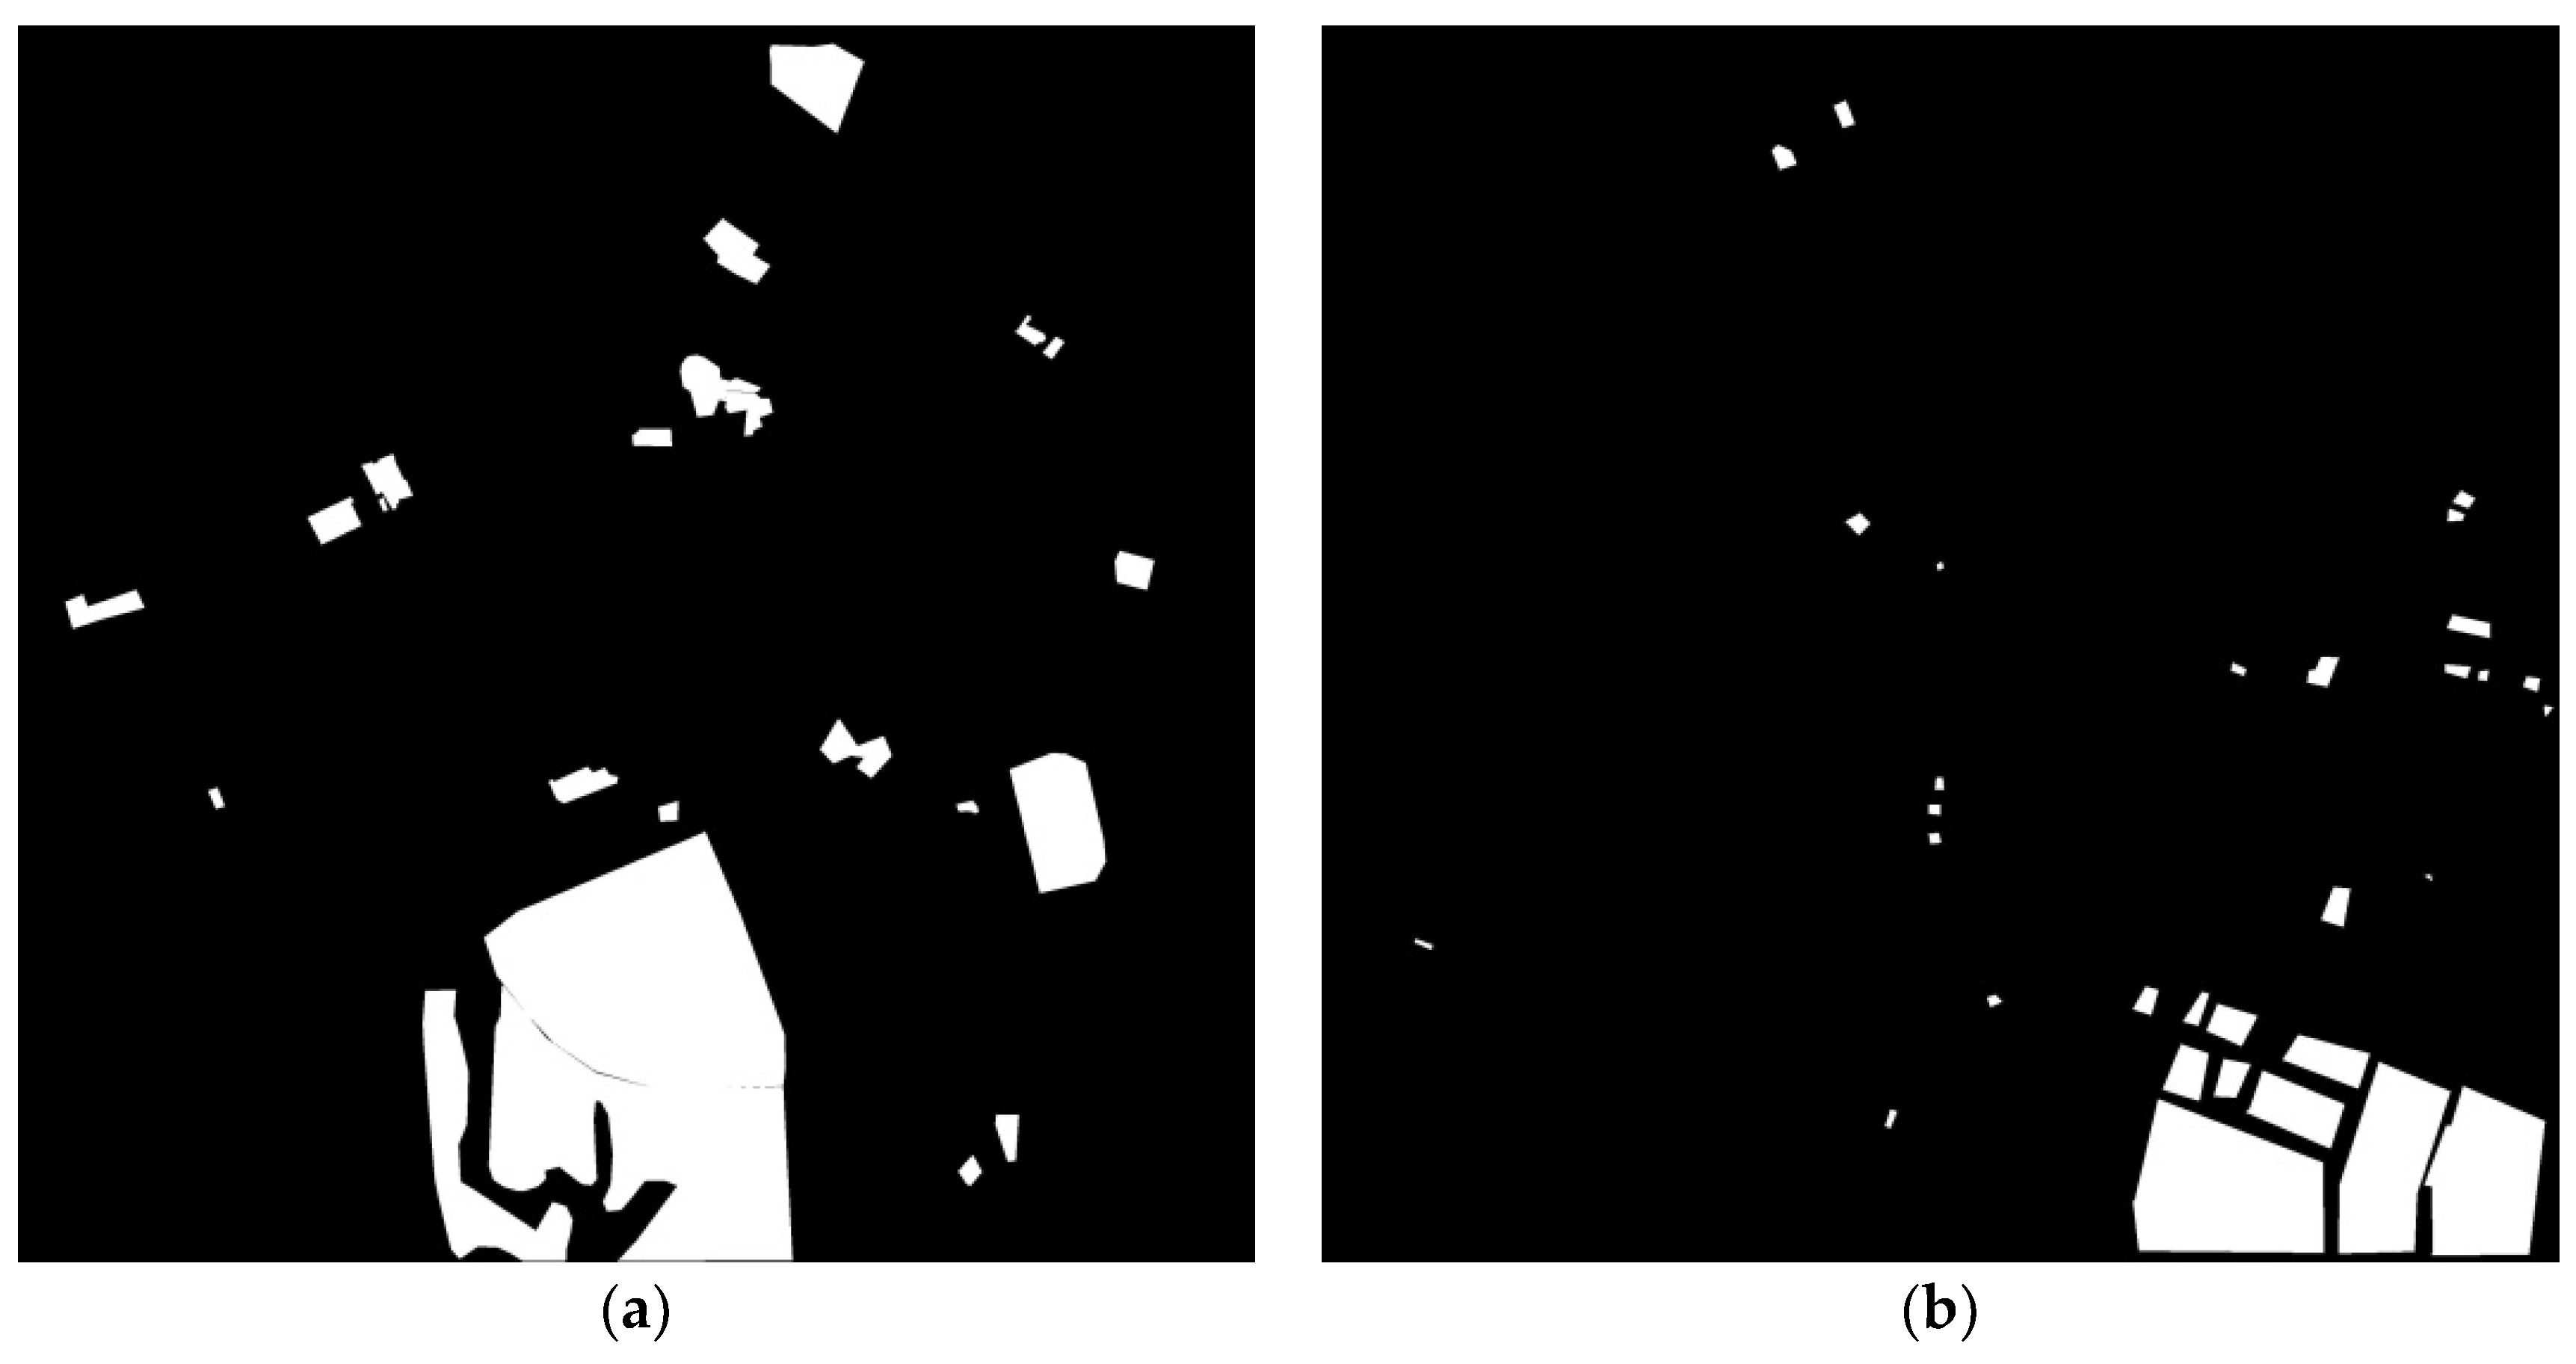
The images used in the experiments underwent data preprocessing, such as geometric and radiometric correction. Geometric correction matches the ground control points (GCPs) in images and removes errors due to misregistration [39]. The root mean square errors (RMSEs) of manual registration were approximately 0.965 (20 GCPs at Site 1) and 0.6934 (6 GCPs at Site 2). Moreover, histogram matching was performed for relative radiometric correction, although atmospheric correction should also be applied. To evaluate the accuracy of the proposed change detection method, we compared the proposed change detection results with the magnitude results derived using only pan-sharpened images and cross-sharpened images. The true ground data for the changed areas in the multitemporal images were produced and used for a quantitative accuracy assessment. Figure 3 shows the true ground image of each study area.
4.2. Experimental Results
4.2.1. Influence of the Cross-Sharpened Images Based on the Pan-Sharpening Algorithm on the Change Detection Results
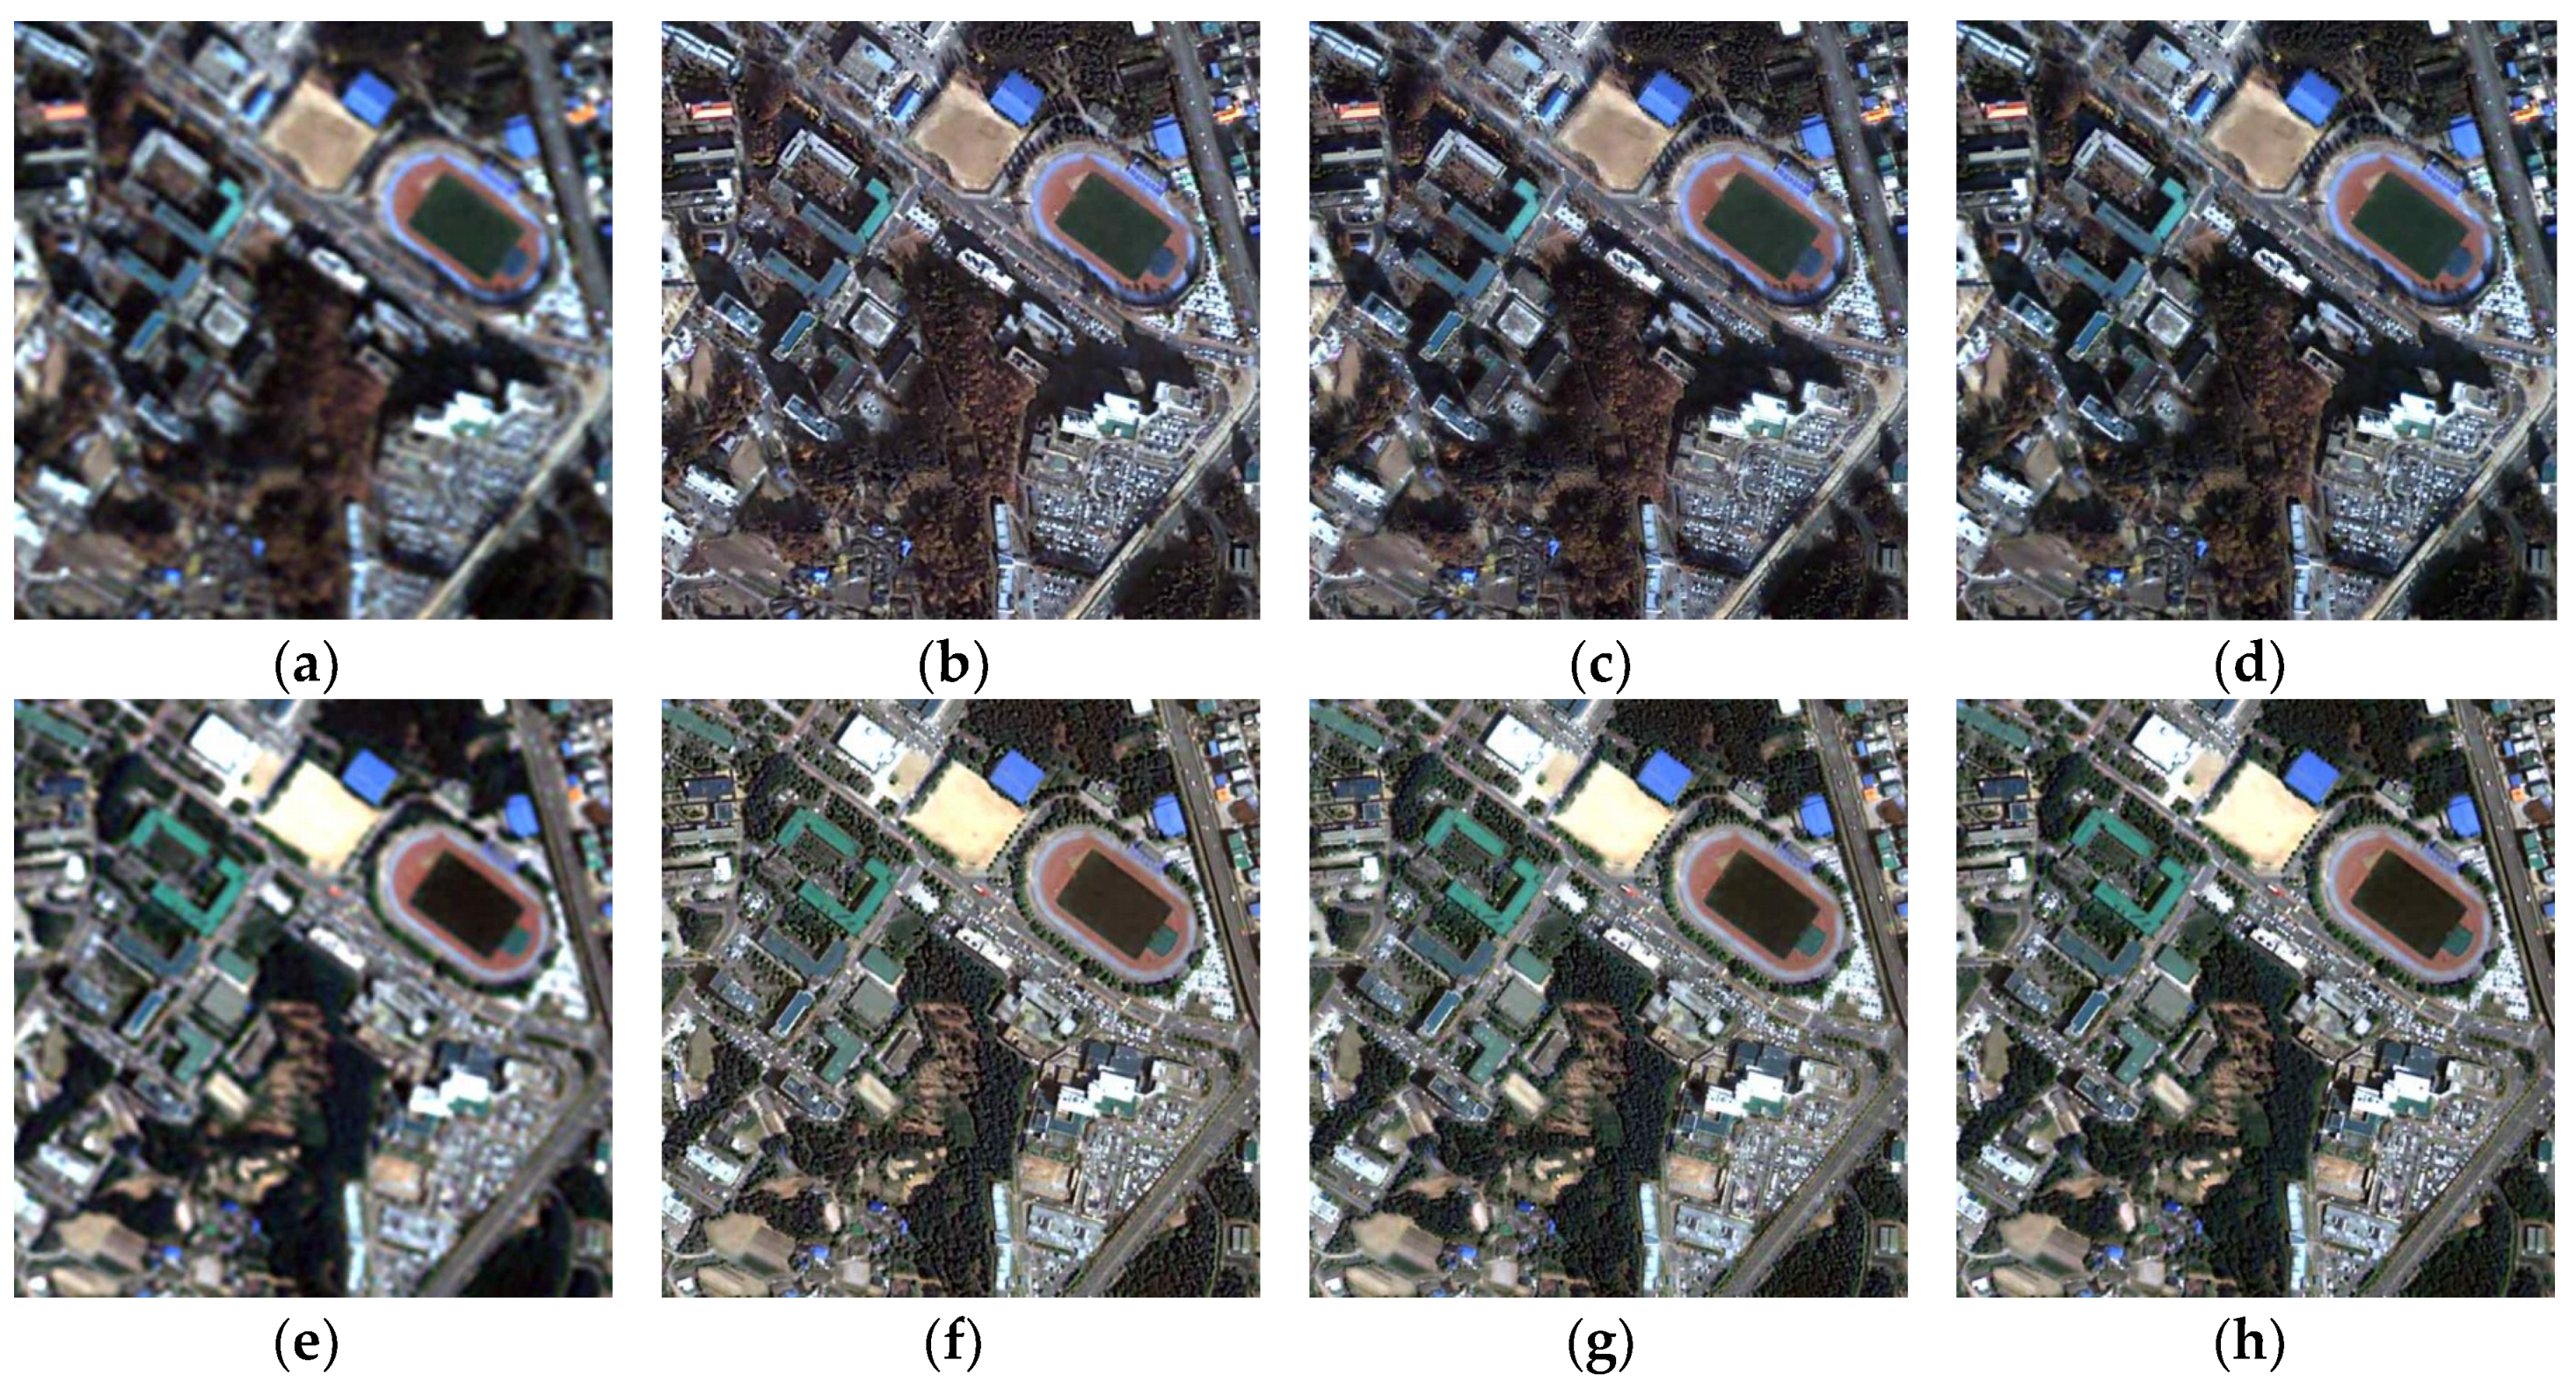
To select the algorithm for cross-sharpening, we applied representative CS- and MRA-based algorithms—the Gram-Schmidt (GS) adaptive (GSA) algorithm and GS2, an MRA-based GS algorithm—and a normalized difference vegetation index (NDVI)-based algorithm; these methods are known to provide effective pan-sharpening performance for KOMPSAT-2 satellite images [39,40,41]. The GSA algorithm was proposed by Aiazzi et al. [40]; it can produce high-frequency images using intensity images generated by multiple regression analysis. The injection gain is calculated by dividing the covariance by the variance. The GS2 algorithm calculates the injection gain in the same way as the GSA algorithm. However, whereas the GSA algorithm uses multispectral images, the GS2 algorithm uses low-spatial-resolution panchromatic images that are degraded via the application of an MTF filter as intensity images [41]. Choi et al. proposed the NDVI-based algorithm [42]. It provides high-accuracy spectral and spatial characteristics for the sharpening of KOMPSAT-2 satellite images. The main difference between existing sharpening algorithms and the NDVI-based algorithm is that the local injection gain is extracted from the NDVI to perform pan sharpening and decrease spectral distortion. We performed change detection using pan-sharpened and cross-sharpened multitemporal images and the NDVI-based algorithm. Then, we performed an accuracy evaluation to confirm the effect of the sharpening accuracy on change detection. To quantitatively evaluate the quality of the pan-sharpened image, the erreur relative global adimensionnelle de synthese (ERGAS), SAM, and universal image quality index (UIQI) evaluation indexes were used. The ERGAS index compares the spectral characteristics of a band based on the sharpening result and the original image, and it is calculated as shown in Equation (11) [43,44].
where is the spatial resolution of the sharpened image, is the spatial resolution of the multispectral image, K is the number of bands in the sharpened image is the average value of the th band, and the RMSE is defined according to Equation (12):
where M × N is the image size; is the pixel value of the sharpened image and is the pixel value of the original multispectral image. Therefore, indicates the RMSE between the th band of and . Low ERGAS values correspond to small amounts of spectral distortion.
The SAM index is obtained by calculating the pixel-by-pixel vector between the sharpening result and the original image, as given by Equation (13) [45,46].
where is the spectral pixel vector of the original multispectral band and is the pixel vector of the sharpened band. When the SAM value equals 0, spectral distortion is minimized.
The UIQI evaluates the similarity between the sharpening result and the original image. The evaluation terms include the correlation, radiometric distortion, and contrast distortion [47,48,49]. The UIQI is calculated using Equation (14):
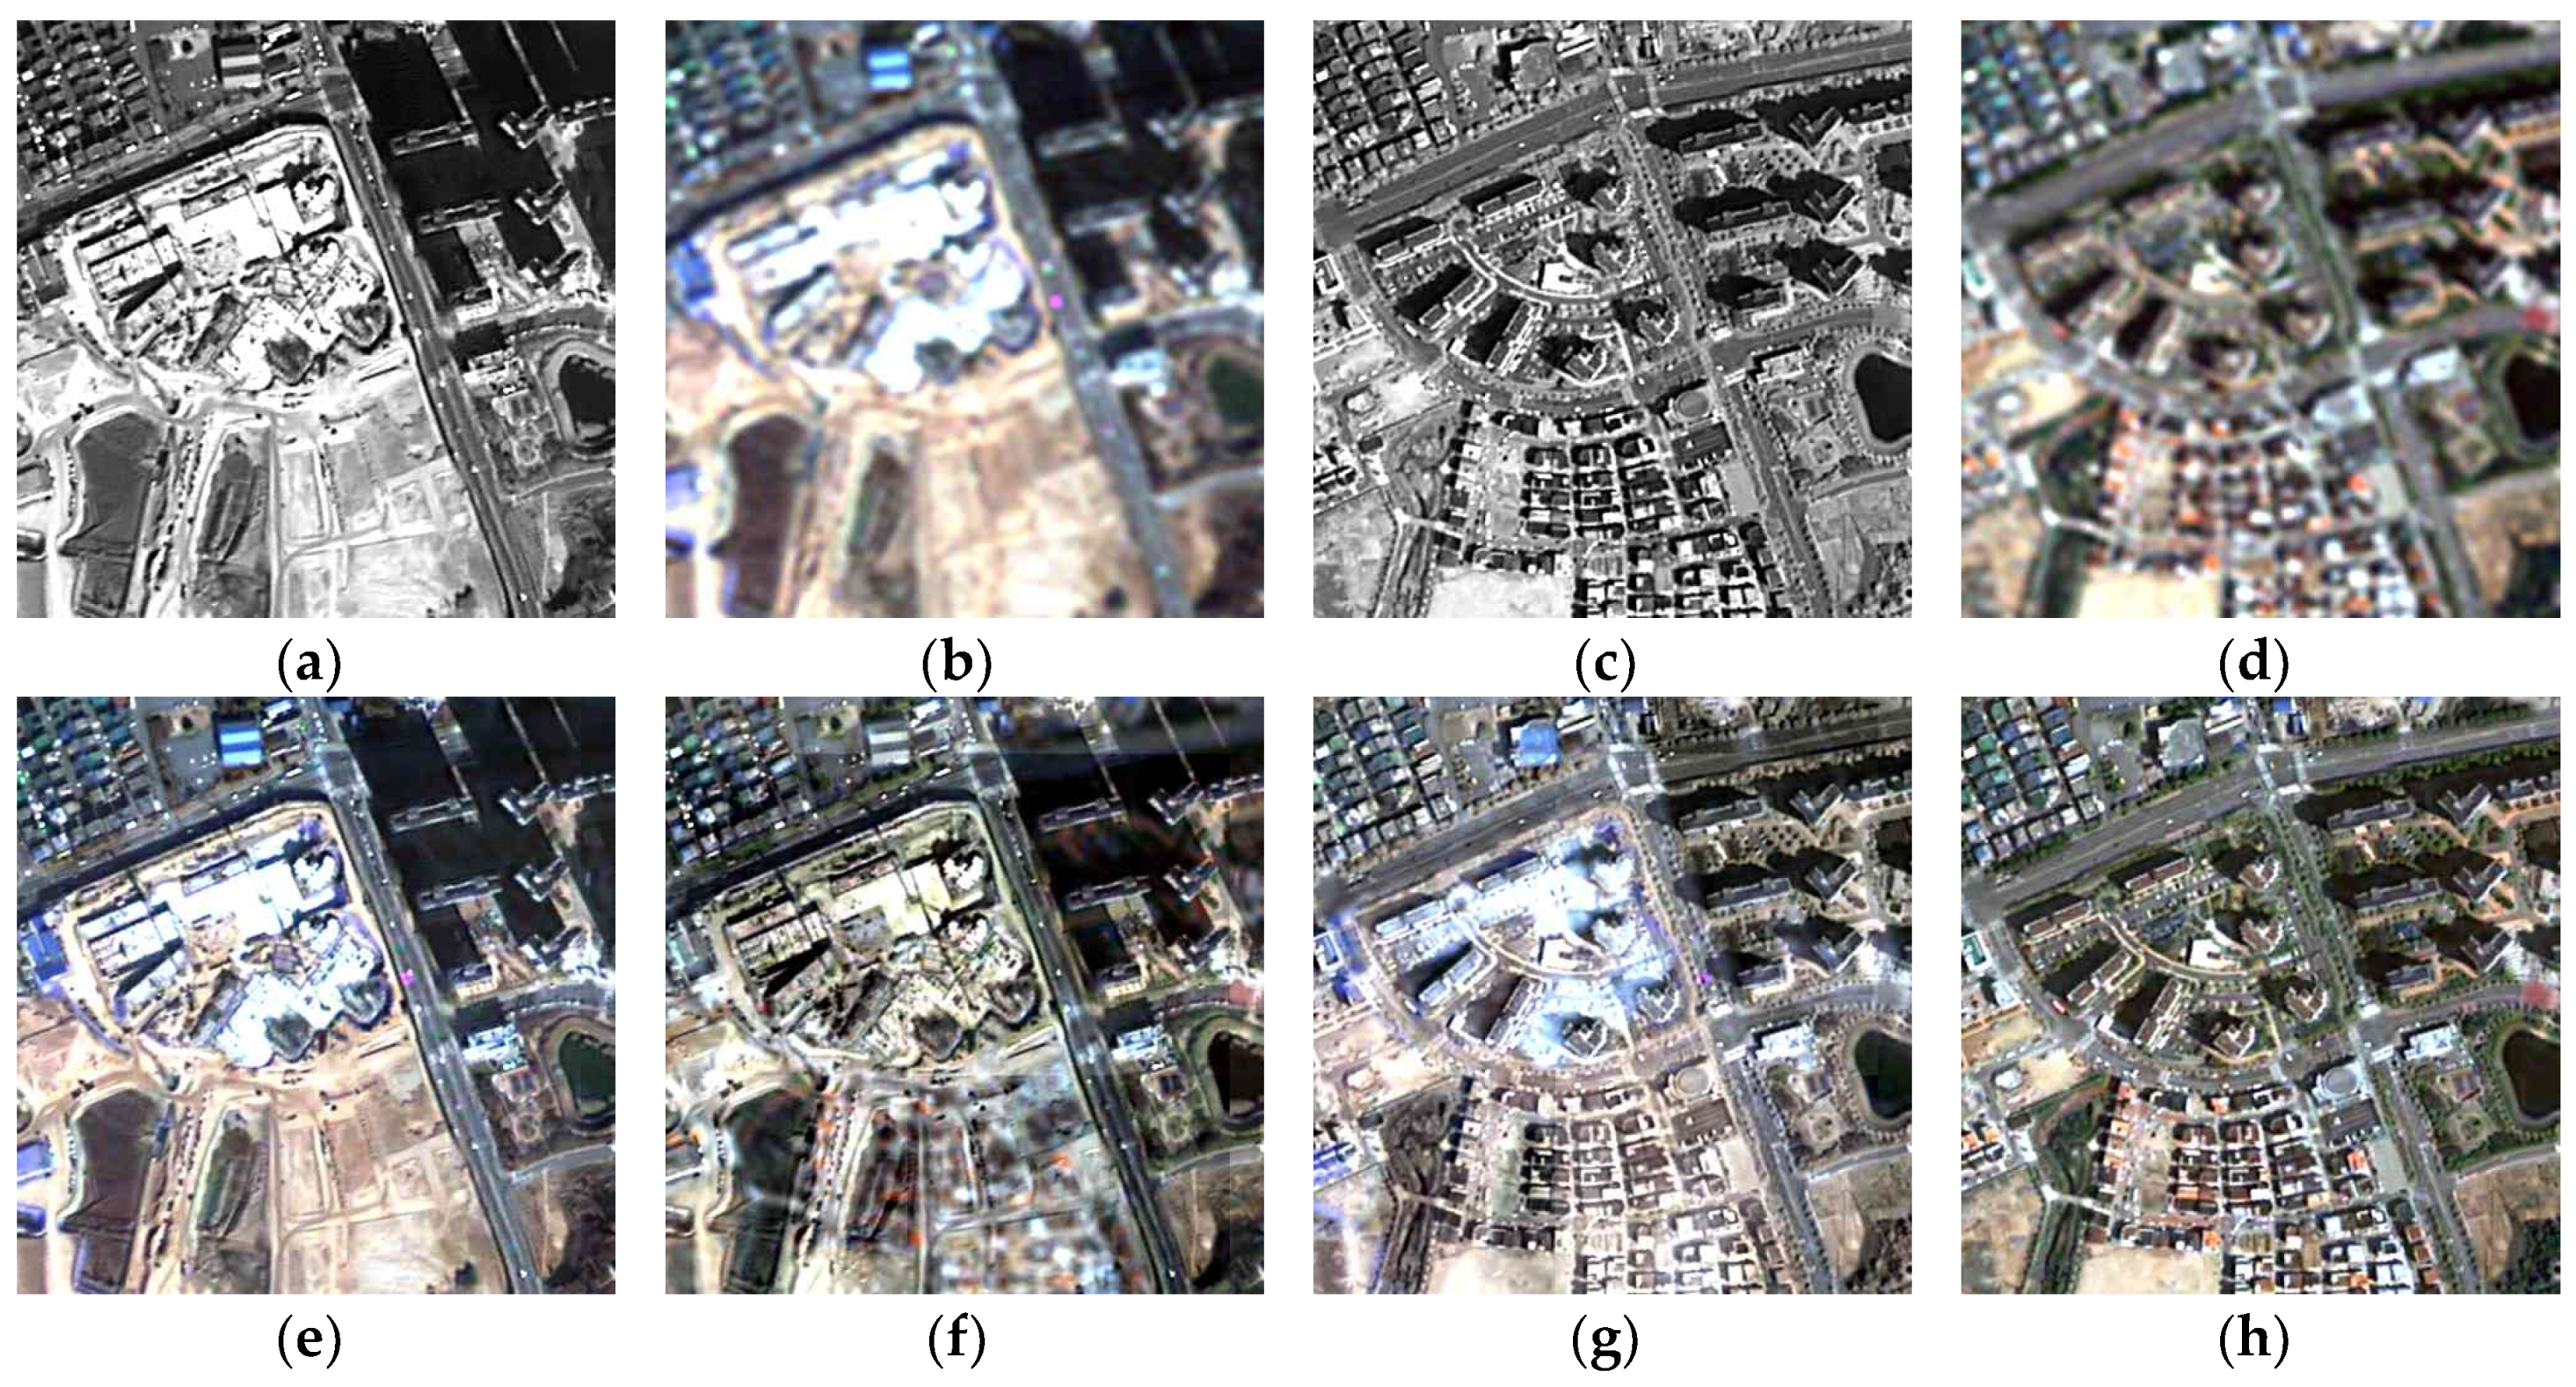
where x and y are the original and sharpened images, respectively; is the covariance between x and y; and and are the variance of x and y, respectively. The smaller the values of ERGAS and SAM are, the smaller the spectral distortion. In the case of UIQI, the closer the value is to 1, the lower the spectral distortion. Figure 4 shows the images obtained by applying these algorithms, and Table 3 shows the accuracy evaluation results for the pan-sharpened images.
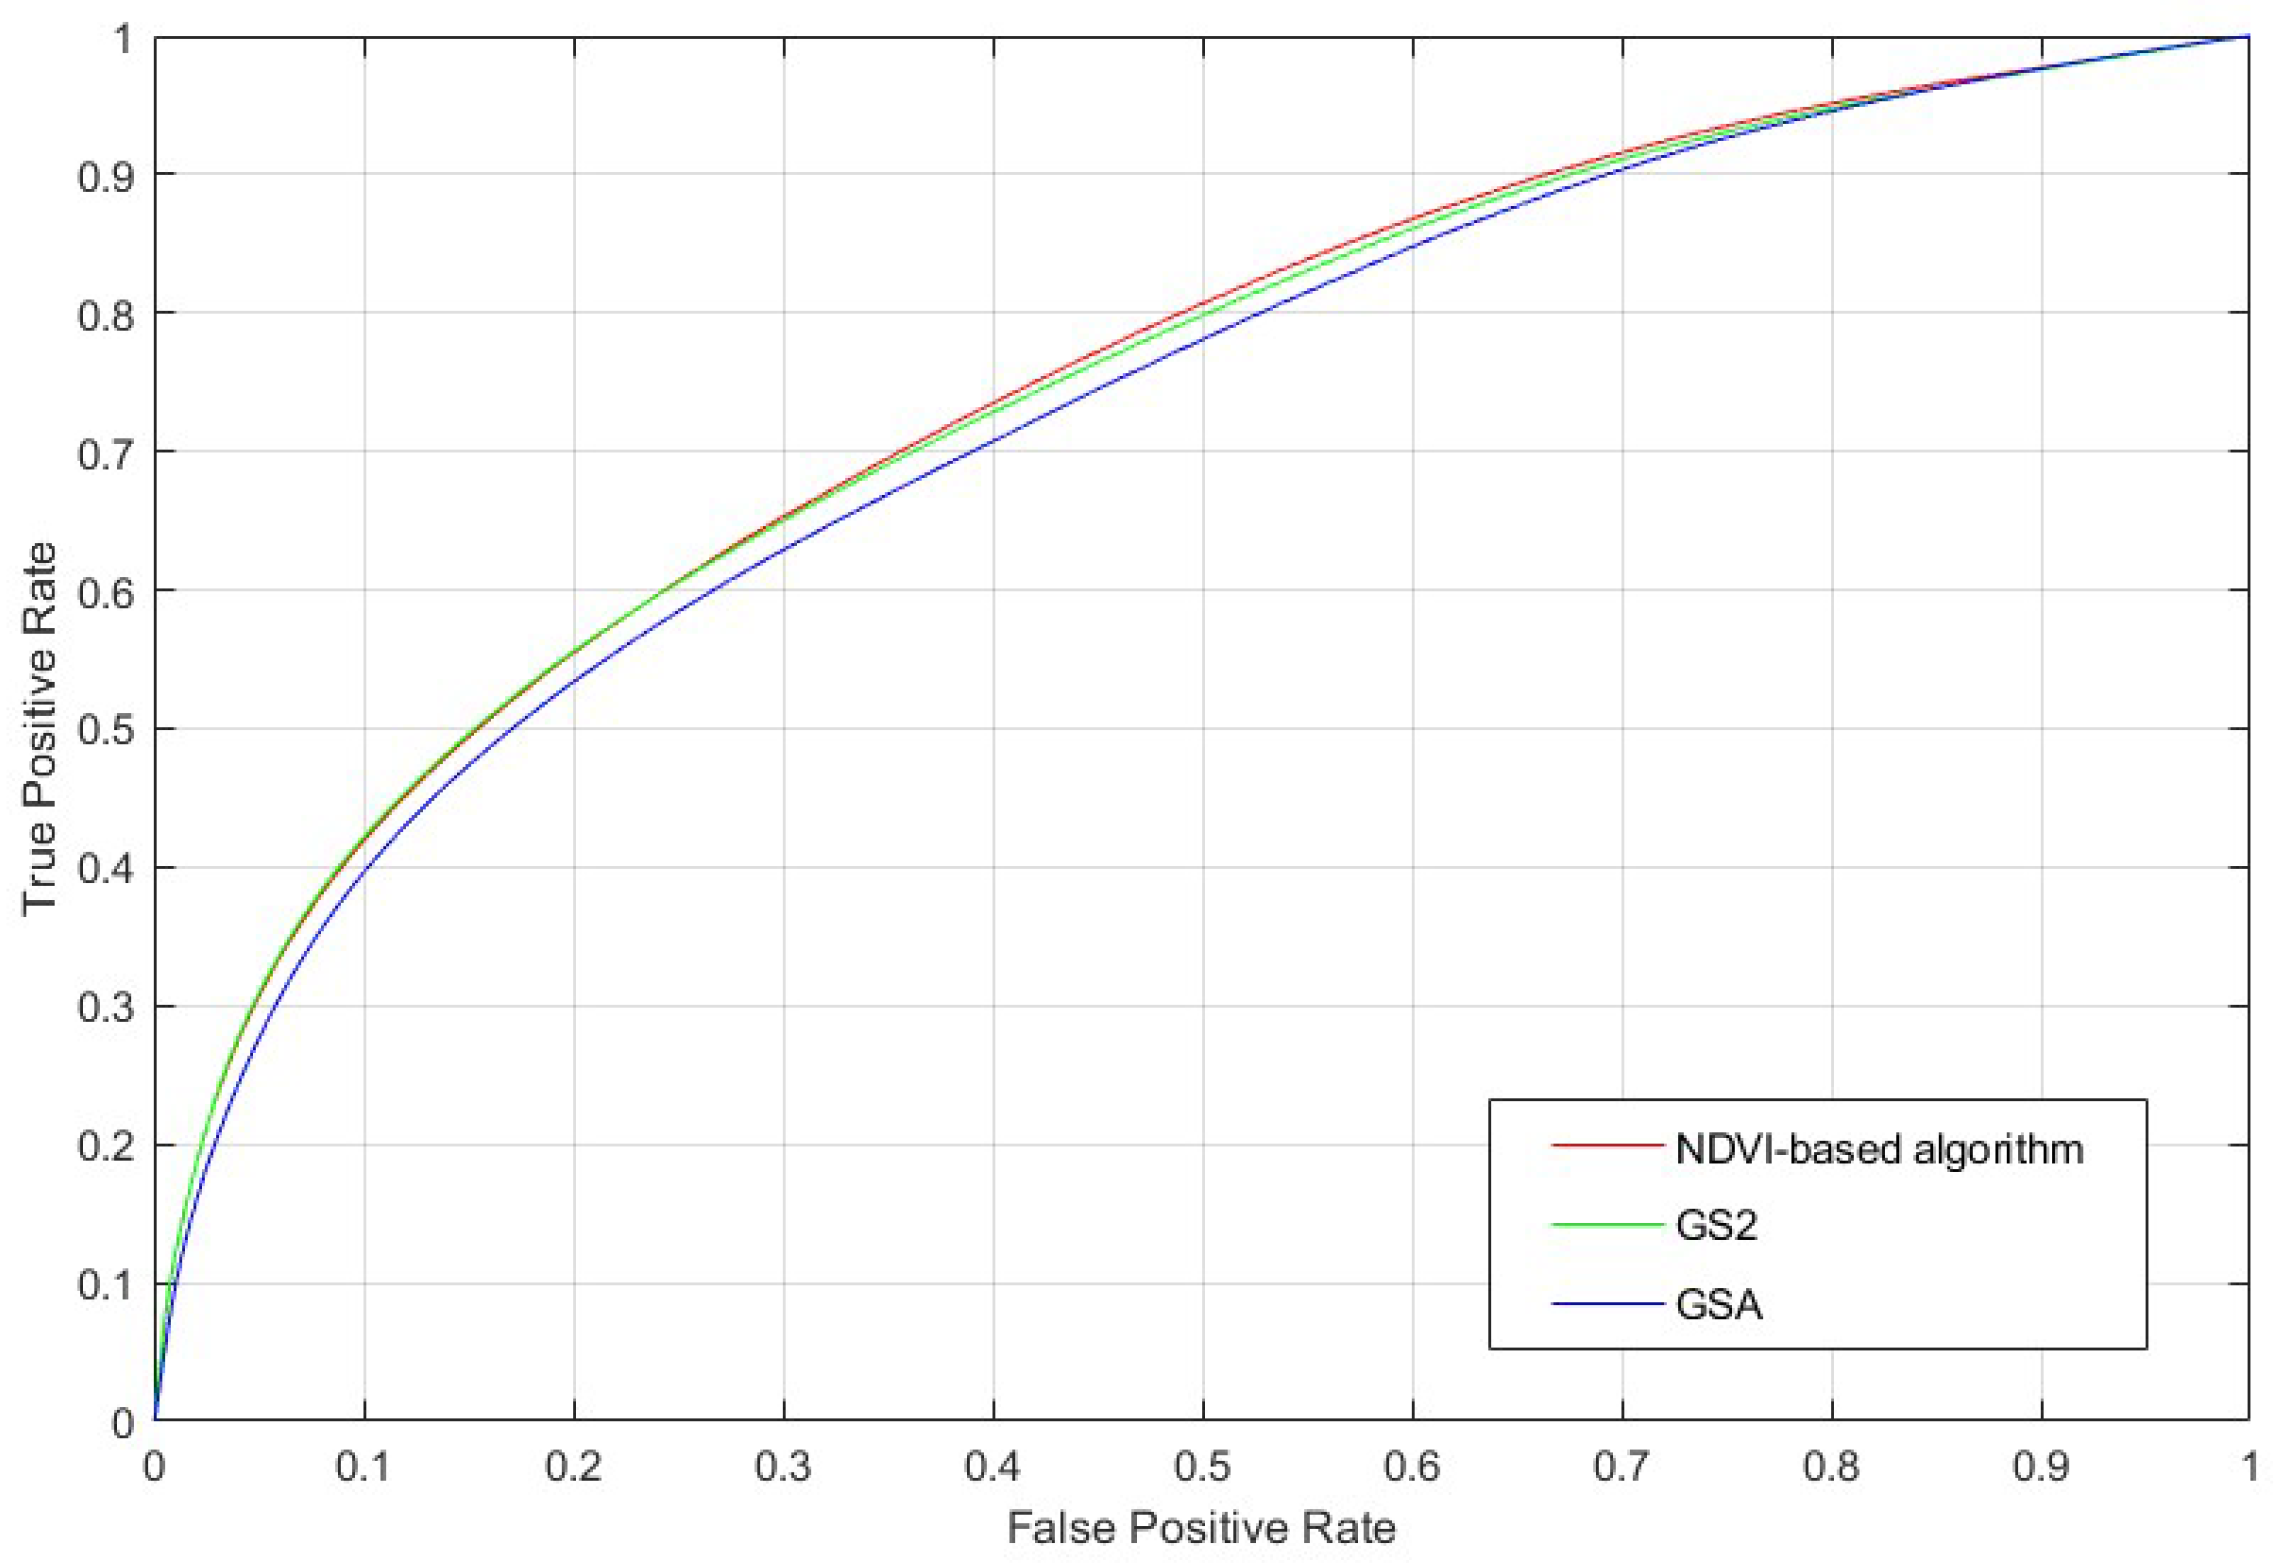
As shown in Table 3, the pan-sharpening results obtained using GSA exhibited the highest ERGAS and SAM values and the lowest UIQI values. These evaluation results indicate that spectral distortion occurred most frequently in the GSA algorithm and that the accuracies of the GS2- and NDVI-based algorithms were similar. Next, we analyzed how the quality of fusion images affected the change detection results. Change detection was performed using the pan-sharpened images obtained using each pan-sharpening algorithm, and then, the change detection performance was evaluated by calculating the receiver operating characteristic (ROC) curve and area under the curve (AUC) using reference data. The ROC curve, one of the indexes used to evaluate change detection performance, is a graphical representation of the detection and false alarm rates that occur when the threshold value is applied to the magnitude and converted to a binary image [50]. The AUC is calculated by integrating the area under the ROC curve. Generally, the larger the AUC value is, the better the change detection performance. Figure 5 and Table 4 show the ROC curve and AUC calculation results, respectively.
The evaluation of the change detection accuracy showed that the best image sharpening performance was obtained using the GS2 and NDVI-based algorithms, and the poorest performance was displayed by the GSA algorithm. Thus, the sharpening accuracy was considered to affect the change detection performance. In this study, cross-sharpening was performed using the NDVI-based algorithm, which displayed the best change detection performance. Although the other pan-sharpening algorithms can still be used for change detection, we chose the NDVI-based pan-sharpening algorithm for generating cross-sharpened images in change detection.
4.2.2. Accuracy Estimation of the Change Detection Results from Cross-Sharpened Images
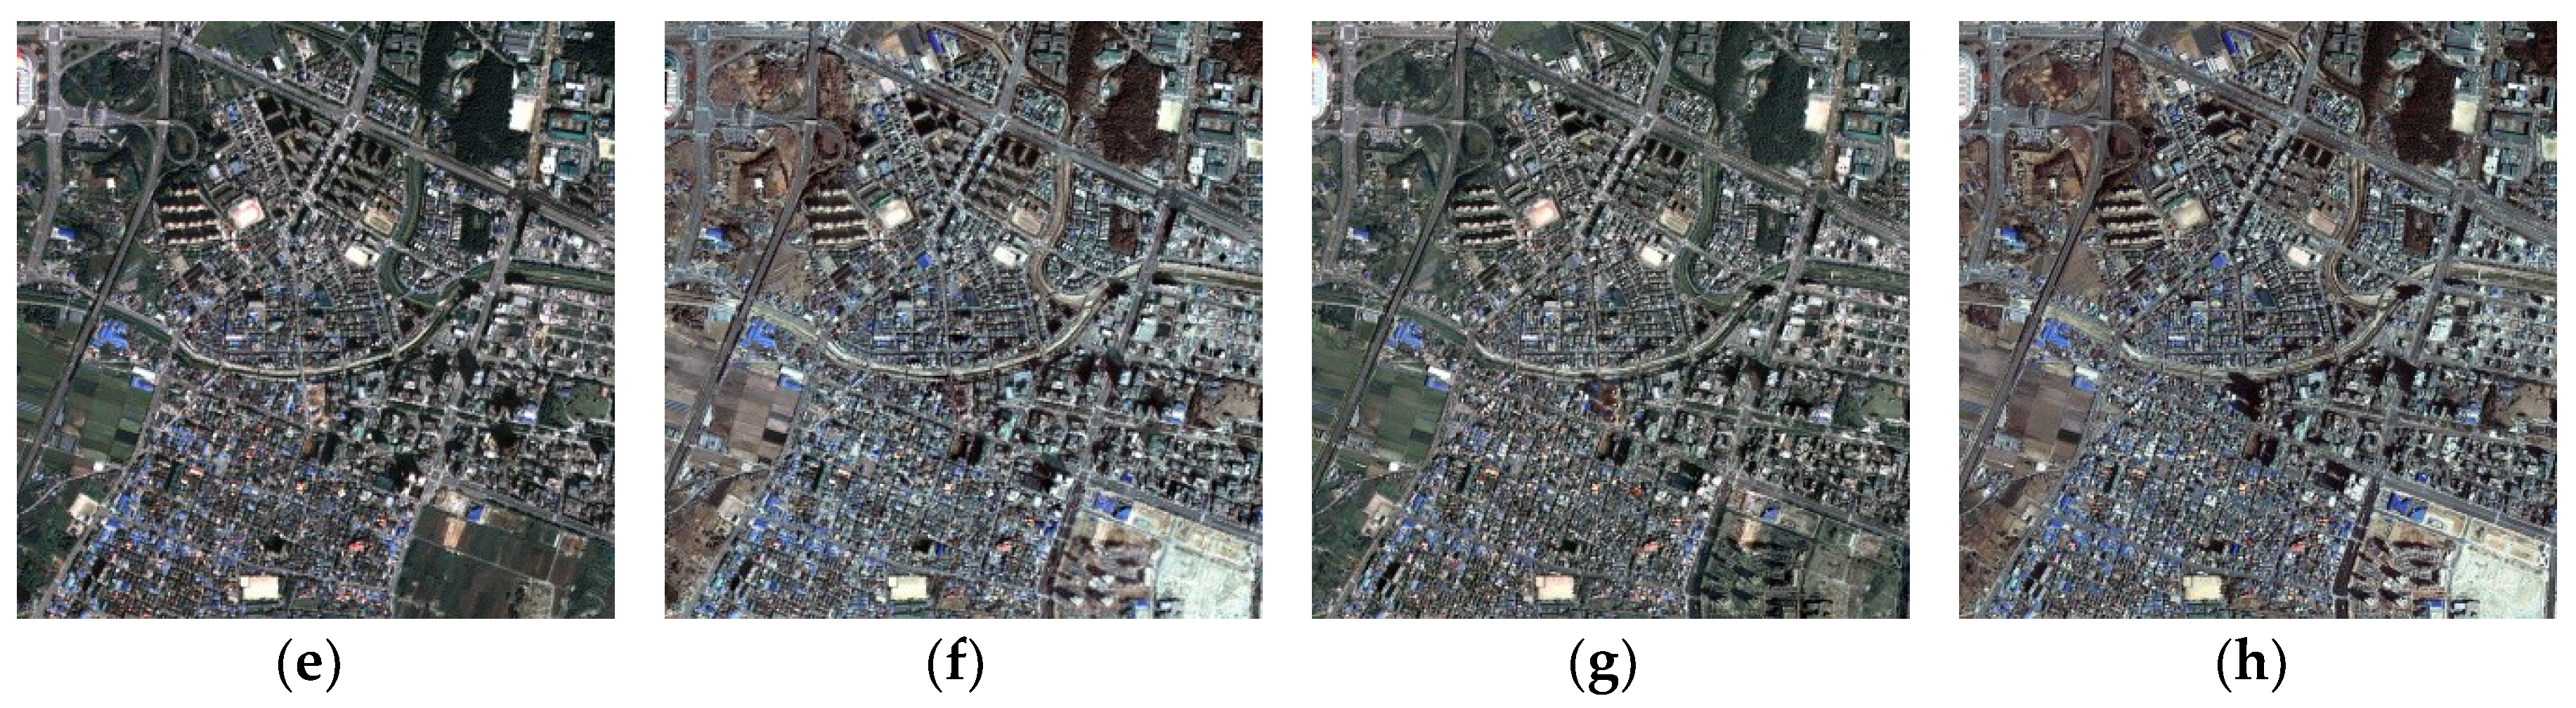
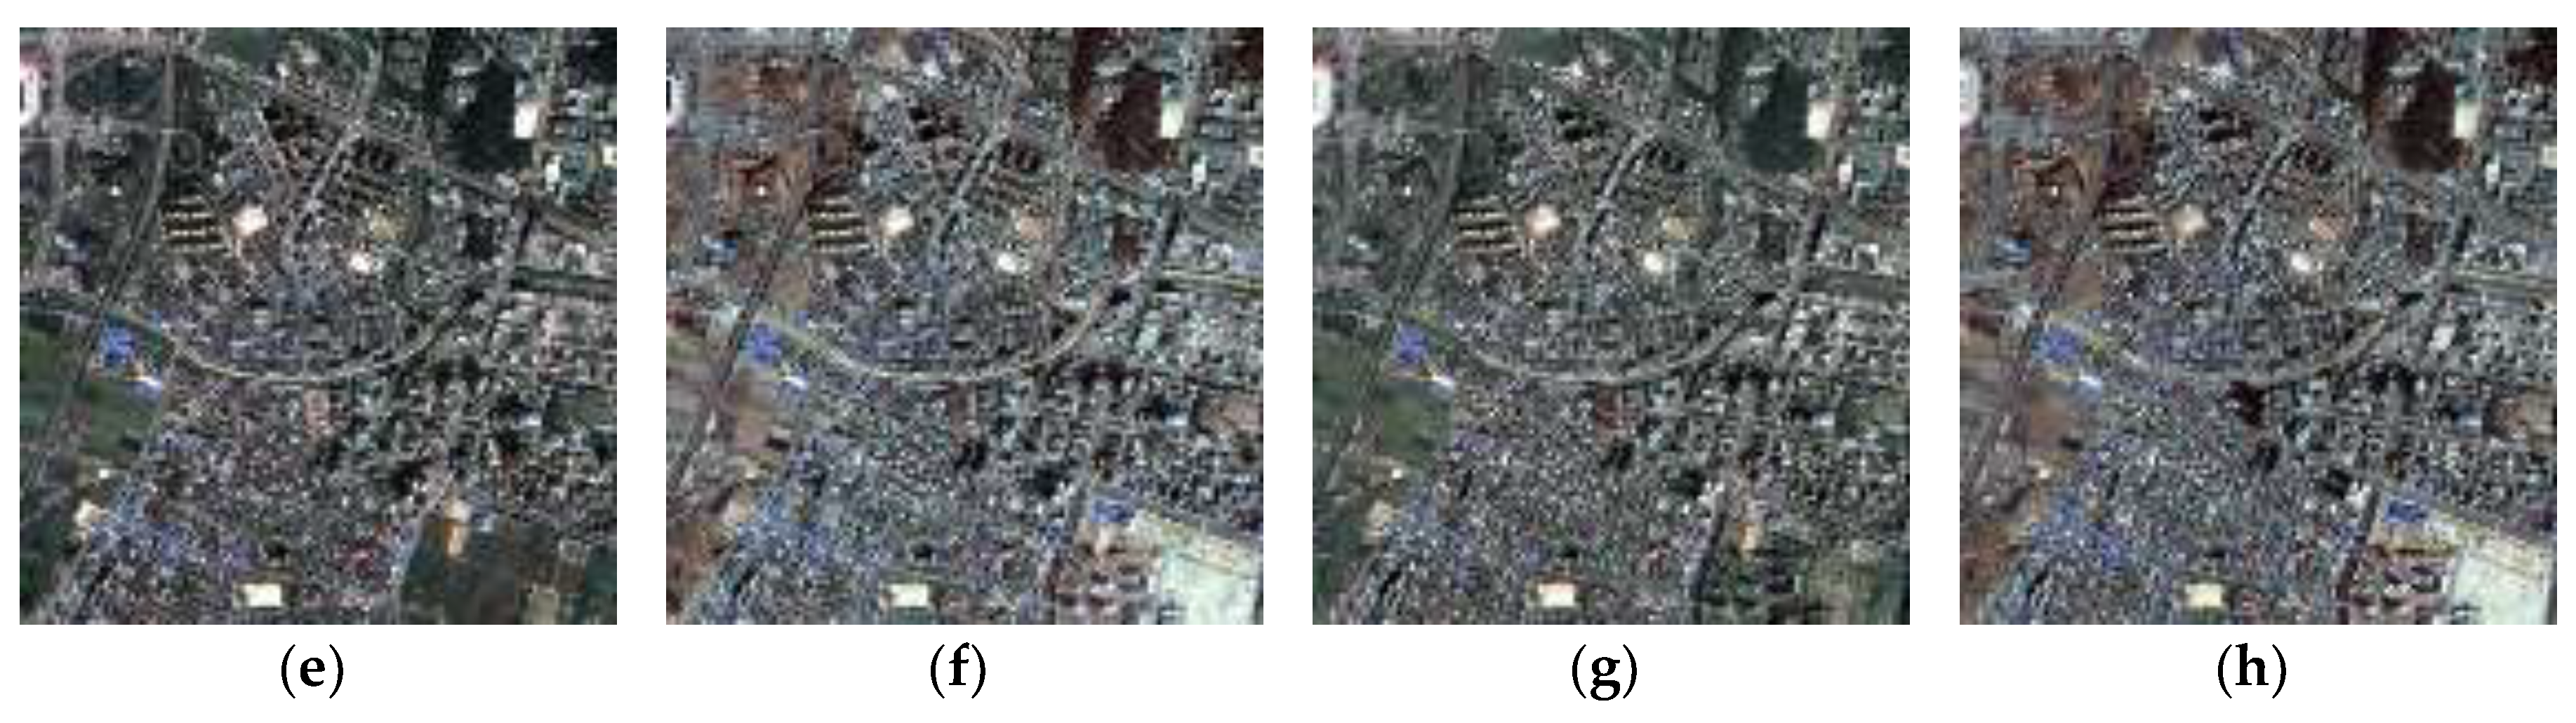
To evaluate the proposed change detection method, pan-sharpening and cross-sharpening methods were applied using satellite imagery of the two study sites. NDVI-based sharpening, which yielded the highest AUC value in Table 2, was used in this process. Using NDVI-based pan-sharpening, , and were generated for each study area. Figure 6 and Figure 7 show the pan-sharpening results.
and , the pan-sharpening results at each study site, effectively reflect the spatial and spectral characteristics of the original imagery. However, as shown in Figure 7, some objects, such as buildings, were incorrectly matched when only pan-sharpened images were used. This issue occurred because the geometric characteristics of the images before and after the change did not match. In this manuscript, we performed image-to-image geometric correction to match the geometries of the images before and after the change. However, perfectly matching the geometrical characteristics of high-spatial-resolution satellite images with features such as shadows is difficult due to differences in off-nadir angles or acquisition times of multitemporal images. and , the cross-sharpening results, show that spatial and spectral distortion occurred compared to the pan-sharpening results. In the case of , by using the panchromatic image of time and multispectral image of time , the spatial characteristics of time . can be observed; however, the spectral characteristics are based on time . In addition, reflects the spectral characteristics of time and spatial characteristics of time . As shown in Figure 7a,b and Figure 8e,f, because and are sharpened by the same panchromatic image, , some areas with spatial dissimilarity, such as shadows and buildings, have similar spatial characteristics. Moreover, regions with different spectral information due to land cover changes and seasonal variations in vegetated areas display distorted spectral information, but spatial characteristics are maintained in these areas. Therefore, it is possible to remove spatial heterogeneity and perform change detection using and . This property is the same for and , as shown in Figure 7e,f and Figure 8g,h. To apply S2CVA, multitemporal images used for change detection should have the same geometrical characteristics. Therefore, in this manuscript, , which is the stacked image of and , was used as the reference image before the change, and was used as the target image after the change. Figure 8 shows the results of applying the S2CVA method to the stacked image.
Figure 8a,b,e,f shows the change detection results obtained using only pan-sharpened images, and , and the results exhibit a similar trend. As shown in Figure 8a,e, the magnitude information for change detection effectively confirmed the shapes of changed objects by effectively reflecting the spatial characteristics. The direction information obtained using only the pan-sharpened images (Figure 8b,f) showed low values for shadows caused by high buildings, such as apartments, and high values in some changed areas, such as soil areas. Compared to the above results, the magnitude information (Figure 8c,g) obtained using cross-sharpened images showed a similar trend, but the trends of direction information differed. The direction values of the vegetation areas were generally low at Site 1, whereas they were mostly high in areas excluding vegetation. At Site 2, the vegetation areas displayed high direction values, whereas other unchanged areas, such as soil and building areas, exhibited low values. Figure 9 shows the detailed S2CVA results.
As demonstrated by the magnitude information of unchanged regions obtained using the cross-sharpened images, as shown in Figure 9e,k, it was difficult to identify the detailed spatial forms of objects due to a blurring effect. However, false alarms that occurred at the edges were reduced, and the results effectively reflect the trends of changed and unchanged areas. In addition, the changed area in Figure 9e has significantly higher values than the unchanged area in Figure 9c. However, as shown in Figure 9k, in the magnitude information obtained using cross-sharpened images, some unchanged areas where the spectral characteristics were distorted by seasonal variations and the spectral differences of building roofs were considered changed even though these areas had not actually changed. To improve the change detection performance by removing such false alarms, direction information is used with cross-sharpened images. As shown in Figure 9c,e, some vegetation, paddy, and soil areas where false alarms occurred had low direction values, whereas shadow areas had low direction values only in the pan-sharpened image. Therefore, some unchanged areas with high magnitude values were correctly classified using direction information because among areas with very high magnitudes, areas influenced by seasonal effects or vegetation growth were recognized as false alarms based on spectral distortion in the cross-sharpening images. In these regions, the overall pixel profile is not significantly different, and therefore, the values are relatively low in the direction image. Of course, even in the changed area, the pattern of the profile is similar, and areas where only DN values change may be observed; however, these areas may have a very high magnitude difference and therefore remain changed areas. To integrate the magnitude and direction information for unsupervised change detection, the direction information was linearly transformed from 0 to 1 using the CDF, and the probabilities of change detection for unchanged vegetation, paddy, and soil areas were reduced by multiplication with magnitude information. Figure 10 shows the change detection results of the final magnitude information with the linearly transformed direction information obtained using cross-sharpened images compared to the traditional magnitude information of S2CVA based on pan-sharpened images.
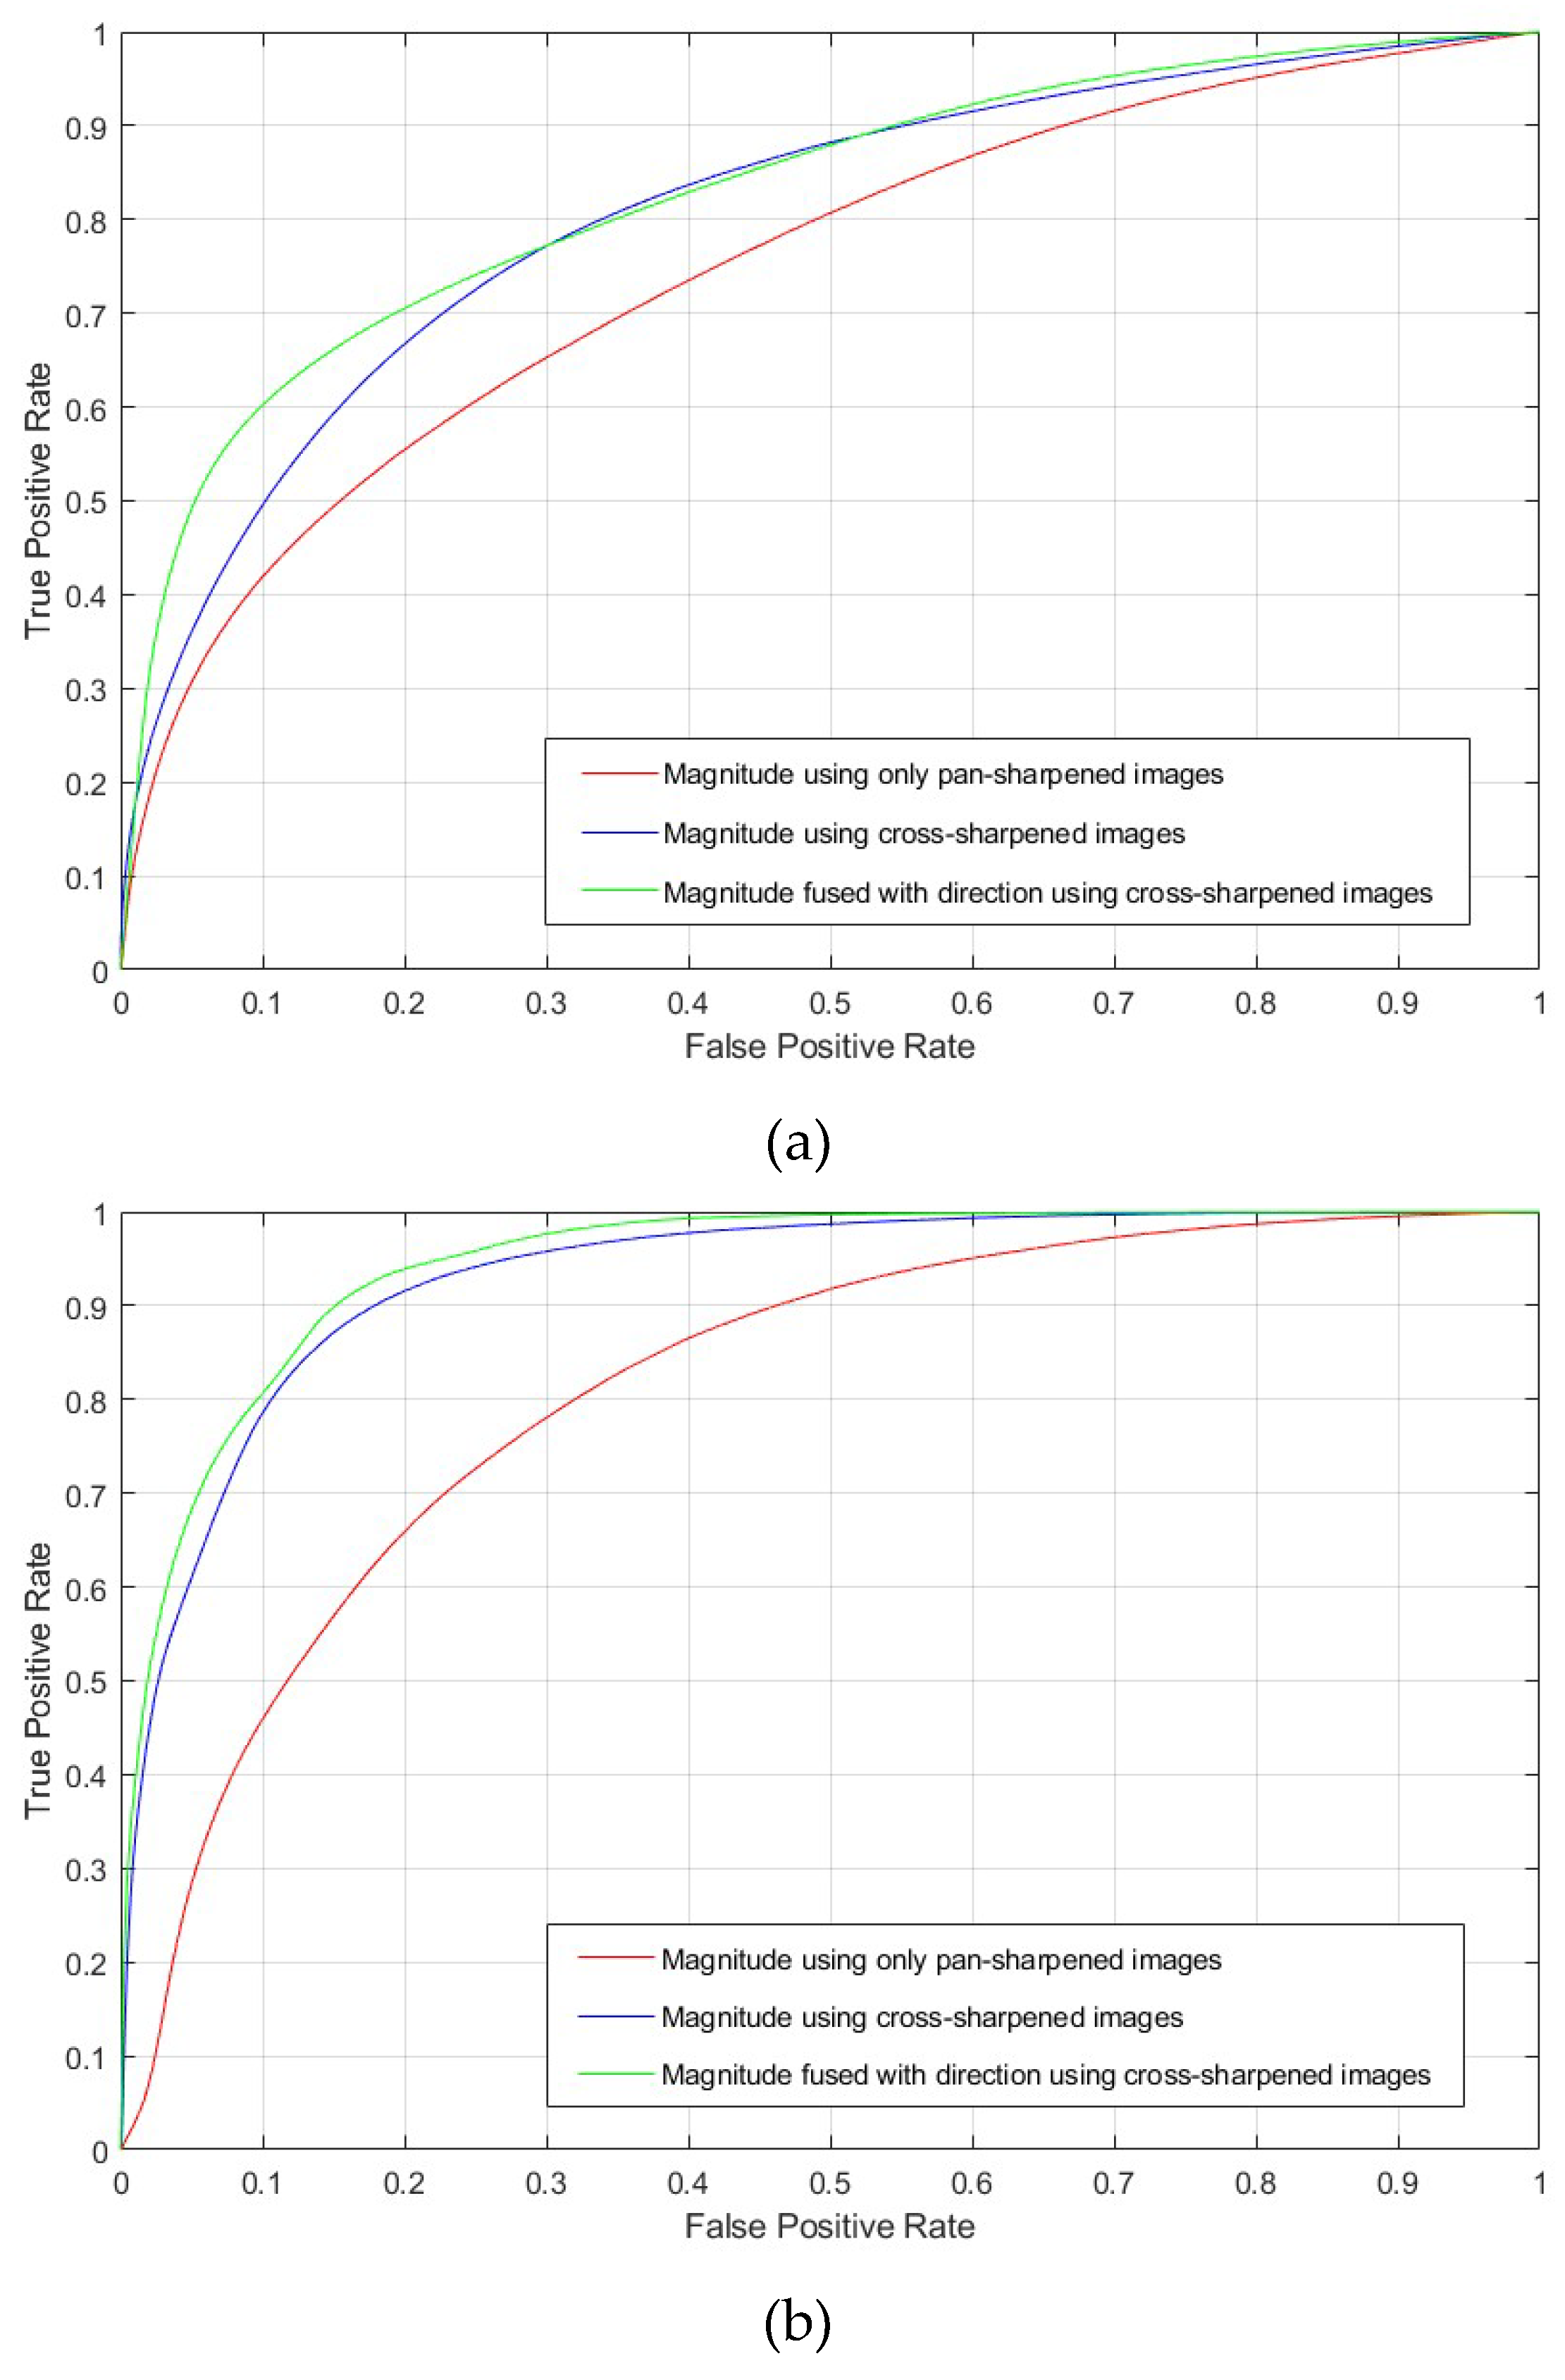
As shown in Figure 10c,d, the magnitude values of unchanged vegetation and complex urban areas decreased compared to those in Figure 10a,d. However, the change area displays high magnitude values. Therefore, false alarms that occur when performing change detection using the magnitude information of traditional S2CVA can be effectively reduced using the proposed technique. To evaluate the quantitative accuracy of the proposed change detection method, we compared the proposed magnitude information results obtained using cross-sharpened images with those obtained using only pan-sharpened images. Figure 11 and Table 5 show the ROC curve and AUC results according to the magnitude information based on ground truth data.
Table 5 shows the change detection accuracy results for Sites 1 and 2; the magnitude information obtained using cross-sharpened images reflects higher AUC values of 0.8070 and 0.9342 for the two sites compared to the AUC values for the magnitude information obtained using only pan-sharpened images. This result suggests that the magnitude information obtained using cross-sharpened images can be used to more efficiently extract the changed area than can that obtained using pan-sharpened images. In addition, the final magnitude information obtained by integration with direction information displayed the highest AUC values of 0.8272 and 0.9456 for the two sites. Specifically, the high AUC value for Site 2 is attributed to the fact that the magnitude information value of the unchanged urban area was efficiently decreased by integrating the direction information. Therefore, the experimental results indicated that the integration of the magnitude and direction information obtained using cross-sharpened images effectively reduced regions where false alarms were caused by seasonal influences and spectral dissimilarity. To verify the performance of the proposed change detection method, binary images were generated using thresholds. In the case of optimal threshold selection, the Youden index based on the ROC curve was selected. The Youden index uses the maximum vertical distance of the ROC curve [51]. Thus, the optimal threshold obtained using the Youden index is defined as a threshold value to maximize the difference between the detection and false alarm rates [52]. The confusion matrix was calculated using the ground truth data. Figure 12 shows a binary image that was generated by applying a threshold to the change detection results obtained using the existing method and the proposed method, and Table 6 and Table 7 show the results of calculating the confusion matrix using ground truth data.
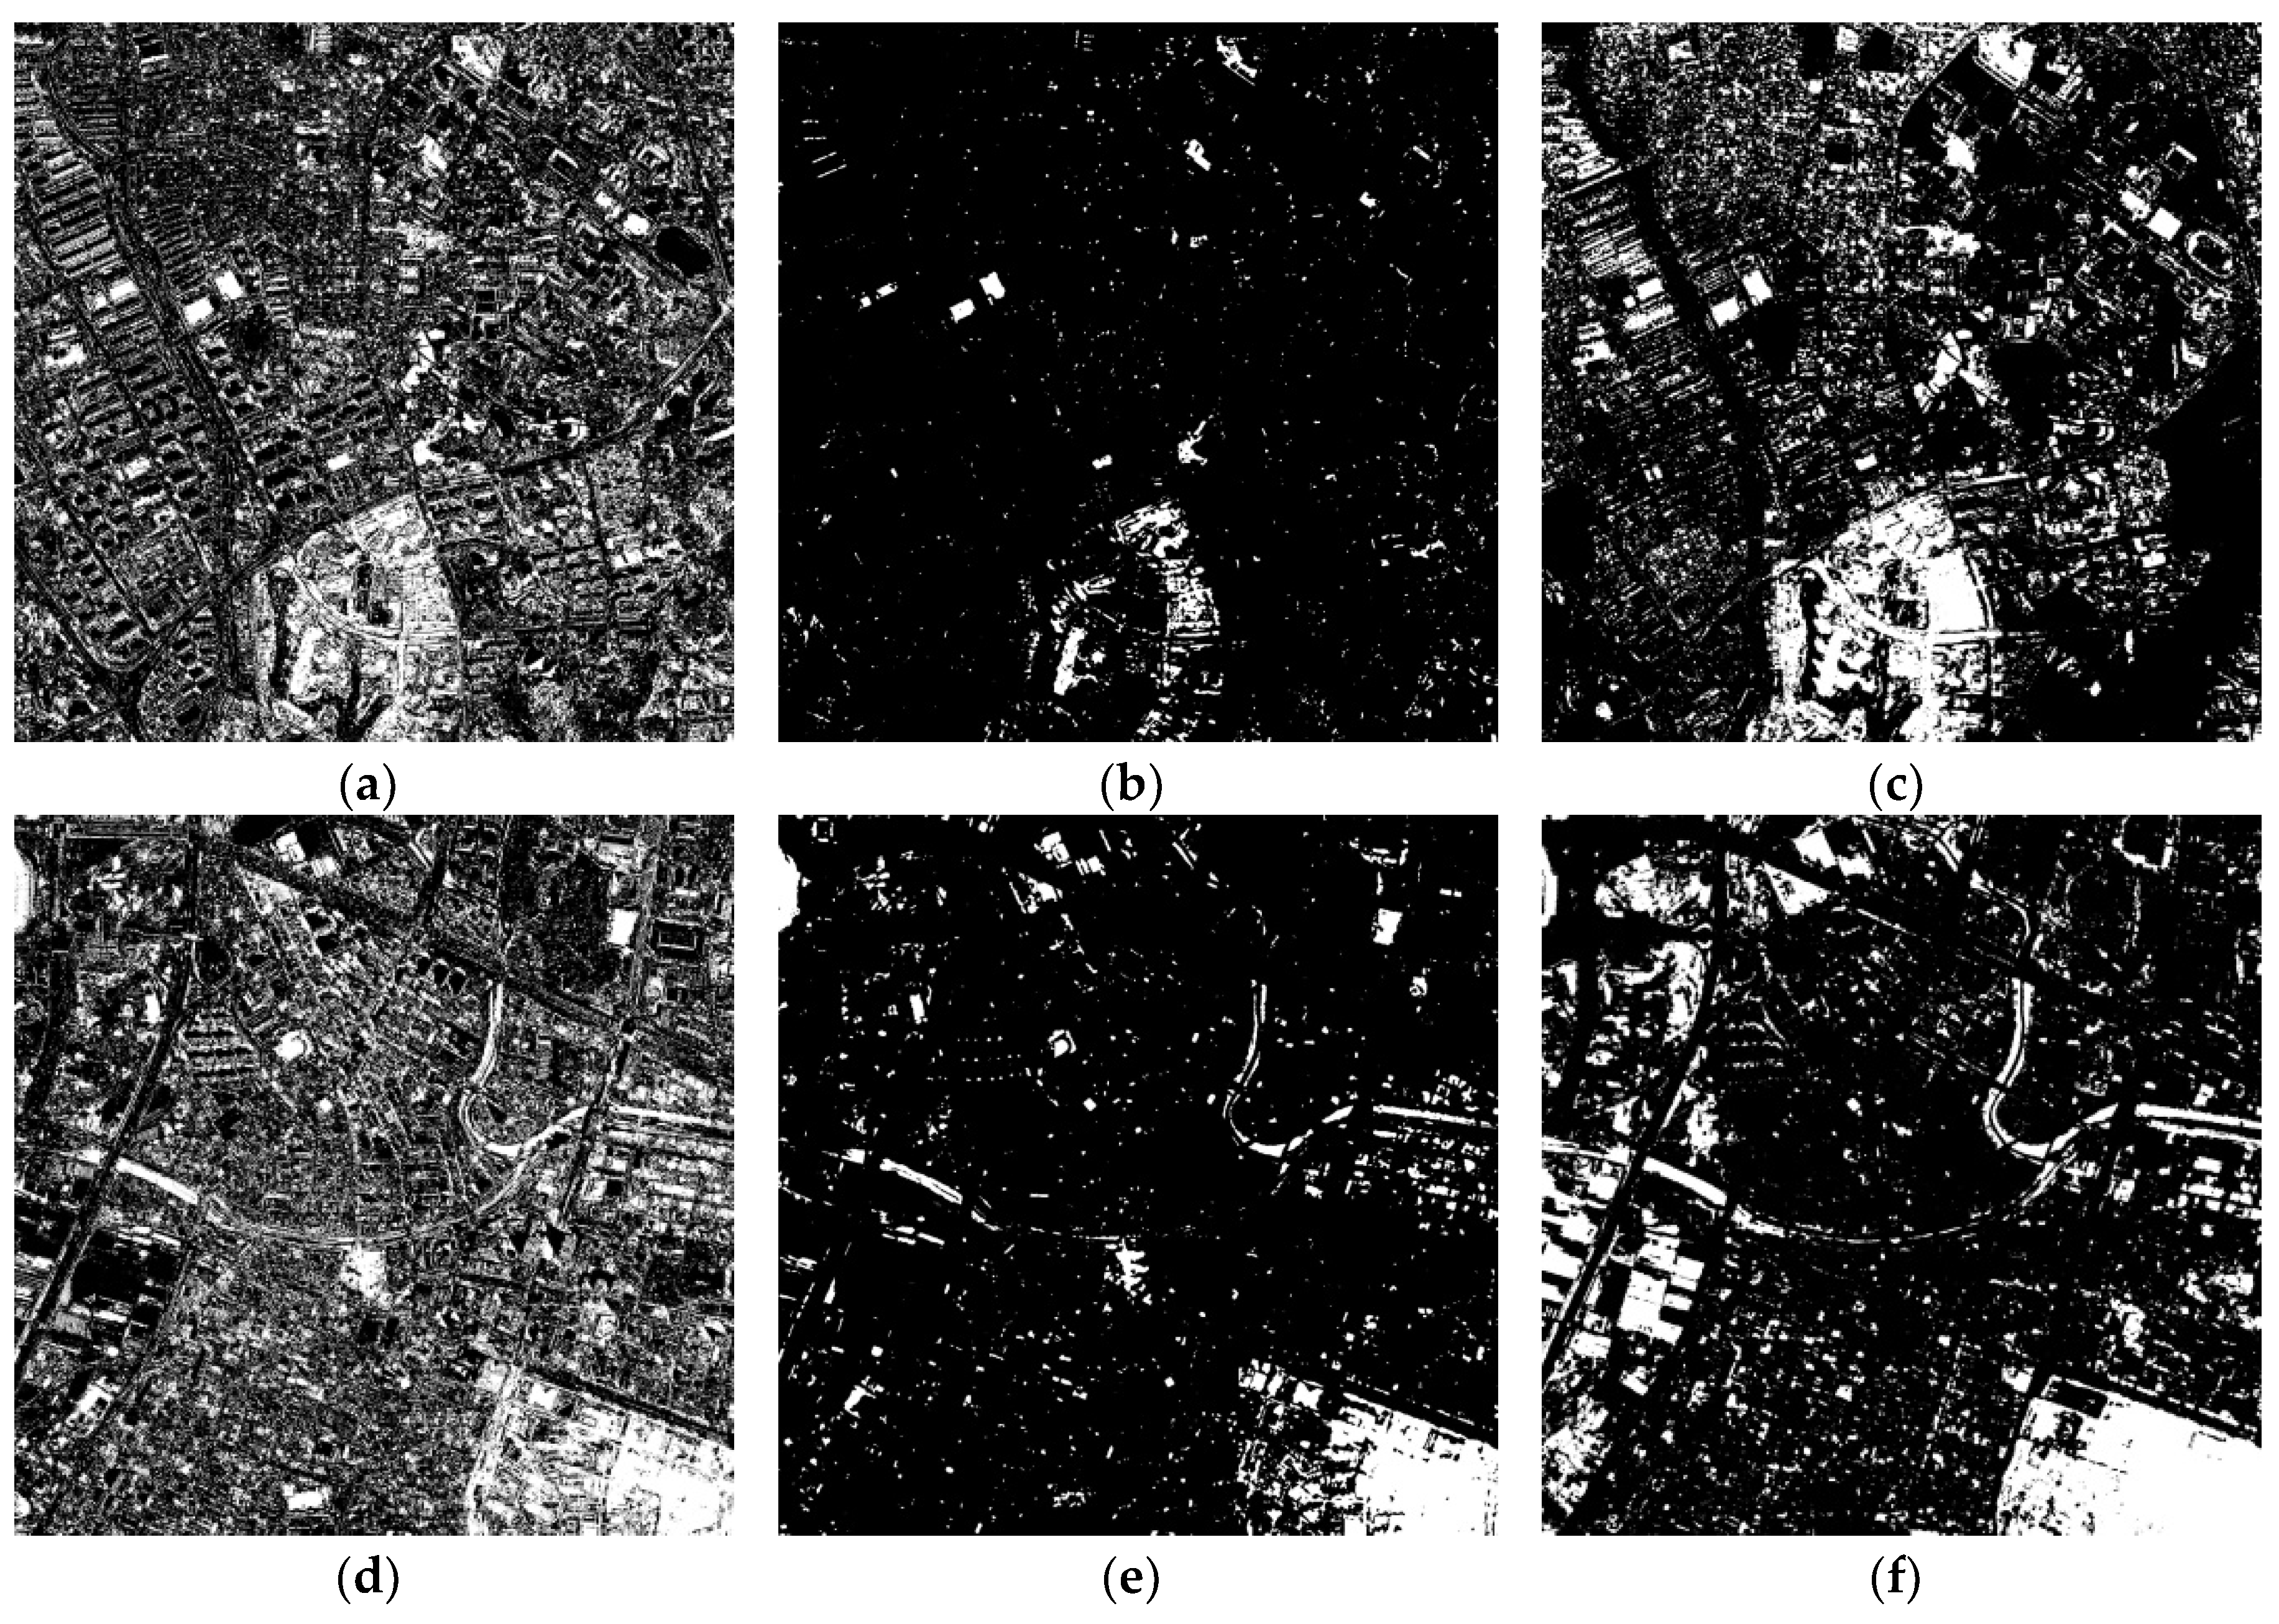
As shown in Table 6 and Table 7, the false alarm rate decreased and the detection rate increased at Sites 1 and 2 when using the proposed method. When change detection was performed using high-spatial-resolution satellite images, the phenomenon in which the boundaries of frequently occurring objects were extracted as change areas decreased. Specifically, traditional binary change detection results obtained using only pan-sharpened images could not detect the changed area efficiently, and some unchanged areas were detected as changed areas. The binary change detection results obtained using only the magnitude information of cross-sharpened images exhibited the lowest false alarm rate and highest overall accuracy. The detection rates were also the lowest at 0.196 for Site 1 and 0.645 for Site 2, as shown in Figure 12b,e and Table 6 and Table 7. The results based on the magnitude of cross-sharpened images displayed a very low false-positive rate. However, binary change detection yielded a very low detection rate. However, adding direction information increased the false alarm rate to an extent, but the detection rate also considerably increased. In addition, the false alarm rate was lower in this case than for that based on the magnitude information of only pan-sharpened images. This result was observed because most changed areas were detected as unchanged areas. Although some unchanged areas were detected in the binary change detection results obtained using cross-sharpened images and the integration of magnitude and direction information, most changed areas could be detected, as shown in Figure 12c,f. In addition, the false alarm rate decreased compared to that of traditional binary change detection (Figure 12a,d). Therefore, the cross-sharpening algorithm and integration of magnitude and direction information can be used to modify S2CVA.
5. Conclusions
S2CVA, the change detection technique used in this study, calculates the relevant magnitude and direction vectors. This study focuses on reducing false alarms using a combination of the magnitude and direction generated with the S2CVA technique. We attempted to minimize false alarms caused by seasonal differences by fusing magnitude and direction data. We used high-spatial-resolution KOMPSAT-2 satellite imagery and produced a high-spatial-resolution multispectral image via the NDVI-based pan-sharpening algorithm. Specifically, images generated by applying the cross-sharpening technique were used for change detection to reduce false alarms due to geometric errors, which can occur when change detection is performed using only pan-sharpened images. Therefore, although the difficulty associated with perfectly matching the geometric characteristics of high-spatial-resolution satellite images makes these images unsuitable for urban change detection, this problem can be overcome by using the proposed change detection method with cross-sharpened images. An analysis of the magnitude calculated by the S2CVA method showed that some unchanged regions with seasonal differences were likely to be classified as changed regions. To solve this problem, we proposed the use of direction information and analyzed the direction of two study sites. The analysis showed that regions with low direction values were mainly seasonally affected regions. By multiplying the magnitude and direction, which were linearly transformed to 0–1, the aforementioned false alarm regions were likely to be considered unchanged. To evaluate the performance of the proposed method, we compared the results of experiments using only pan-sharpened images and those of experiments using only the magnitude of S2CVA applied with cross-sharpened images. The ROC curve, AUC results, and confusion matrix of binary change detection results indicated that the accuracy of the proposed method is higher than that of the above two methods. In addition, the results based on the integration of magnitude and direction information from cross-sharpened images yielded a higher detection rate and lower false alarm rate than those of only magnitude information from pan-sharpened images, as shown in the confusion matrix of the binary change detection results. Most of the false alarms caused by the geometric errors that occur during change detection with cross-sharpened images were reduced via the use of only pan-sharpened images.
Author Contributions
H.P. and J.C. designed the framework of the paper and performed the experiments. W.P. and H.P. supported the experiments and provided feedback on the proposed algorithm.
Funding
This research was funded by the DAPA (Defense Acquisition Program Administration) and ADD (Agency for Defense Development).
Acknowledgments
This work was supported by the Defense Acquisition Program Administration (DAPA) and Agency for Defense Development (ADD).
Conflicts of Interest
The authors declare no conflicts of interest.
References
- Kim, D.S.; Kim, H.T. Automatic thresholding method using cumulative similarity measurement for unsupervised change detection of multispectral and hyperspectral images. Korean J. Remote Sens. 2008, 24, 341–349. [Google Scholar]
- Lu, D.; Li, G.; Moran, E. Current situation and needs of change detection techniques. Int. J. Image Data Fusion 2014, 5, 13–38. [Google Scholar] [CrossRef]
- Volpi, M.; Tuia, D.; Bovolo, F.; Kanevski, M.; Bruzzone, L. Supervised change detection in VHR images using contextual information and support vector machines. Int. J. Appl. Earth Observat. Geoinf. 2013, 20, 77–85. [Google Scholar] [CrossRef]
- Bovolo, F.; Bruzzone, L.; Marconcini, M. A novel approach to unsupervised change detection based on a semisupervised SVM and a similarity measure. IEEE Trans. Geosci. Remote Sens. 2008, 46, 2070–2082. [Google Scholar] [CrossRef]
- Johnson, R.D.; Kasischke, E.S. Change vector analysis: A technique for the multispectral monitoring of land cover and condition. Int. J. Remote Sens. 1998, 19, 411–426. [Google Scholar] [CrossRef]
- Solano-Correa, Y.T.; Bovolo, F.; Bruzzone, L. An approach for unsupervised change detection in multitemporal VHR images acquired by different multispectral sensors. Remote Sens. 2018, 10, 533. [Google Scholar] [CrossRef]
- Chen, J.; Gong, P.; He, C.; Pu, R.; Shi, P. Land-use/land-cover change detection using improved change-vector analysis. Photogramm. Eng. Remote Sens. 2003, 4, 369–379. [Google Scholar] [CrossRef]
- Carvalho Júnior, O.A.; Guimaraes, R.F.; Gillespie, A.R.; Silva, N.C.; Gomes, R.A.T. A new approach to change vector analysis using distance and similarity measures. Remote Sens. 2011, 3, 2473–2493. [Google Scholar] [CrossRef]
- Wu, C.; Du, B.; Zhang, L. A subspace-based change detection method for hyperspectral images. IEEE J. Sel. Top. Appl. Earth Obs. Remote Sens. 2013, 6, 815–830. [Google Scholar] [CrossRef]
- Bovolo, F.; Bruzzone, L. A theoretical framework for unsupervised change detection based on change vector analysis in the polar domain. IEEE Trans. Geosci. Remote Sens. 2007, 45, 218–236. [Google Scholar] [CrossRef]
- Liu, S.; Bruzzone, L.; Bovolo, F.; Du, P. A novel sequential spectral change vector analysis for detecting multiple changes in hyperspectral images. In Proceedings of the 2014 IEEE International Geoscience and Remote Sensing Symposium (IGARSS), Quebec, Canada, 13–18 July 2014; pp. 4656–4659. [Google Scholar]
- Marchesi, S.; Bovolo, F.; Bruzzone, L. A context-sensitive technique robust to registration noise for change detection in VHR multispectral images. IEEE Trans. Image Process. 2010, 19, 1877–1889. [Google Scholar] [CrossRef] [PubMed]
- Im, J.; Jensen, J.R.; Tullis, J.A. Object-based change detection using correlation image analysis and image segmentation. Int. J. Remote Sens. 2013, 29, 399–423. [Google Scholar] [CrossRef]
- Choi, J. Unsupervised change detection for very high-spatial resolution satellite imagery by using object-based IR-MAD algorithm. J. Korean Soc. Surv. Geodesy Photogramm. Cartogr. 2015, 33, 297–304. [Google Scholar]
- Peng, D.; Zhang, Y. Object-based change detection from satellite imagery by segmentation optimization and multi-features fusion, International Journal of Remote Sensing. Int. J. Remote Sens. 2017, 38, 3886–3905. [Google Scholar] [CrossRef]
- Zhang, P.; Gong, M.; Su, L.; Liu, J.; Li, Z. Change detection based on deep feature representation and mapping transformation for multi-spatial-resolution remote sensing images. ISPRS J. Photogramm. Remote Sens. 2016, 116, 24–41. [Google Scholar] [CrossRef]
- Seo, D.K.; Kim, Y.H.; Eo, Y.D.; Park, W.Y.; Park, H.C. Generation of radiometric, phenological normalized image based on random forest regression for change detection. Remote Sens. 2017, 9, 1163. [Google Scholar] [CrossRef]
- Wang, B.; Choi, S.; Byun, Y.; Lee, S.; Choi, J. Object-based change detection of very high resolution satellite imagery using the cross-sharpening of multitemporal data. IEEE Geosci. Remote Sens. Lett. 2015, 12, 1151–1155. [Google Scholar] [CrossRef]
- Byun, Y.; Han, Y.; Chae, T. Image fusion-based change detection for flood extent extraction using bi-temporal very high-resolution satellite images. Remote Sens. 2015, 7, 10347–10363. [Google Scholar] [CrossRef]
- Wang, B.; Choi, J.; Choi, S.; Lee, S.; Wu, P.; Gao, Y. Image fusion-based land cover change detection using multi-temporal high-resolution satellite images. Remote Sens. 2017, 9, 804. [Google Scholar] [CrossRef]
- Park, H.; Choi, J.; Park, N.; Choi, S. Sharpening the VNIR and SWIR bands of Sentinel-2A imagery through modified selected and synthesized band schemes. Remote Sens. 2017, 9, 1080. [Google Scholar] [CrossRef]
- Li, H.; Jing, L.; Tang, Y. Assessment of pansharpening method applied to Worldview-2 imagery fusion. Sensors 2017, 17, 89. [Google Scholar] [CrossRef] [PubMed]
- Wang, Q.; Shi, W.; Li, Z.; Atkinson, P.M. Fusion of Sentinel-2 images. Remote Sens. Environ. 2016, 187, 241–252. [Google Scholar] [CrossRef]
- Pradhan, P.S.; King, R.L.; Younan, N.H.; Holcomb, D.W. Estimation of the number of decomposition levels for a wavelet-based multiresolution multisensory image fusion. IEEE Trans. Geosci. Remote Sens. 2006, 44, 3674–3686. [Google Scholar] [CrossRef]
- Choi, J.; Yeom, J.; Chang, A.; Byun, Y.; Kim, Y. Hybrid pansharpening algorithm for high spatial resolution satellite imagery to improve spatial quality. IEEE Geosci. Remote Sens. Lett. 2013, 10, 490–494. [Google Scholar] [CrossRef]
- Garzelli, A.; Nencini, F. Panchromatic sharpening of remote sensing images using a multiscale Kalman filter. Pattern Recognit. 2007, 40, 3568–3577. [Google Scholar] [CrossRef]
- Baronti, S.; Aiazzi, B.; Selva, M.; Garzelli, A.; Alparone, L. A theoretical analysis of the effects of aliasing and misregistration on pansharpened imagery. IEEE J. Sel. Topics Signal Process. 2011, 5, 446–453. [Google Scholar] [CrossRef]
- Lee, J.; Lee, C. Fast and efficient panchromatic sharpening. IEEE Trans. Geosci. Remote Sens. 2010, 48, 155–163. [Google Scholar]
- Dai, X.; Khorram, S. The effects of image misregistration on the accuracy of remotely sensed change detection. IEEE Trans. Geosci. Remote Sens. 1998, 36, 1566–1577. [Google Scholar]
- Lee, S.B.; Park, W.Y.; Eo, Y.D.; Pyeon, M.W.; Han, S.; Yeon, S.H.; Lee, B.K. Analysis on the applicability of simulated image from SPOT 4 HRVIR image. KSCE J. Civ. Eng. 2017, 21, 1434–1442. [Google Scholar] [CrossRef]
- Lee, M.H.; Lee, S.B.; Eo, Y.D.; Kim, S.W.; Woo, J.; Han, S.H. A comparative study on generating simulated Landsat NDVI images using data fusion and regression method—the case of the Korean peninsula. Environ. Monit. Assess. 2017, 189, 333. [Google Scholar] [CrossRef] [PubMed]
- Choi, J.; Park, H.; Park, N.; Han, S.; Song, J. Deforestation analysis using unsupervised change detection based on ITPCA. Korean J. Remote Sens. 2017, 33, 1233–1242. [Google Scholar]
- Han, Y.; Kim, T.; Han, S.; Song, J. Change detection of urban development over large area using KOMPST optical imagery. Korean J. Remote Sens. 2017, 33, 1223–1232. [Google Scholar]
- Solano-Correa, Y.T.; Bovolo, F.; Bruzzone, L. VHR time-series generation by prediction and fusion of multi-sensor images. In Proceedings of the 2015 IEEE International Geoscience and Remote Sensing Symposium (IGARSS), Milan, Italy, 26–31 July 2015; pp. 3298–3301. [Google Scholar]
- Liu, S.; Bruzzone, L.; Bovolo, F.; Zanetti, M.; Du, P. Sequential spectral change vector analysis for iteratively discovering and detection multiple changes in hyperspectral images. IEEE Geosci. Remote Sens. 2015, 53, 4363–4378. [Google Scholar] [CrossRef]
- Park, N.; Kim, D.; Ahn, J.; Choi, J.; Park, W.; Park, H. Unsupervised change detection based on sequential spectral change vector analysis for updating land cover map. Korean J. Remote Sens. 2017, 33, 1075–1087. [Google Scholar]
- Liu, S.; Du, Q.; Tong, X.; Samat, A.; Bruzzone, L.; Bovolo, F. Multiscale morphological compressed change vector analysis for unsupervised multiple change detection. IEEE J. Sel. Top. Appl. Earth Obs. Remote Sens. 2017, 10, 4124–4137. [Google Scholar] [CrossRef]
- Park, H.; Choi, J.; Oh, J. Seasonal effects removal of unsupervised change detection based multitemporal imagery. J. Korean Soc. Surv. Geodesy Photogramm. Cartogr. 2018, 36, 51–58. [Google Scholar]
- Han, Y.; Bovolo, F.; Bruzzone, L. Segmentation-based fine registration of very high resolution multitemporal images. IEEE Geosci. Remote Sens. 2017, 55, 2884–2897. [Google Scholar] [CrossRef]
- Aiazzi, B.; Baronti, S.; Lotti, F.; Selva, M. A comparison between global and context-adaptive pansharpening of multispectral images. IEEE Geosci. Remote Sens. Lett. 2009, 6, 302–306. [Google Scholar] [CrossRef]
- Garzelli, A. Pansharpening of multispectral images based on nonlocal parameter optimization. IEEE Trans. Geosci. Remote Sens. 2015, 53, 2096–2107. [Google Scholar] [CrossRef]
- Choi, J.; Kim, G.; Park, N.; Park, H.; Choi, S. A hybrid pansharpening algorithm of VHR satellite images that employs injection gains based on NDVI to reduce computational costs. Remote Sens. 2017, 9, 976. [Google Scholar] [CrossRef]
- Guo, Q.; Chen, S.; Leung, H.; Liu, S. Covariance intersection based image fusion technique with application to pansharpening in remote sensing. Inf. Sci. 2010, 180, 3434–3443. [Google Scholar] [CrossRef]
- Li, S. A new pan-sharpening method using a compressed sensing technique. IEEE Trans. Geosci. Remote Sens. 2011, 49, 738–746. [Google Scholar] [CrossRef]
- Cheng, J.; Liu, H.; Liu, T.; Wang, F.; Li, H. Remote sensing image fusion via wavelet transform and sparse representation. ISPRS J. Photogramm. Remote Sens. 2015, 104, 158–173. [Google Scholar] [CrossRef]
- Wei, Q.; Bioucas-Dias, J.; Dobigeon, N.; Tourneret, J.Y. Hyperspectral and multispectral image fusion based on a sparse representation. IEEE Trans. Geosci. Remote Sens. 2015, 53, 3658–3668. [Google Scholar] [CrossRef]
- Mahyari, A.G.; Yazdi, M. Panchromatic and multispectral image fusion based on maximization of both spectral and spatial similarities. IEEE Trans. Geosci. Remote Sens. 2011, 49, 1976–1985. [Google Scholar] [CrossRef]
- Alparone, L.; Aiazzi, B.; Baronti, S.; Garzelli, A.; Nencini, F.; Selva, M. Multispectral and panchromatic data fusion assessment without reference. Photogramm. Eng. Remote Sens. 2008, 74, 193–200. [Google Scholar] [CrossRef]
- Wang, Z.; Bovik, A.C. A universal image quality index. IEEE Geosci. Remote Sens. Lett. 2002, 9, 81–84. [Google Scholar] [CrossRef]
- Falco, N.; Mura, M.D.; Bovolo, F.; Benediktsson, J.A.; Bruzzone, L. Change detection in VHR images based on morphological attribute profiles. IEEE Geosci. Remote Sens. Lett. 2013, 10, 636–640. [Google Scholar] [CrossRef]
- Wen, D.; Huang, X.; Zhang, L.; Benediktsson, J.A. A novel automatic change detection method for urban high-resolution remotely sensed imagery based on multiindex scene representation. IEEE Trans. Geosci. Remote Sens. 2016, 54, 609–625. [Google Scholar] [CrossRef]
- Fluss, R.; Garaggi, D.; Reiser, B. Estimation of the youden index and its associated cutoff point. Biom. J. 2005, 47, 458–472. [Google Scholar] [CrossRef] [PubMed]
Figure 1.
Example of a changed area using the 2-D polar domain of S2CVA.

Figure 2.
Study areas analyzed in the change detection experiment: (a) Site 1 image before change, (b) Site 1 image after change, (c) Site 2 image before change, and (d) Site 2 image after change.
Figure 2.
Study areas analyzed in the change detection experiment: (a) Site 1 image before change, (b) Site 1 image after change, (c) Site 2 image before change, and (d) Site 2 image after change.


Figure 3.
True ground image: (a) Site 1 and (b) Site 2.

Figure 4.
Sharpening results: (a) multispectral image at time 1 (before change), (b) result using Gram -Schmidt adaptive (GSA) at time 1, (c) result using GS2 at time 1, (d) result using the normalized difference vegetation index (NDVI)-based algorithm at time 1, (e) multispectral image at time 2 (after change), (f) result using GSA at time 2, (g) result using GS2 at time 2, and (h) result using the NDVI-based algorithm at time 2.

Figure 5.
Receiver operating characteristic (ROC) curve results.

Figure 6.
Sharpening results: (a) of Site 1, (b) of Site 1, (c) of Site 1, (d) of Site 1, (e) of Site 2, (f) of Site 2, (g) of Site 2, and (h) of Site 2.
Figure 6.
Sharpening results: (a) of Site 1, (b) of Site 1, (c) of Site 1, (d) of Site 1, (e) of Site 2, (f) of Site 2, (g) of Site 2, and (h) of Site 2.


Figure 7.
Detailed images of the sharpening results at Site 1: (a) panchromatic image at time 1, (b) multispectral image at time 1, (c) panchromatic image at time 2, (d) multispectral image at time 2, (e) , (f) , (g) , and (h) .
Figure 7.
Detailed images of the sharpening results at Site 1: (a) panchromatic image at time 1, (b) multispectral image at time 1, (c) panchromatic image at time 2, (d) multispectral image at time 2, (e) , (f) , (g) , and (h) .

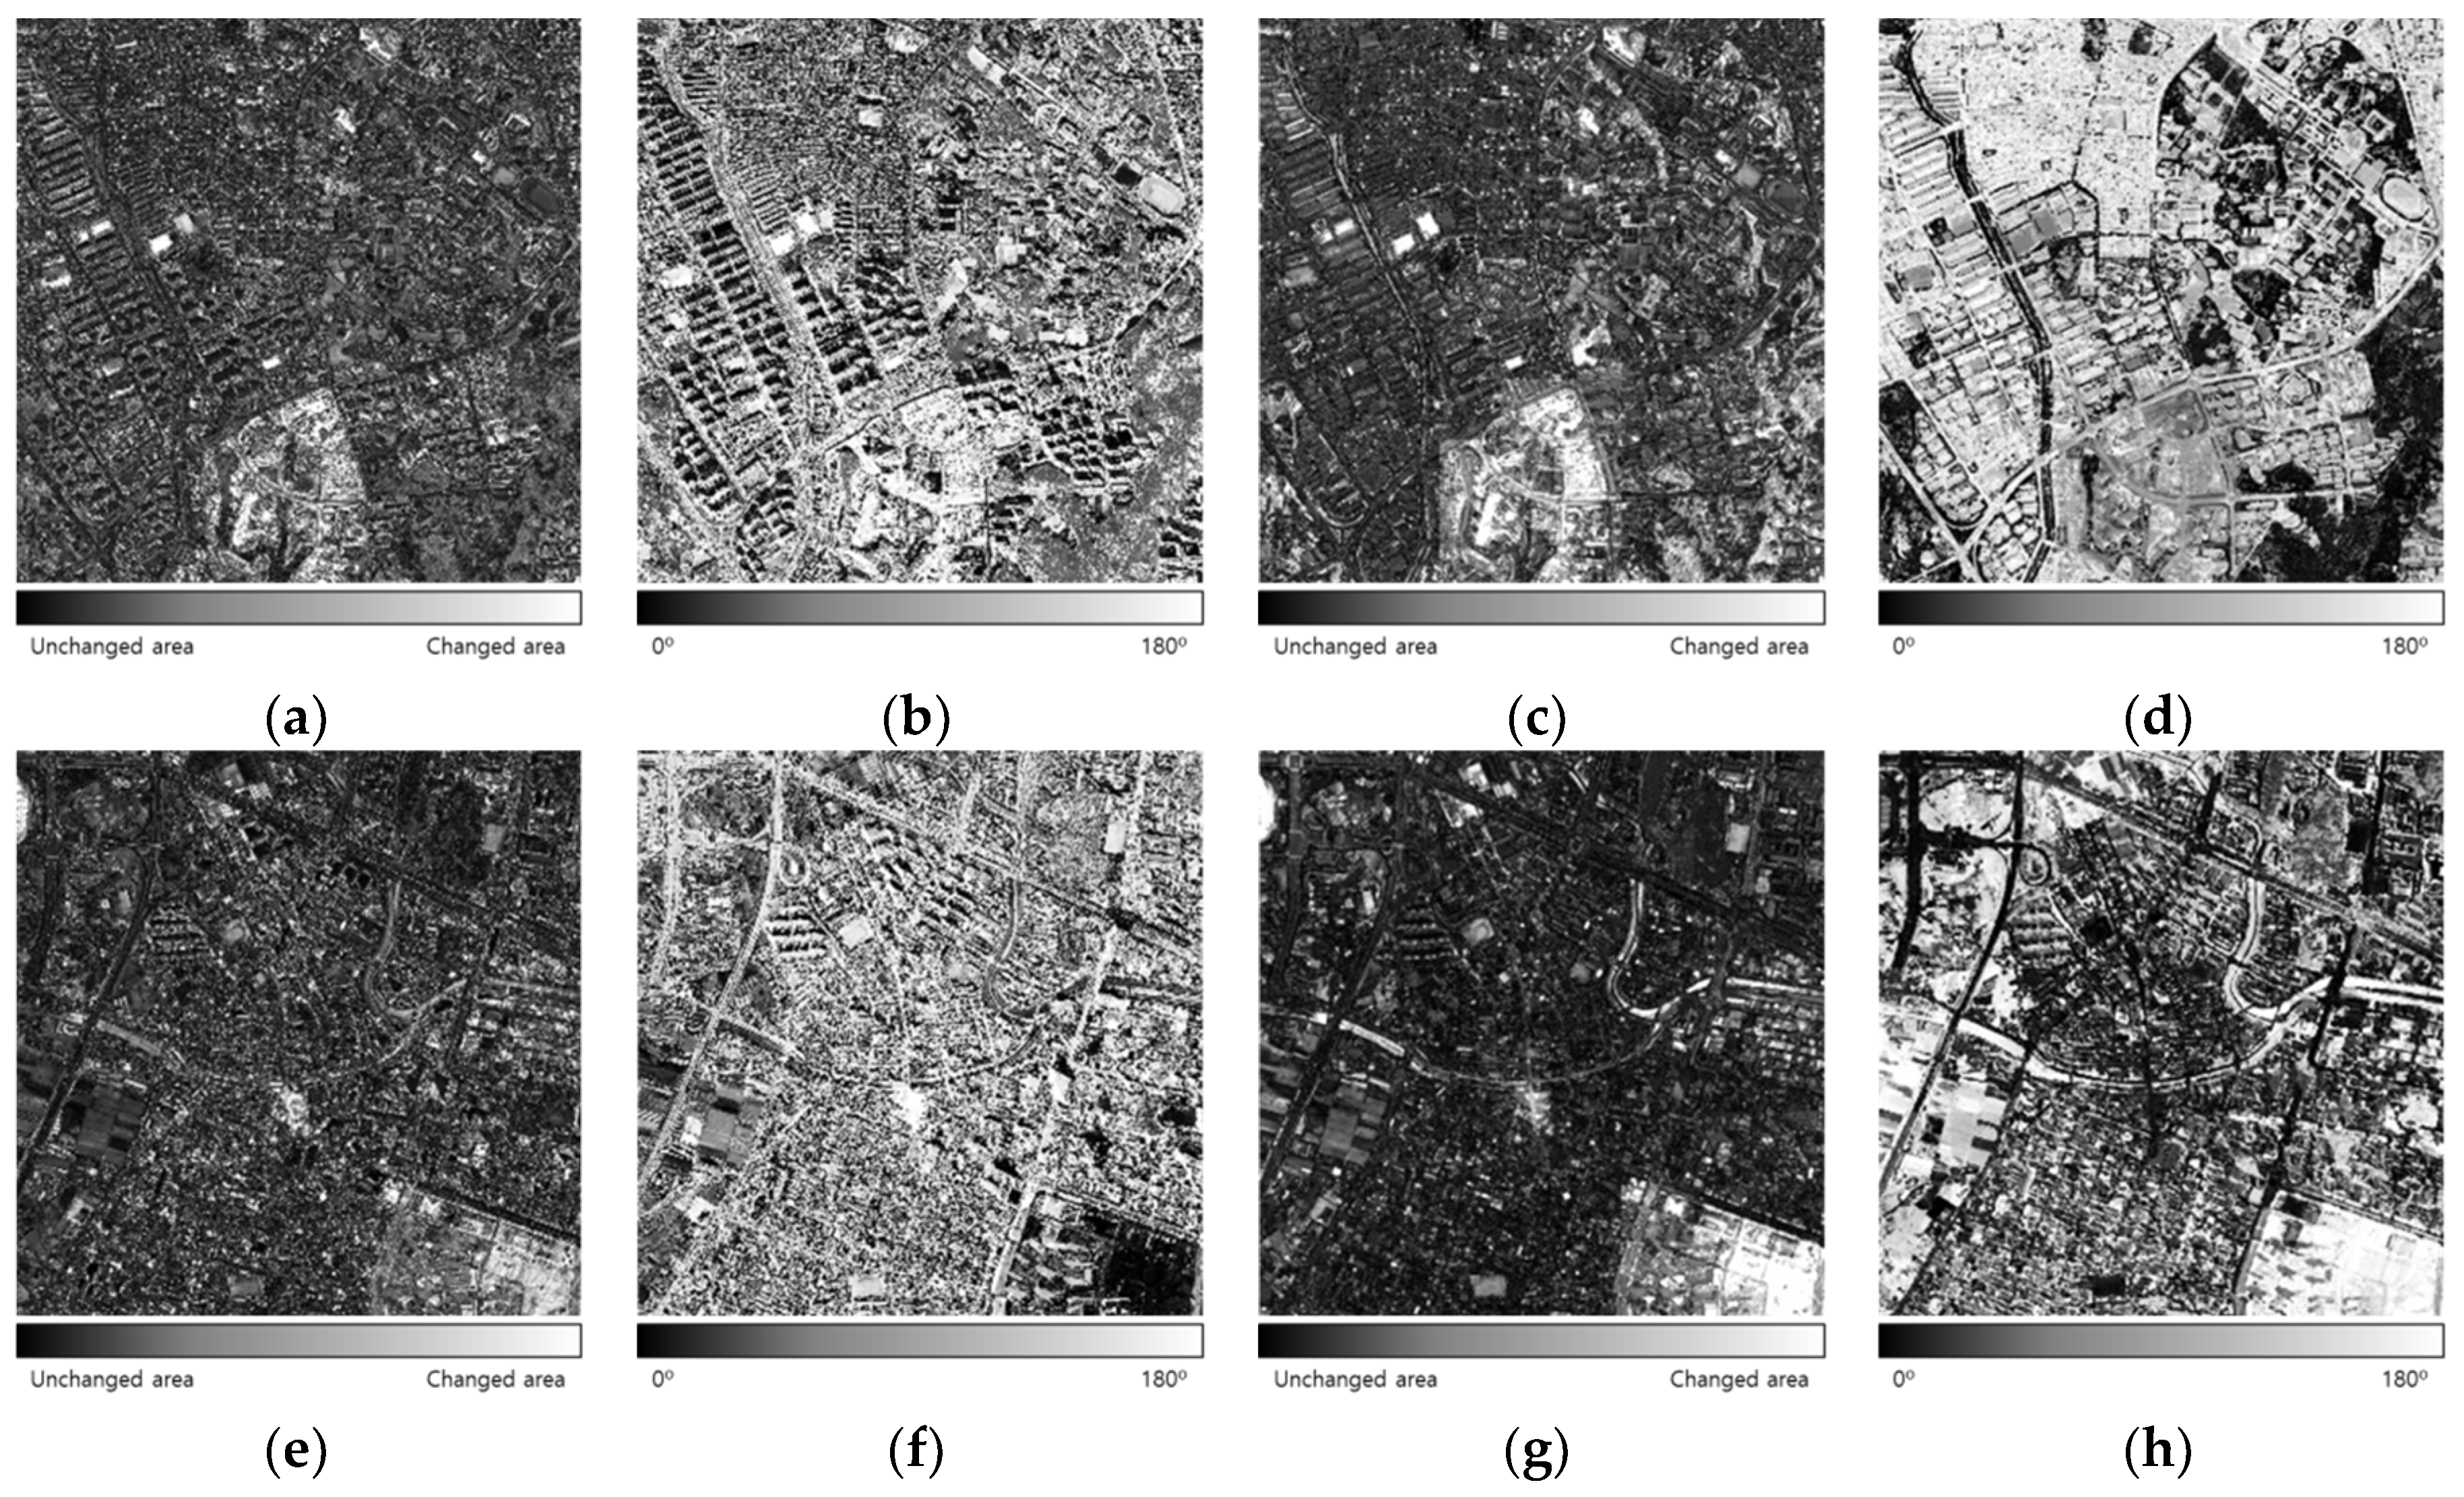
Figure 8.
Results from the combination of the following data with the S2CVA method: (a) magnitude information using only pan-sharpened images of Site 1, (b) direction information using only pan-sharpened images of Site 1, (c) magnitude information using pan-sharpened and cross-sharpened images of Site 1, (d) direction information using pan-sharpened and cross-sharpened images of Site 1, (e) magnitude information using only pan-sharpened images of Site 2, (f) direction information using only pan-sharpened images of Site 2, (g) magnitude information using pan-sharpened and cross-sharpened images of Site 2, and (h) direction information using pan-sharpened and cross-sharpened images of Site 2.

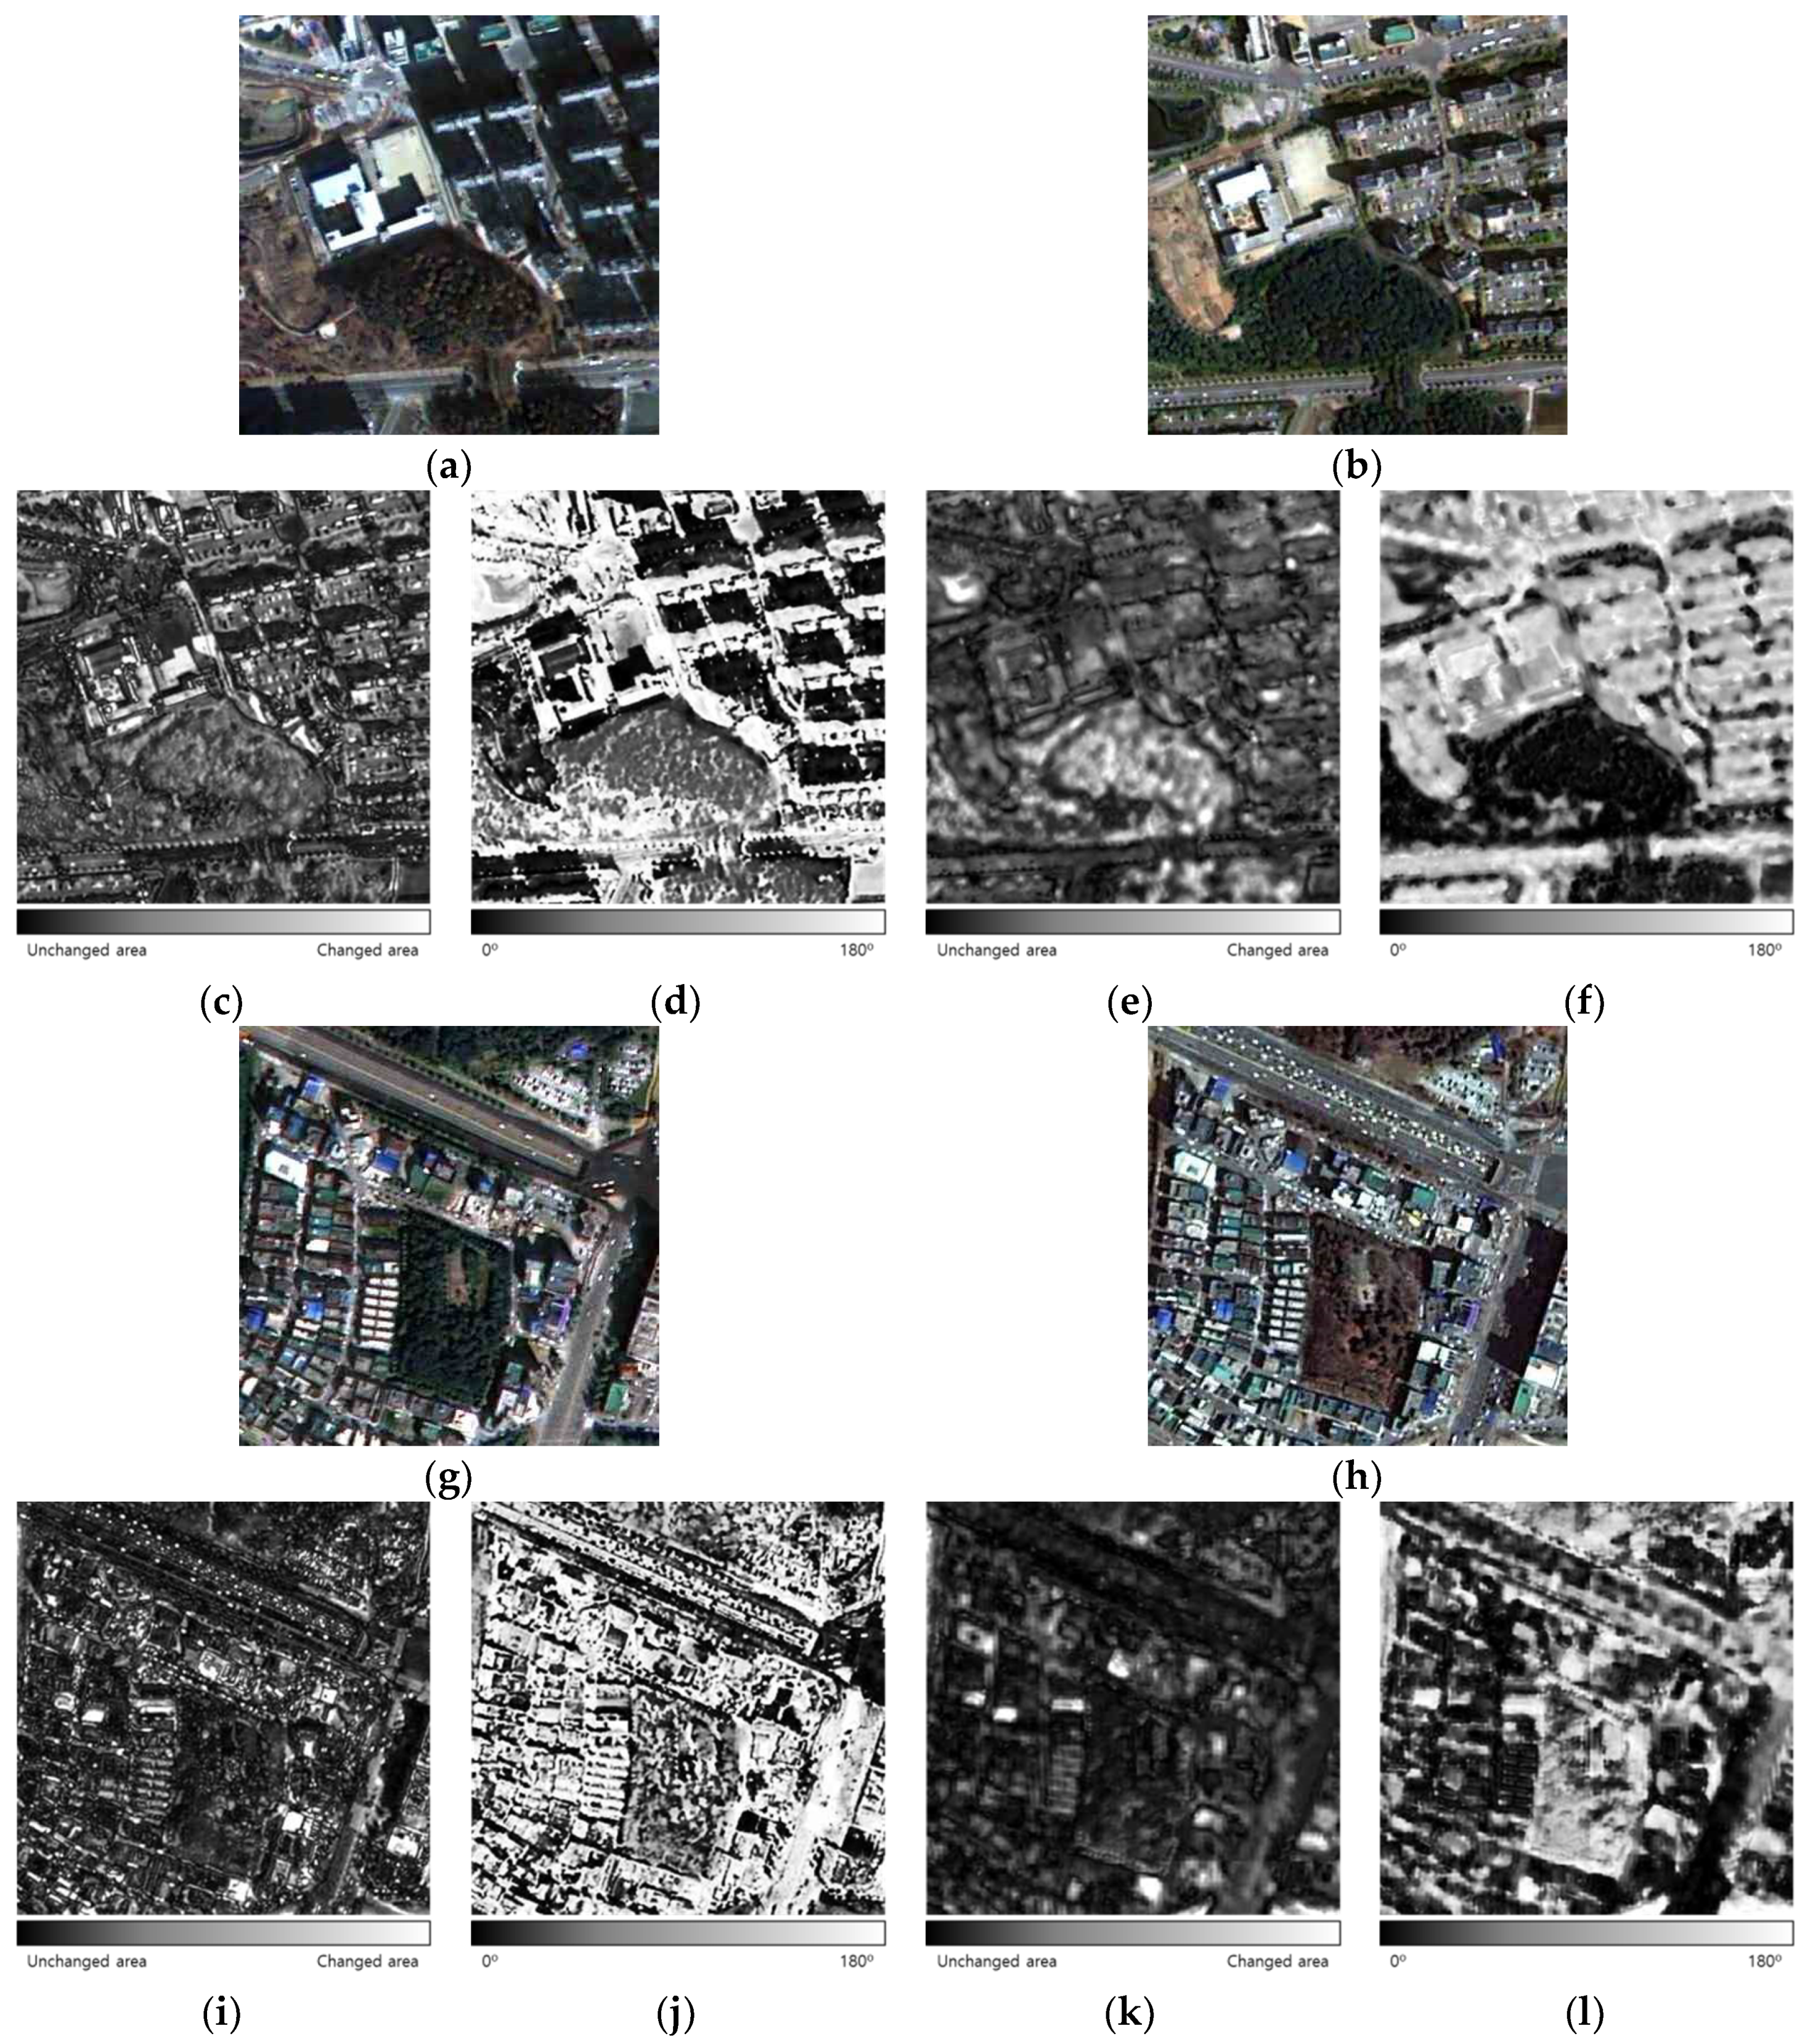
Figure 9.
Detailed (400 × 400 pixels) S2CVA results: (a) pan-sharpened image at time 1 at Site 1, (b) pan-sharpened image at time 2 at Site 1, (c) magnitude using only pan-sharpened images of Site 1, (d) direction using only pan-sharpened images of Site 1, (e) magnitude using cross-sharpened images of Site 1, (f) direction using cross-sharpened images of Site 1, (g) pan-sharpened image at time 1 at Site 2, (h) pan-sharpened image at time 2 at Site 2, (i) magnitude using only pan-sharpened images of Site 2, (j) direction using only pan-sharpened images of Site 2, (k) magnitude using cross-sharpened images of Site 2, and (l) direction using cross-sharpened images of Site 2.

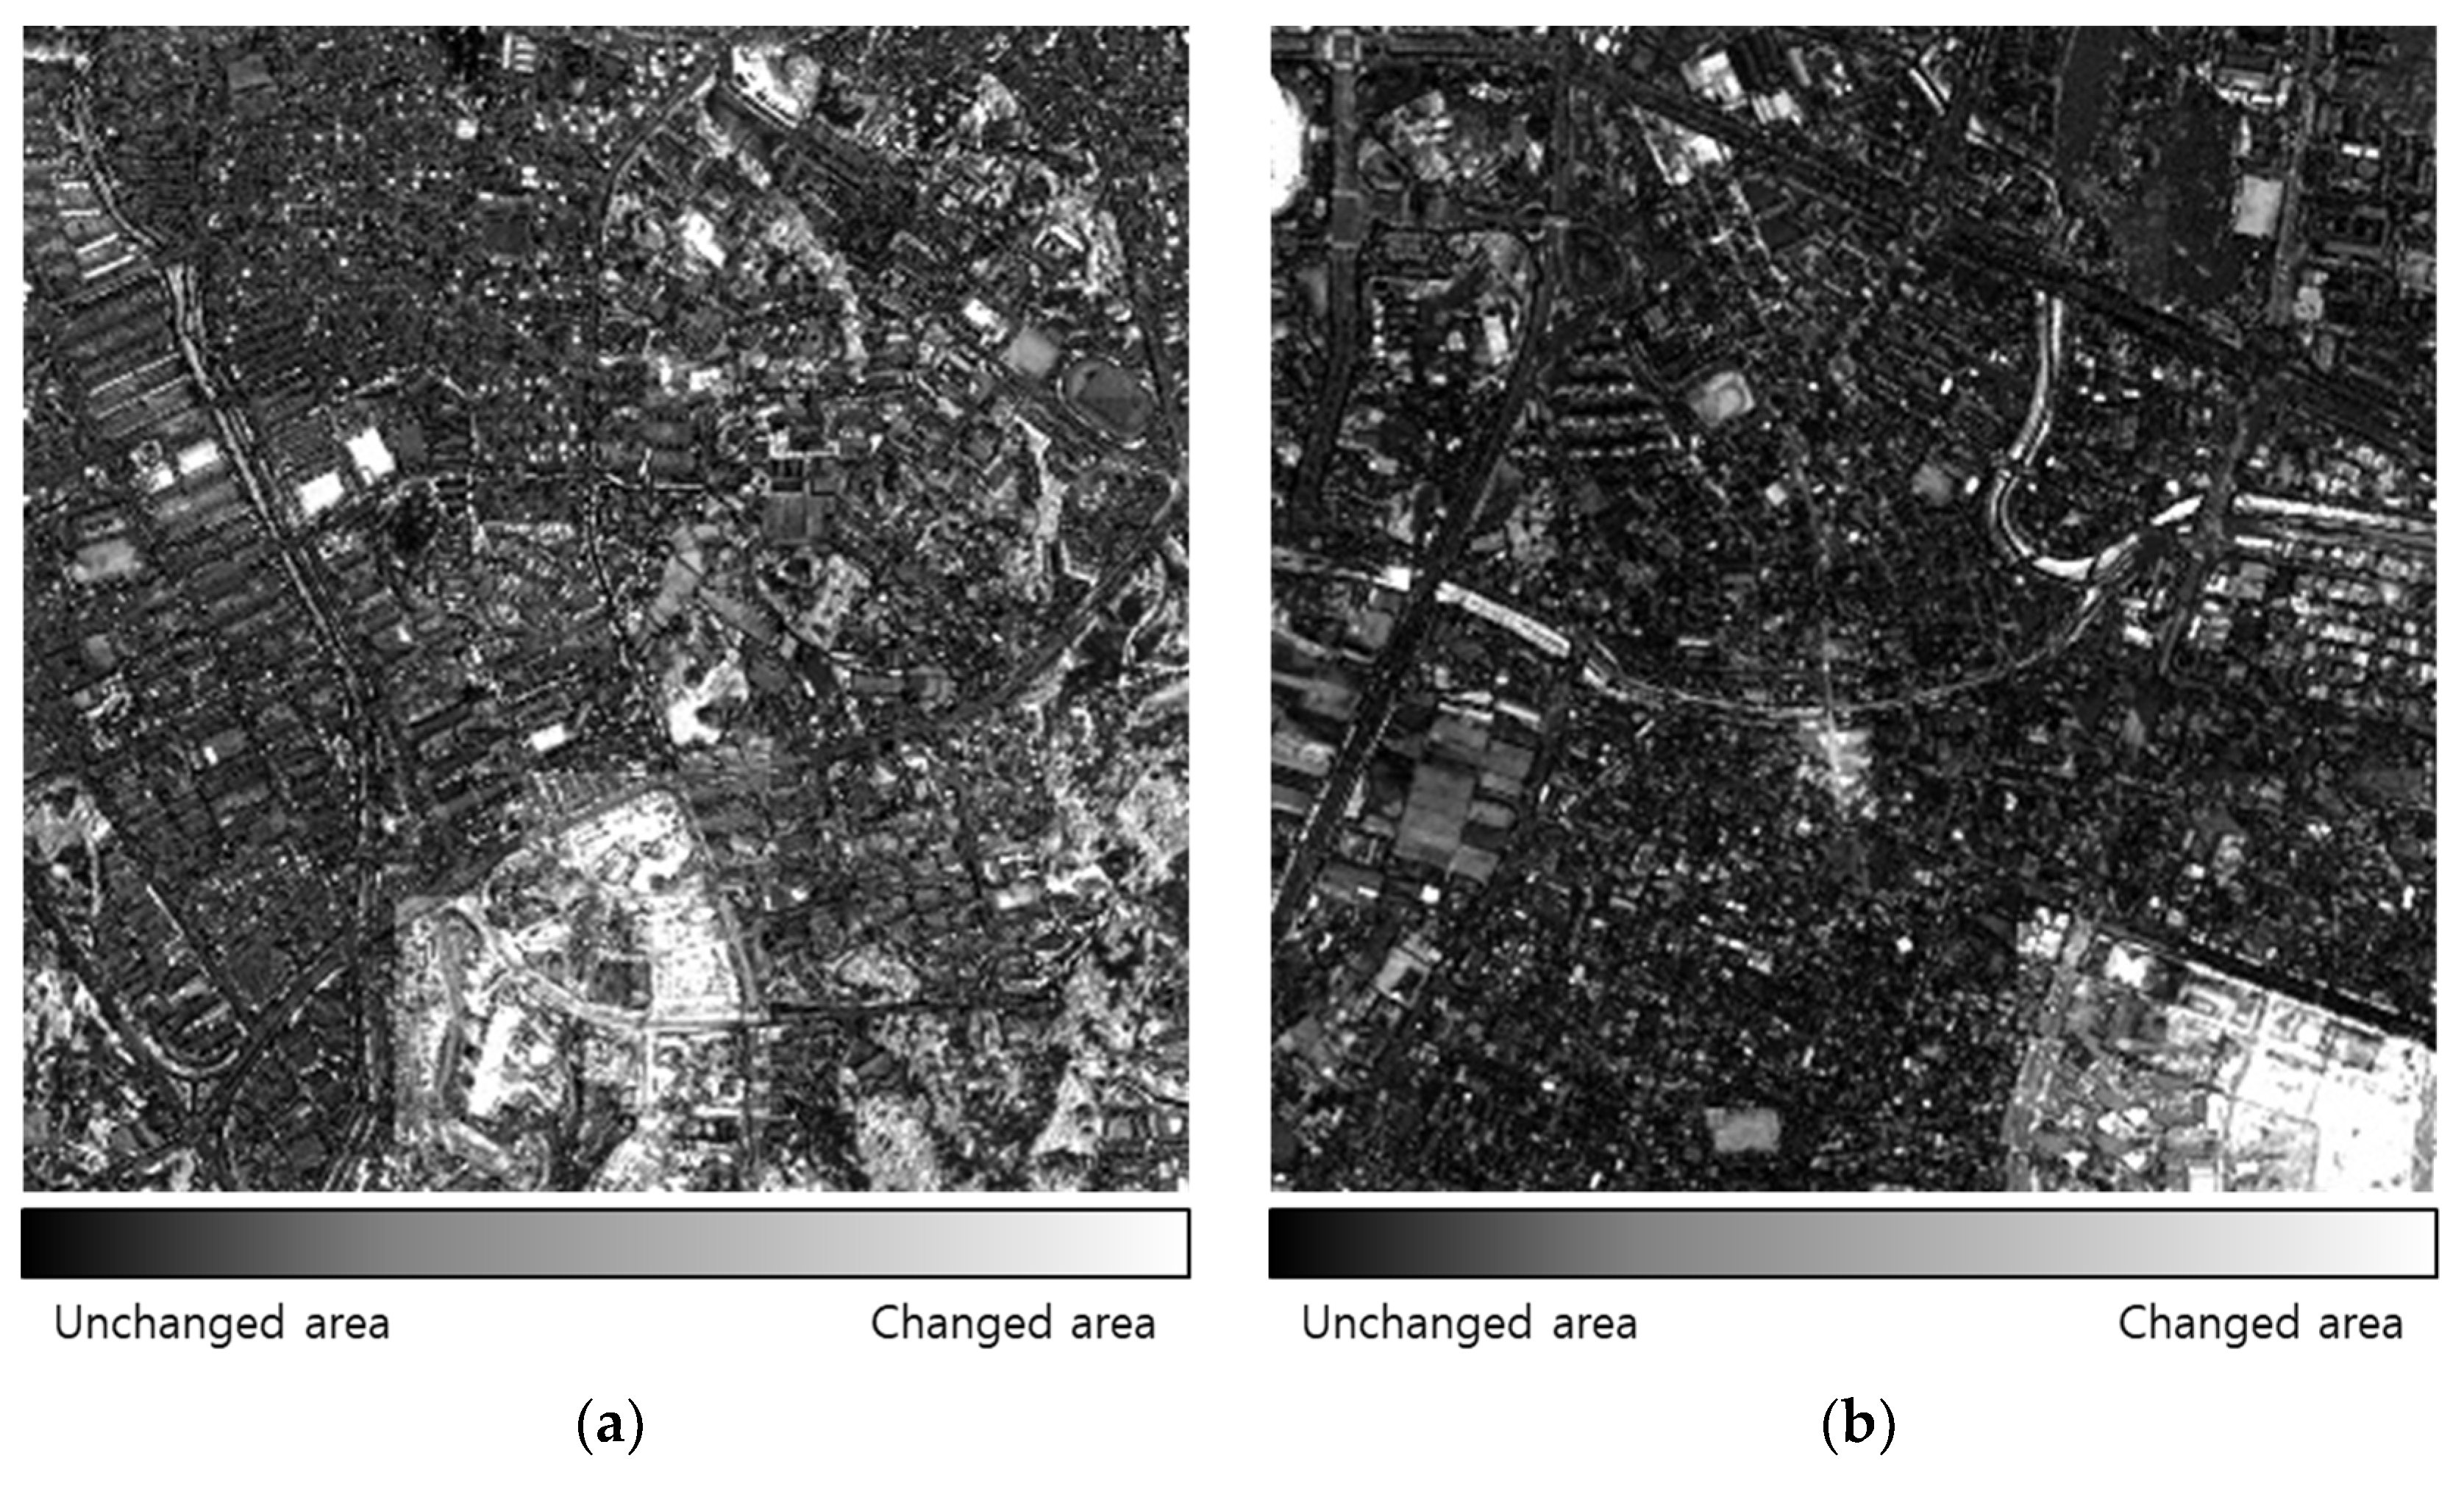
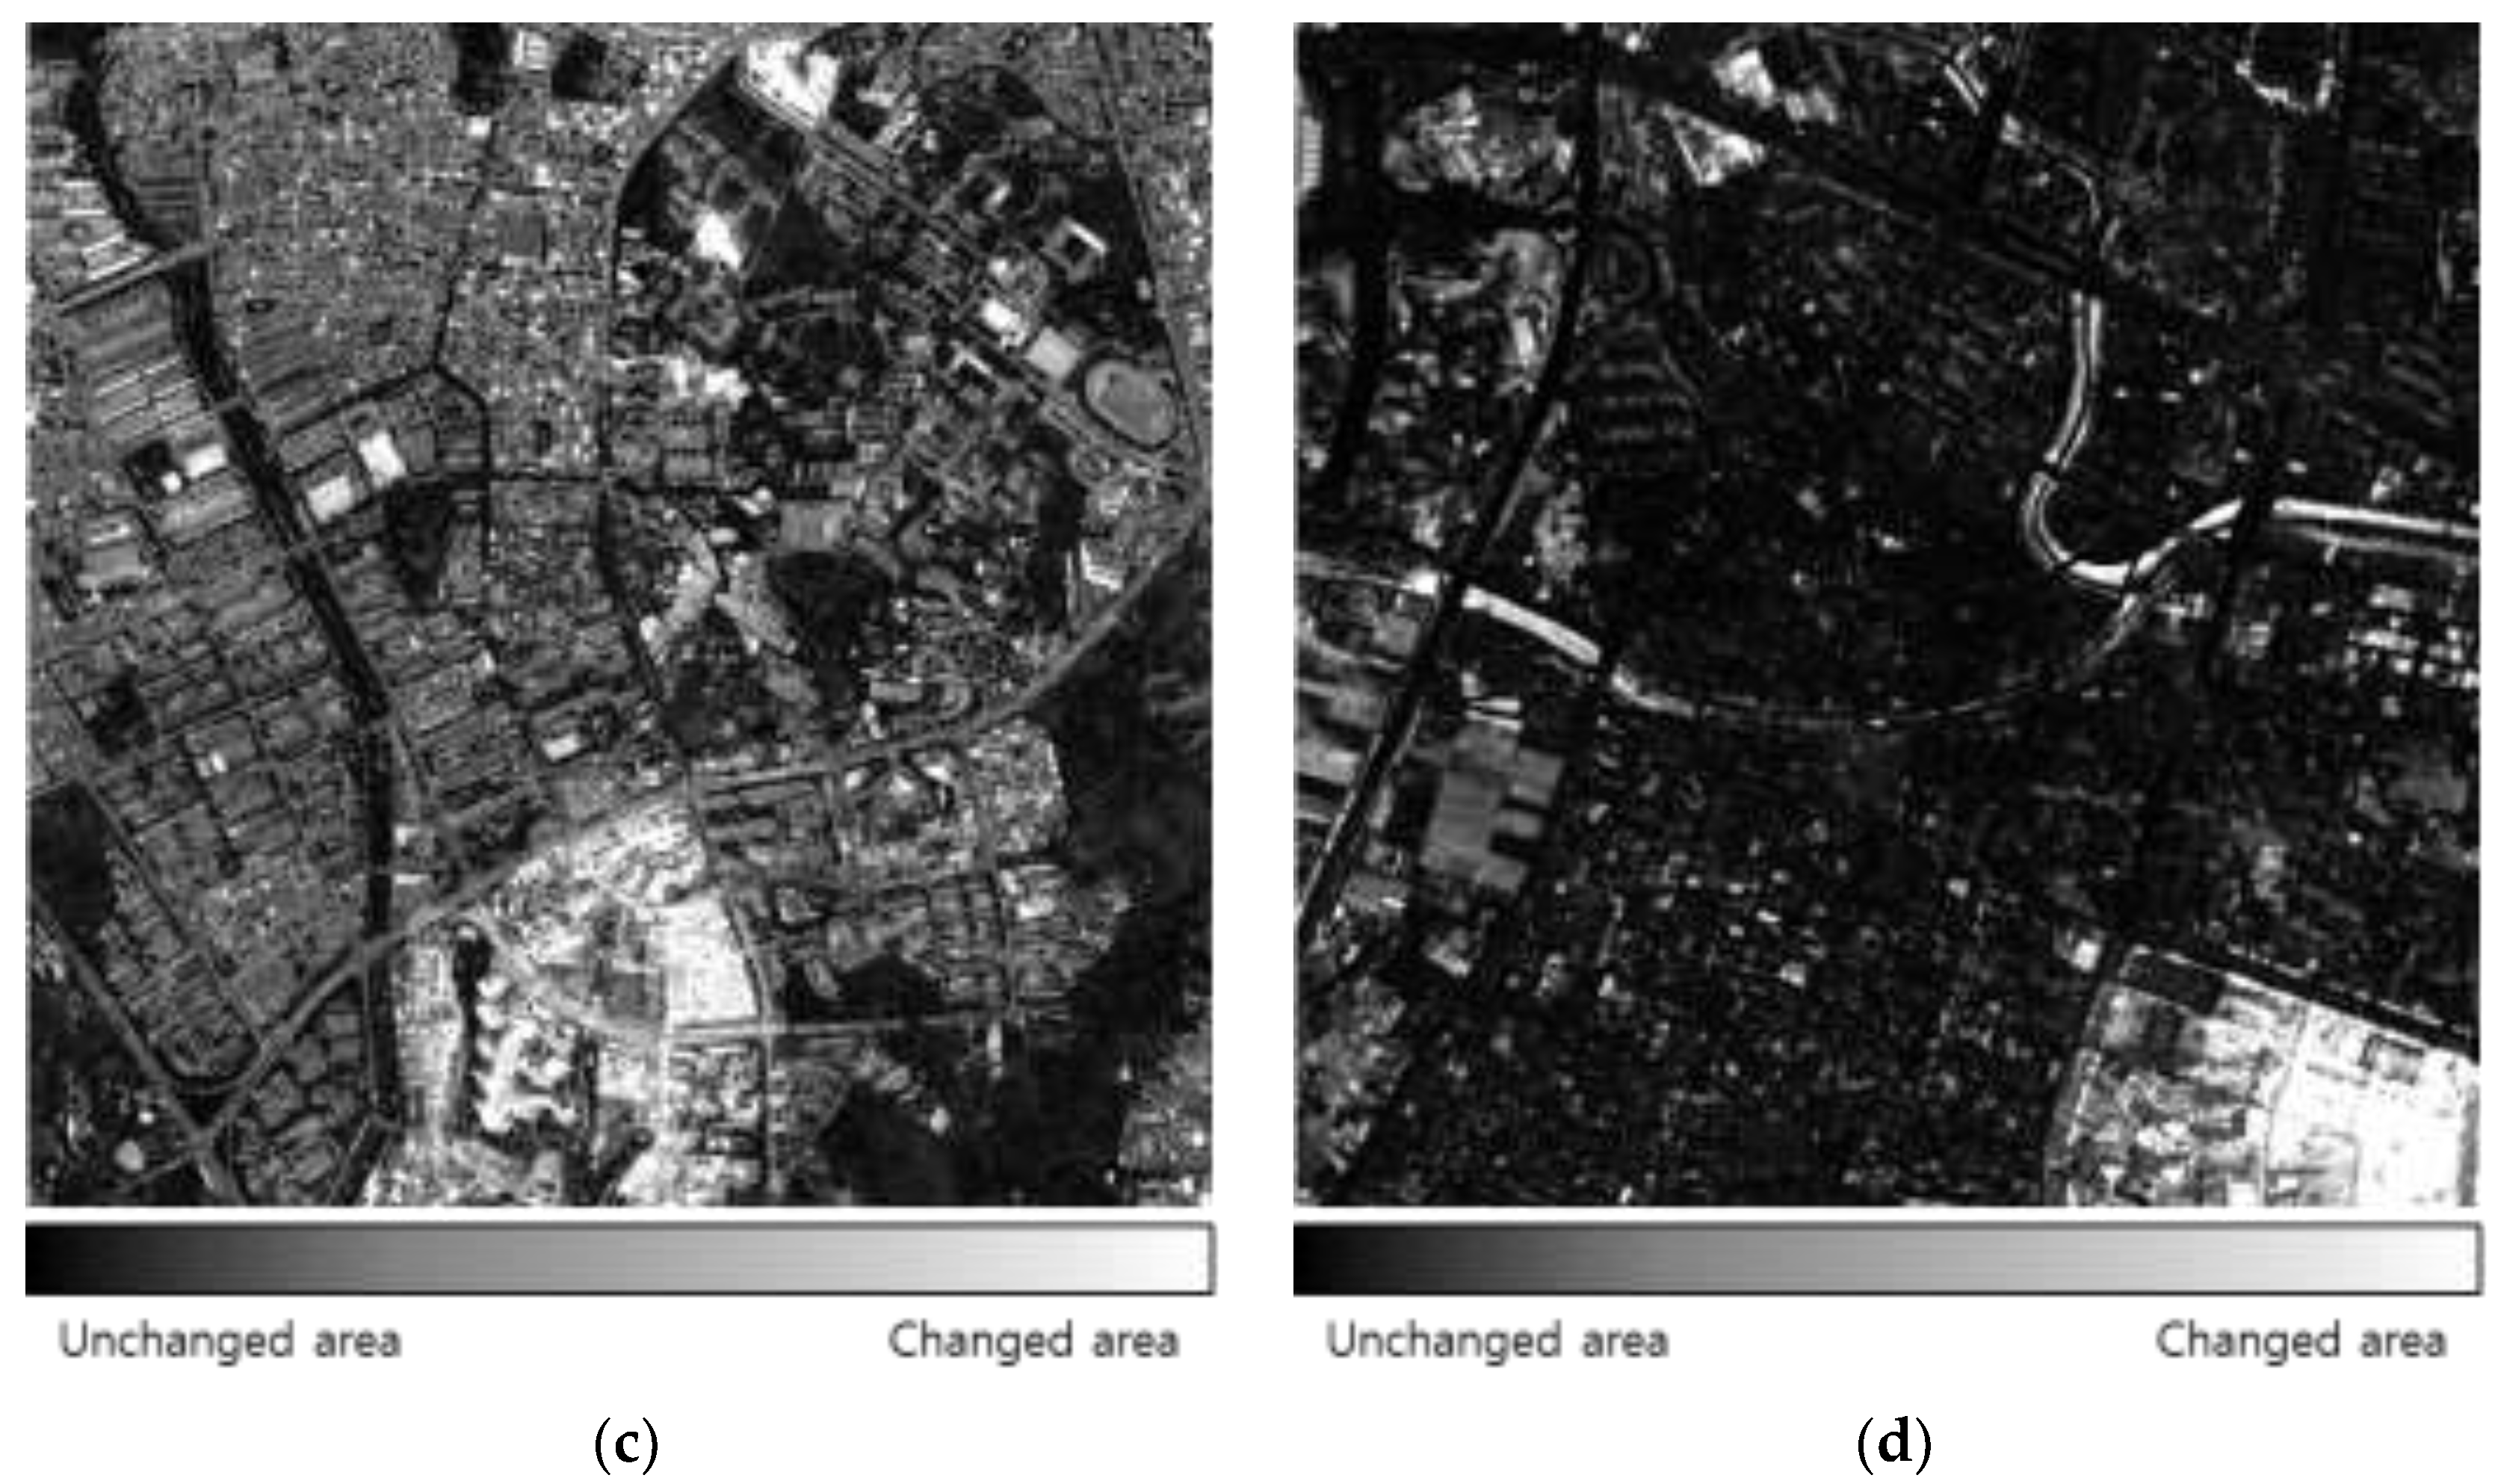
Figure 10.
S2CVA results: (a) magnitude using cross-sharpened images of Site 1, (b) magnitude using cross-sharpened images of Site 2, (c) magnitude fused with direction using cross-sharpened images of Site 1, and (d) magnitude fused with direction using cross-sharpened images of Site 2.
Figure 10.
S2CVA results: (a) magnitude using cross-sharpened images of Site 1, (b) magnitude using cross-sharpened images of Site 2, (c) magnitude fused with direction using cross-sharpened images of Site 1, and (d) magnitude fused with direction using cross-sharpened images of Site 2.


Figure 11.
ROC curve results for (a) Site 1 and (b) Site 2.

Figure 12.
Binary change detection results based on threshold selection: (a) binary image using only pan-sharpened images of Site 1, (b) binary image using only the magnitude of cross-sharpened images of Site 1, (c) binary image using fused magnitude and the direction of cross-sharpened images of Site 1, (d) binary image using only pan-sharpened images of Site 2, (e) binary image using only the magnitude of cross-sharpened images of Site 2, and (f) binary image using fused magnitude and the direction of cross-sharpened images of Site 2.


Table 1.
Specifications of the KOMPSAT-2 satellite imagery.
| Launch | 28 July 2006 |
|---|---|
| Ground sampling distance | Panchromatic: 1.0 m Multispectral: 4.0 m |
| Spectral bands | Panchromatic: 500–900 nm MS1 (Blue): 450–520 nm MS2 (Green): 520–600 nm MS3 (Red): 630–690 nm MS4 (NIR): 760–900 nm |
| Swath width | 15 km (nadir) |
| Radiometric resolution | 11 bits |
Table 2.
Descriptions of experimental datasets.
| Site 1 (Cheongju) | Site 2 (Daejeon) | ||
|---|---|---|---|
| Image size | 2400 × 2400 | 2000 × 2000 | |
| Acquisition date | Before change | 18 November 2008 | 5 October 2007 |
| After change | 21 May 2012 | 12 April 2011 | |
Table 3.
Results of the pan-sharpening accuracy evaluation.
| Algorithm | ERGAS | SAM | UIQI | |
|---|---|---|---|---|
| GSA | Time 1 (before change) | 3.5798 | 1.7084 | 0.6943 |
| Time 2 (after change) | 3.0608 | 1.9015 | 0.6795 | |
| GS2 | Time 1 | 2.7289 | 1.1826 | 0.7825 |
| Time 2 | 2.4152 | 1.4444 | 0.7529 | |
| NDVI-based algorithm | Time 1 | 2.7742 | 1.4072 | 0.7899 |
| Time 2 | 2.5982 | 1.5166 | 0.7521 | |
Table 4.
Area under the curve (AUC) calculation results.
| Algorithm | AUC |
|---|---|
| GSA | 0.7290 |
| GS2 | 0.7433 |
| NDVI-based algorithm | 0.7464 |
Table 5.
AUC calculation results.
| Study Area | Change Detection | AUC |
|---|---|---|
| Site 1 | Magnitude using only pan-sharpened images | 0.7464 |
| Magnitude using cross-sharpened images | 0.8070 | |
| Magnitude fused with direction using cross-sharpened images | 0.8272 | |
| Site 2 | Magnitude using only pan-sharpened images | 0.8192 |
| Magnitude using cross-sharpened images | 0.9342 | |
| Magnitude fused with direction using cross-sharpened images | 0.9456 |
Table 6.
Results of calculating the confusion matrix of Site 1.
| Using Only Pan-Sharpened Images | Using only the Magnitude of Cross-Sharpened Images | Using Fused Magnitude and the Direction of Cross-Sharpened Images | |||||
|---|---|---|---|---|---|---|---|
| Ground Truth | Ground Truth | Ground Truth | |||||
| Changed | Unchanged | Changed | Unchanged | Changed | Unchanged | ||
| Change detection map | Changed | 320494 | 1295246 | 103913 | 65526 | 349142 | 765278 |
| Unchanged | 210088 | 3934172 | 426669 | 5163892 | 181440 | 4464140 | |
| Detection rate | 0.604 | 0.196 | 0.658 | ||||
| False alarm rate | 0.248 | 0.012 | 0.146 | ||||
| Overall accuracy | 0.739 | 0.914 | 0.836 | ||||
Table 7.
Results of calculating the confusion matrix of Site 2.
| Using Only Pan-Sharpened Images | Using Only the Magnitude of Cross-Sharpened Images | Using Fused Magnitude and the Direction of Cross-Sharpened Images | |||||
|---|---|---|---|---|---|---|---|
| Ground Truth | Ground Truth | Ground Truth | |||||
| Changed | Unchanged | Changed | Unchanged | Changed | Unchanged | ||
| Change detection map | Changed | 138236 | 1138727 | 114519 | 219431 | 161276 | 605647 |
| Unchanged | 39315 | 2683722 | 63032 | 3603018 | 16275 | 3216802 | |
| Detection rate | 0.779 | 0.645 | 0.908 | ||||
| False alarm rate | 0.298 | 0.057 | 0.158 | ||||
| Overall accuracy | 0.705 | 0.929 | 0.844 | ||||
© 2018 by the authors. Licensee MDPI, Basel, Switzerland. This article is an open access article distributed under the terms and conditions of the Creative Commons Attribution (CC BY) license (http://creativecommons.org/licenses/by/4.0/).
Share and Cite
MDPI and ACS Style
Park, H.; Choi, J.; Park, W.; Park, H. Modified S2CVA Algorithm Using Cross-Sharpened Images for Unsupervised Change Detection. Sustainability 2018, 10, 3301. https://0-doi-org.brum.beds.ac.uk/10.3390/su10093301
AMA Style
Park H, Choi J, Park W, Park H. Modified S2CVA Algorithm Using Cross-Sharpened Images for Unsupervised Change Detection. Sustainability. 2018; 10(9):3301. https://0-doi-org.brum.beds.ac.uk/10.3390/su10093301
Chicago/Turabian StylePark, Honglyun, Jaewan Choi, Wanyong Park, and Hyunchun Park. 2018. "Modified S2CVA Algorithm Using Cross-Sharpened Images for Unsupervised Change Detection" Sustainability 10, no. 9: 3301. https://0-doi-org.brum.beds.ac.uk/10.3390/su10093301
Note that from the first issue of 2016, this journal uses article numbers instead of page numbers. See further details here.