Article

Integration between GIS and Multi-Criteria Analysis for Ecosystem Services Assessment: A Methodological Proposal for the National Park of Cilento, Vallo di Diano and Alburni (Italy)

1
Department of Humanities, Suor Orsola Benincasa University, via Santa Caterina da Siena 37, I-80135 Naples, Italy
2
Department of Architecture, University of Naples Federico II, via Toledo 402, I-80134 Naples, Italy
*
Author to whom correspondence should be addressed.
Sustainability 2018, 10(9), 3329; https://0-doi-org.brum.beds.ac.uk/10.3390/su10093329
Submission received: 30 July 2018 / Revised: 5 September 2018 / Accepted: 15 September 2018 / Published: 18 September 2018
(This article belongs to the Special Issue Sustainable Land Uses and Rural Governance)

Abstract

:
Ecosystem services play a fundamental role in society; their characteristics and the production of their natural generated capital are fundamental elements in the functioning of the support system of life on Earth. The loss of ecosystem services contributes to food and energy uncertainty, increases vulnerability to natural disasters, such as floods or tropical storms, decreases the level of health, reduces the availability and quality of water resources and affects cultural heritage. This study has conducted a quantitative estimate of ecosystem services and their evaluation for a wide, complex and sensitive area: The National Park of Cilento, Vallo di Diano and Alburni, in Southern Italy. The assessment has been undertaken via a preliminary, partial evaluation model and further through the TOPSIS method. Research results have led to a scenario highlighting a dualism on the territory shaped by the differences between internal and coastal areas, defining themselves as complementary and necessary to each other. To improve the sustainable use of territorial resources, it is necessary to adopt policies and strategies from those that are available, always taking into account any possible conflict between conservation and development.

Graphical Abstract

1. Introduction

1.1. Ecosystem Services Approaches

It is well known that ecosystems provide humankind with several benefits called “ecosystem services”. They can be understood as the direct and indirect contribution of ecosystems to human well-being [1,2].
Services produced by ecosystems include, food, water, fuels and timber for example. They include water supply and air purification, natural waste recycling, soil formation, pollination and many other natural regulatory mechanisms.
The Millennium Ecosystem Assessment has defined ecosystem services as multiple benefits provided by ecosystems to humankind and distinguishes four categories [3]:
(1)
Supporting life: These functions collect all the services necessary for the production of all other ecosystem services and contribute to the conservation (in situ) of biological and genetic diversity, and evolutionary processes.
(2)
Regulating: In addition to maintaining the health and functioning of ecosystems, regulatory functions collect many other services that involve direct and indirect benefits for humans (such as climate stabilization and recycling of waste), usually not recognized until they are lost or degraded.
(3)
Provisioning: These functions collect all the resource supply services that natural and semi-natural ecosystems produce (i.e., oxygen, water, food, etc.).
(4)
Cultural values: Natural ecosystems provide an essential “consultation function” and contribute to the maintenance of human health through the provision of opportunities for reflection, spiritual enrichment, cognitive development, and recreational and aesthetic experiences.
Ecosystem services also represent a significant portion of the “total economic value” of the planet. However, these services are not completely included in the market and are not adequately quantified in terms of their comparison to economic services and human-made capital [4]. For this reason, they are often undervalued in decision-making policies. In reality, the economies of the world would suffer a slow downturn without the vital support of ecosystem services. Ecological economics has identified a new approach to assessing the resources of a territory, thanks to which it will be possible to provide a common model able to divide the benefits of the different services provided by ecosystems and quantify them, taking into account the global changes in the short, medium and long term. The first step towards a reasoned assessment of ecosystem goods and services lies in a translation of ecological complexity into a limited number of ecosystem functions. These functions, which can be referred to as biological, habitat and system properties, or ecosystem processes, in turn, provide the goods and services that are valued by humans.
In the literature the concept of “ecosystem function” has been subjected to various interpretations, of which are sometimes contradictory. Thus, the best way to understand ecosystem functions is to recognize them as a subset of ecological processes and ecosystem structures. Each function is the result of a natural process characteristic of the ecological subsystem, of which it forms a part. The natural processes, in turn, are the result of a complex interaction between the biotic components (constituted by living organisms) and abiotic constituents (consisting of physical-chemical and inorganic factors) of an ecosystem through the universal forces that regulate matter and power. The concept of ecosystem functions, thus, lays the foundation for the classification of aspects of natural ecosystems that are potentially useful for humankind. Hence, ecosystem functions are translated into ecosystem goods and services when a possible human value is involved, in regards to feedback on their state of well-being and prosperity. Knowing the total economic value of resources and environmental assets is, therefore, important to verify the rationality of development choices [5,6], to give value to environmental protection policies and to identify the most fragile regions where change is most likely. Currently, the planning tools instead start from an analysis of the state of environmental resources, neglecting the ecosystem processes and the dynamic interactions of the processes themselves. Above all, the relationships of ecosystem services with economic and social factors are often underestimated. Furthermore, sector-based planning (e.g., water management plans) is not coordinated, since there is a division of responsibility among different administrative entities; for example, between regional and local levels. The ecosystem service paradigm, therefore, can be the basis for a revision of economic terms with which to consider the territory and its capitals through territorial planning that is more aware of the significance of ecological processes and more oriented towards a real and lasting sustainability.
According to Layke et al. [7], ecosystem services indicators are policy-relevant to identify gaps and communicate trends for information on sustainable or unsustainable use of these services and, consequently, the benefits of maintaining them for future generations.
In March 2007, during the Summit of Potsdam, the ministers of the environment of the main world economies agreed on the need to promote a global study on comparing the costs of the possible loss of biodiversity with those derived from effective conservation measures. The study that resulted, “The Economics of Ecosystems and Biodiversity” (TEEB), is an initiative from the European Commission [8]. The TEEB interim report from May 2008, assessed the annual loss of ecosystem services at 50 billion euros. According to this report, if the current scenario remains unchanged, in terms of the loss of just terrestrial biodiversity by 2050, the cost would be equal to 7% of GDP, with a substantial loss in the services provided by marine ecosystems. The report contains recommendations, such as the adoption of measures to end environmentally harmful subsidies and the creation of “markets” for ecosystem services.
In Italy, it is also possible to start a quantitative ecological analysis, not only for the mapping and quantification of these services, but also to set up an economic evaluation of them, with specific reference to biodiversity.
In a study published in the journal Ecological Indicators [9], based on expert opinions and the so-called “benefit transfer” method, it was estimated that each year, Italian ecosystems provide benefits (goods and services) worth € 71.3 billion. The most interesting result of the study was not the absolute figure, as the dynamics of losses or gains that are occurring in the Italian provinces are due to the change in land use. In just 10 years (between 1990 and 2000), some provinces lost 7.5% of the buffer capacity of damaging events (with intense rainfall, these provinces will have more damage from hydrogeological instability) and 9.5% of the assimilation of pollutants (being equal emissions, e.g., dusty, these areas will have longer permanence of pollutants, with greater damage to human health and the environment.) In the Italian context, ecosystem services have, in the past, mainly been protected by regulatory tools. They are also placed on other economic instruments, including market instruments, even if we are far from having found a balance and, above all, a consistency in the application of an appropriate mix of instruments. In Italy, according to an ISPRA study, an Institute of the Ministry of the Environment [10], the loss of biodiversity and ecosystem services is currently recognised as a risk factor for the transmission of bacterial, viral and parasitic diseases to humans, livestock, crops and animal and plant wildlife. The forest area is increasing, and the number of fires is decreasing. If a portion of Italian territory re-appropriates hectares of forest, another landslide will endanger lives and human activities; here are 5708 (equal to 70.5% of the total) Italian municipalities affected by subsidence and landslides, so appropriate policies, approaches and tools are necessary to increase the sustainable use of natural resources.

1.2. Ecosystem Services Assessment

It often happens that decision makers do not have sufficient spatially defined information [11] regarding certain themes, such as ecosystem services, and their assessment. The approach of ecosystem services, the multiple benefits provided by nature to humankind, makes it possible to determine a balanced evaluation of environmental, economic, ecological and social resources [12]. In this context, the conservation of nature can be defined as the protection of the natural wealth of the landscape [13]. Ecological assessments allow the support of decision-making processes related to the conservation of natural capital, in that they make possible the identification of the areas in which the adoption of conservative approaches is a priority, thus, allowing the creation of a useful link between ecological and spatial planning [14]. In this perspective, it is necessary to experiment with tools that, used in synergistic optics, are able to generate win-win solutions. In the past decade, research on mapping ecosystem services has grown substantially, with a focus on modelling them, in particular, through initiatives such as the Natural Capital Project and the Ecosystem Services Partnership. This increased interest has led to the inclusion of ecosystem services not only in conservation policies but also in the business sector [15].
Several approaches have been developed with the aim of mapping ecosystem services. One of them derives information directly from maps of land use and land cover or from habitat maps [16,17]. Another common approach is based on the study of ecosystem services values through spatially explicit maps [4]. Furthermore, there are also more recent approaches based on biological data and finally, integrated approaches; for example, those developed by the Natural Capital approach through the InVEST tool [18].
It is necessary to analyze the landscape structure and its land uses to represent the spatial distribution of ecosystems and the services they provide, with the aim of ensuring the survival of species and nature conservation [19]. Indeed, the natural capital of a territory is a crucial component for social welfare and economic development. Knowing the distribution of such assets, in terms of ecosystem services, allows the definition and identification of the most compatible uses linked to natural resources, together with management strategies, to ensure the conservation and increase of these resources. The evaluation of the supply and demand for ecosystem services can then raise awareness in the decision-making phase [20], selecting those actions that can ensure the conservation of the local natural capital, thus, avoiding unexpected consequences [21].
Therefore, in recent years the amount of research on the concept and evaluation of ecosystem services has grown [22,23]. From the sustainable design of modern cities to the environmental impact assessment of projects, addressing the concept of ecosystem services has become fundamental in predicting how changes in land use can affect the distribution of land resources [24,25,26,27,28]. In particular, various methods have been proposed for the mapping and qualitative, quantitative and monetary evaluation of ecosystem services. There are several types of instruments: Some are aimed at biophysical, some economic, and others mixed. Another distinction is relative to the global or local reference scale and to the spatially explicit representation of ecological values and biophysical parameters. The following is a quick review of the most significant assessment tools:
  • ARIES (Artificial Intelligence for Ecosystem Services) is a project established with the aim of providing an assessment of ecosystem services useful for the understanding and quantification of environmental assets and factors that influence their values, for specific geographical areas and according to user needs and priorities [29]. It is a web-based, open-source technology, offered to users all over the world, capable of coding ecological and socio-economic knowledge to map the provision of ecosystem services, including scenario assessment and economic evaluation.
  • SolVES (Social Values for Ecosystem Services) is a tool designed to evaluate, map and quantify social values perceived, in particular, of a cultural type, such as aesthetics and recreation [30]. The aim is to provide a tool for public decision-makers and researchers to assess the social value of ecosystems and to facilitate discussions among various stakeholders regarding the trade-offs between the different management options in a variety of contexts, physical and social, ranging from forest or pastures to coasts and seas.
  • TESSA (Toolkit for Ecosystem Service Site-Based Assessments) is a manual for the analysis of ecosystem services [31]. It provides practical guidance on how to identify significant ecosystem services in an area, and what data is needed to measure them. It also describes which sources or methods to use to find them and how to communicate results to stakeholders. The manual places particular emphasis on the importance of comparing the results of alternative scenarios to fully understand the consequences of different choices. In drafting the method, the guideline combines simplicity and functionality with communication with decision-makers. The model excludes some aspects related to the concept of ecosystem services in order to be accessible to non-experts, but at the same time provides solid information. It does not provide maps, nor is it applicable on different scales.
  • InVEST (Integrated Valuation of Ecosystems Services and Tradeoffs) is an open-source technology developed by Stanford University (in collaboration with The Nature Conservancy and World Wildlife Fund) within the Natural Capital Project [18]. It can measure, estimate and map the potential of ecosystems in the provision of goods and services that humans receive. The purpose of InVEST is to support decision-makers in the evaluation of trade-offs associated with various policy options, and in identifying areas where investments in ecosystem services can improve human development and ecosystem conservation. The outputs provided, in fact, describe the natural resources in terms of biophysical supply, services that benefit human beings and a projection of their socio-economic value. The outputs, therefore, provide a framework for governments, companies, conservation organizations and other bodies to assess the impact of their decisions on the environment and on human wellbeing.
However, in spite of the new approaches and available tools, in Italy, the assessment of ecosystem services has not yet been inserted within the planning and management processes of the territory [32] in a structured way, except for some example virtuosos and experiments already underway [33,34]. Reticence and operational difficulties persist, such as insufficient data for territorial analyses. It should be added that, in Italy, territory planning is often too fragmented by a division of responsibilities between subjects, administrative levels and sectors of government that prevent an organic vision, which is essential to determine the changes that involve the environment and the health of biodiversity in an integrated way.
Therefore, in order to offer technicians and decision-makers a tool that supports territorial planning, or policies (at different levels of scale) that can be easy to use, an approach has been trialed using a widespread open-source software and versatile, that is QGIS. The data actually available for the territorial context in question was considered and a Geographical Information System (GIS) was constructed containing the supply and demand data for the different categories of ecosystem services, and for the municipal areas of the National Park of Cilento, Vallo di Diano and Alburni, located in Southern Italy. Moreover, using a VectorMCDA plugin of QGIS developed by the Environmental Laboratory of the University of Perugia [35], partial assessments of each ecosystem service could be agreed to obtain summary maps (with regard to supply services, regulation services and cultural heritage) for the various municipalities of the Park.
In particular, the VectorMCDA plugin contains seven algorithms that refer to many multi-criteria evaluation methods [36] and, in this case, taking into account the quantitative nature of the available data, the TOPSIS method was used (Technique for Order of Preference by Similarity to Ideal Solution), explained by the “geo-TOPSIS” algorithm. The maps obtained highlight the areas in which the demand for ecosystem services, and those in which deficits are highlighted, are best met. Therefore, it has been possible to deduce the services to be increased or protected in order to activate management policies suitable for the territory, which are, therefore, effective for stimulating the supply of these ecosystem services.
The use of the geo-TOPSIS algorithm has already been successfully tested in other territorial classification contexts [37,38], as well as the integration between GIS and multi-criteria evaluation systems and methods, has proven particularly useful in the evaluation of “landscape services” inside the National Park of Cilento, Vallo di Diano and Alburni [39].

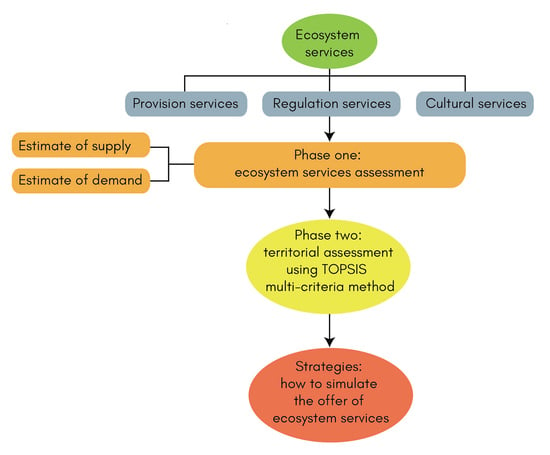
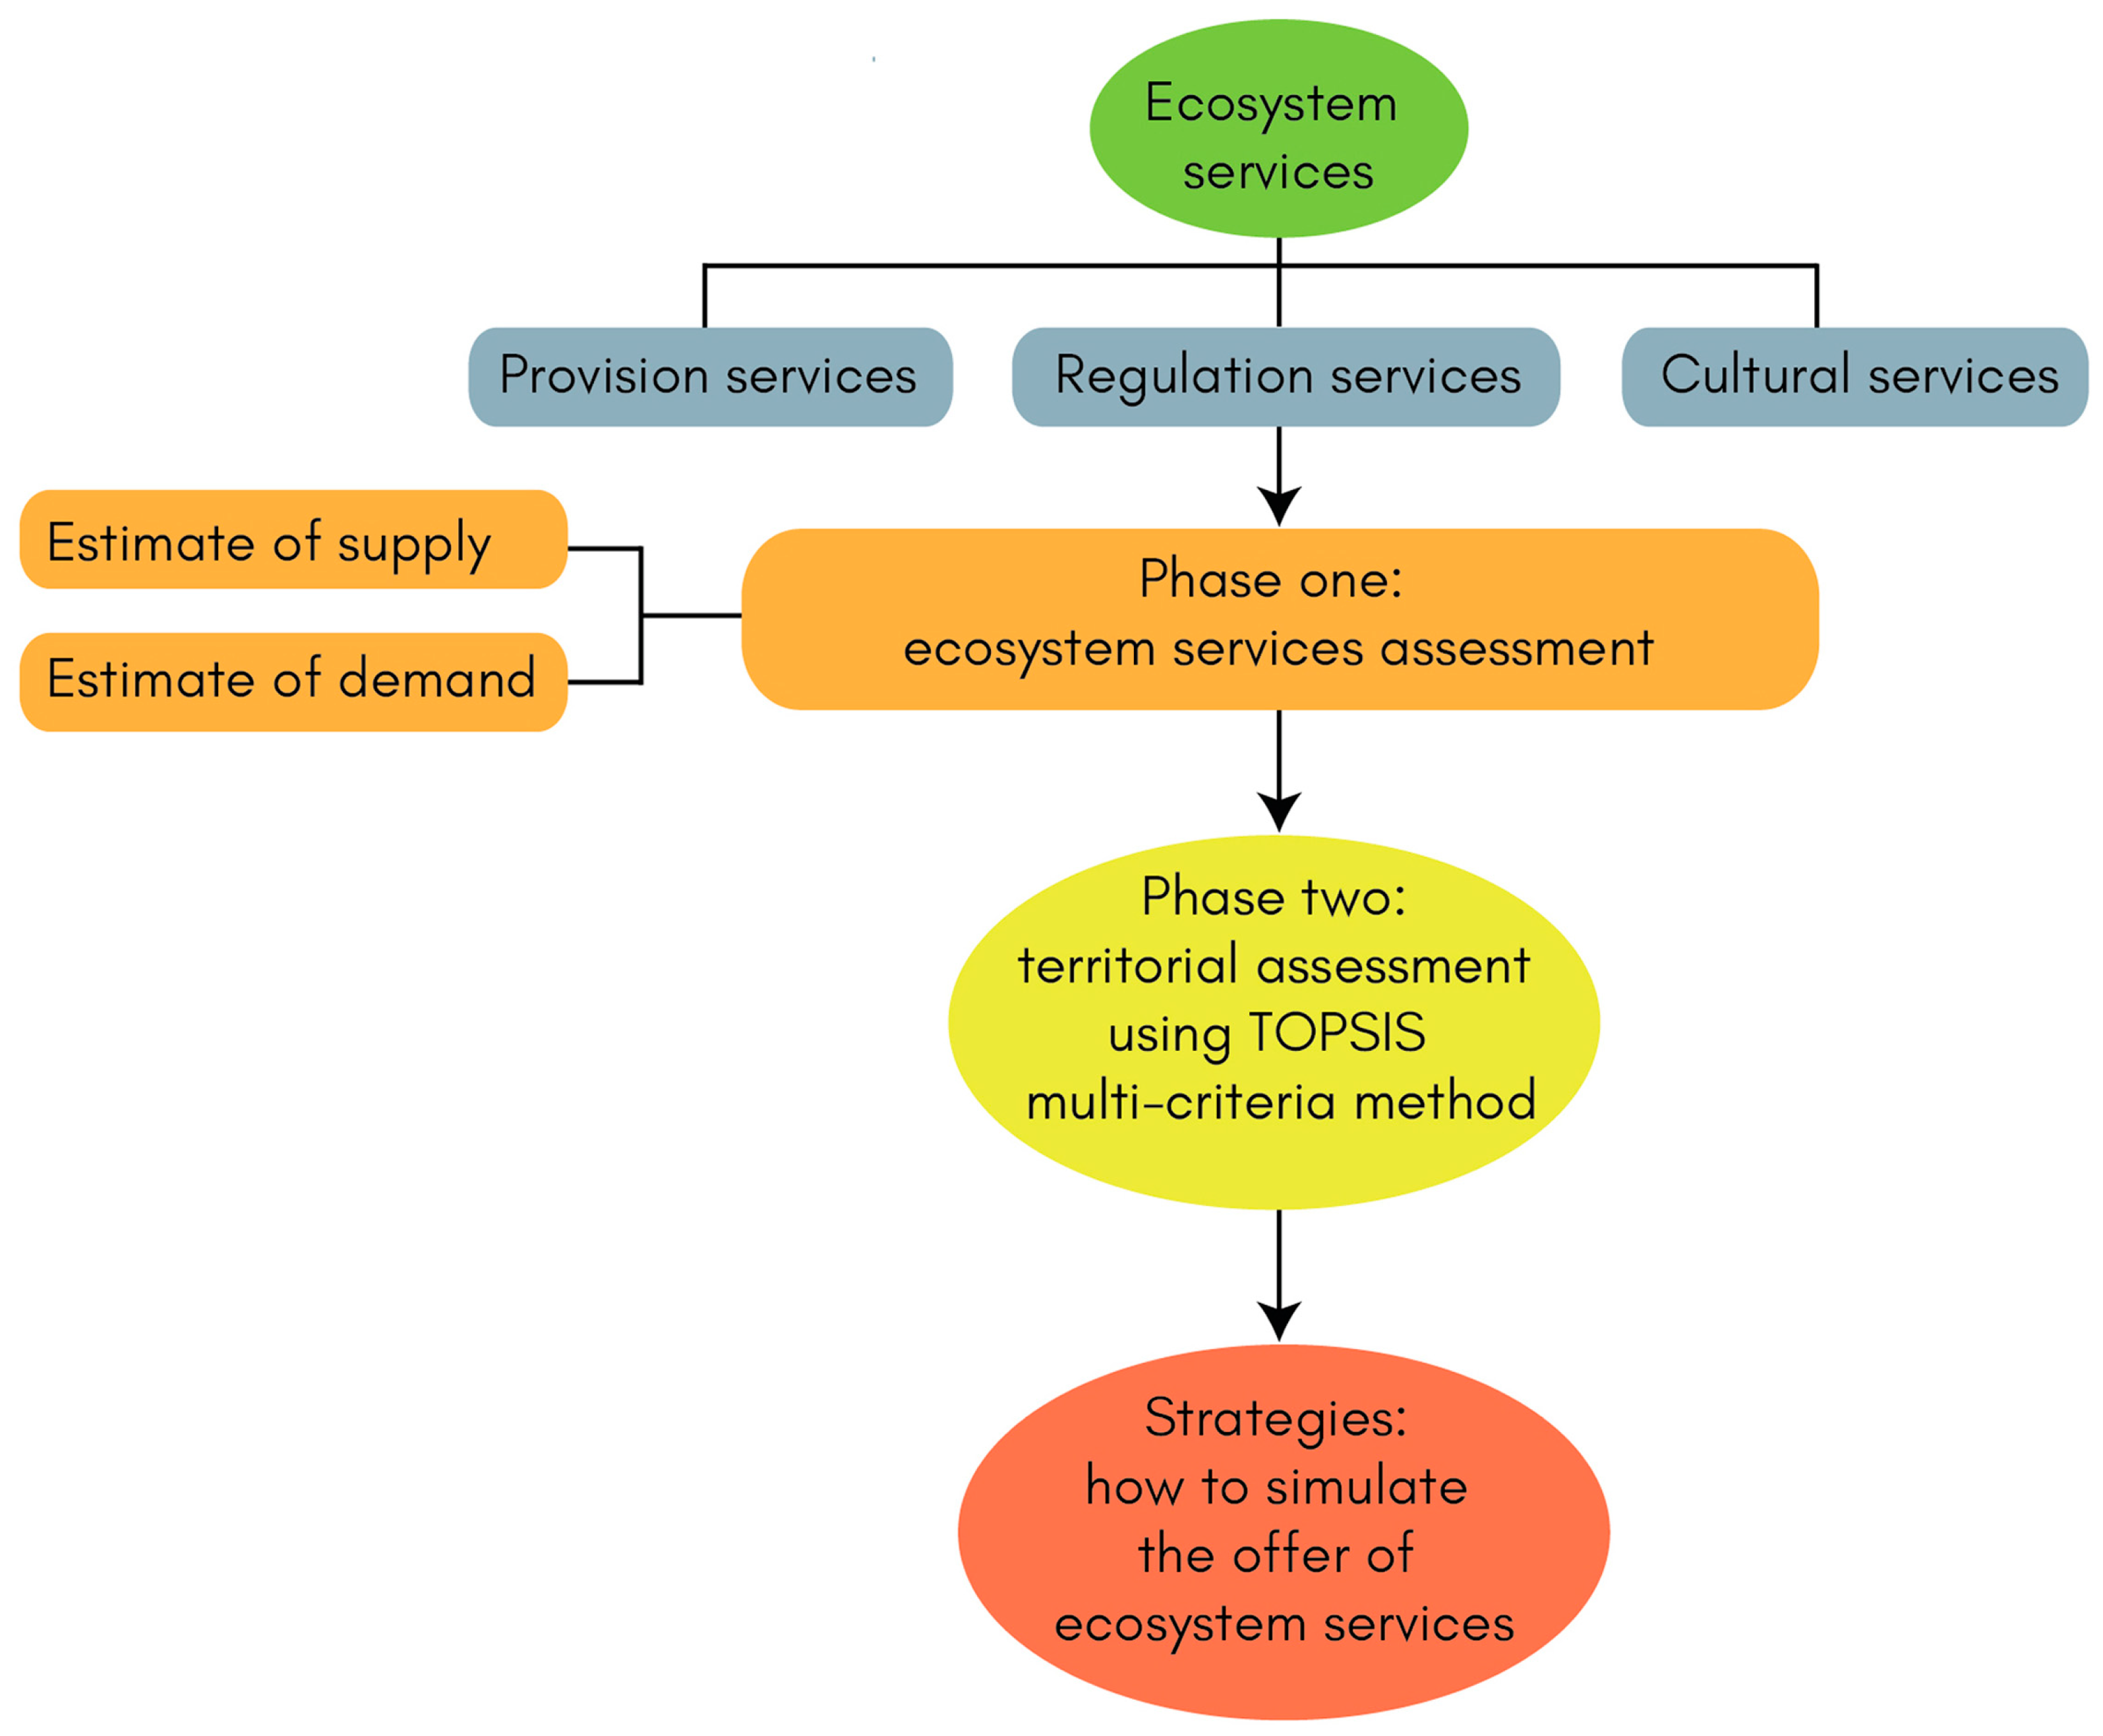
2. Materials and Methods
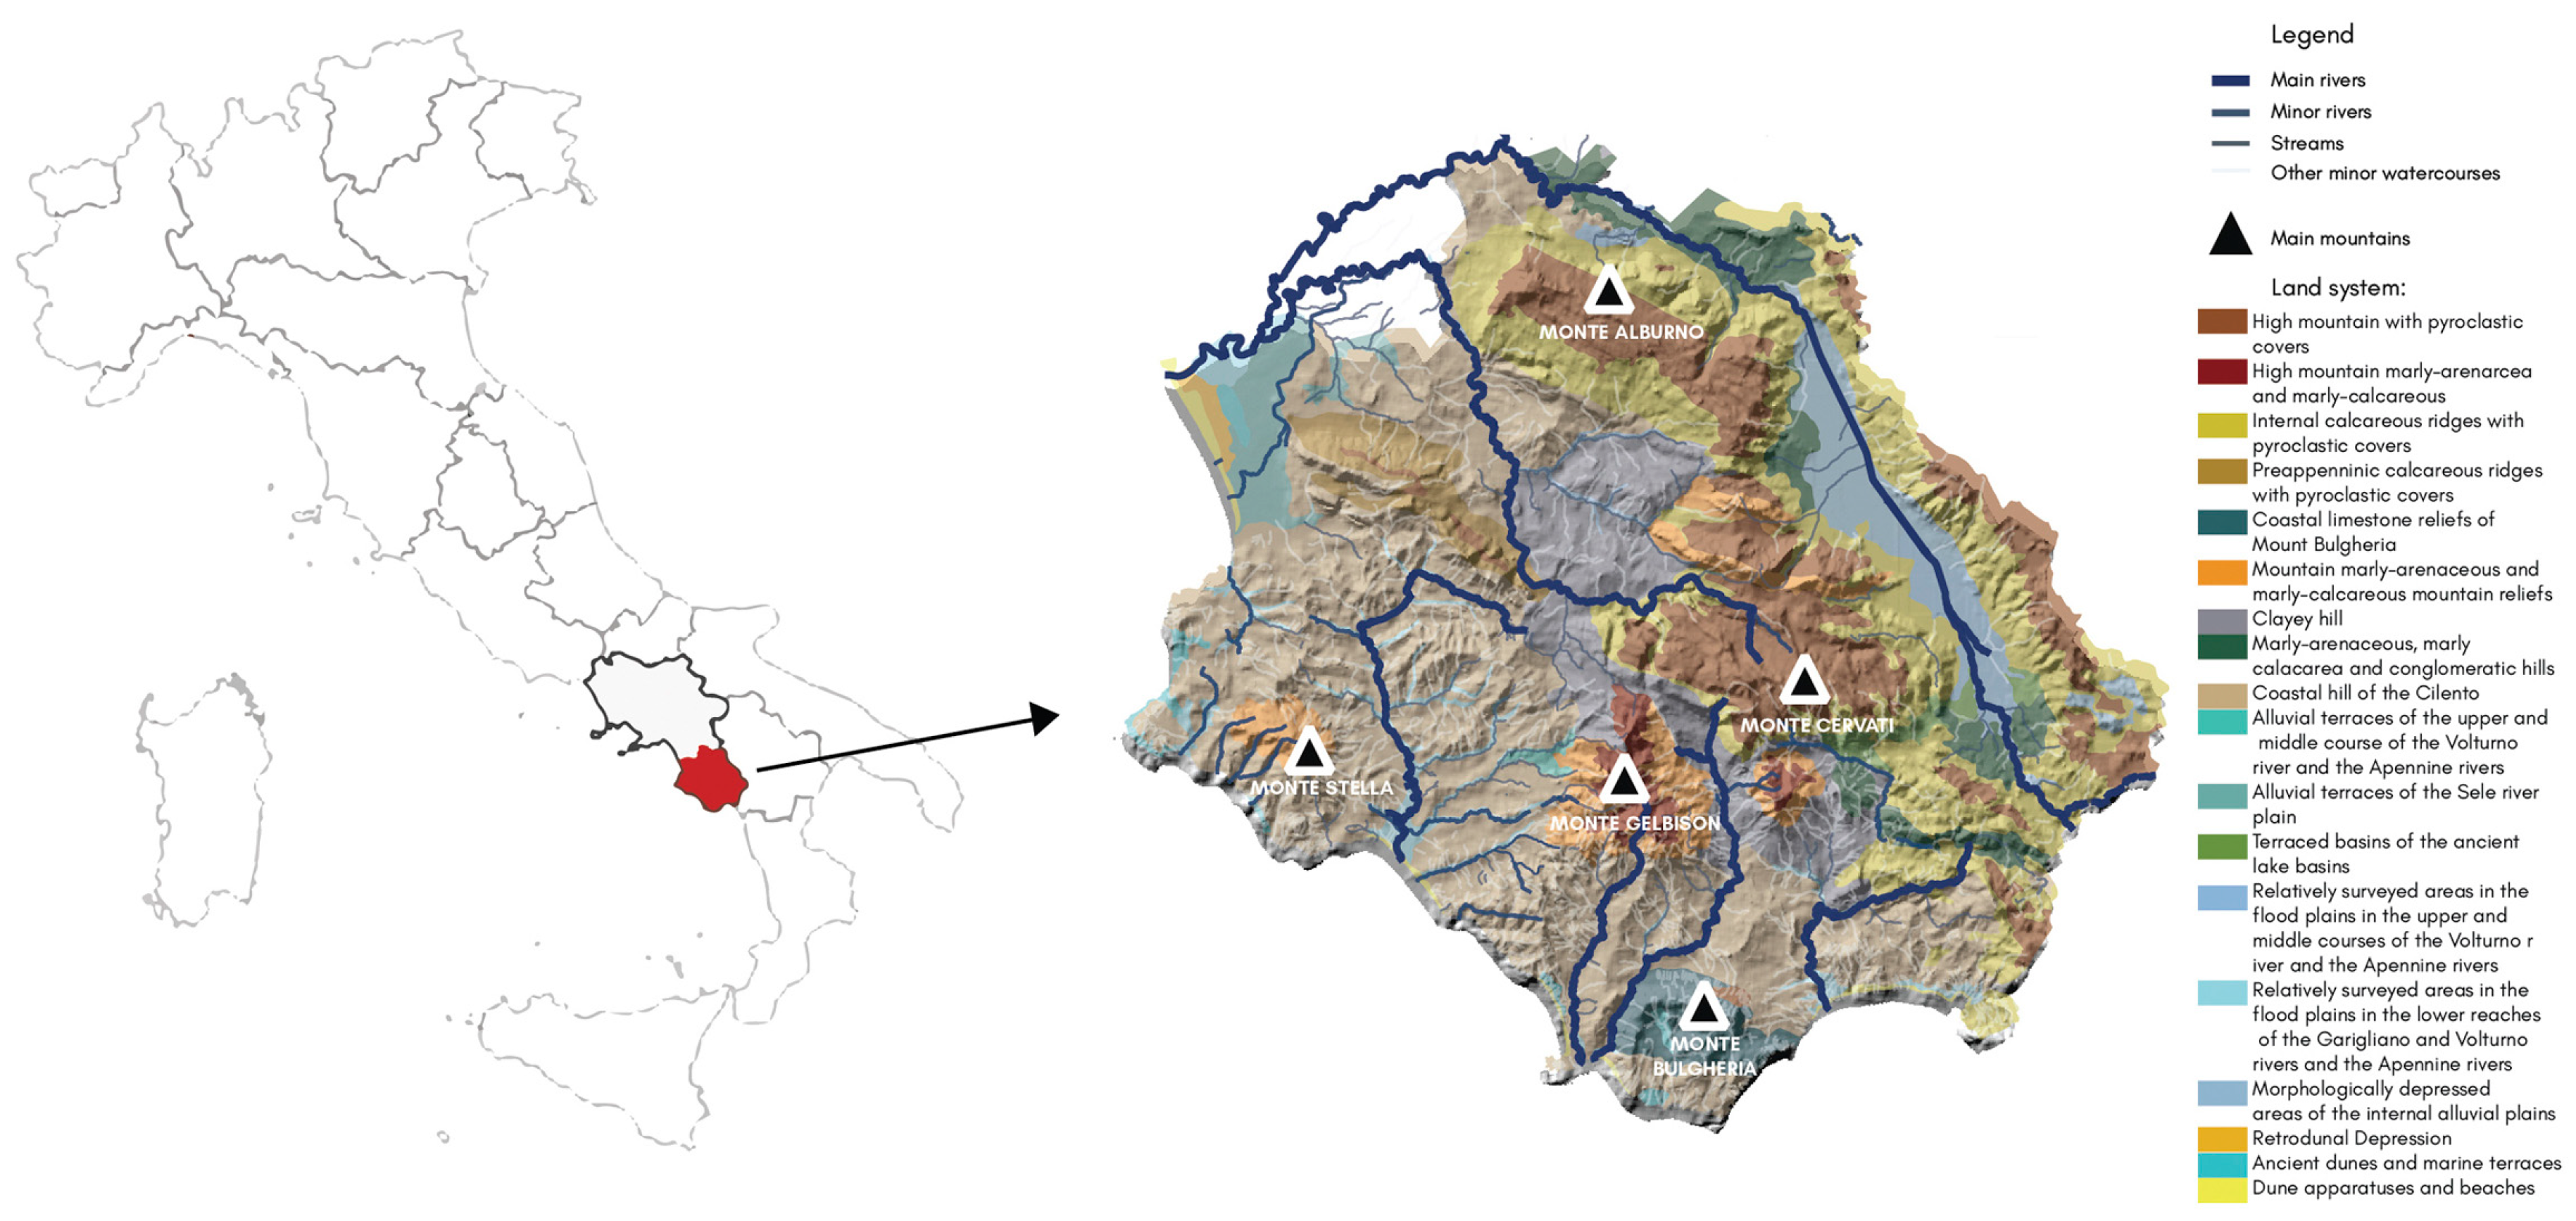
2.1. Study Area

The study area is the National Park of Cilento, Vallo di Diano and Alburni (NPCVDA) (Figure 1), the second most extended Italian park comprised of 181.048 hectares. It lies within the administrative limits of the Campania Region and, in particular, of the Province of Salerno. Due to its particular characteristics, the Cilento sub-region represents one of the most important Italian bio-geographical complexes.
The peculiar geographic position of the protected natural area, comprising of coasts, water courses and the mountain massifs, give the territory a variegated orography expressed in a remarkable variety and complexity of environments. The park was administratively established in 1991; its territory includes 80 municipalities and 15 contiguous areas.
In 1997, just a few years after its establishment, NPCVDA was unanimously included in the prestigious network of UNESCO biosphere reserves of the MAB Programme (Man and Biosphere). The inscription into the MAB network, with the creation of the Park Biosphere Reserve, also brings an interesting novelty to the panorama of Italian protected areas, identifying specific areas of conservation located within the perimeter of a widely extended area. The entire park region, following the application of the MAB-UNESCO program directives, has been assumed to be of trans-national and global importance since a “pact” was stipulated as a priority to guarantee and safeguard the connections among different ecosystems, characterizing the concept of “network”.
Biodiversity conservation is recognised as of universal value and, to this end, NPCVDA acts as a “laboratory of life” in relation to its vast biological heritage. It is an eminent and representative example of the ecological and biological process of the Mediterranean ecosystems, enclosed in just one park, a community of plants and animals ranging from marine forms to terrestrial, arid, semi-arid, Nordic, Atlantic, Asian, hill and high mountainous areas. With its intact coasts rich in caves and inlets, its mountains characterized by karst phenomena, and in the richness of unique endemic plant species, it represents an area not only of natural beauty but also of exceptional scientific importance.
NPCVDA also has extraordinary cultural values: In 1998, together with the archaeological sites of Paestum and Velia and the Padula Certosa, the park was included in the world heritage list, as a “cultural landscape”. The outstanding universal value of the site results from the combined work of Nature and Man, thereby falling within the subcategory of evolutionary landscapes. In fact, the natural assets reached their shape through a combination of historical, social, economic, artistic and spiritual events.
Moreover, together with Soria in Spain, Koroni in Greece and Chefchaouen in Morocco, the NPCVDA belongs to the sites of the so-called Mediterranean Diet, inscribed in the UNESCO intangible cultural heritage list since November 2010.
Finally, it is part of the European network of UNESCO Geoparks, embracing relevant geological sites of particular importance in terms of scientific quality, rarity, aesthetic relevance and their archaeological, naturalistic, historical and cultural interest. Over millennia, Cilento has been continuously inhabited; in fact, there is evidences of settlements dating back 25,000 years.
NPCVDA is the only Mediterranean protected area to hold simultaneous status’ as a National Park, inserted in World Network of Biosphere Reserves and declared a World Heritage Site. The main conservation objective that the park is required to pursue is the conservation of biodiversity, playing an important role in developing awareness of the relationship between conservation and development. However, at the same time, man-nature synergy is one of the most exclusive aspects of the park and among the most complex relationships to protect and manage too.

2.2. Data Sources and Approach

Territory analyses were built on a DEM (Digital Elevation Model) cartography downloaded from the National Geoportal site with a 75 m resolution [40], on which the information extracted from the PTR (the territorial regional plan of Campania Region) has been overlaid [41]. The data for the elaboration of the thematic maps of each ecosystem service has been researched in several websites, such as ISTAT (Italian National Statistical Institute) for socio-economic data [42,43,44]; INEA (Italian National Institute for Agricultural Economy) for the coefficients and calculation indices [45]; Campania Region for specific elements mapping; PTA (Campania Region Water Protection Plan) for data on water quality [46]; ISPRA (Higher Institute for Environmental Protection and Research); INFC (National Inventory of the Forests) [47]; Revenue Agency for economic estimation data [48]; Life+ MGN (Making Good Natura) [49]. Having collected territorial data on ecosystem services—divided into provision services, regulation services and cultural values—we have estimated supply and demand, then obtained an evaluation for each ecosystem service by calculating the ratio between them (“partial evaluation”). This ratio has been divided into five classes of satisfaction for each municipality of the park (“phase one”). Subsequently, all the ratios obtained—i.e., for each ecosystem service and for each municipality—have been analyzed with the TOPSIS method in QGIS. The graphic restitution of the evaluation of ecosystem services is highlighted by color gradations: The municipalities that approach the ideal point and that, therefore, better satisfy the offer of the ecosystem service taken into consideration (“phase two”), are in green. The results obtained suggest intervention strategies to stimulate the supply of ecosystem services. The adopted methodological approach is shown in Figure 2.

2.3. Phase One: Partial Assessment of Ecosystem Services

The scarce data availability concerning the territory under examination, allowed the analysis of only some of the ecosystem services for each category (C) which, in turn, contains sub-categories.
The examined categories are the following:
  • C1. Provision: Crops, fodder and pasture, wood and fibers, non-wood forest products, water.
  • C2. Regulation: CO2 sequestration, water purification, air purification.
  • C3. Cultural values: Maps of concentration of environmental, cultural, recreational assets and food and wine peculiarities.
For each of the ecosystem services sub-categories, an initial partial evaluation was carried out by assessing the environment’s provision of the service and the demand from consumers based on the available data. The aim was to create comparable maps to obtain an overall assessment and propose solutions, strategies and policies to protect, enhance or increase the supply of ecosystem services.
Once the maps concerning the estimate of supply and demand had been realized, the partial evaluation of ecosystem services from the ratio obtained through the calculation of the division of the QGIS field calculator was derived. It was obtained from the determination of 5 classes of ecosystem service satisfaction where values are included from 0 to 25 (when the service is “low”), from 26 to 50 (when the service is “medium-low”), from 51 to 75 (when the service is “medium”), from 76 to 100 (when it is “medium-high”), and finally more than 100 when the service is classed as “high”. The graphic restitution of the partial evaluation is a semaphore gradient that goes from the best condition (indicated in green) to the worst (indicated in red).

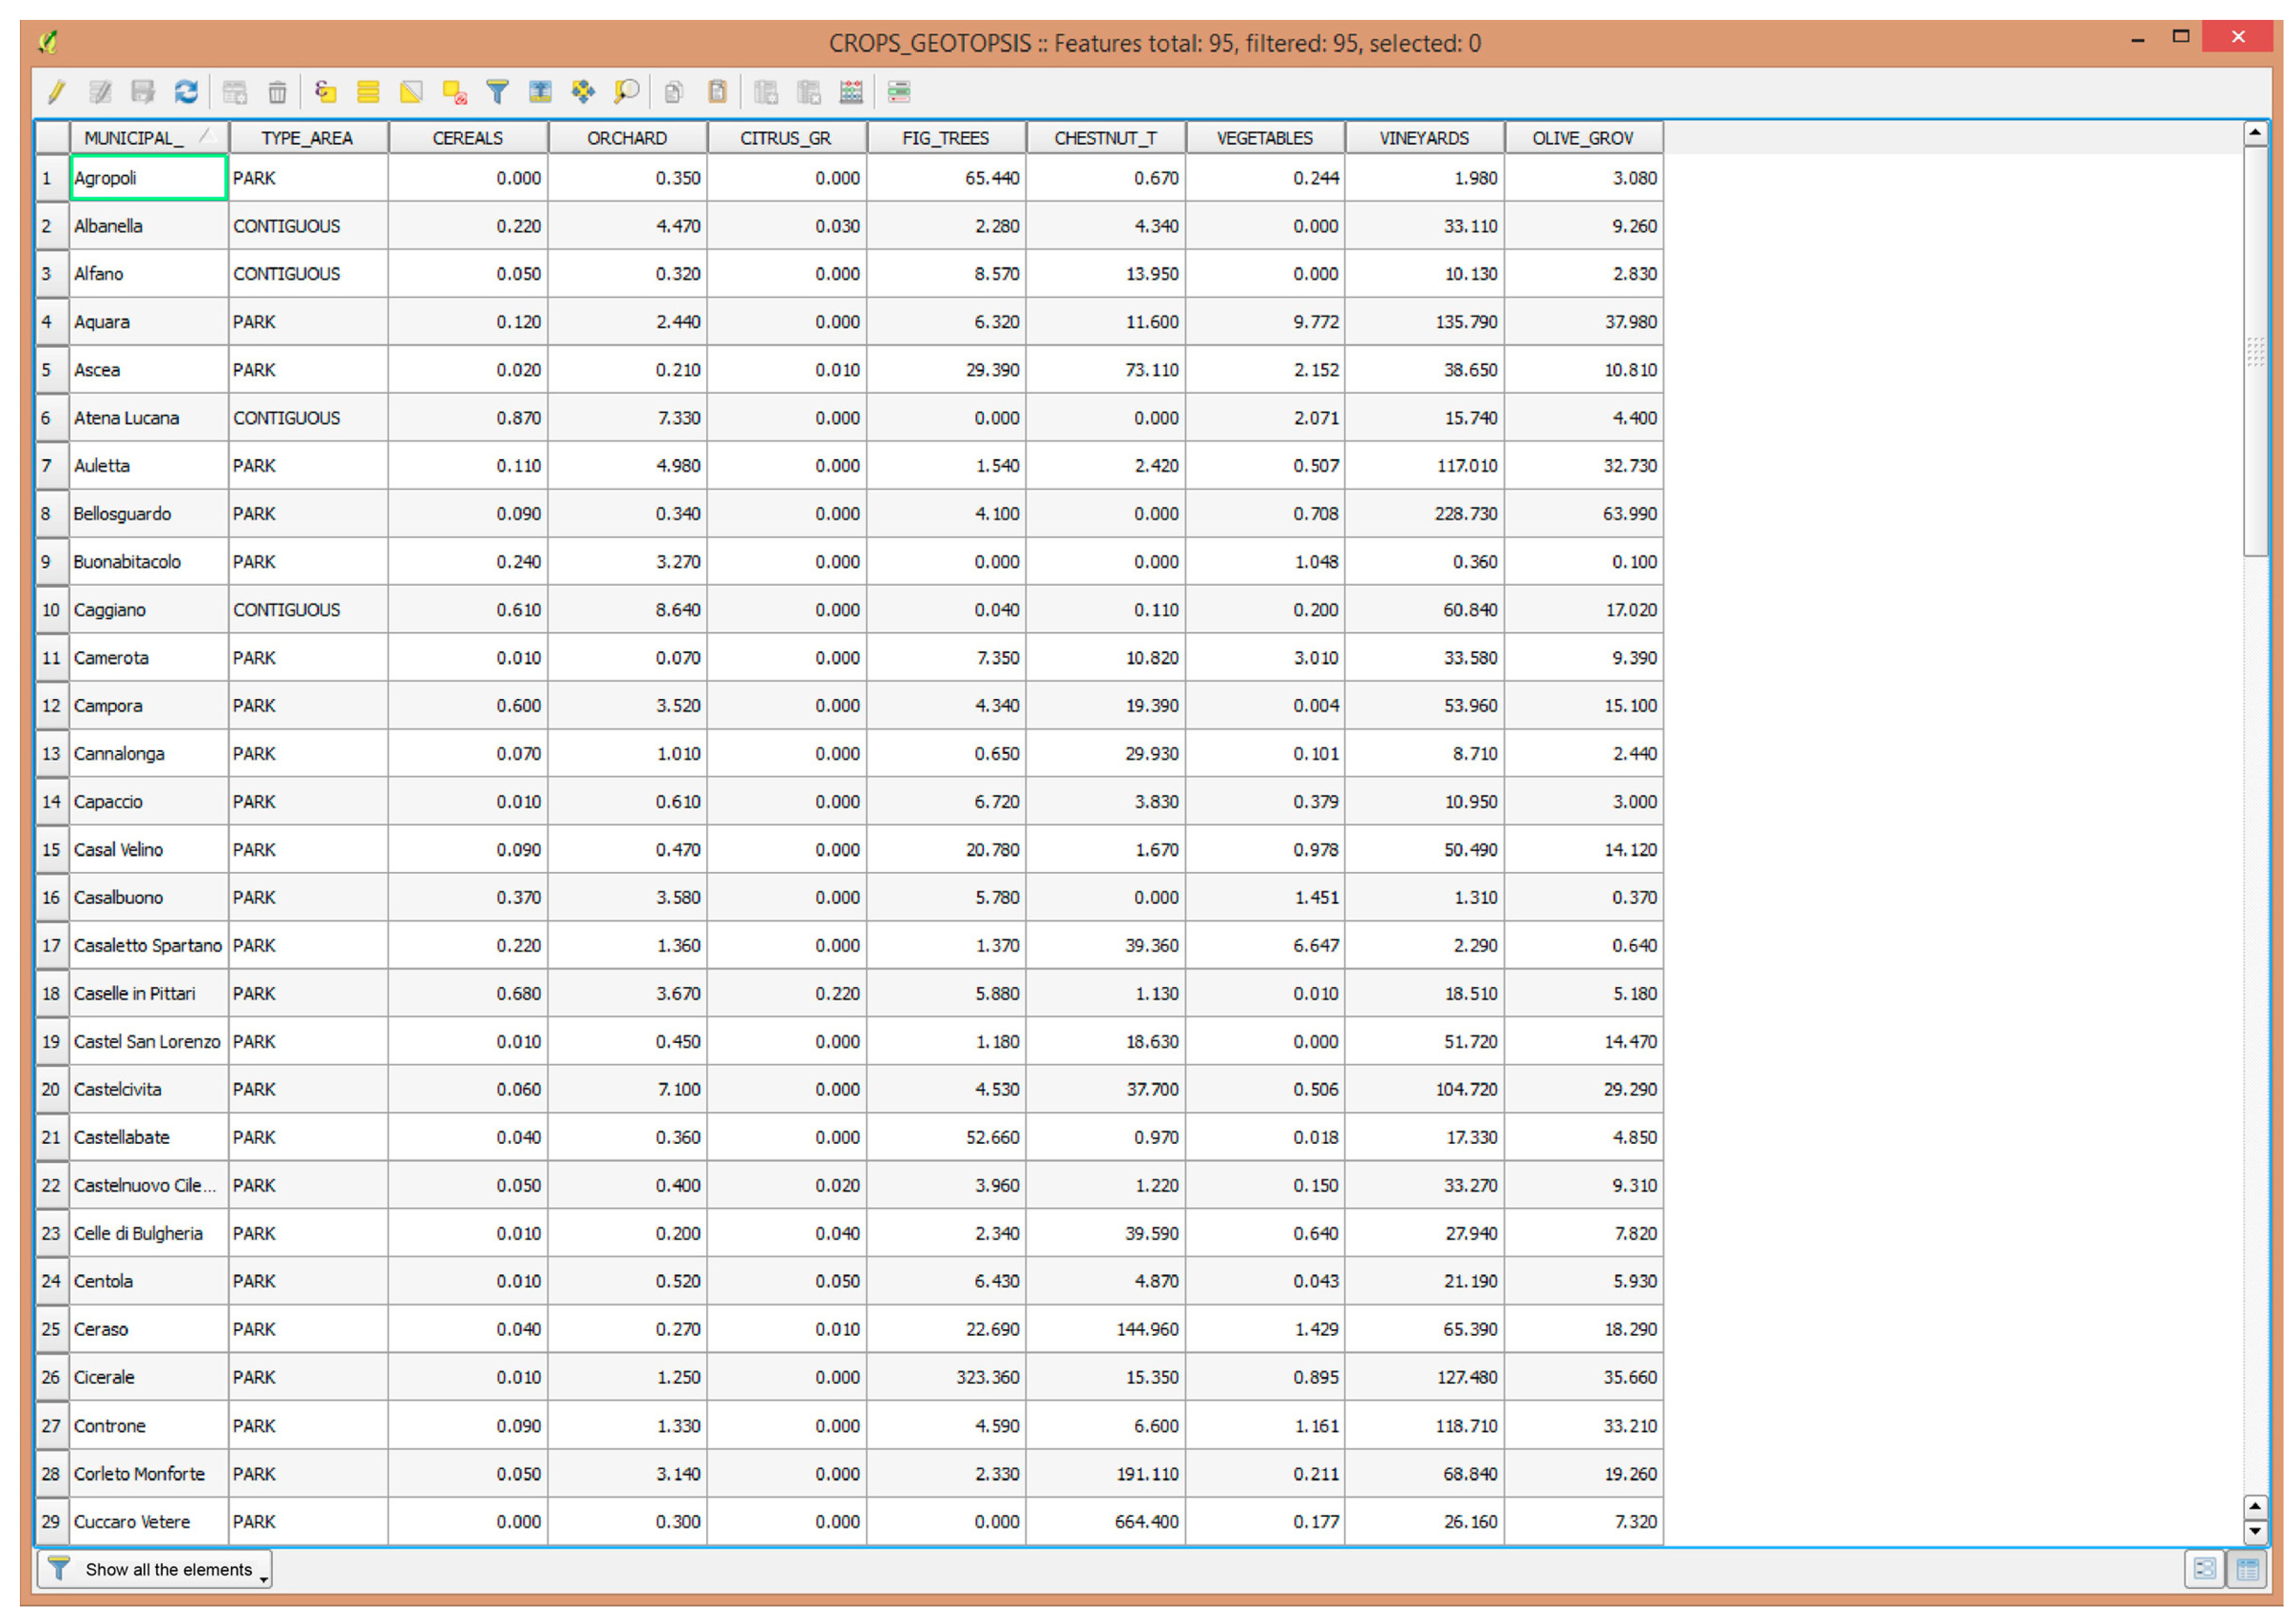
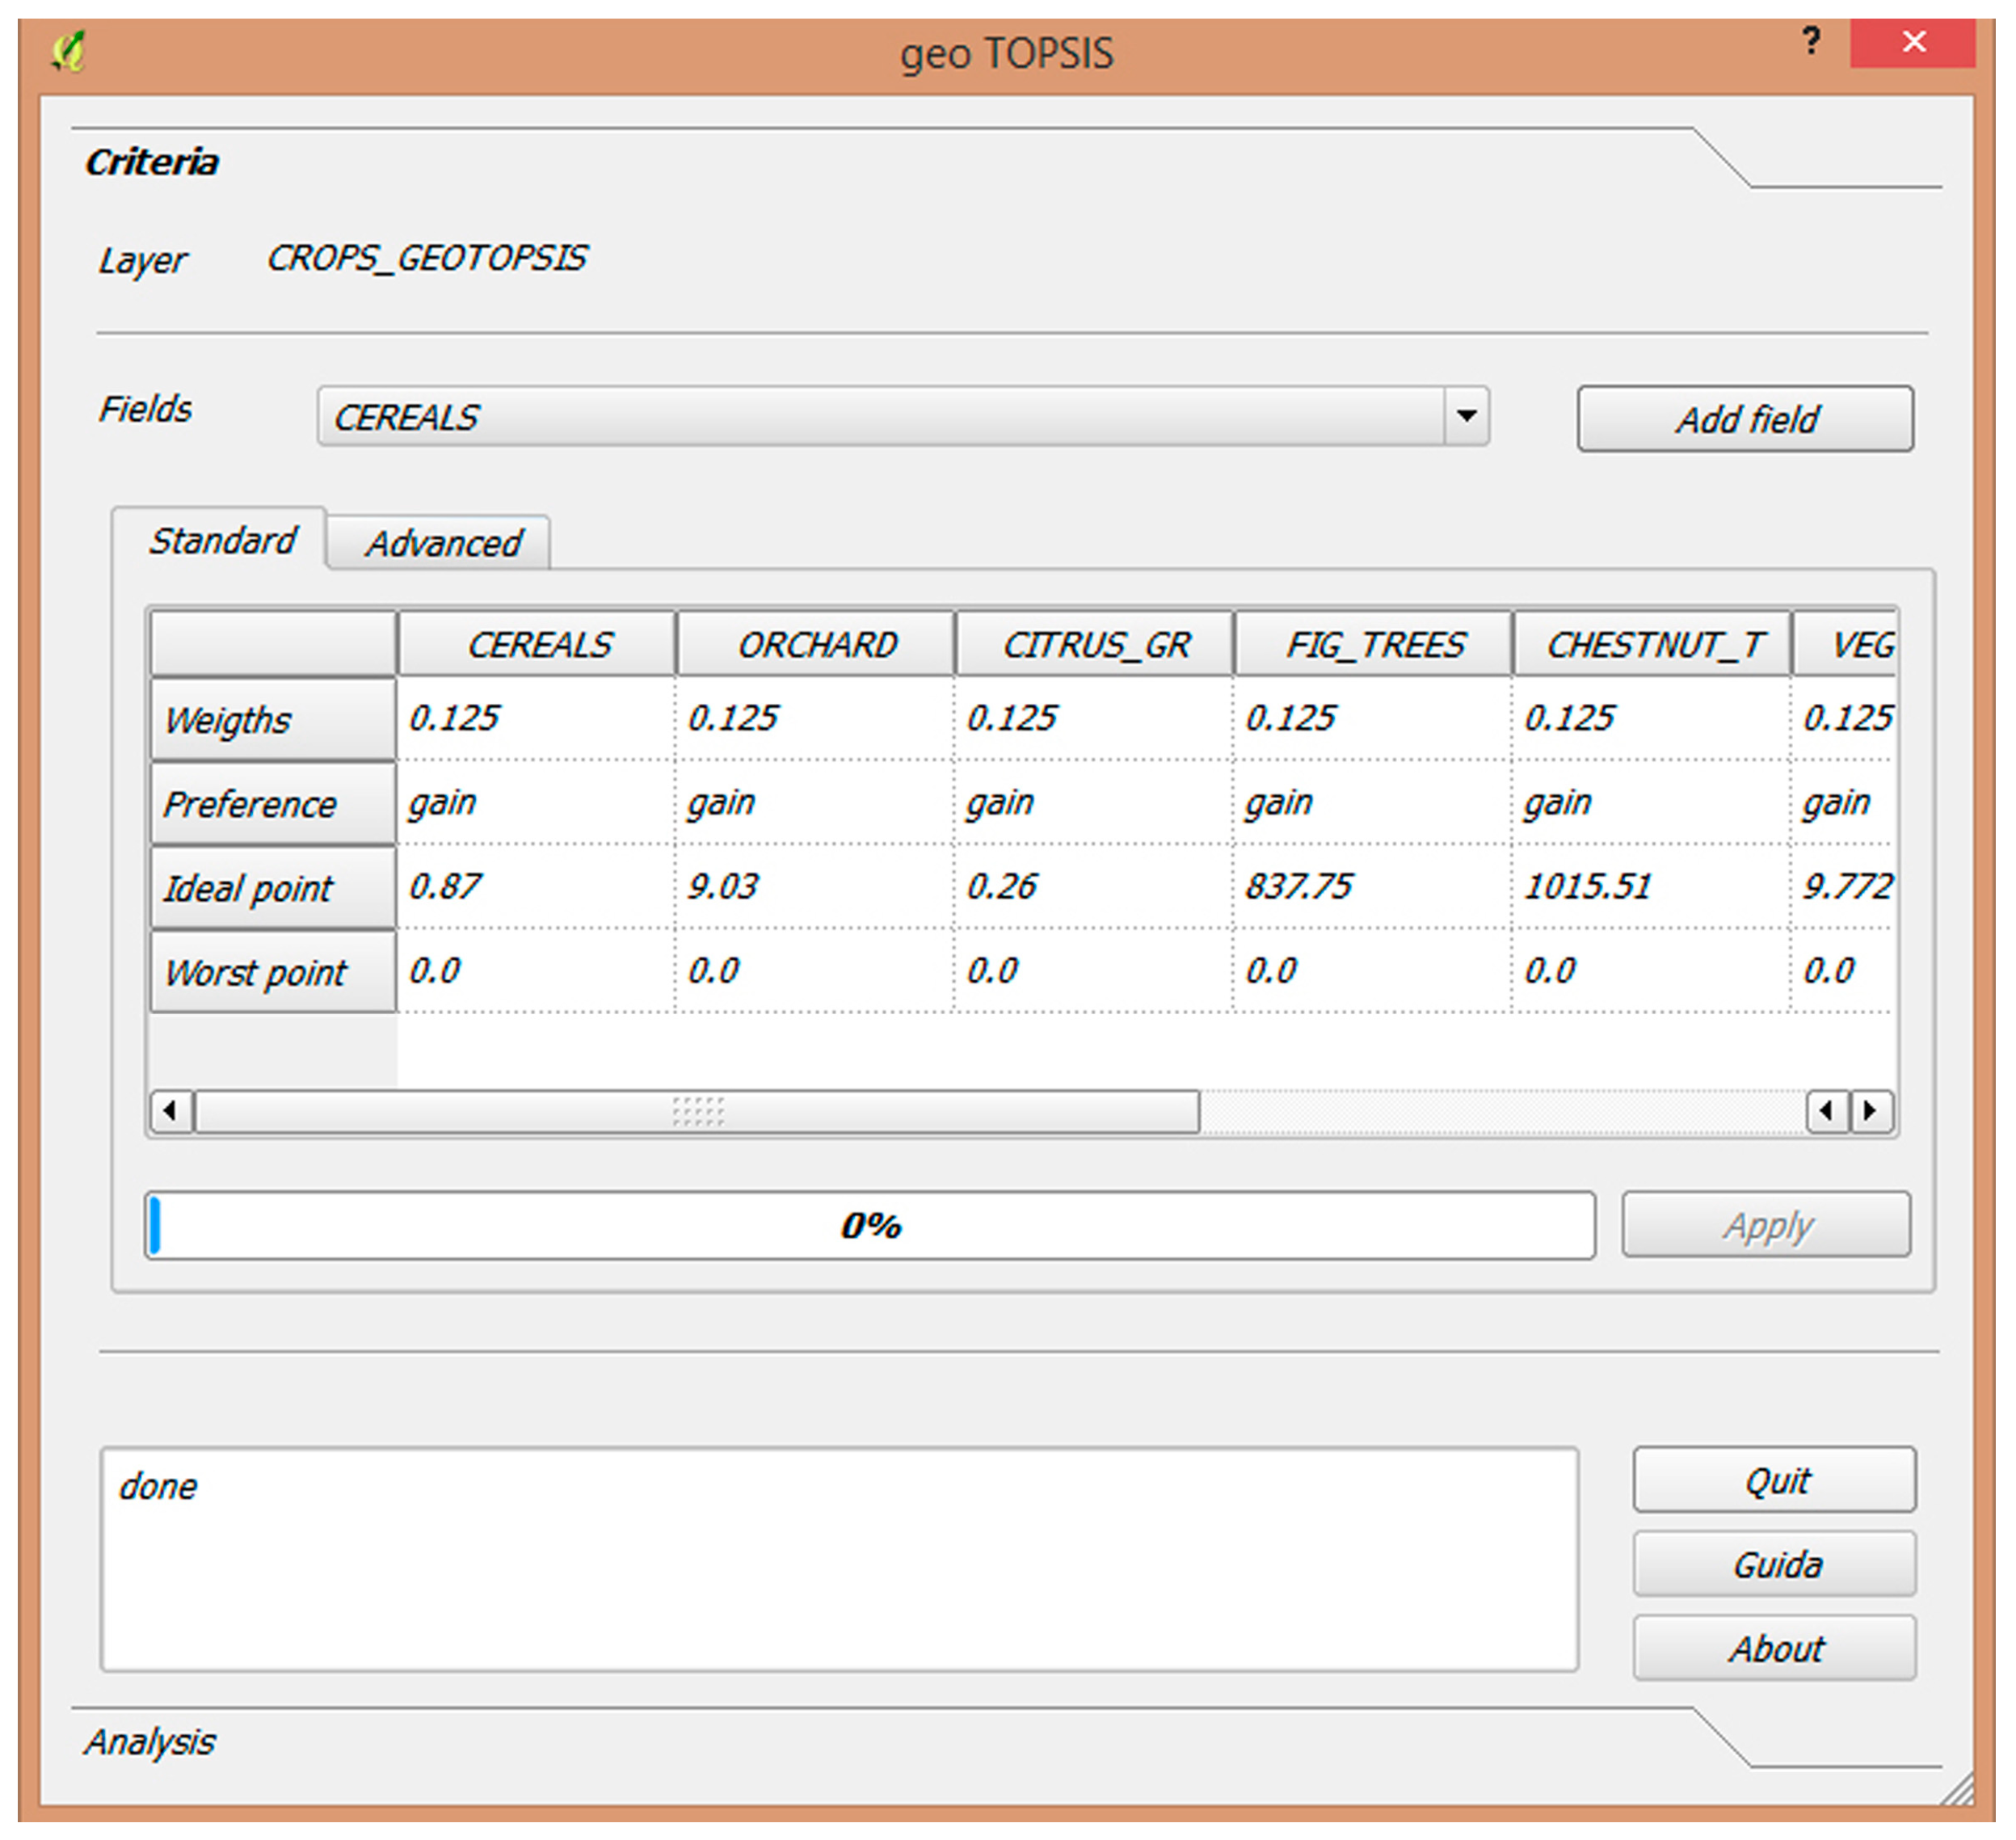
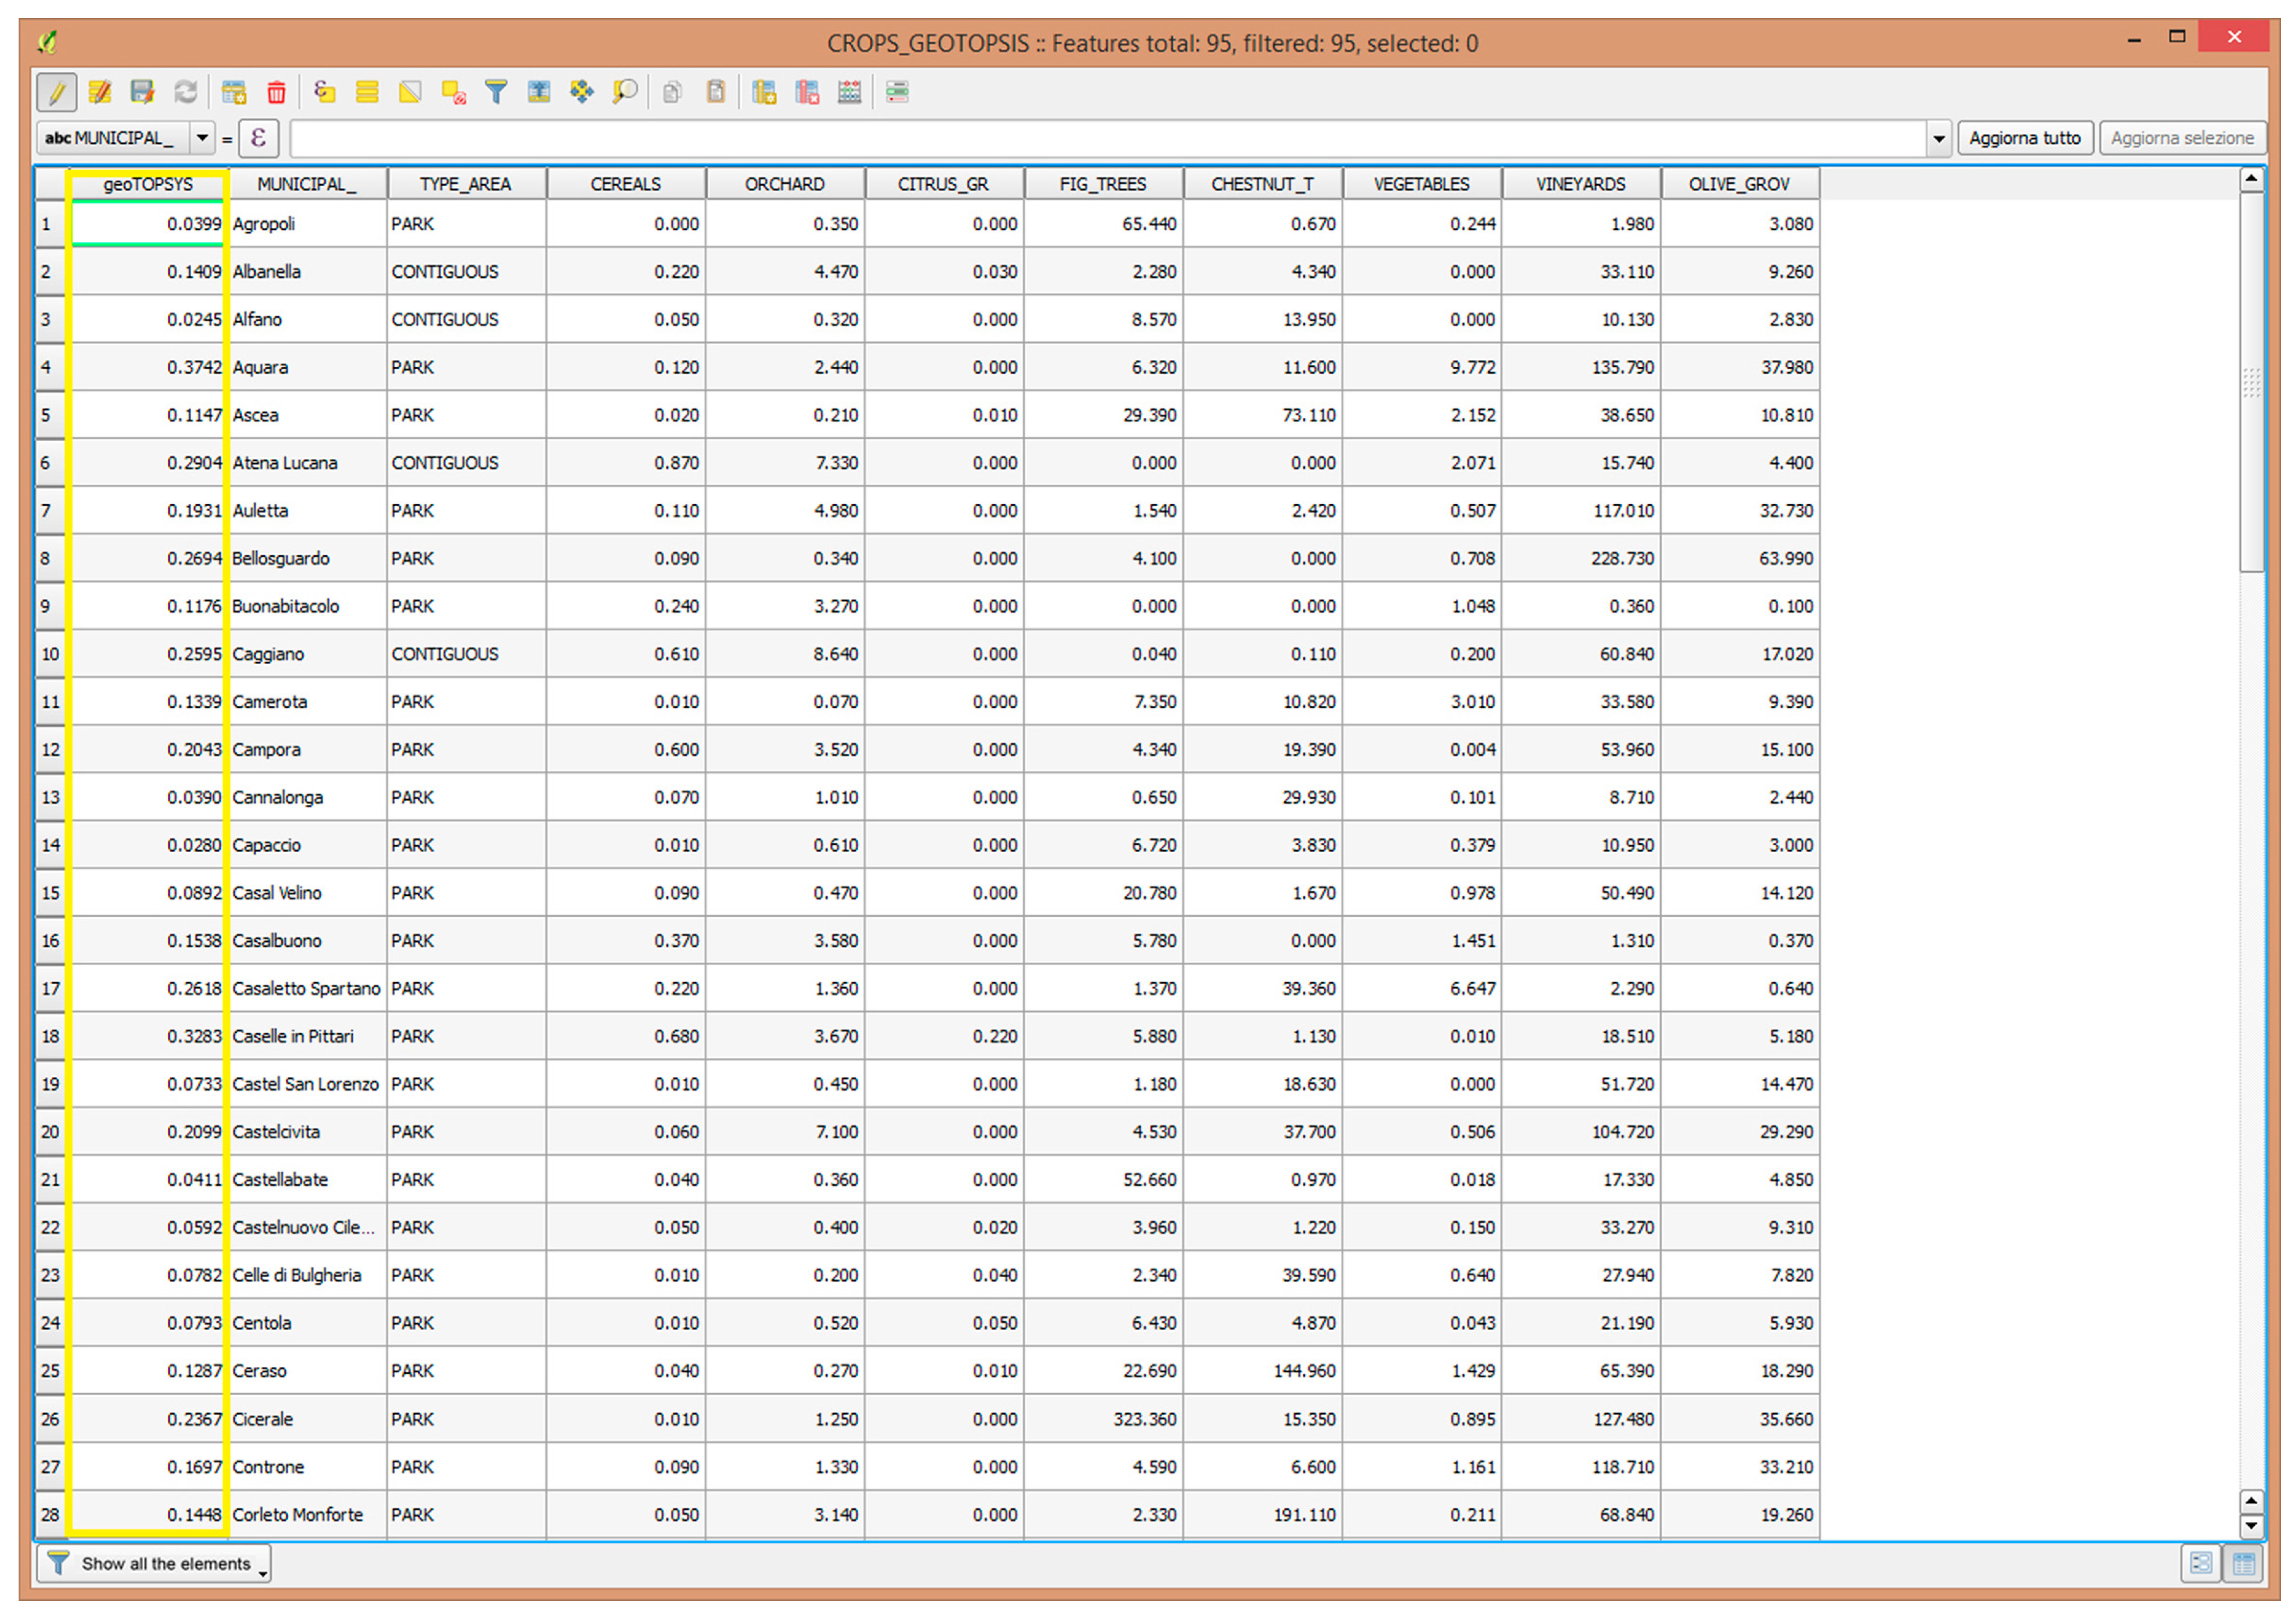
2.4. Phase Two: Assessment by GeoTOPSIS (Tool of QGIS Software)

The multi-criteria analysis is a Decision Support System (DSS) or a wide range of systems, tools and technologies to support the decision-maker in the decision-making process and constitutes useful tools for the evaluation of different alternative options (both with reference to the ex-ante phase and the ex-post phase), consisting of policies, programmes, plans or projects. The multi-criteria analysis family includes different methods and techniques developed in the different sectors and with reference to concrete cases to help decision-makers.
The TOPSIS (Technique for Order Preference by Similarity to Ideal Solution) method is part of the branch of multi-criteria analysis [50,51,52]. This method takes the basic concept that the preferable option that should have (in Euclidean space) the “shortest distance” from the “ideal solution” and the “greater distance” from the “non-ideal solution”. Note that the concept of “distance” could be interpreted in various ways, but the TOPSIS uses geometric interpretation, i.e., referring to the Euclidean distance. The criterion of the Euclidean distance was then used to evaluate the relative proximity of the offers to the final solution, and the final order of options preference is obtained by comparing these relative distances.
The software used for the entire project was QGIS, which allows data from different sources to be merged into a single territory analysis. Data, split into layers, can be analyzed and the ensuing image map is created with the thematism that can be customized by the user and eventually complies with typical GIS analyses, such as color gradation, color gradient and unique value. Icons and labels can enrich the map depending on the attributes of the cartographic elements; moreover, data can be dynamically projected, and the tools can be recalled by QGIS to be applied to the project data.
In our specific case, after processing the partial evaluation of ecosystem services, the values generated were entered into the QGIS software and reprocessed using the geoTOPSIS tool, which, at the end of the process, renders the values of the distances from the ideal point, overall, for each theme and for each NPCVDA municipality. The geoTOPSIS tool belongs to the vectorMCDA category, which is a QGIS plugin that uses different MCDA (multi-criteria decision analysis) algorithms to perform a multi-criteria analysis in a GIS framework. It is assumed that each geographical object described by an alphanumeric record constitutes a geographic alternative (geo-alternative) described by the indicators reported in the “attribute table” (Figure 3).
Each column refers to the respective column of the attributes table of the analyzed file that, in our case, take on the function of “criteria”, while the line marked with “weights” identifies the weights assigned to each criterion. The mode of insertion can be direct or indirect. Likewise, the line labelled “preference” allows the qualification of each criterion as “gain” (the greater the value that is assumed and the greater the preference) or “cost” (the greater the value assumed and the lower the preference). The “ideal point” line, on the other hand, identifies the target value assigned to a given criterion: In other words, it is the optimal value the decision maker favors. By default, this parameter coincides with the maximum value of the criterion under examination (if “gain” type) or at the minimum value (if “cost” type). On the contrary, the line with the “worst point” label proposes the minimum value in the case of “gain” type criteria and the maximum value in the “cost” type criteria. The user can enter different values to the default, assuming, for example, better targets than those achieved by the alternatives in question, or values indicated by laws (Figure 4). Therefore, every single module of the plugin analyzes the descriptive attributes of a geo-alternative, treating them as evaluation criteria, processes them according to the implemented algorithms, and returns the synthetic indexes of preference by adding a column to the attribute table (Figure 5). The outputs are represented by thematic maps and alphanumeric graphical data.

3. Results

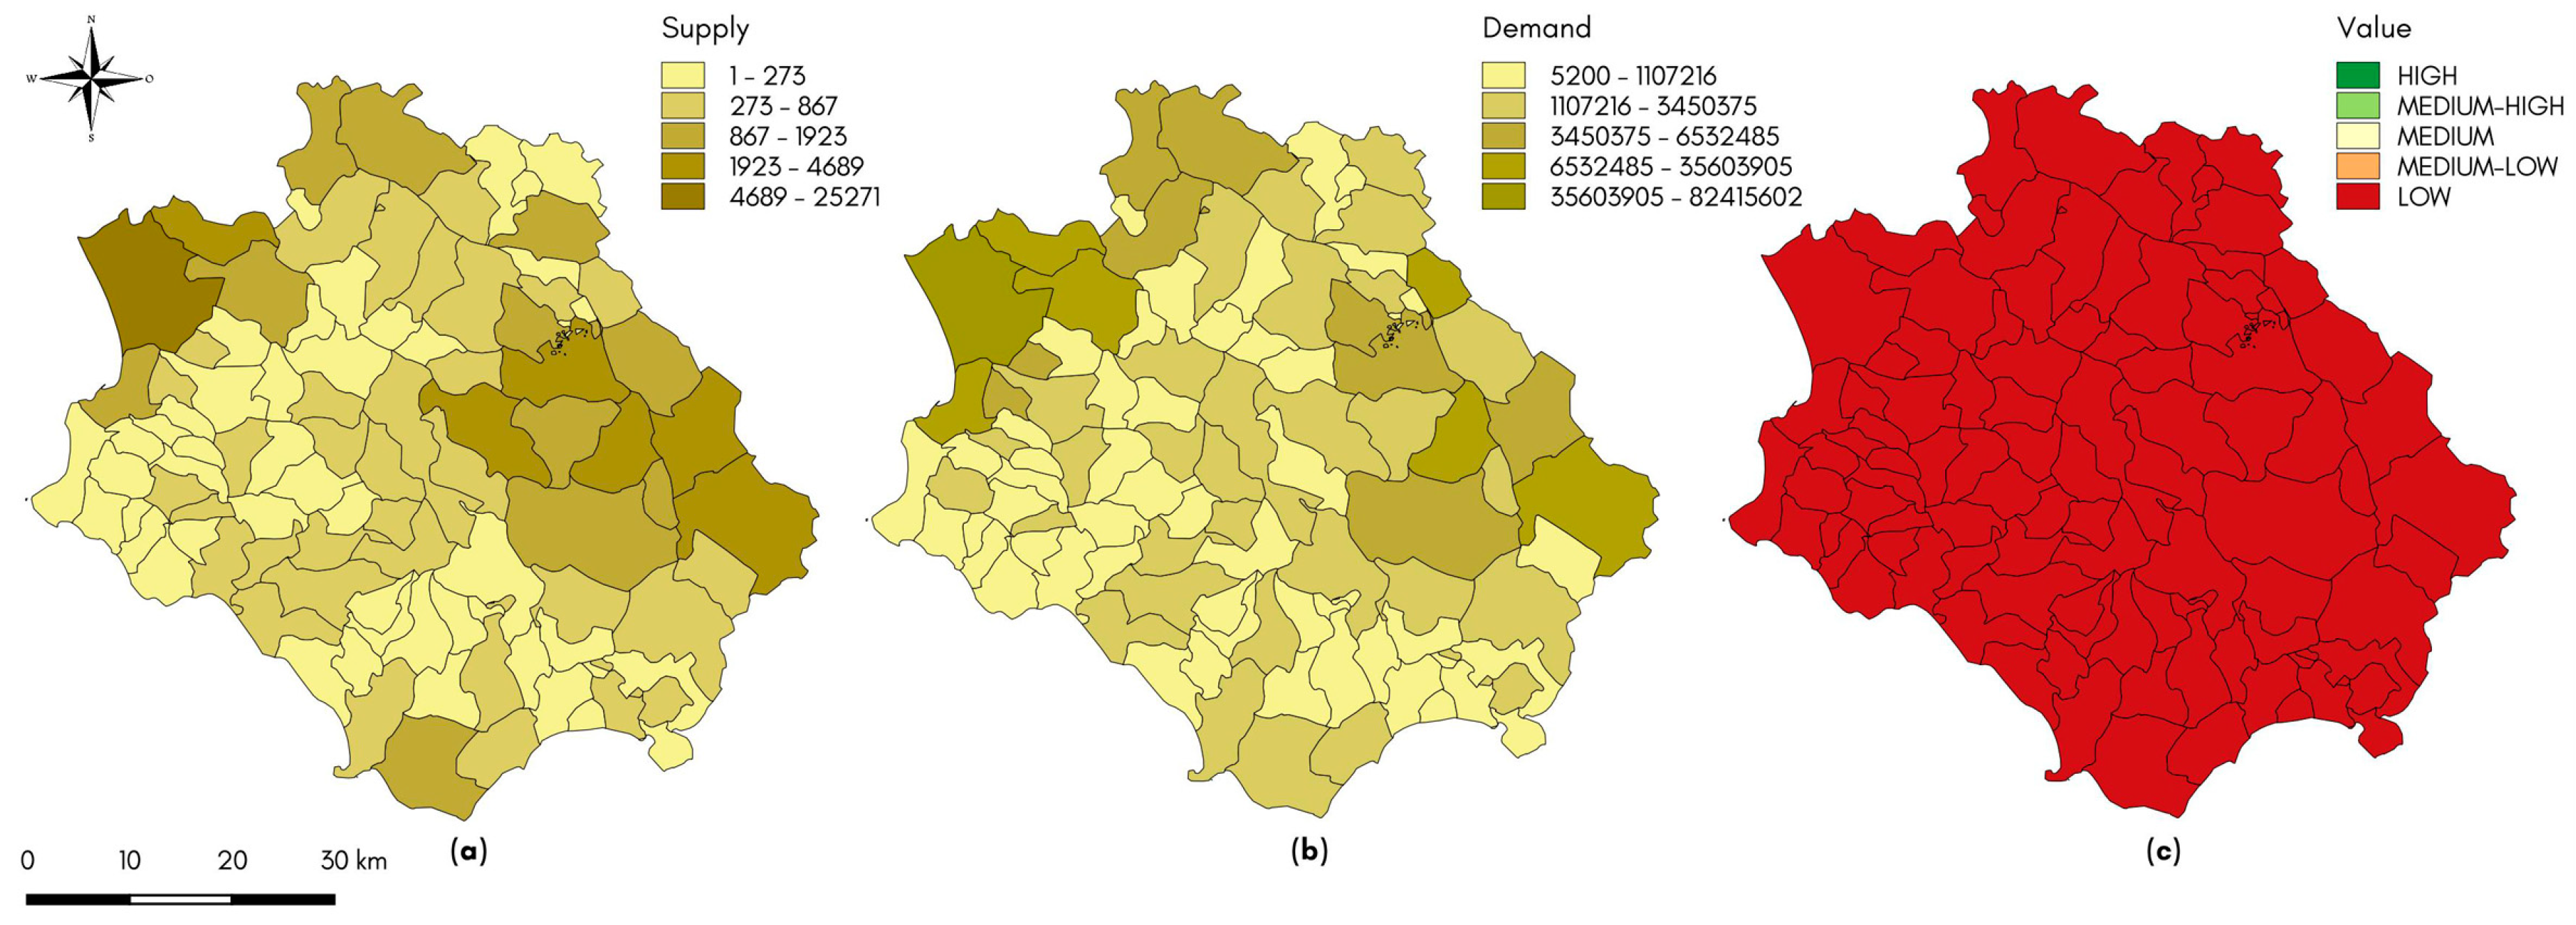
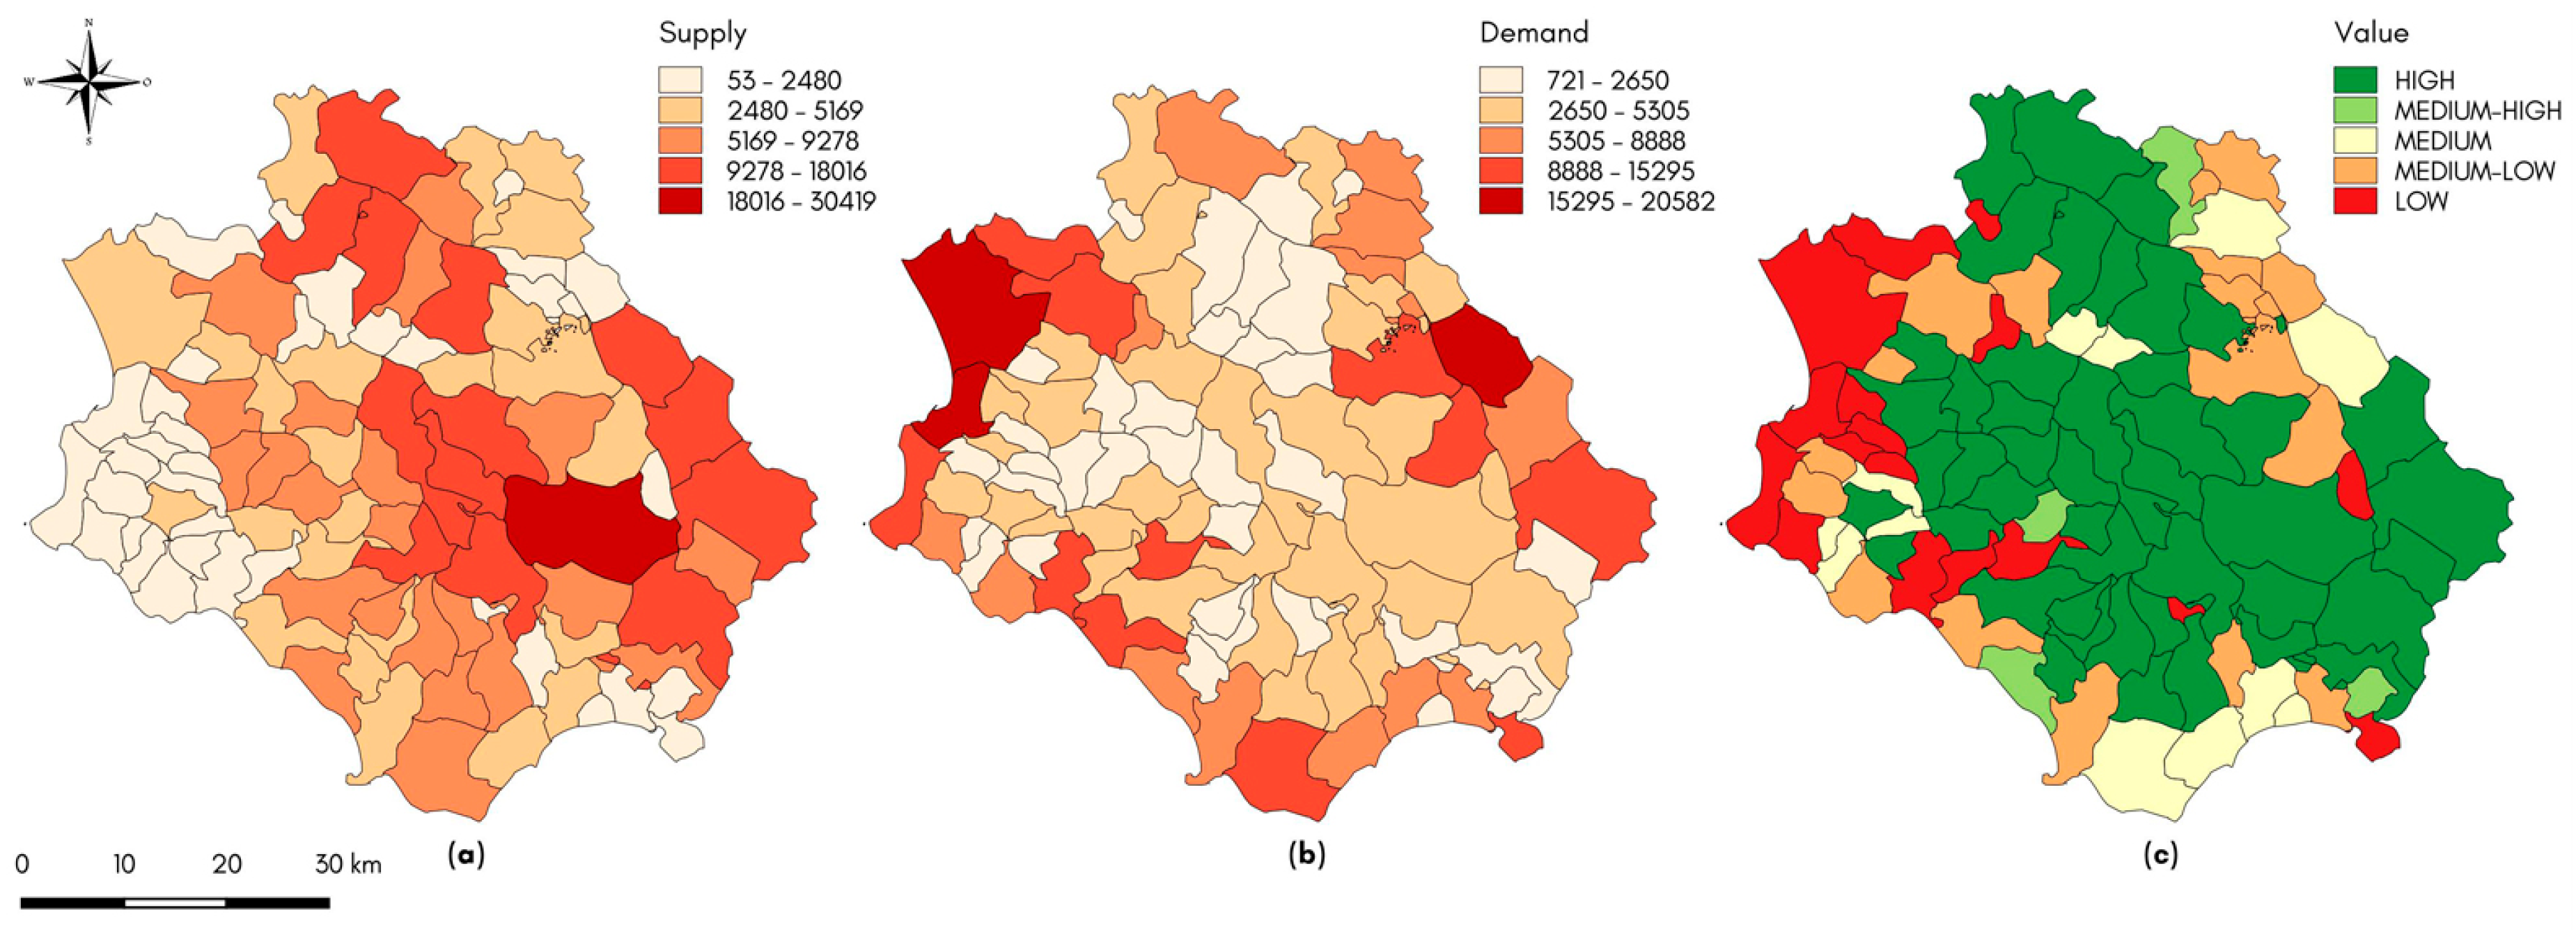
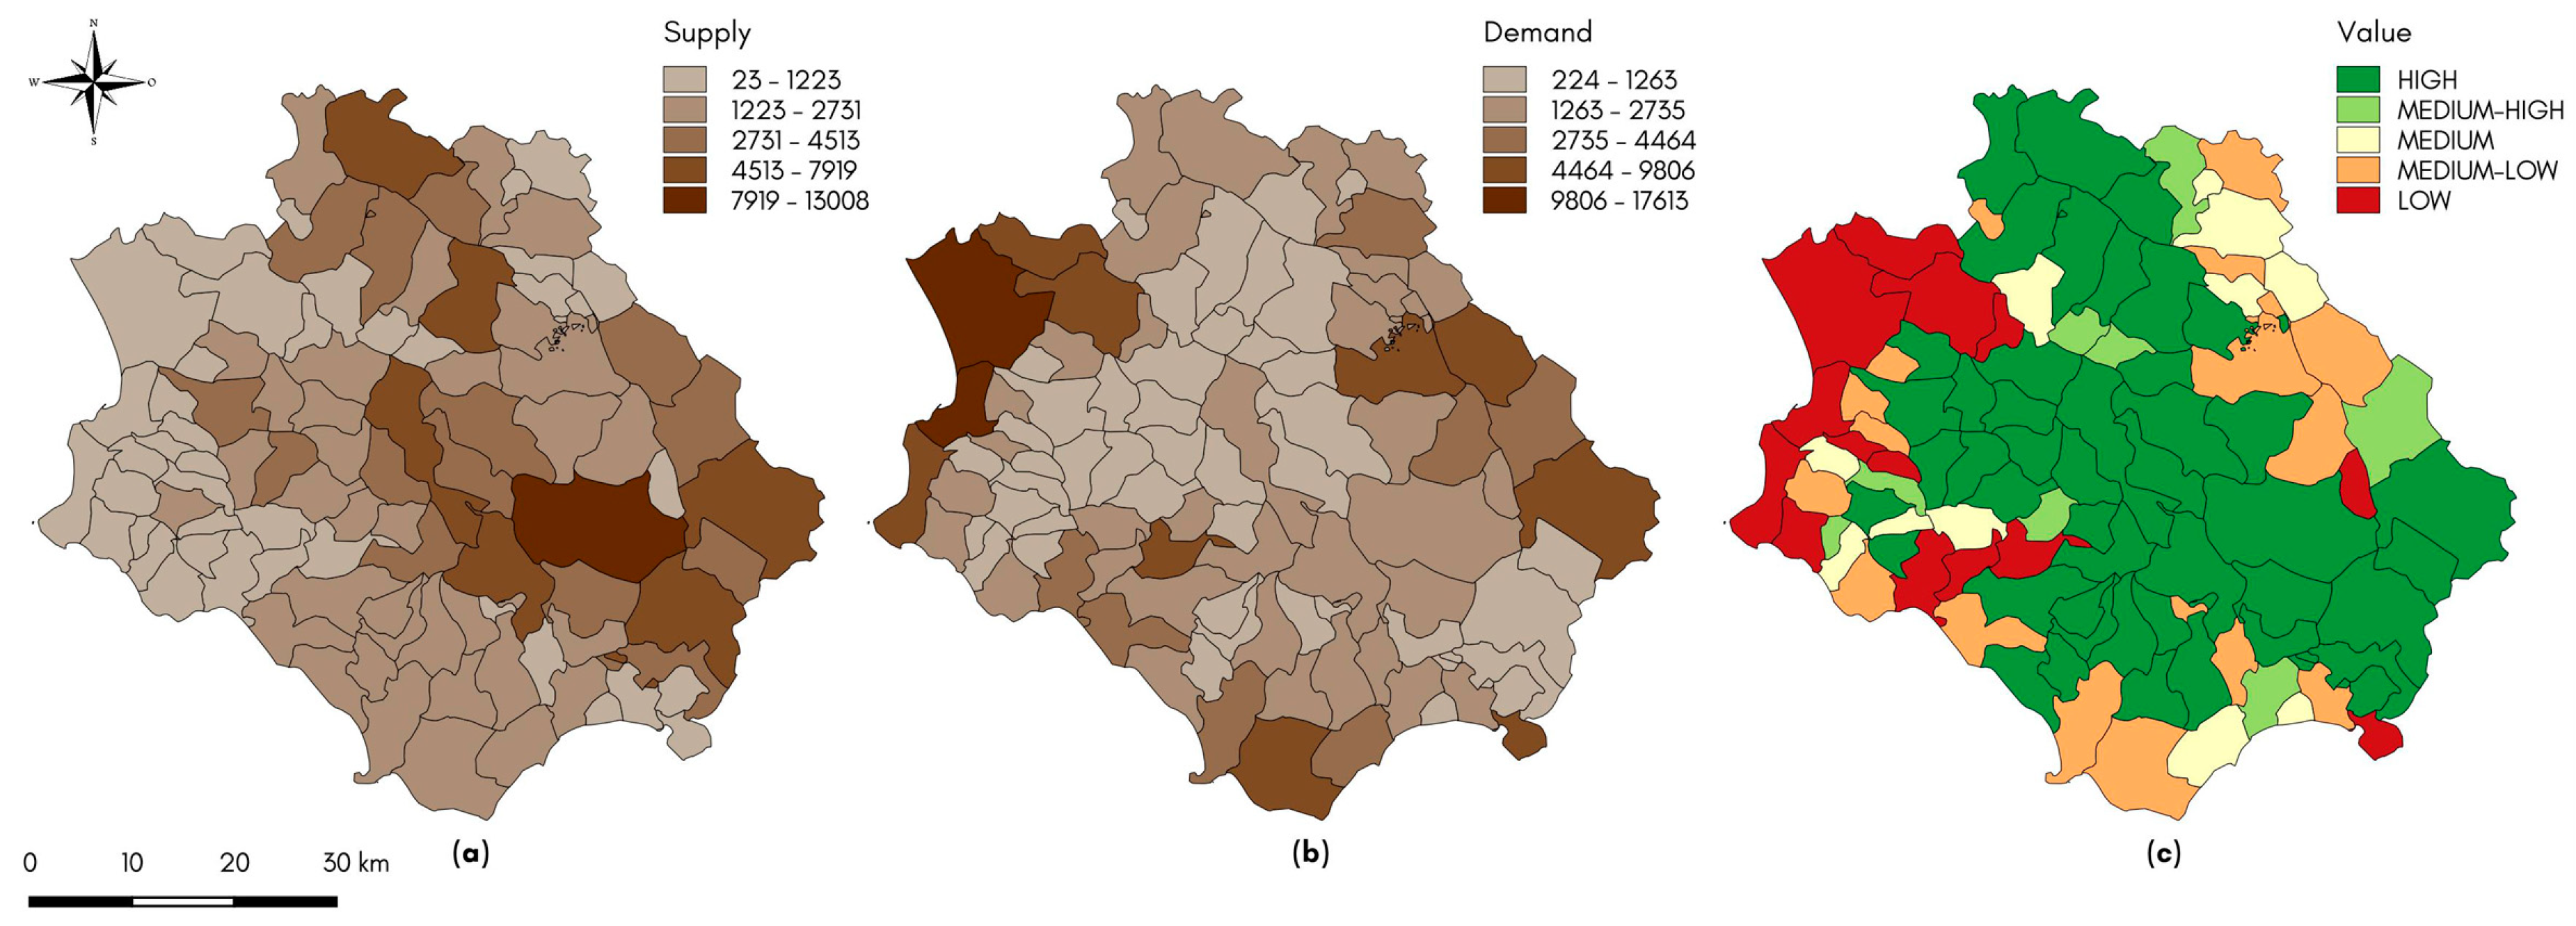
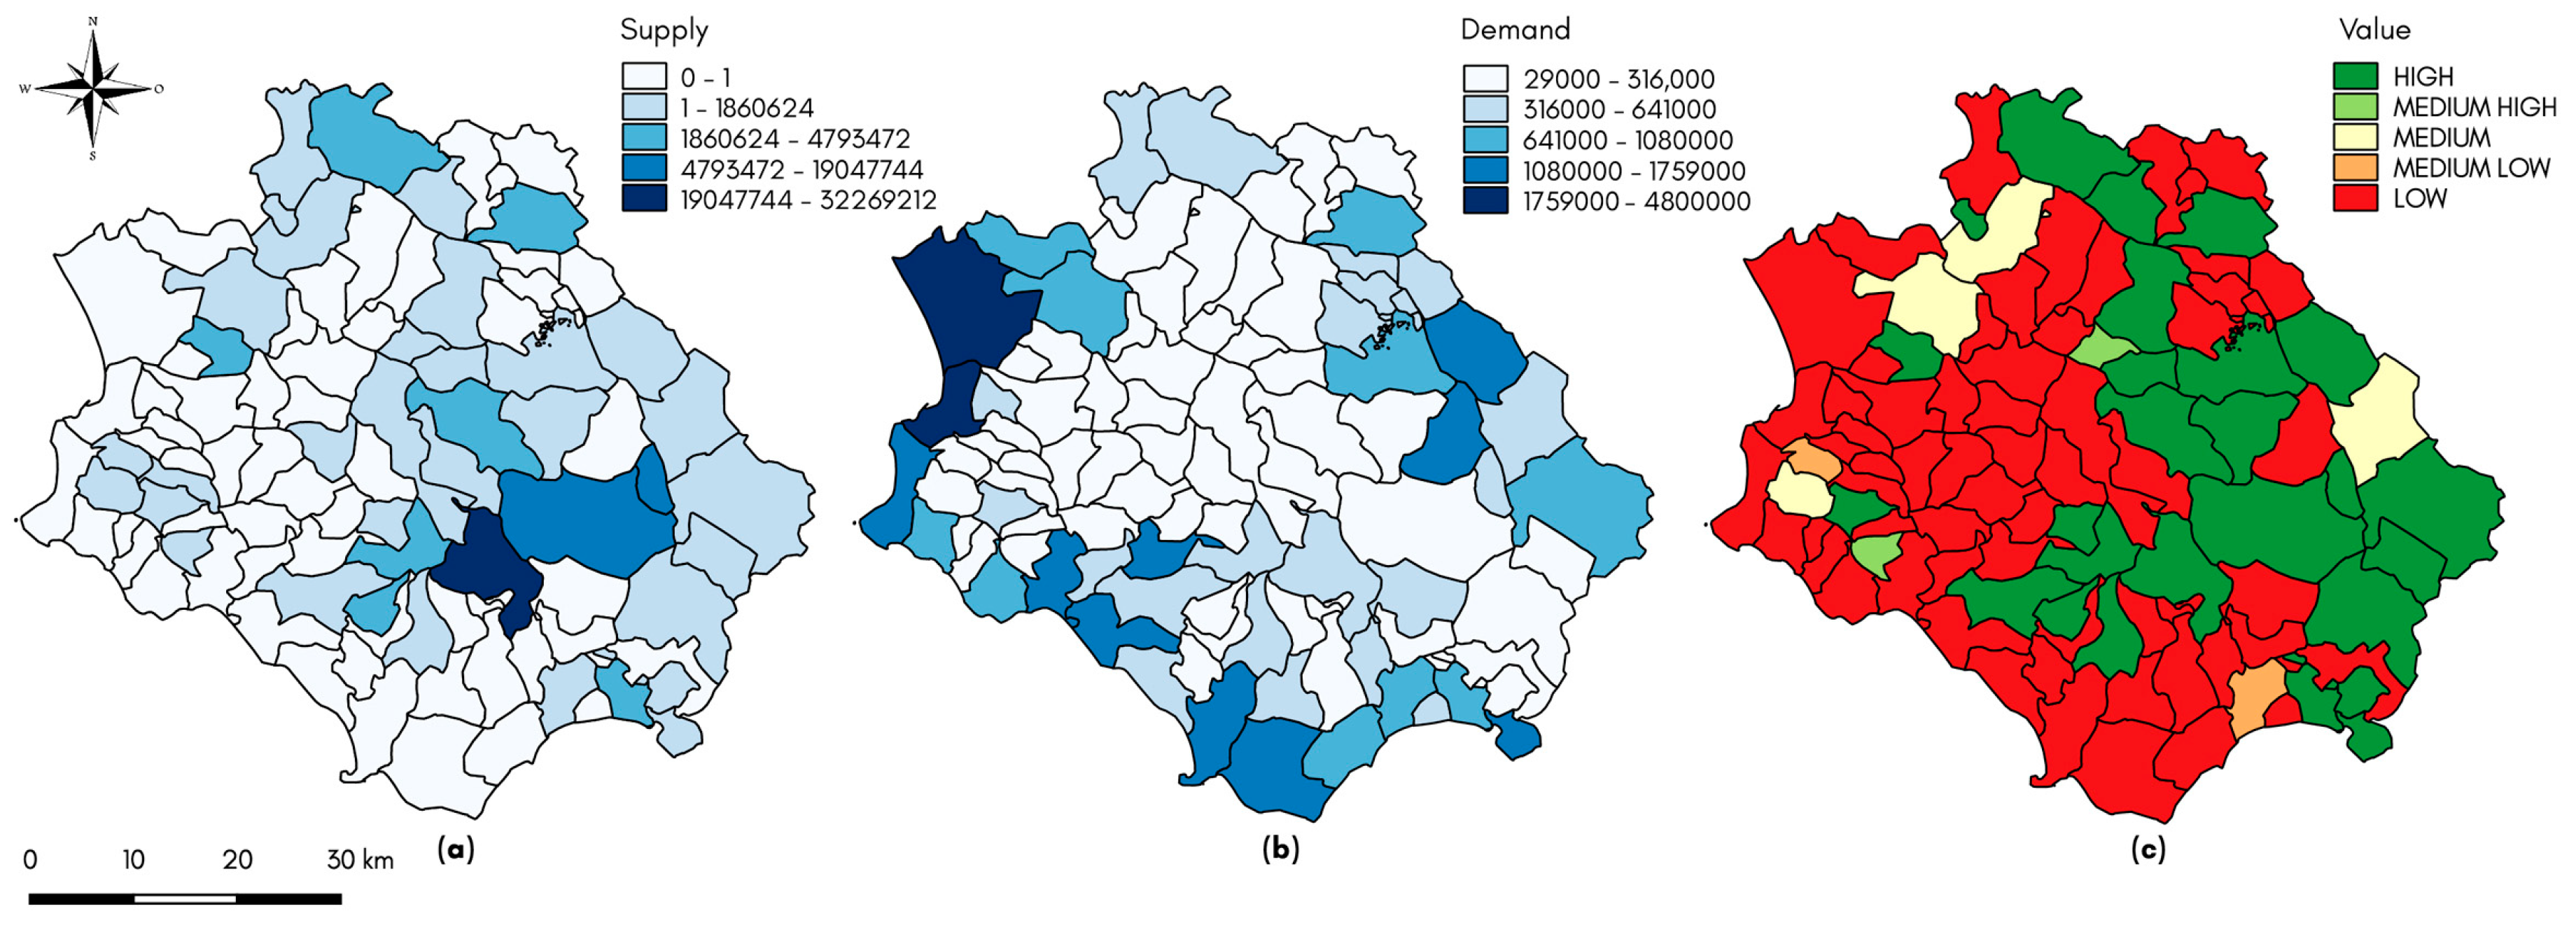
3.1. Results from Phase One: Partial Assessment of Ecosystem Services

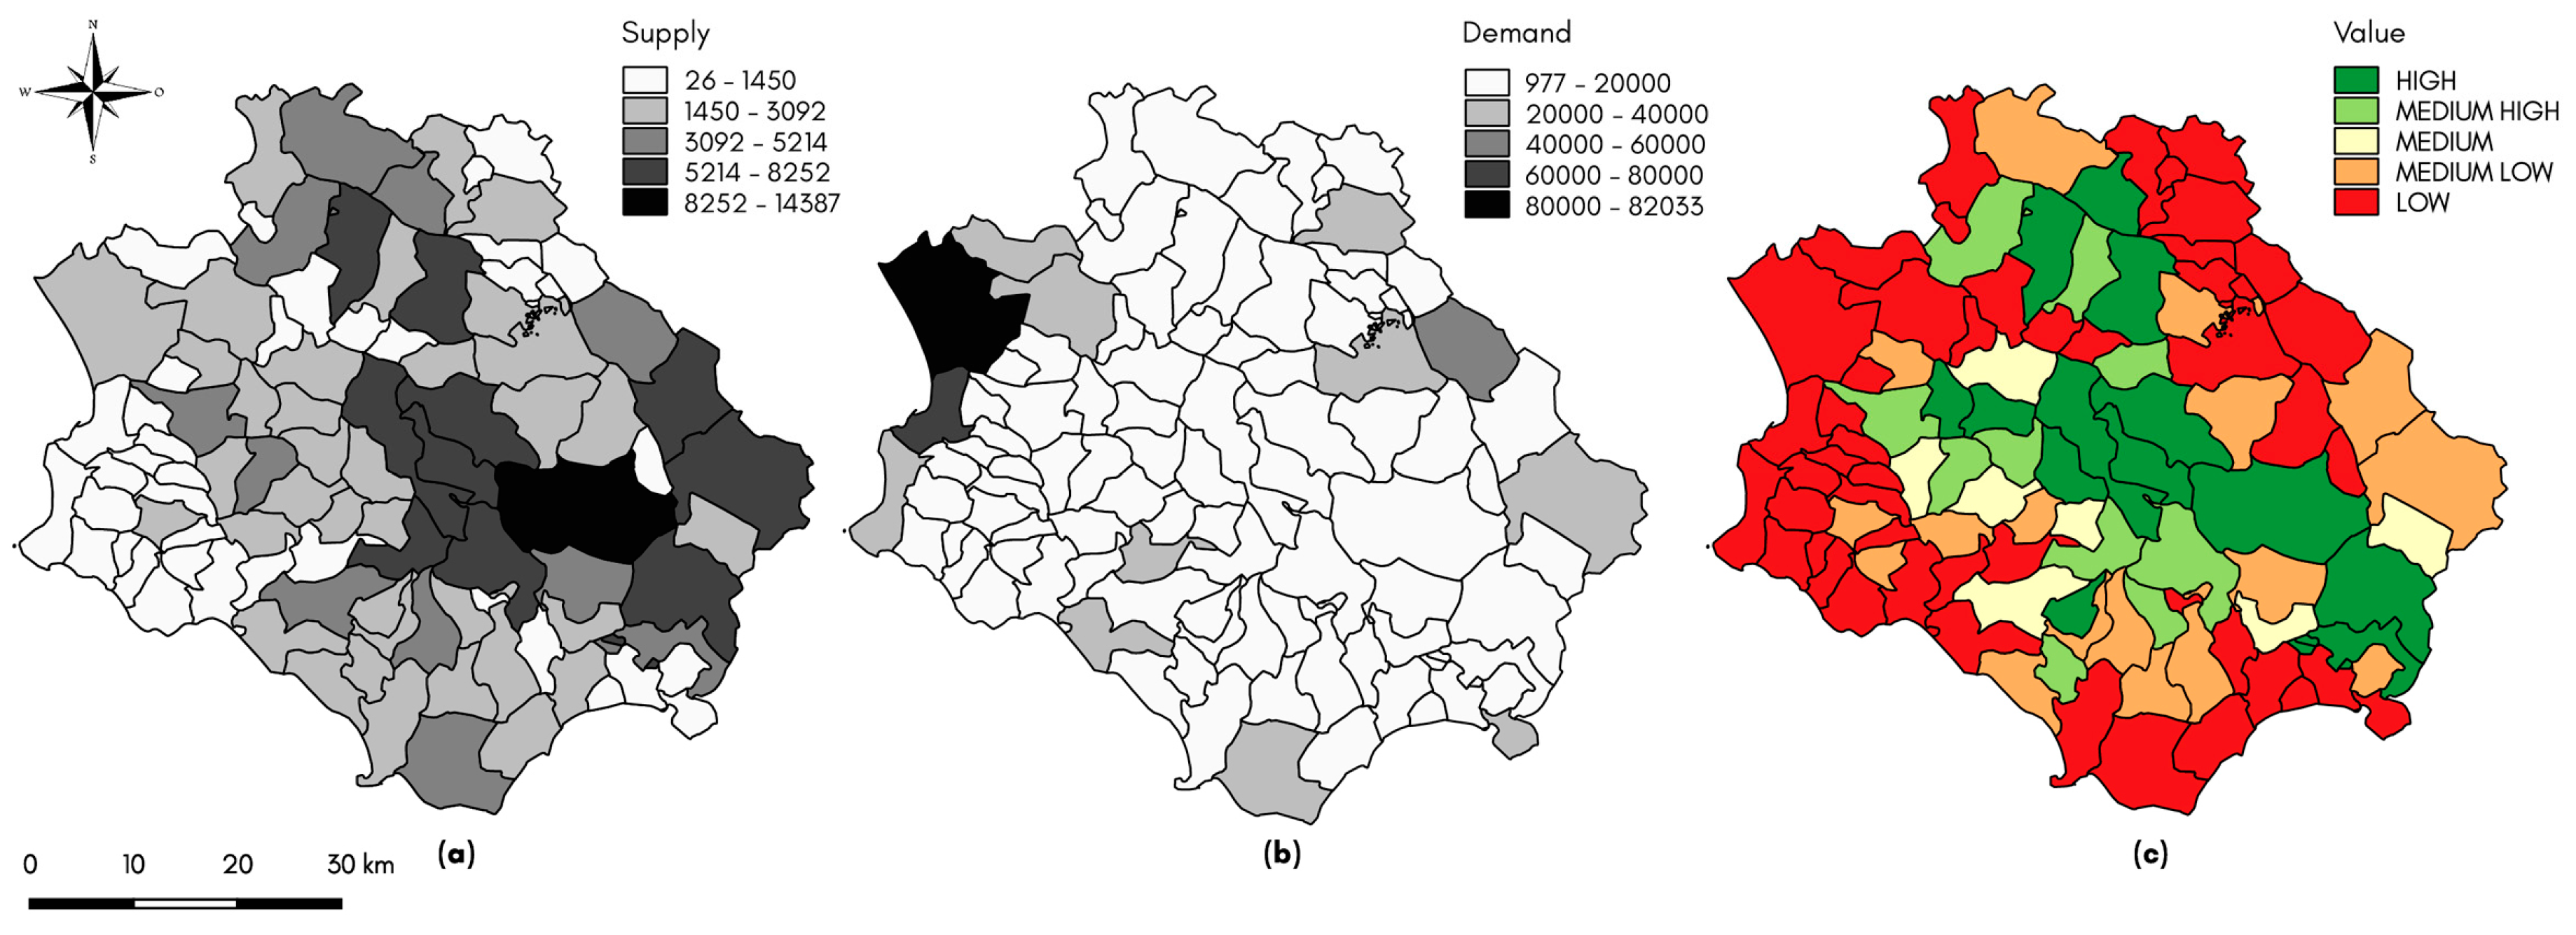
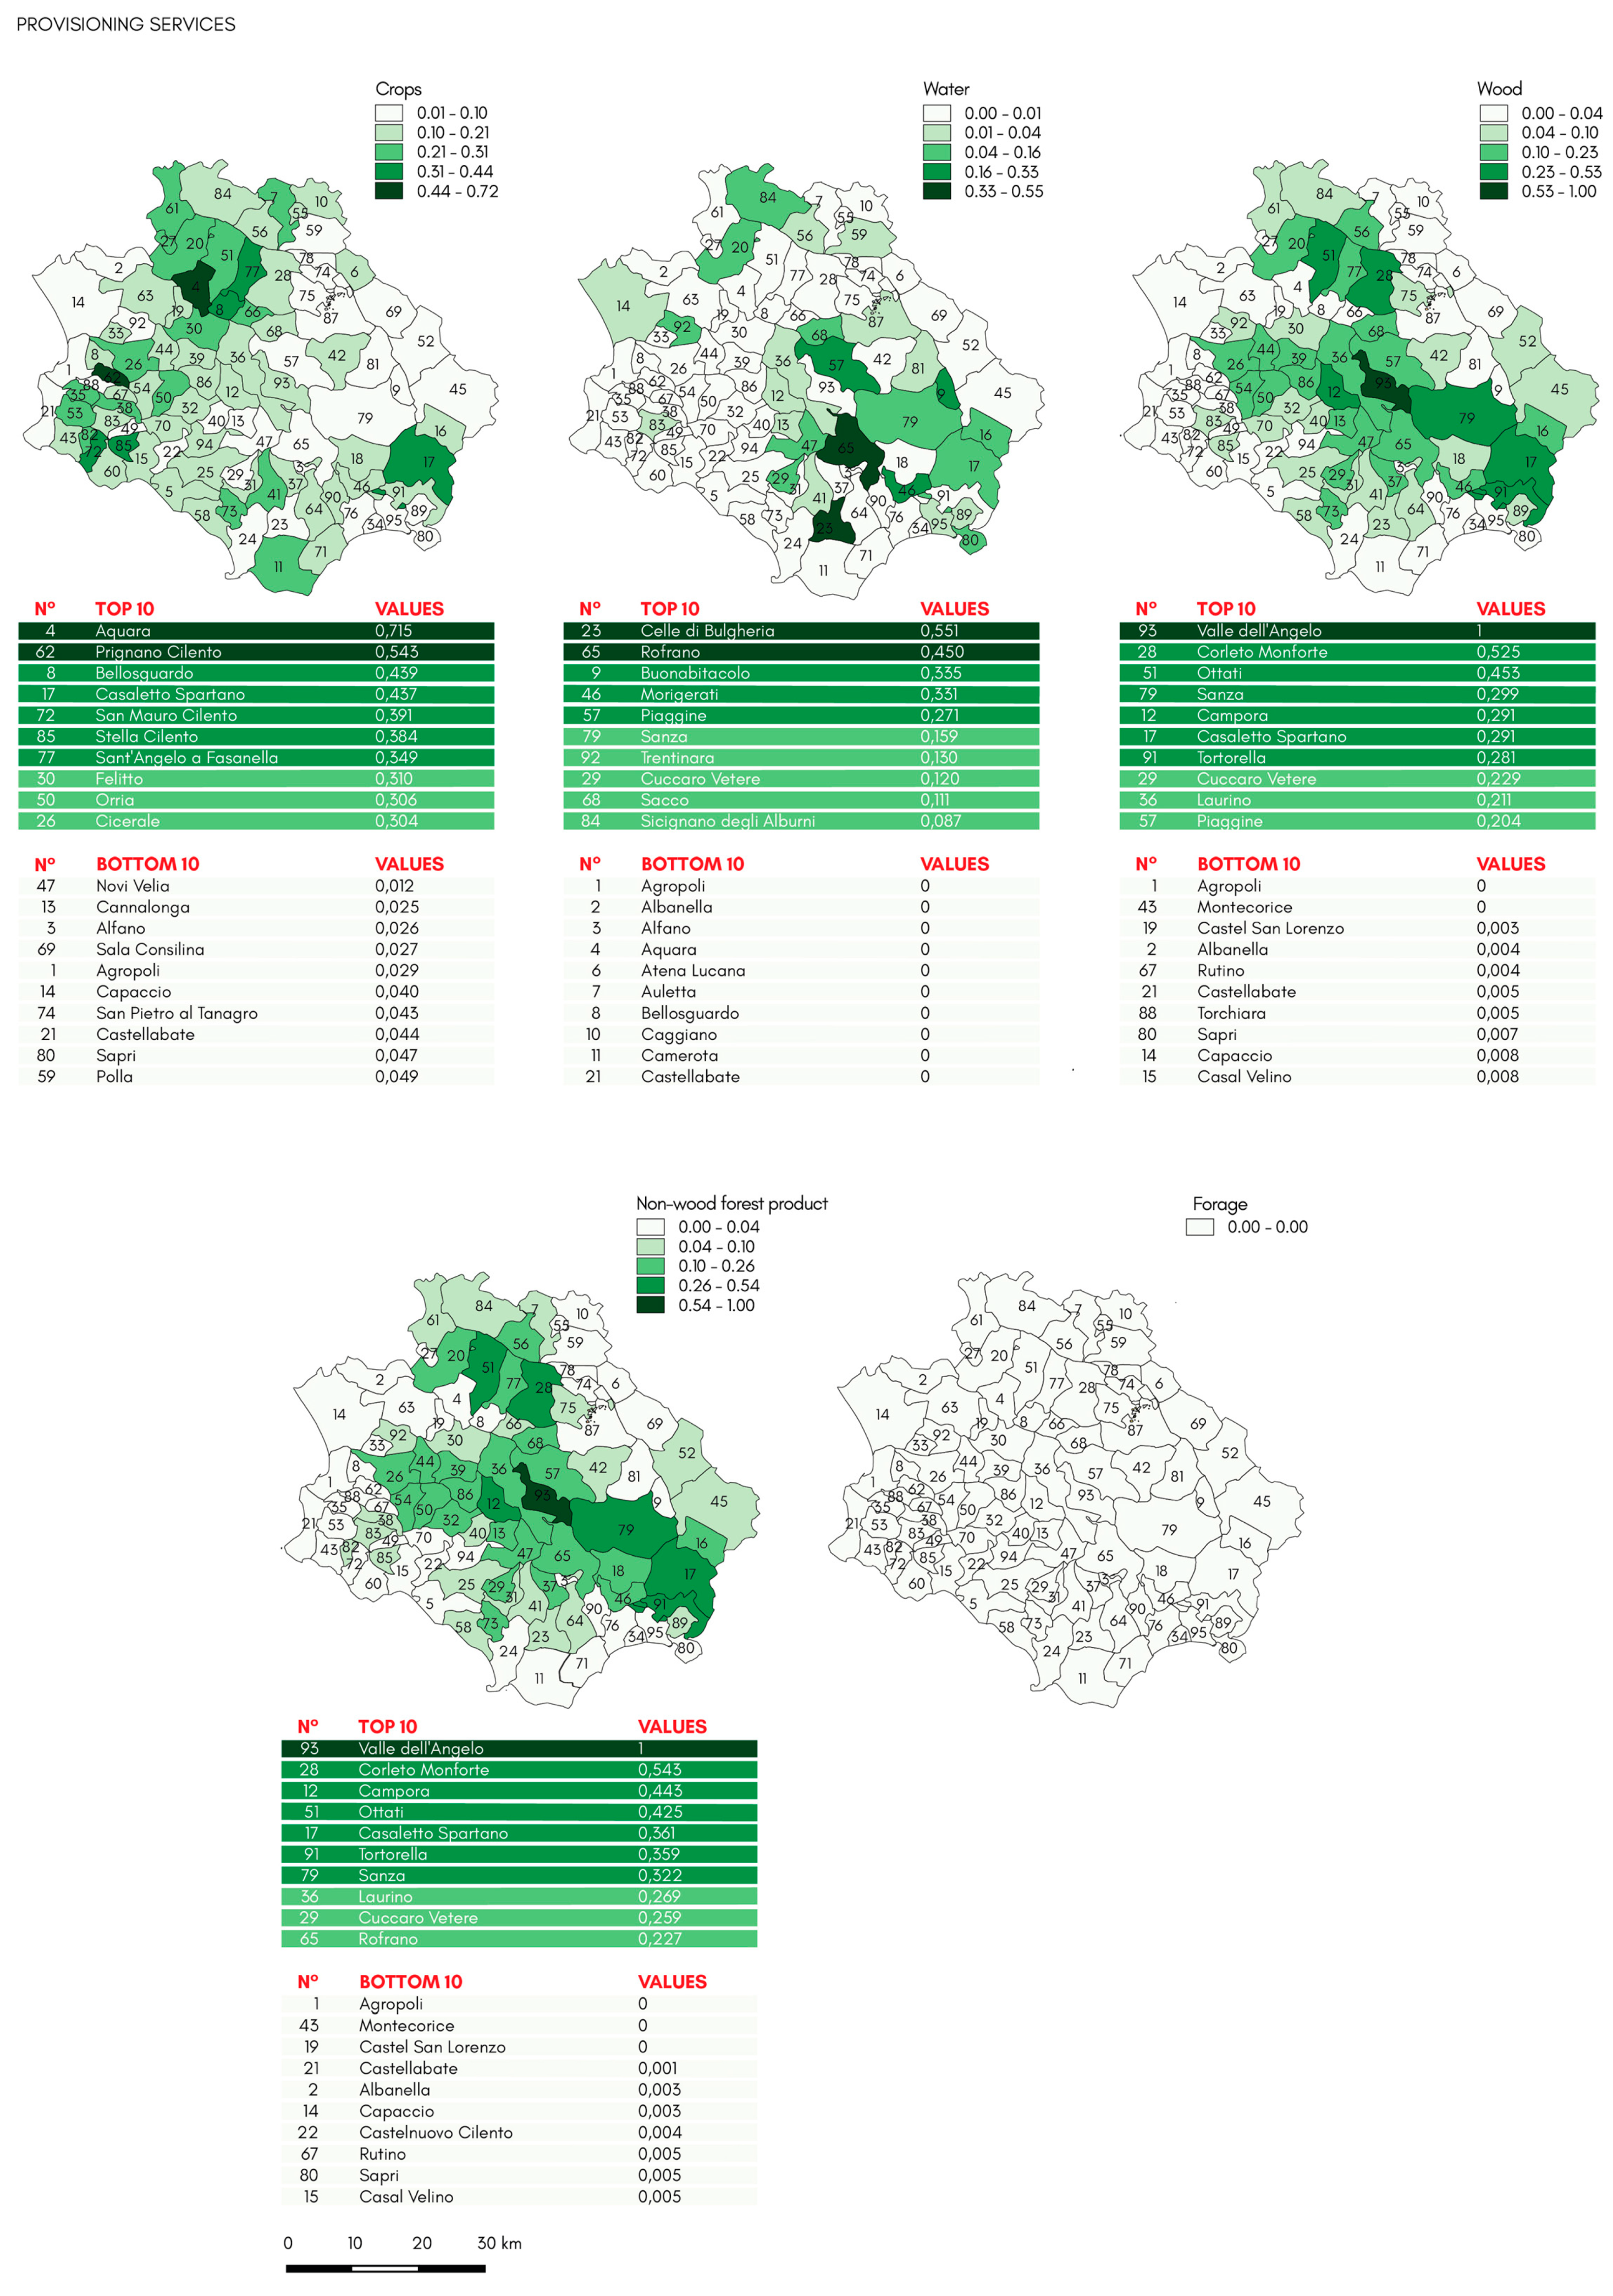
3.1.1. C1. Provision

C1.1—Crops

In building this theme, the following subcategories have been individually evaluated: Grains, cereals (soft wheat, durum wheat, barley, oats, sorghum, corn grain), citrus groves (lemon, orange), orchards (apple, pear, peach), vineyards (table grapes and wine grapes), fig trees, chestnut trees, olive groves, vegetable cultivations in full air (artichoke, lettuce, chicory, endive, cabbage, turnip, radish, chard, spinach, melon, pumpkin, watermelon, cucumber, basil, bean, string bean, pea, broad bean, onion, garlic, asparagus, bell pepper, tomato, eggplant, potato, celery, carrot, fennel, parsley).
The estimate of the supply (Figure 6a) of food products was obtained through the average productivity of the agricultural area, calculated through the average production yields for each type of cultivation [53]. The estimate of the demand (Figure 6b) was quantified on the basis of average per capita food consumption, multiplied by the resident population of each municipality of the reference site. Once we reached the results of the two previous estimates, we proceeded with the partial evaluation (Figure 6c) of the ecosystem service through the ratio between supply and demand and their subsequent conversion in percent. For example:
  • Chestnut average yield = 1.1 tons/ha;
  • Per capita consumption = 0.35 tons/per capita.

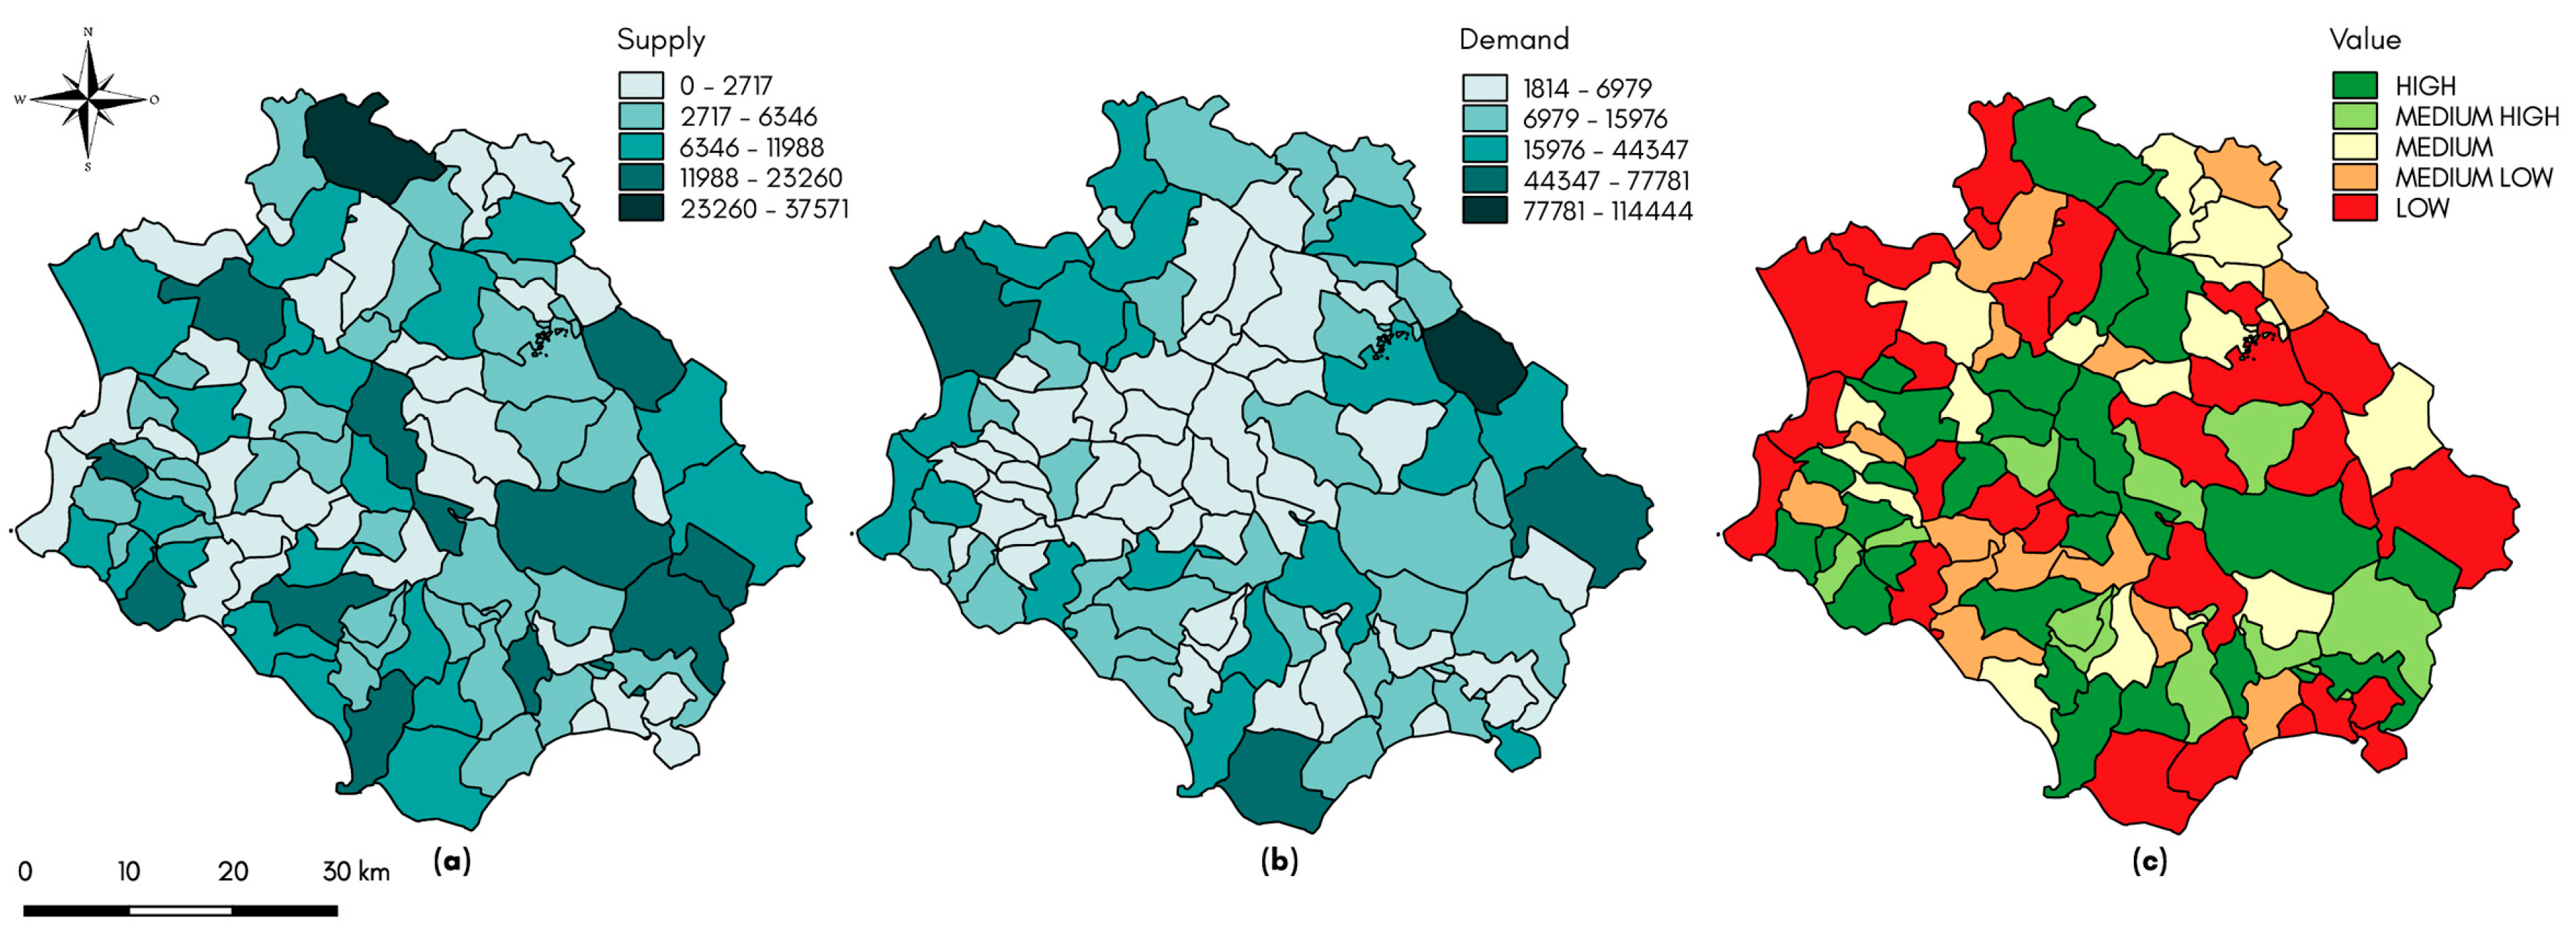
C1.2—Forage and Pasture

Supply quantification (Figure 7a) was calculated by multiplying the hectares of forage or grazing area and a reference coefficient expressed in forage unit on hectare (FU) [54]. The reference crops are waxy corn, other herbaceous monophyte grasslands, alfalfa, permanent meadows, lean pastures, other pastures. The demand (Figure 7b) corresponds to the average livestock consumption per head of livestock, estimated using an average annual factor of FU per animal by type of animal consumer. For example:
  • Waxy corn average yield = 13.91 FU/ha;
  • Calves’ per capita consumption = 1000 FU/head of cattle.
In addition, in this case, we proceeded with the partial evaluation (Figure 7c) of the ecosystem service through the ratio between supply and demand.

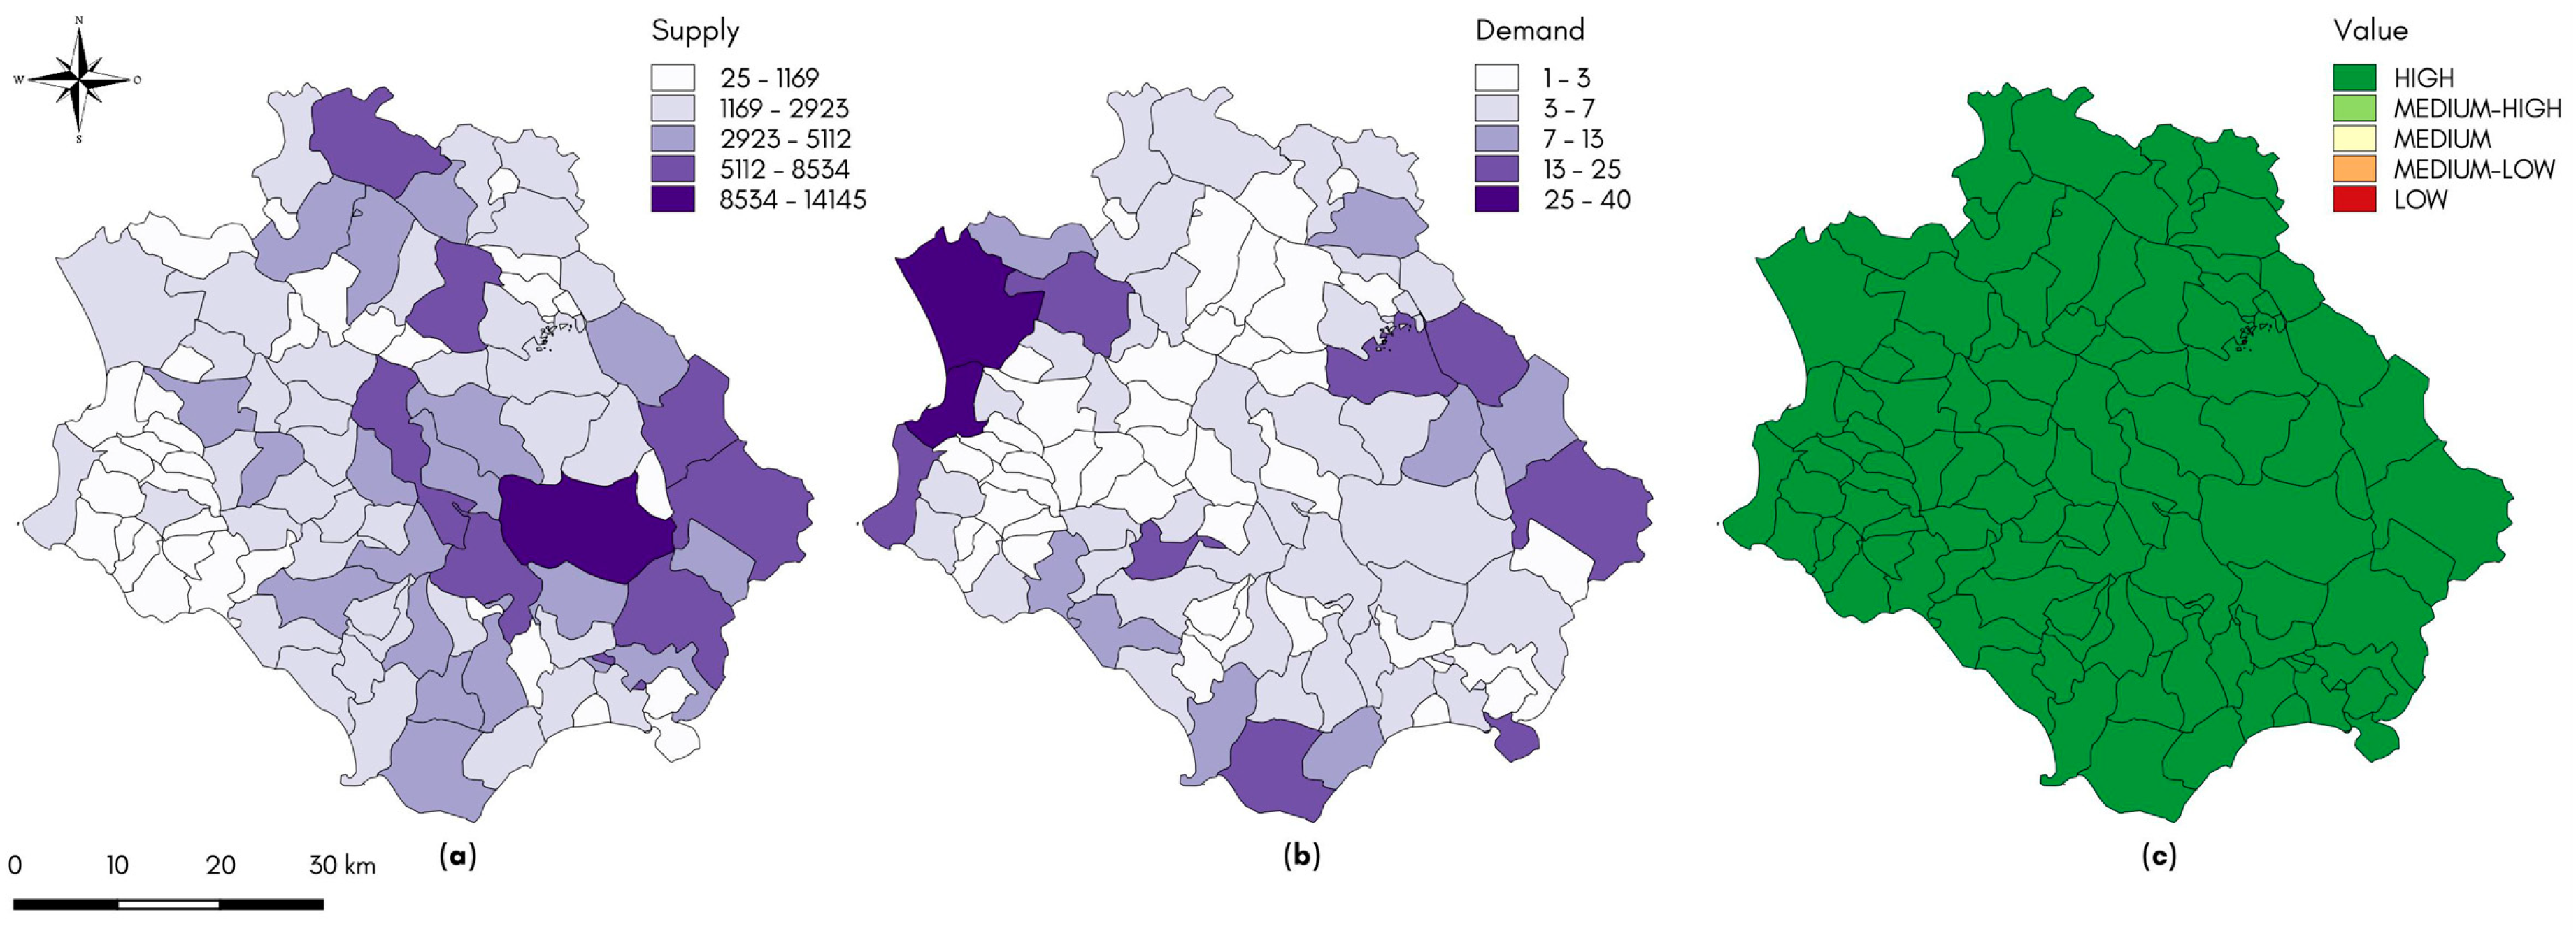
C1.3—Wood and Fibers

To estimate the wood supply (Figure 8a) by the territory the quota of woody, phytomass has been calculated; that is, the plant mass expressed in tons on hectares of the vegetation that covers a site. The reference data for estimating the forest area is Corine Land Cover (2012) [55], in which an increase coefficient of the specific phytomass to each class of forest cover type is attributed. To estimate the demand (Figure 8b), on the other hand, the average consumption for each municipality has been considered as the reference value, using a coefficient classified according to the size of the inhabited centre and the number of dwellings. For example:
  • Cork oak forests’ average yield (tons/ha) = 3.92;
  • People’s average consumption per capita (tons/ha) = 5.3.
Figure 8c shows the evaluation for this theme.

C1.4—Non-Wood Forest Products

The estimate of the mushroom production (Figure 9a) has been calculated on the basis of the wooded surface of the Corine Land Cover cartography multiplied by an average annual production coefficient of 1.5 kg/ha [18]. The types of woods considered are the following: Woods with a prevalence of holm oak and/or cork oak; woods with a prevalence of deciduous oaks (turkey oak and/or oak); mixed woods with a prevalence of mesophilic broad-leaved trees and mesothermophilic (maple-ash, hornbeam-black-ash); forests with a prevalence of chestnut; forests with a prevalence of beech; woods with a prevalence of mountain and Mediterranean pines (black pine and larch, sylvan pine, loricate pine); mixed woods of conifers and broadleaves with a prevalence of holm oak and/or cork oak); mixed woods of conifers and broad-leaved trees, mostly of deciduous oaks; mixed woods of conifers and broad-leaved trees with a prevalence of mesophilic and mesothermophilic hardwoods; mixed woods of conifers and broad-leaved trees with a prevalence of chestnut; mixed woods of conifers and broad-leaved trees with a prevalence of beech; and, mixed woods of conifers and broad-leaved trees with a prevalence of mountain pines and Mediterranean or oak. For example:
  • Woods’ average yield (kg/Ha) = 1.5;
  • Average consumption (gr/per capita) = 800.
Figure 9b shows the demand, and Figure 9c the evaluation, for this theme.

C1.5—Water

The evaluation (Figure 10a) of the water has been divided into: Drinking water and irrigation water. In regard to drinking water, the supply estimate is based on the amount of water collected for drinking by sources within the municipalities. The springs are captured by the water consortia or by the municipalities themselves. The estimate of the demand (Figure 10b) corresponds to the consumption of drinking water by each municipality; that is, to the water introduced into the municipal aqueduct with reference to the year 2012, which is the most recent year for which data is available [56].
Regarding irrigation water, the supply estimate is based on the amount of water collected for irrigation from the sources within the municipalities. The estimate of the irrigation water demand, i.e., the irrigation needs for the agricultural land use classes, was calculated based on the average requirements (cubic meter/ha) estimated by INEA. Example of drinking water in the Ceraso Municipality:
  • Average production (cubic meters/year) = 390,000;
  • Per capita needs (cubic meters/year) = 385,000.
Figure 10c shows the evaluation for this theme.

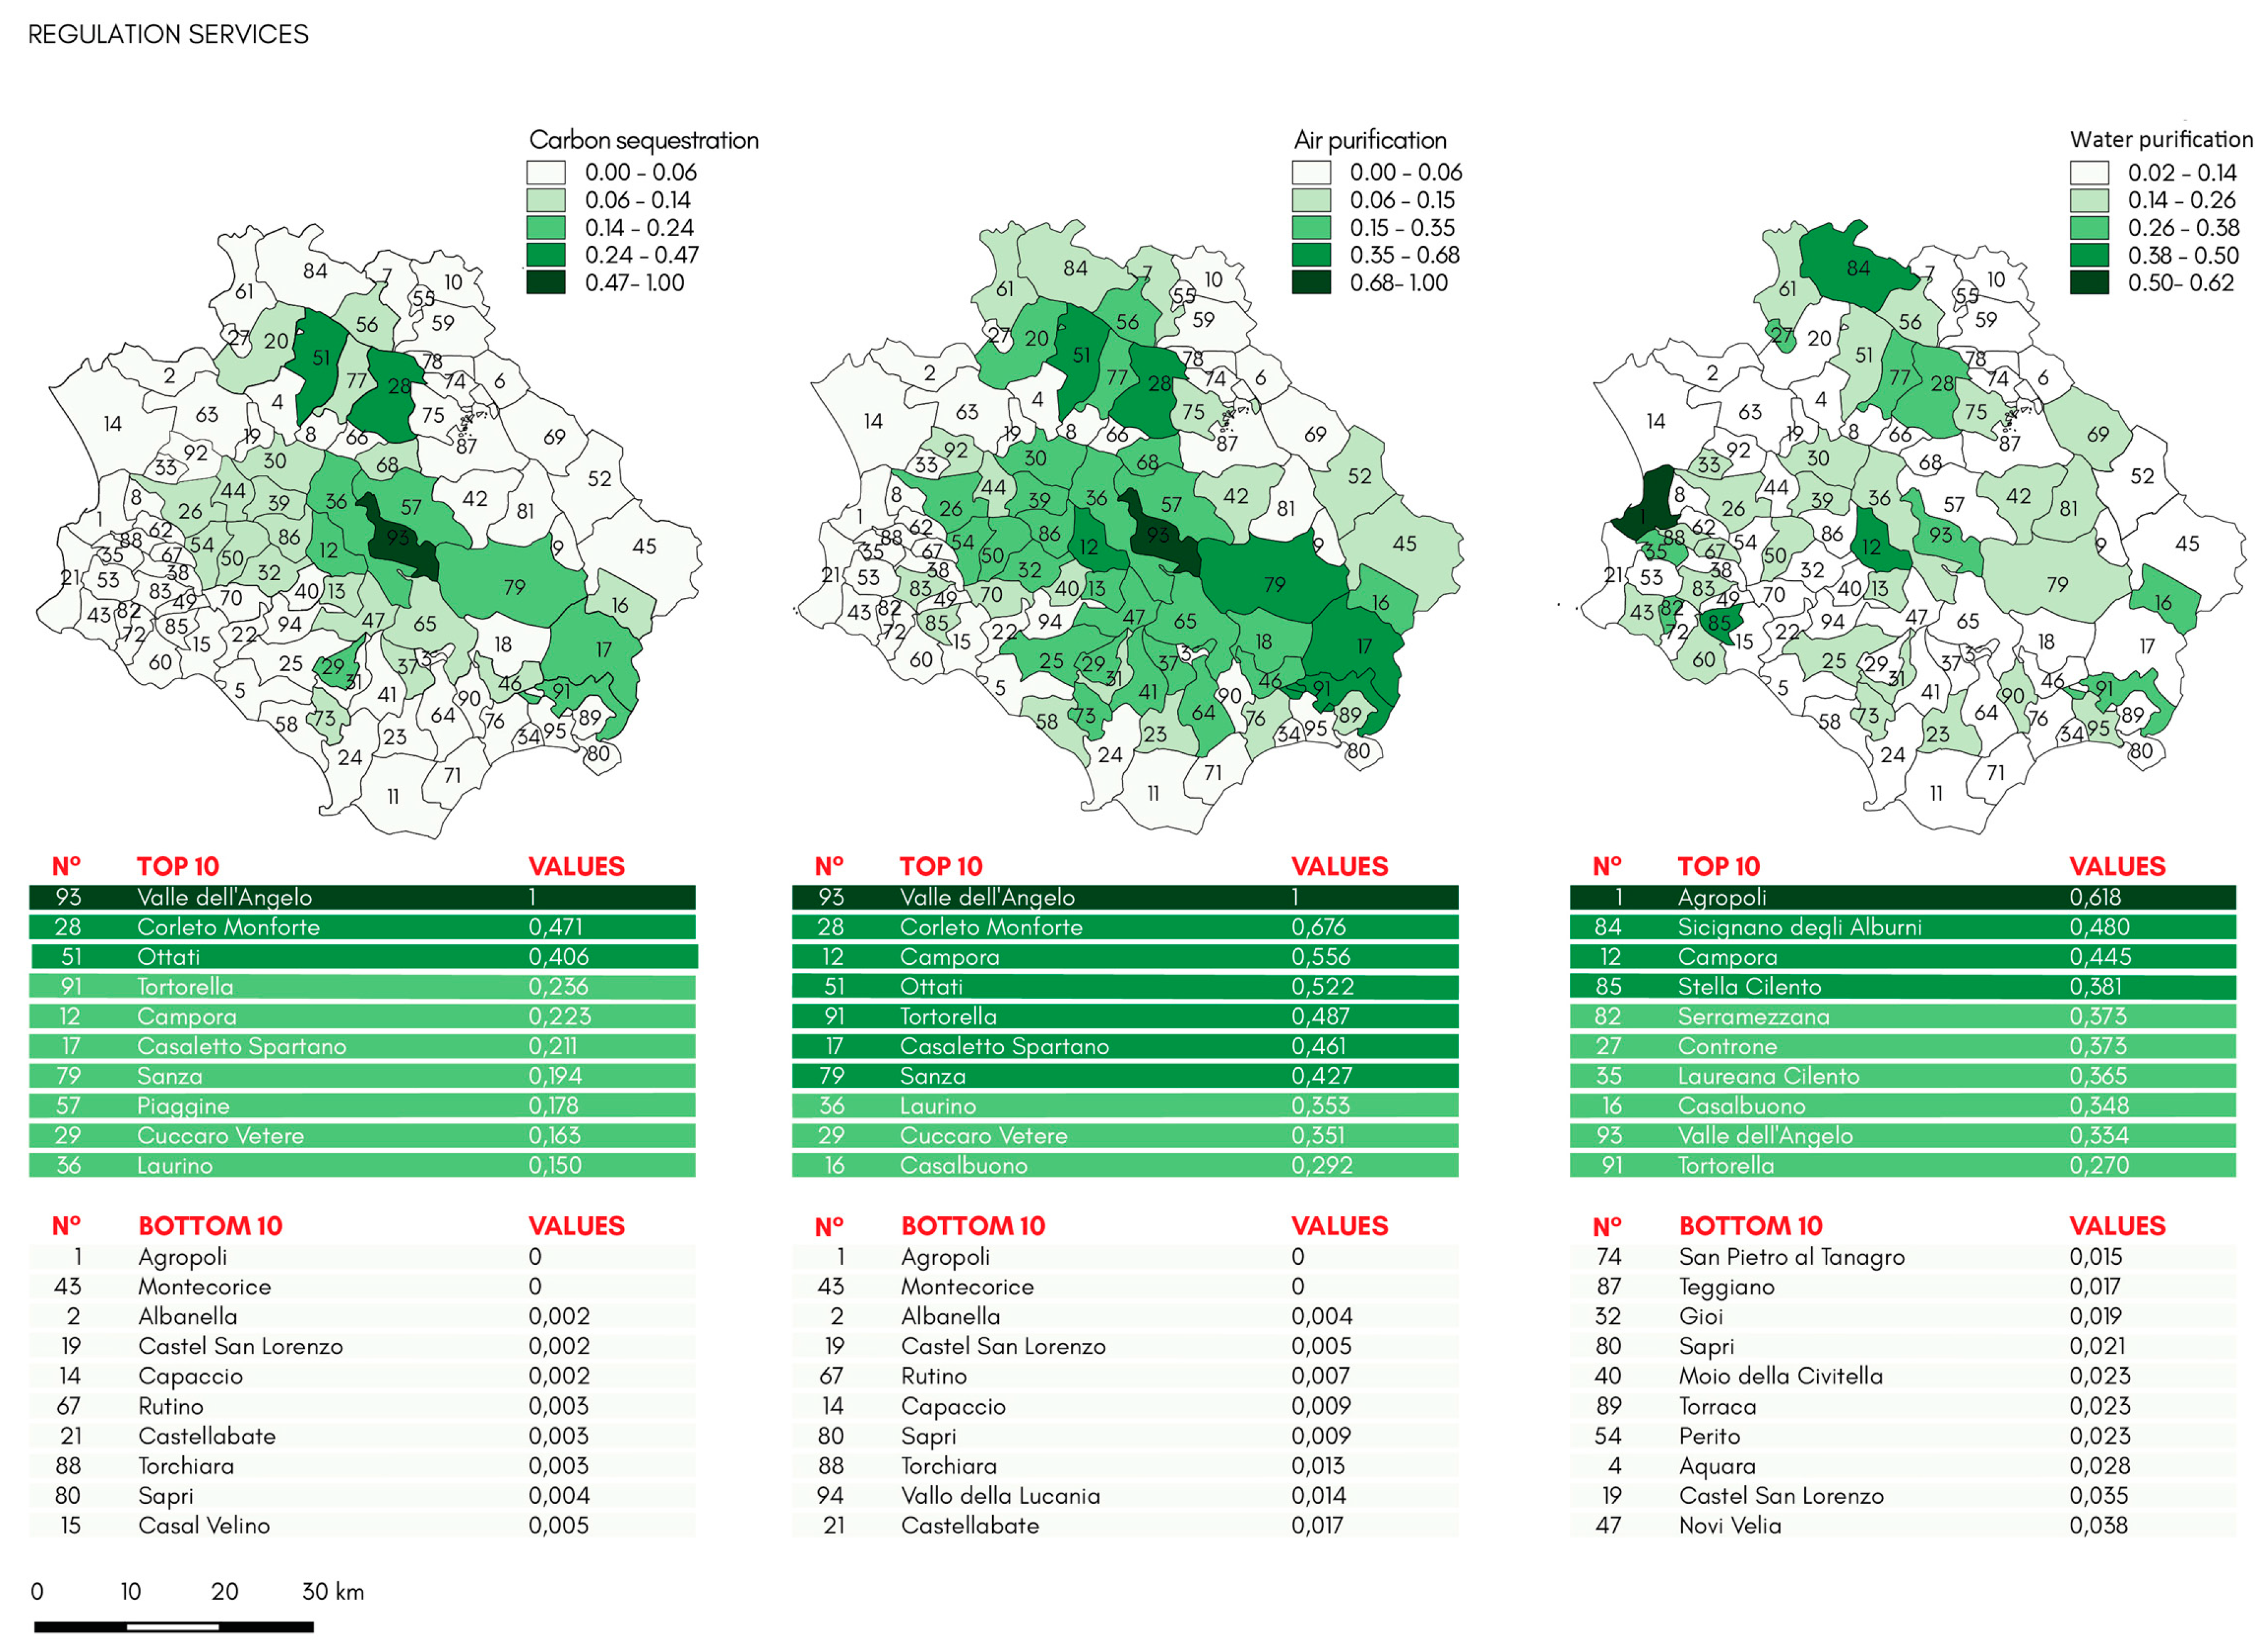
3.1.2. C2. Regulation

C2.1—CO2 Sequestration

The partial assessment of CO2 sequestration was divided into stock (carbon storage) and process (carbon sequestration). The stock (or carbon storage) was calculated on the basis of the average epigeal mass (stems, big branches, stumps) per hectare (by forest type). This method (Figure 11a) consists of an adaptation of the one used in the National Carbon Accounting [57] that was based on the IPCC (Intergovernmental Panel on Climate Change) methodology, considering three of the five forest reservoirs (epigeal mass, hypogeum mass and litter). Contributions from forest and dead biomass soil have not been considered as significantly dependent on forest management. The phytomass was converted into carbon considering a generalized carbon/phytomass ratio (0.5). To quantify the stock (tons of carbon fixed by the forest in the site) the following data by INFC have been used [58]:
  • EP: Epigeal phytomass (trunks, thick branches, branches) per hectare, region and forest type;
  • RS: Root/shoot ratio, that converts the epigeal biomass into underground biomass;
  • LE: Litter’s carbon—epigeal mass’ carbon per hectare, that converts the epigeal biomass into litter.
The formula is the following:
t C = [ t E P t , r × a t , i + ( E P t , r × a t , i ) × R S t + ( E P t , r × a t , i ) × L E t ] × 0.5
where:
tC = tons of carbon set by the forest;
Σt = summation by forest type t;
at,i = area of forest type t for site i;
EPt,r = EP for forest type t for region r;
RSt = RS for forest type t;
LEt = LE for forest type t.
The estimate of the demand (Figure 11b) was quantified on the basis of the per capita production of CO2 estimated by ISPRA and disseminated on the ISTAT website. This figure includes gas emissions called Land Use, Land Use Change and Forestry (LULUCF), resulting from land use, land use change and forest management. By contrast, emissions from maritime cruise traffic, flight emissions from aircraft, gas and oil extraction plants in the sea were excluded from the calculation. In Campania region, in which NPCVDA lies, the production is 3.7 t/ha.
Regarding the process (or carbon sequestration), instead, the estimate of the supply has been developed for the epigeal component of the forests only, as there is no data of volumetric expansion of the roots nor of the carbon stored in the ground or in the litter. Therefore, the data relative to the current increase was used, according to the arboreal phytomass present for each forest type, differentiated by region. The phytomass was converted into carbon by considering a generalized carbon/phytomass ratio (0.5) and a fresh weight/dry weight ratio specific for forest type. For the quantification of the process (forest carbon tons per year, per site) the following INFC data has been used:
  • Incr: Current increment of epigean tree volume per hectare, by region and by forest type;
  • BEF: Biomass Expansion Factor (epigeal biomass/growing stock);
  • WBD: Basal density of wood dry weight/fresh weight (tons/cubic meters).
The formula is the following:
t C a = t I n c r t , r × a t , i × B E F t × W B D t × 0.5  
where:
tCa = tons of carbon per year;
Σt = summation by forest type t;
Incrt,r = Incr for forest type t for region r;
at,i = area of forest type t for site i;
BEFt = BEF for forest type t;
WBDt = WBD for forest type t.
Figure 11c shows the evaluation for this theme.

C2.2—Water Purification

The estimate of the supply (Figure 12a) is based on the abatement (absorption) capacity of the civil and agricultural nitrates by the river ecosystem.
For the purification of water from civilian spills (Figure 12b), the watercourses and the relative riparian belt were considered in which the purifiers or, in the absence of them, the sewers discharge the waste water.
For the abatement of agricultural nitrogen, only watercourses falling into agricultural areas were considered, intersecting the regional hydrographical network with the Cartography of Agricultural Use of Soils provided by Campania Region [59].
The estimate of the demand refers to the demographic and agricultural nitrogen spills reported in the Campania Region Water Protection Plan (2007). Figure 12c shows the evaluation for this theme.

C2.3—Air Purification

The pollutant considered is PM10; to calculate the supply (Figure 13a) or storage of this particulate by the vegetation the information provided by Corine Land Cover (2012) was used, calculating an average coefficient of annual capture by type of vegetation covering the soil. The demand (Figure 13b) corresponds to the total emissions of particulates from all the sources that can be linked to human activity, such as combustion processes (in combustion engines, in heating systems, in many industry activities, incinerators and thermal power plants), brakes, asphalt, or natural springs, such as soil erosion, volcanic eruption, forest fires, pollen dispersal and sea salt. It is calculated by means of a regional normalized population coefficient, corresponding to 0.002 tons/per capita multiplied by the inhabitants of each municipality of the examined site. Example:
  • PM10 sequestration per class of Corine Land Cover: Broadleaf 1.6 t/ha;
  • PM10 emissions: 0.002 t/per capita.
Figure 13c shows the evaluation for this theme.

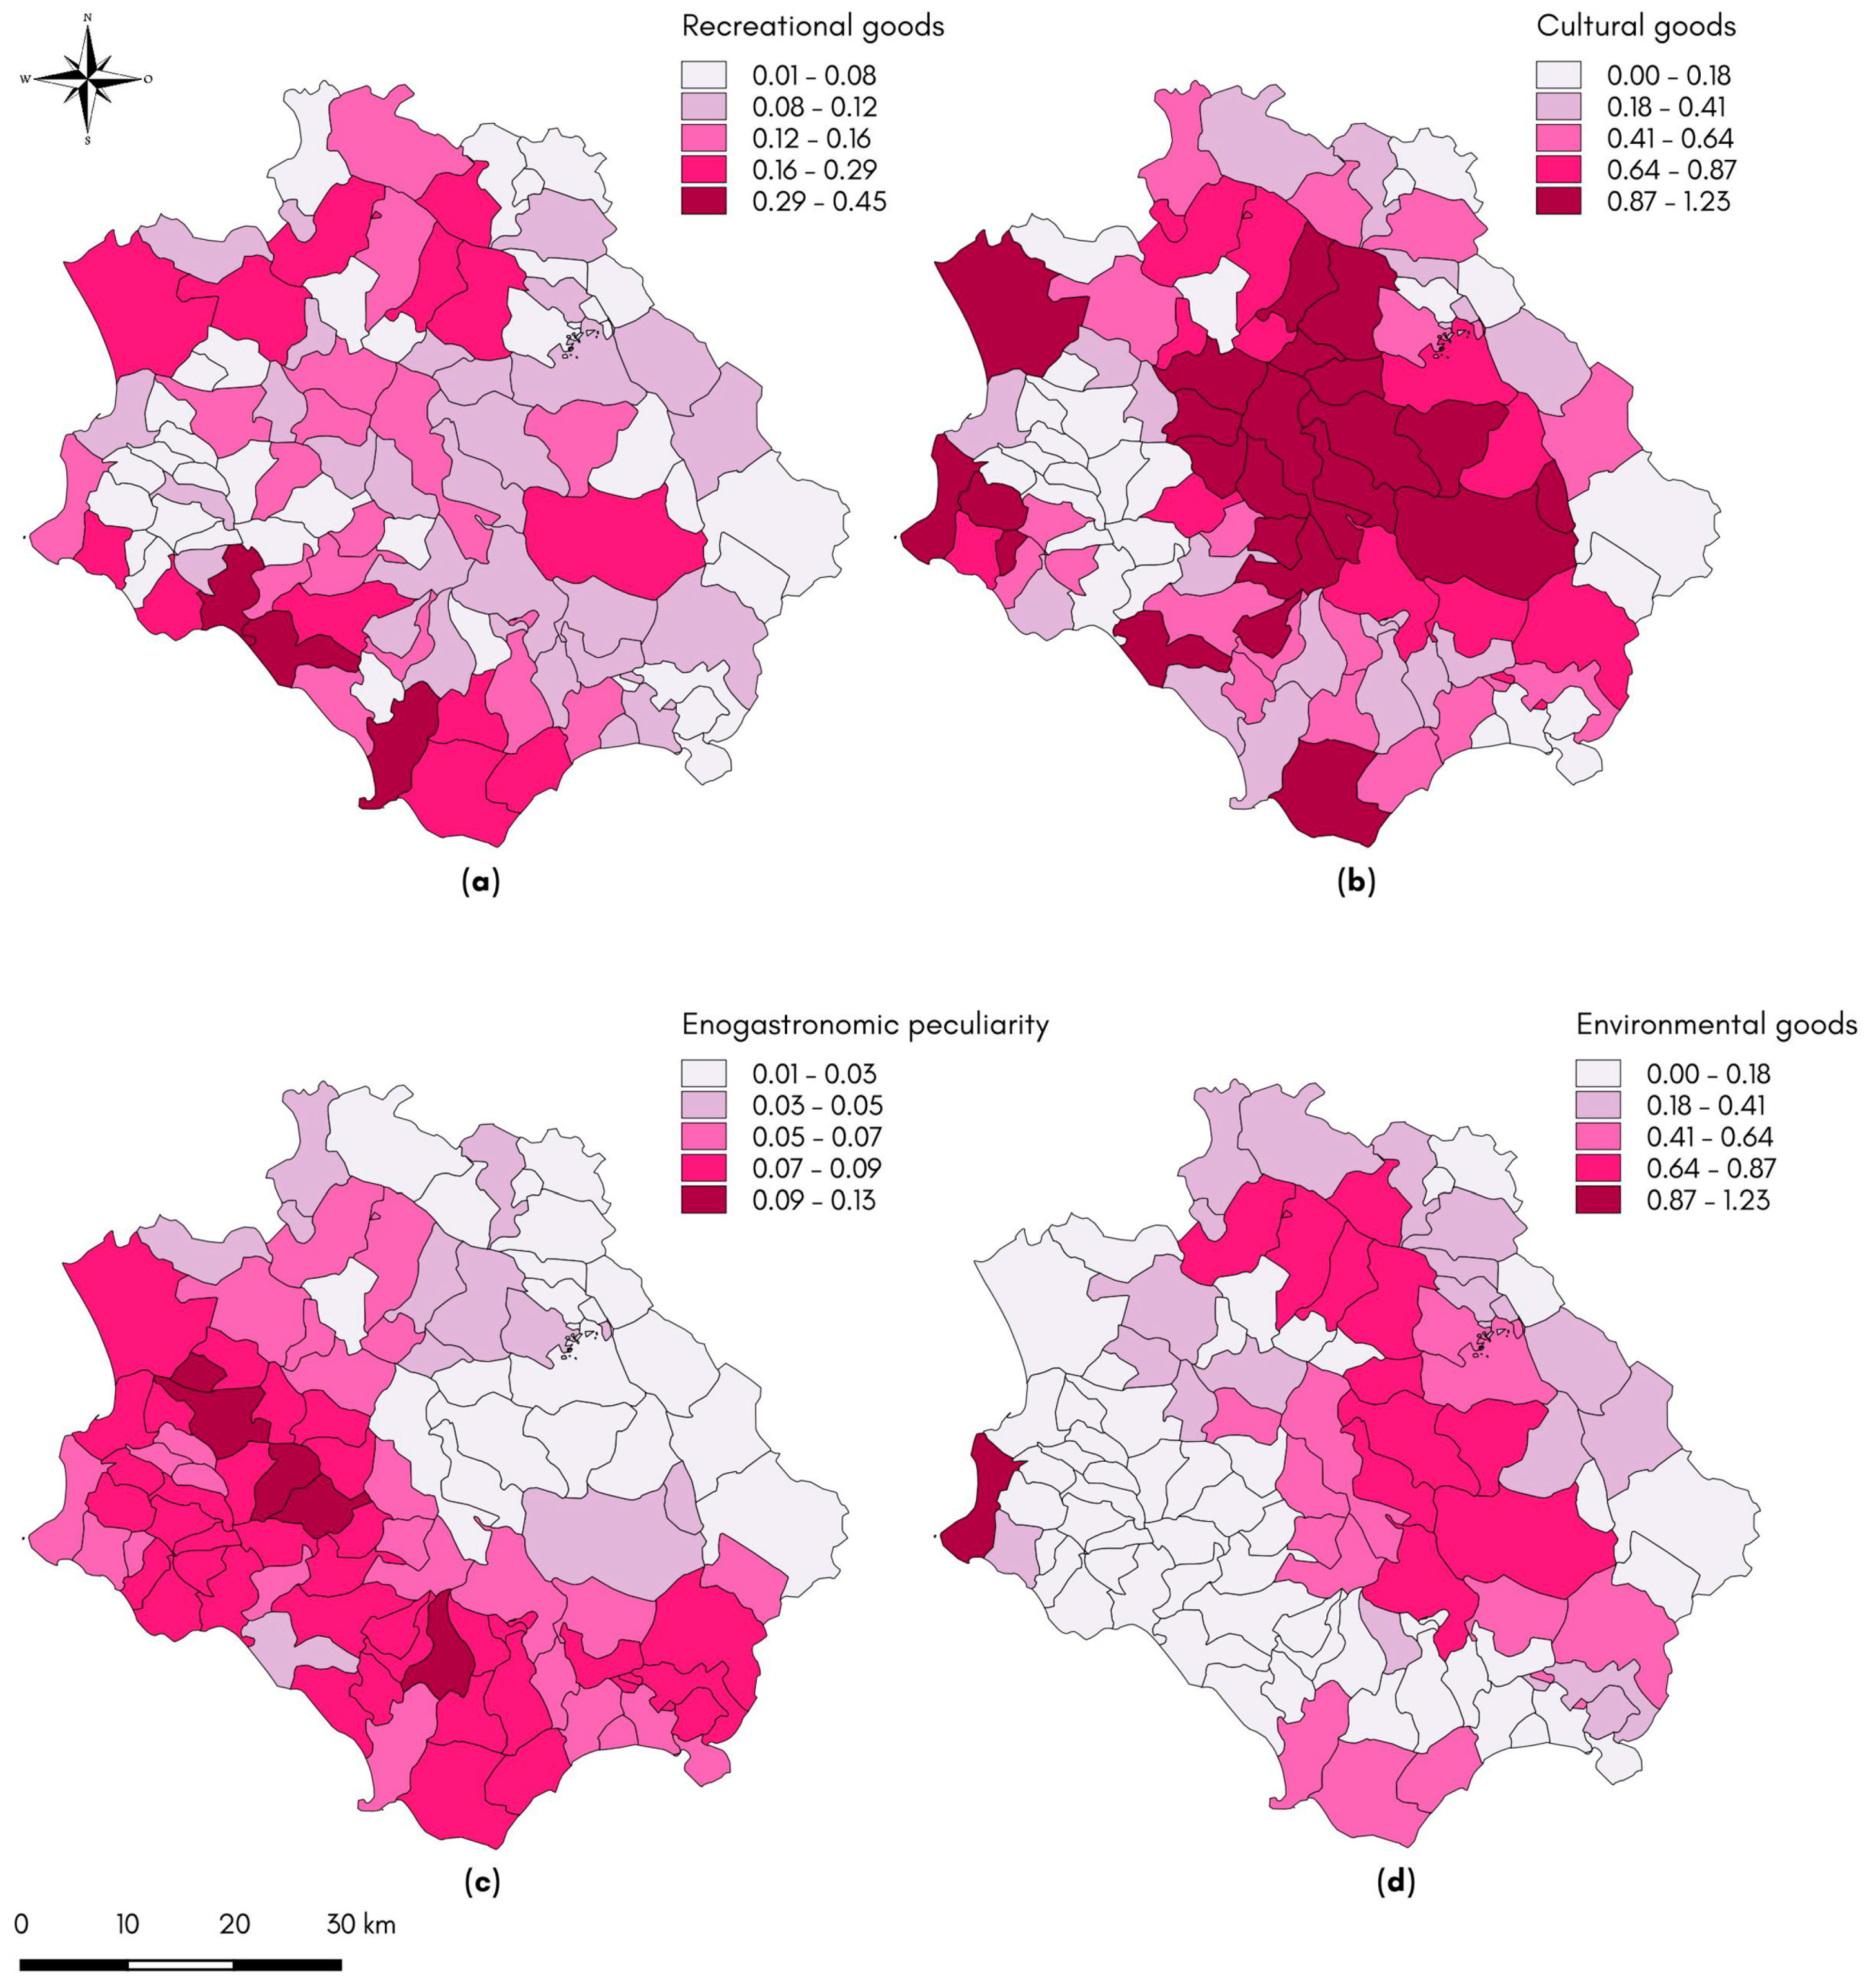
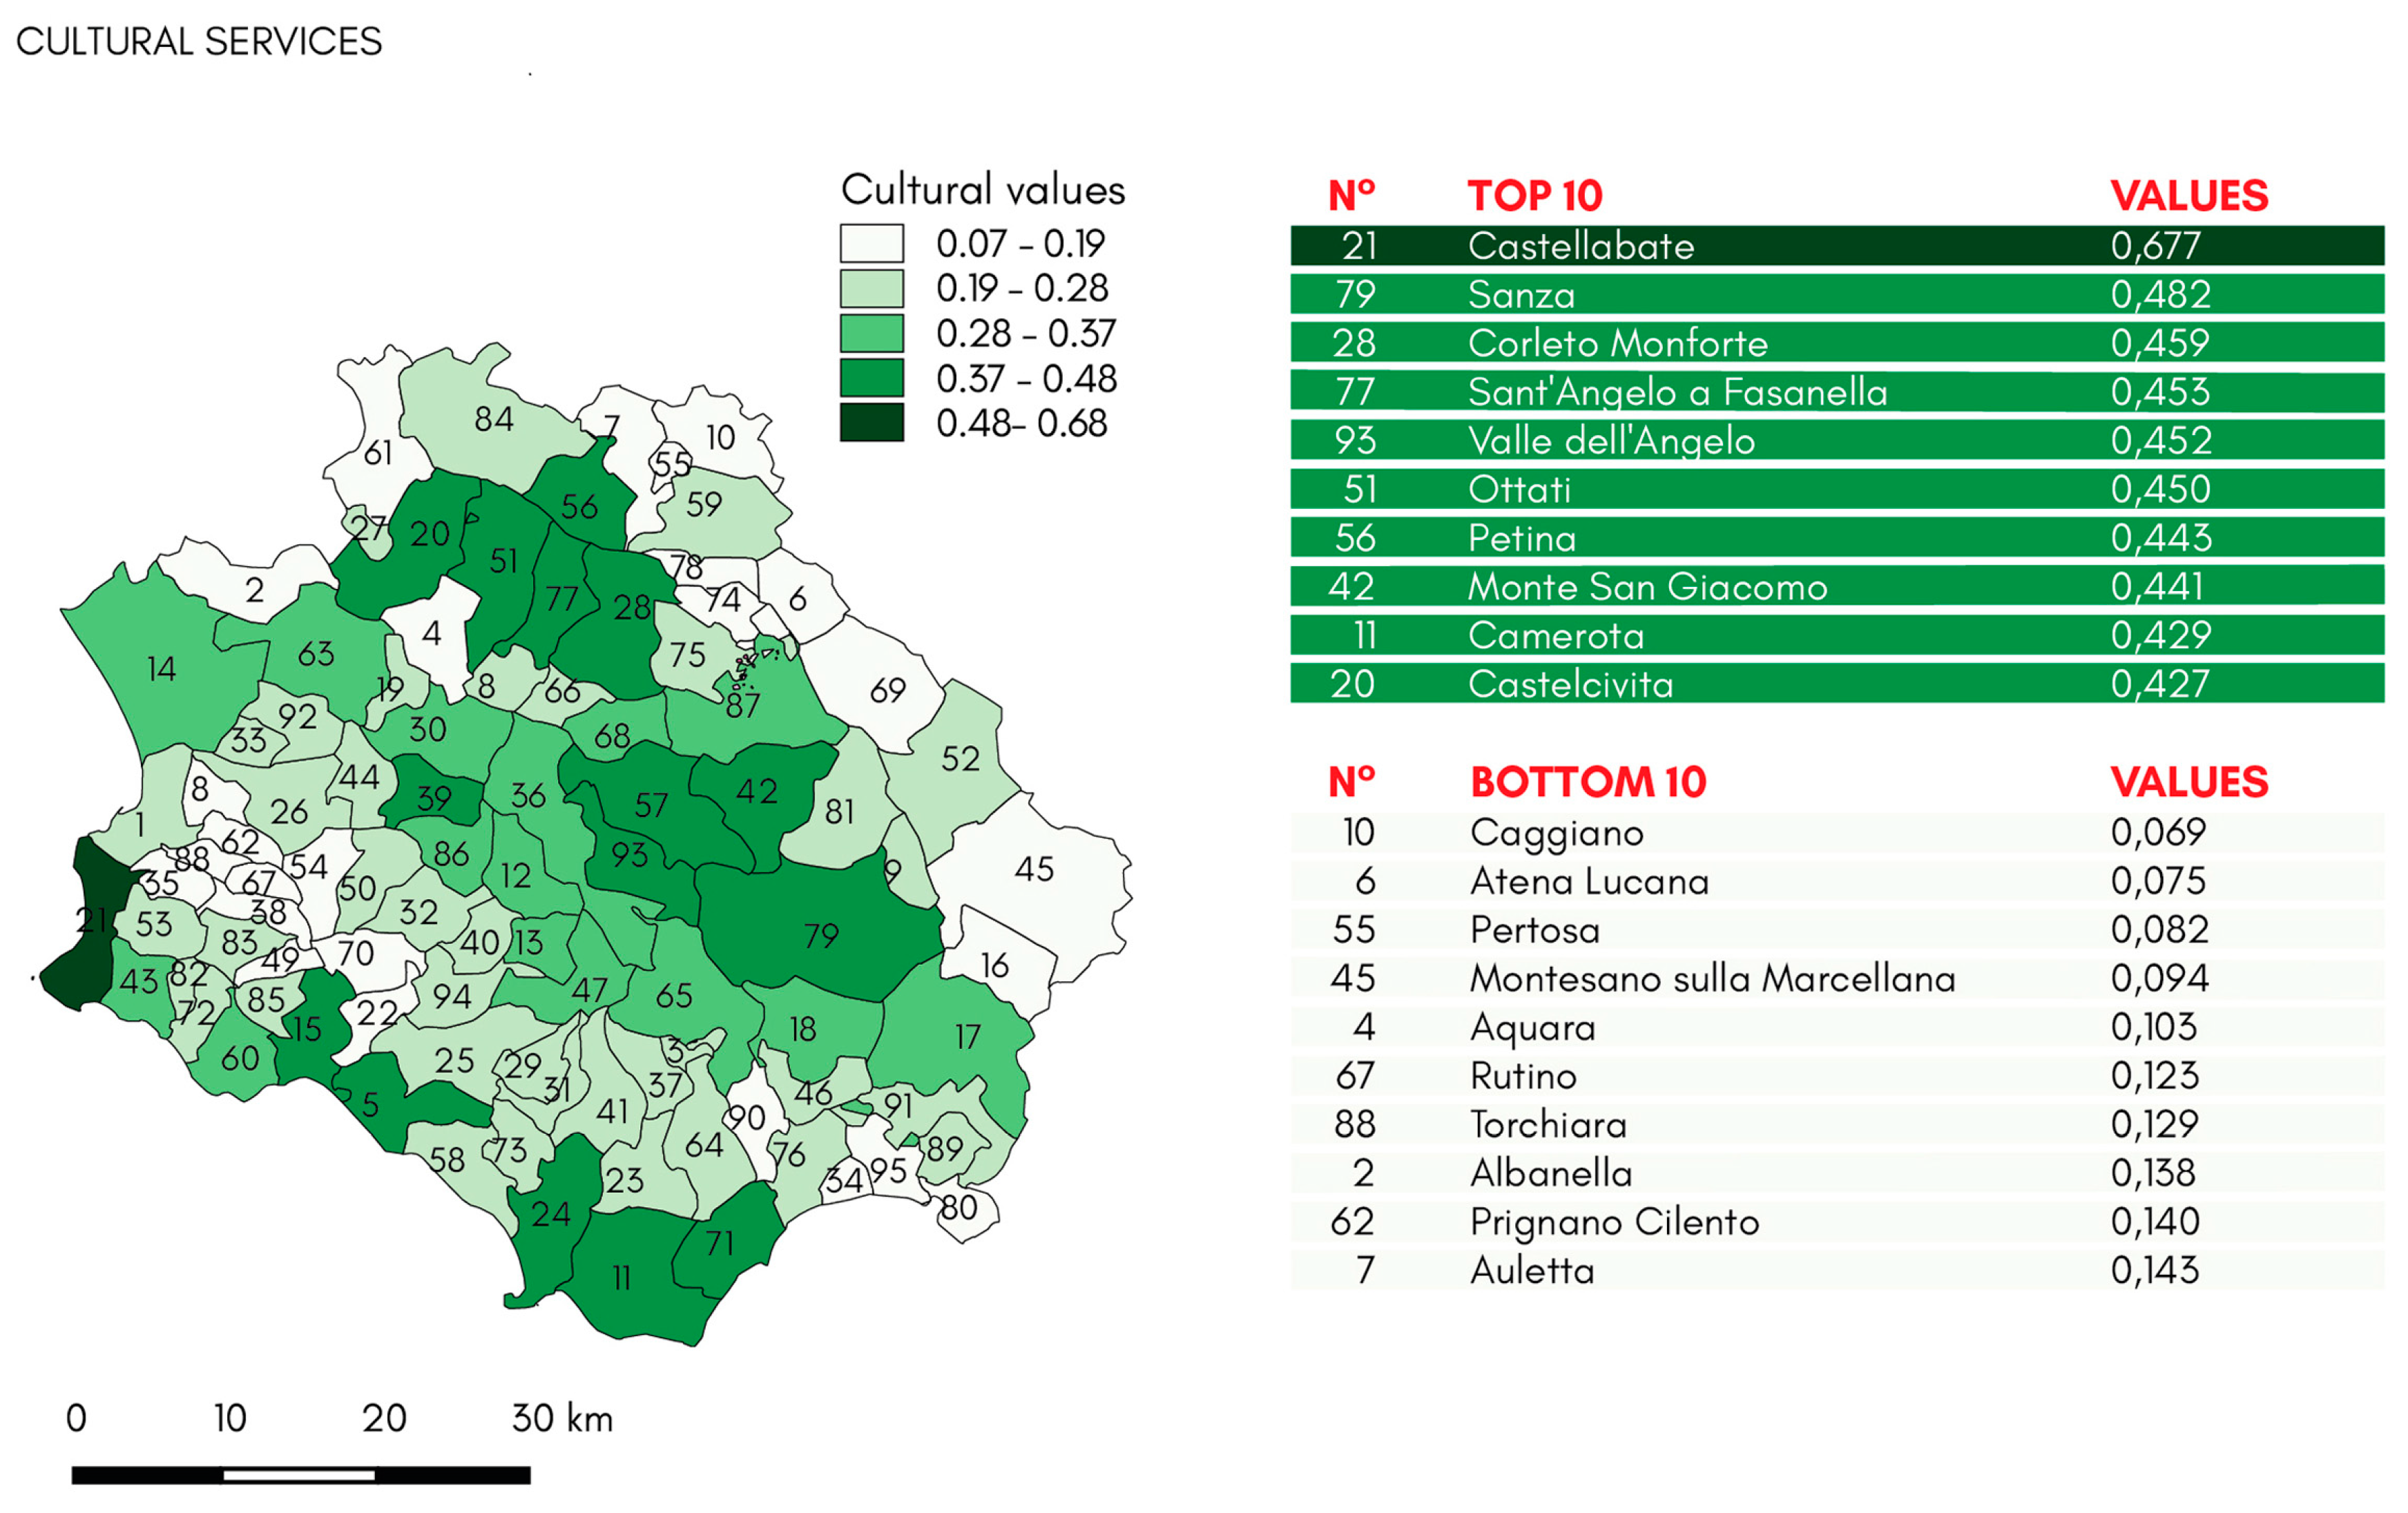
3.1.3. C3. Cultural Values

C3.1—Maps of Concentration

For the estimation of the ecosystem service of cultural values, unlike the other services, an elementary quantification of the elements present in the area has been used, and these are classified in precise and areal, generating thematic maps of concentration. The area elements were first translated into percentage area within the municipality, then onto a scale from 0% to 100%. They were normalized on a scale from 0 to 1, while the punctual elements were directly normalized on the basis of the minimum value and maximum of the total cartographic elements. The themes were recreational goods (Figure 14a), cultural heritage (Figure 14b), food and wine peculiarities (Figure 14c), and environmental goods (Figure 14d).

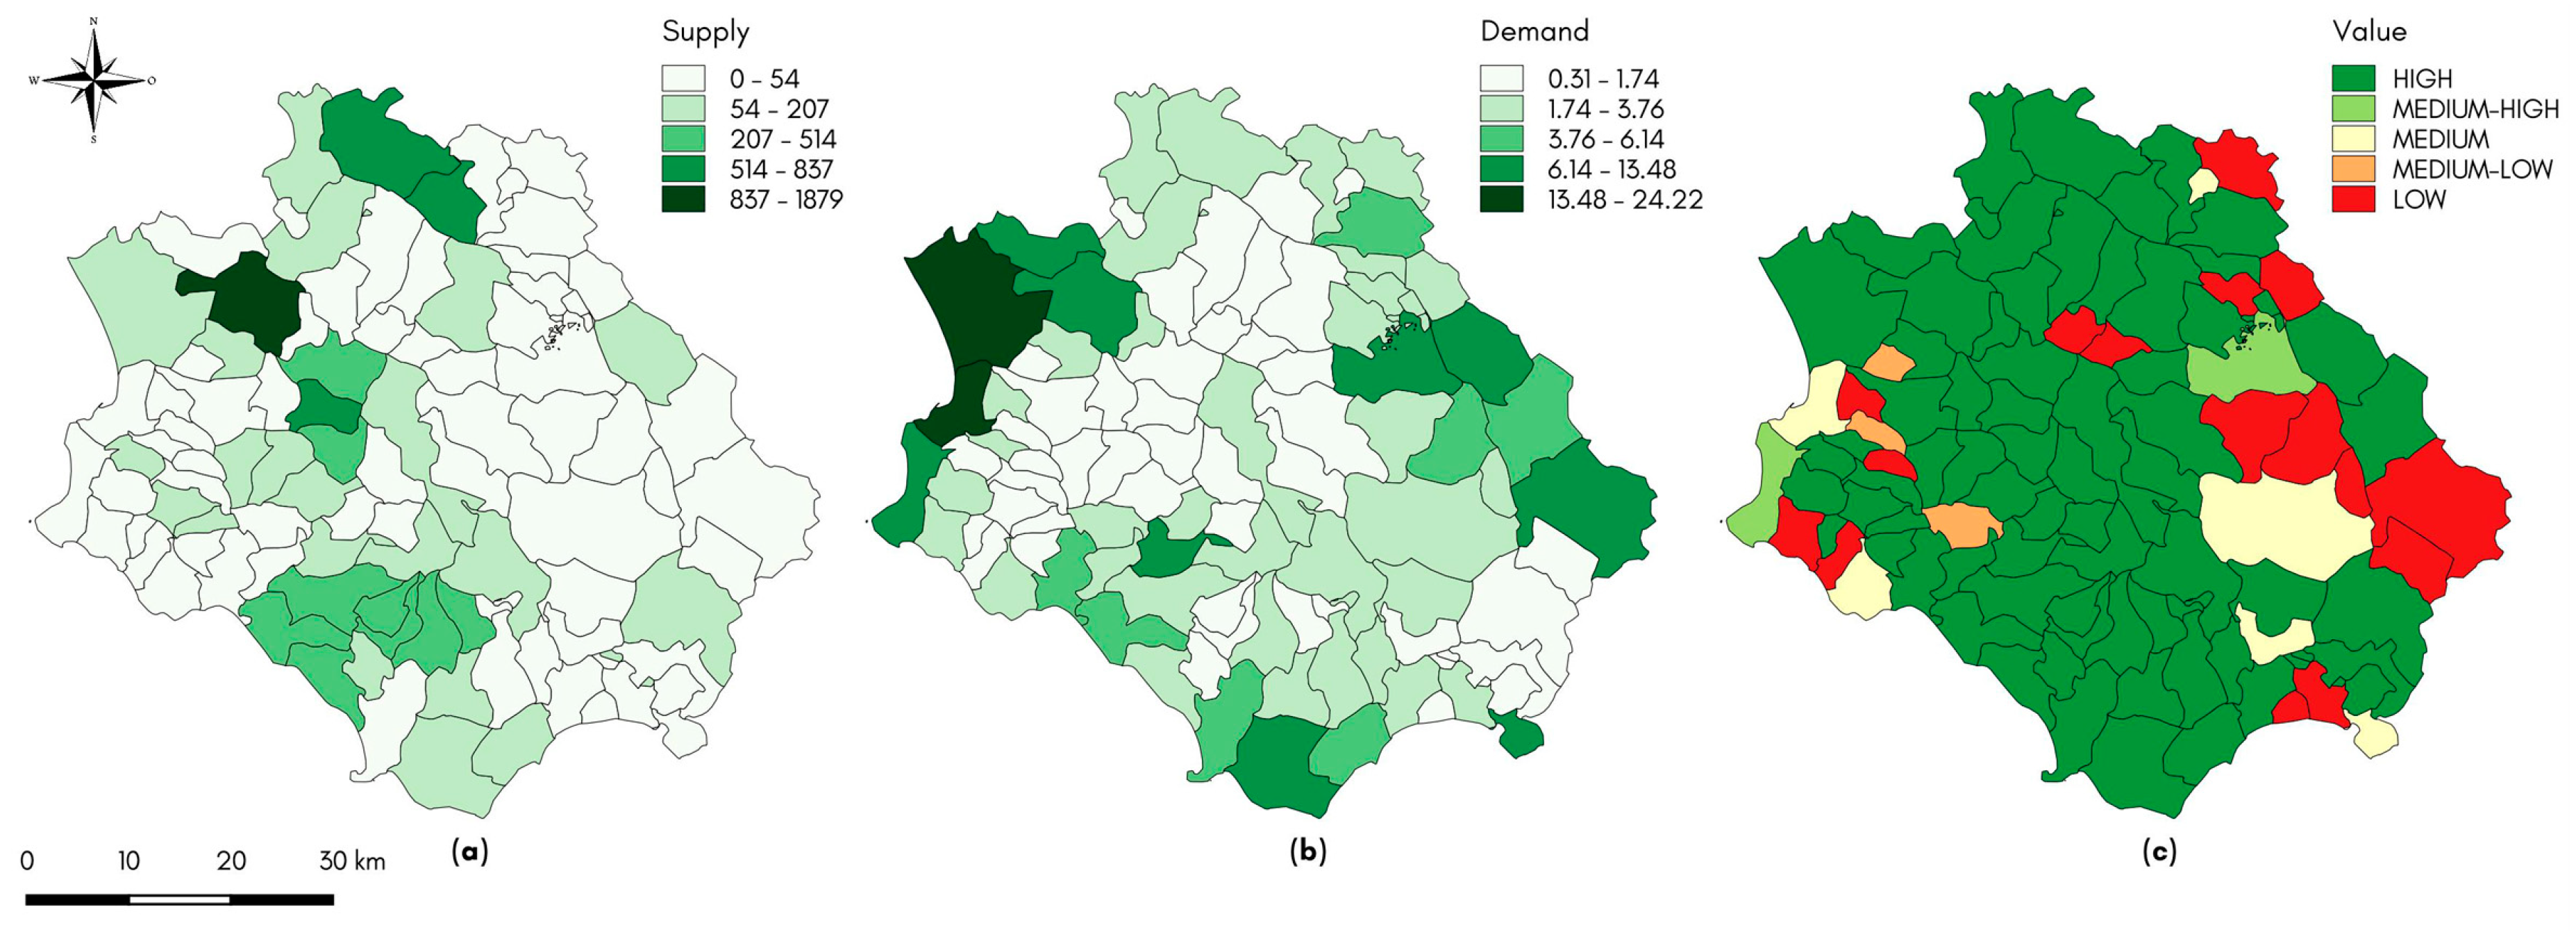
3.2. Results from Phase Two: GeoTOPSIS

The TOPSIS method (Figure 15, Figure 16 and Figure 17) allows the mapping of the satisfaction of the demand for ecosystem services on the Cilento territory: They can be presented for each proposed theme. In particular, through color gradations, the graphic restitution of ecosystem services assessment shows the municipalities and, more generally, the areas approaching the ideal point taken as 1 on a scale of normalization that goes from 0 to 1 and, therefore, in this specific case, meets the offer of the ecosystem service analyzed to be most suitable.
For example, for the theme of agriculture and crops, the municipalities expressed with the darkest color gradation are Aquara and Prignano Cilento but, in general, the most positive trend is found in the hilly area, given the conspicuous distribution of agricultural land for olive groves and vineyards. The lighter colors represent the municipalities located, for the most part, on the mountainous areas and the Sele and Vallo di Diano plains also have a significantly higher population density. The ecosystem service with the maximum negativity is fodder and pasture, with all values equal to 0.
Apart from the cultural values, where the positive situation is spread over almost the whole territory focusing on the coastal and mountain range, all the other ecosystem services are satisfactory, especially the municipalities falling within the internal areas classified by ISTAT (Italian National Statistical Institute). This tends to shape a situation of dualism between coastal areas and inland areas, in line with the national trend, addressing a substantial positive perspective for internal areas through this assessment. In fact, these are the spearhead of many ecosystem services, especially concerning climate regulation, water cycles and air purification.
Starting from this assessment, it is possible to ascertain the services to be increased or protected to activate management policies suitable for the territory, which consider the conflicts between the ecosystem services and are, therefore, effective for stimulating the supply of these ecosystem services.

4. Discussion and Proposals

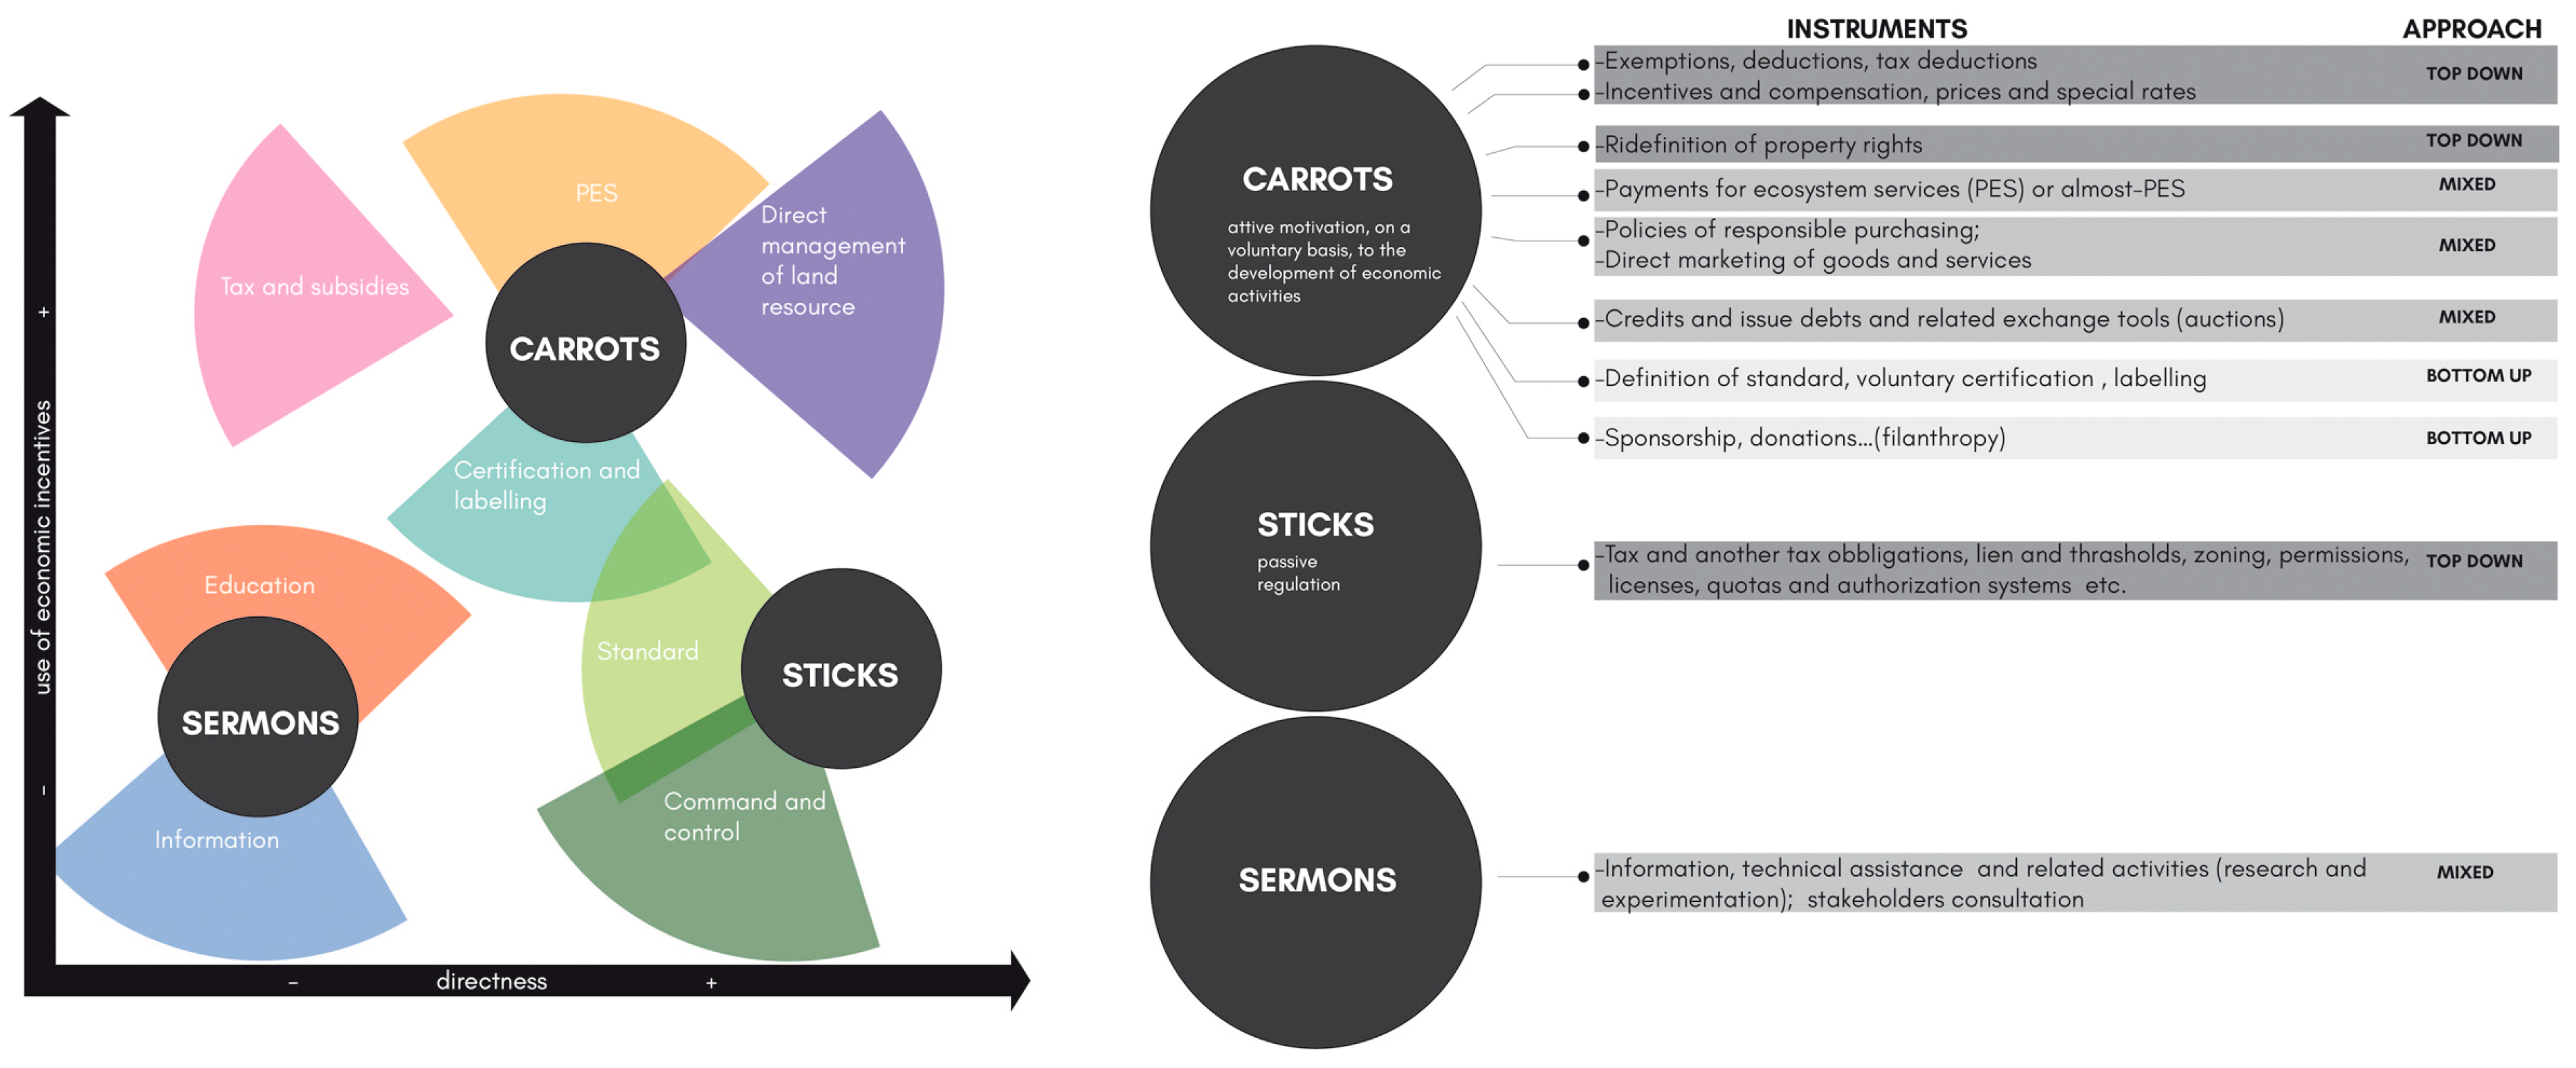
4.1. How to Stimulate the Offer of Ecosystem Services

Based on the known classification proposed by Bemelmans-Videc et al. in 1998 [60], market regulation can be divided into three groups of instruments: Carrots, sticks and sermons (Figure 18). These are tools to promote the provision of environmental services. Over the last decades, there has been a significant shift of attention from the regulatory, general and binding instruments for the various economic subjects involved (sticks), to the tools based on incentives and compensation (carrots) and, more recently, to initiatives for accession voluntary activities linked to the creation of new markets. This transformation can be understood in light of the greater effectiveness and efficiency of these instruments compared to those of regulation, but also in relation to the current trend of considering that the creation of new markets, accompanied by a pro-active role of companies and civil society, represents an innovative and extremely promising form of intervention in the field of supply policies for public or common services, and in particular those concerning the environment.

4.2. Chosen Strategies

4.2.1. Payment for Ecosystem Services

Among the tools associated with creating new markets, increasing attention is given to tools such as Payments for Ecosystem (or Environmental) Services (PES). PES comprises of tools created to stimulate the production of positive environmental externalities, turning them into real products that can be sold on the market. PES schemes link two parts—a seller and a buyer—through a voluntary contract. In reality, the number of actors involved often requires the function of mediation of a third party, such as a technical agency, an association, a public authority or a single professional, to which the contracting parties delegate the management contract and control of the effective provision of the environmental service and of the economic relations between users and producers [61]. In order to create contracts for PES, according to Wunder [62], five conditions have to be met: (1) The identification of a well-defined environmental service to be exchanged, (2) the presence of at least one buyer and (3) at least one seller, (4) the voluntariness between the parties to market an environmental service and finally (5), the conditionality of the payment, according to which the producer is obliged to act actively to ensure the environmental service over time (a single exchange, in fact, is not sufficient for the formation of a real market for the service, which is the end of a PES mechanism).

4.2.2. Community Agricultural Policy

Greening, which pursues environmental goals, has been strongly desired by the European Commission. Member States must reserve a 30% share of national resources on direct aid Community Agricultural Policy (CAP), which for Italy amounts to about 1.1 billion euro a year. It follows that greening farmers in possession of the new PAC rights (assigned to 15 May 2015), will receive a payment per hectare that will be added to the basic payment, partly recovering the initial cut which is expected, as mentioned, to be equal to 45%, compared to that perceived in 2014. Italy has decided to apply the greening proportionally to the value of the basic premium, to the extent of about 60% of the latter. Faced with the recognition of a specific aid, farmers are asked for three greening commitments: The diversification of arable land, the maintenance of permanent forage crops and the creation of ecological focus areas. In this regard, it is emphasized that the obligations arising from the green payment do not apply to permanent crops and tree crops, but only to arable land. In addition, they do not apply to farms operating under organic farming, because they are already considered adequate from an environmental point of view, while perceiving the payment of greening. It affects the arable land with the following obligations: Up to 10 hectares, no obligation of diversification; from 10 to 30 hectares, an obligation of at least two different crops, with the main crop’s maximum coverage of 75% of the arable land area; over 30 hectares, an obligation of at least three different crops, with the main crop’s maximum coverage of 75% of the area and the two main crops that can cover a maximum of 95% of the arable land area. Therefore, at least 5% of the area must be reserved for the third crop. For example, a company with 50 hectares will have to guarantee at least three crops, the first will not exceed 37.5 ha (75%), the first two will not have to exceed 47.5 ha together (95%), then the third will they must assign at least 2.5 ha (5%). This does not mean that the producer could devote 33.3% of the arable land area to each crop, in an indistinct way.

4.2.3. Landscape Labelling

Horizontal labelling is a new concept of PES that seeks to combine elements of PES with product certification on a landscape scale. Landscape labelling proposes that rural landscapes that provide valuable ecosystem services get a landscape label, whereby products derived from this landscape could be differentiated and highly appraised in the global market. One of the main objectives of landscape labelling is to provide benefits to communities, rather than to individual landowners, based on the continued provision of ecosystem services evaluated on a landscape scale, rather than on a private property scale. In this way, landscape labelling also seeks to overcome some of the current challenges, including the assessment of opportunity costs and the provision of ecosystem services, high transaction costs, difficulty in ensuring cross-compliance and a limited inclination that leads to an unfair distribution of benefits. As such, landscape labelling would provide incentive management to continue meeting the cocoa and rubber ecosystem service criteria offering opportunities for landscape labelling implementation that is specifically aimed at encouraging small landowners within a landscape mosaic. As such, landscape labelling would provide incentive management to continue meeting the criteria of the ecosystem service required for certification. The label, with its associated conditionality criteria, could act as a mechanism for securing additional payments for ecosystem services, which, as part of a landscape certification scheme, would be delivered to community-based organizations for economic and social projects. This could benefit from a wider range of people than possible in the current PES model.

5. Conclusions

As previously stated, NPCVDA has a large extension (almost five times the average size of the European parks), but also has a very high resident population inside (about 230,000 units living in the 80 municipalities of the park, with an average density of 80 inhabitants per km2) which makes it a particularly significant case of a heavily anthropized protected area.
This intense anthropization (with respect to the density normally found in a protected area) determines a complex network of social-economic relations that varies across the territory and is mostly organized, with rare exceptions, in aggregates of small and medium-sized settlements.
The settlement and productive distributions show considerable divergence between a very anthropized coastal strip linked to tourist presences and an extensive internal area dependent on a particularly complex geographic conformation based on socio-economic and cultural systems closely linked to predominantly rural models.
NPCVDA is a territory in which historical, social, economic and artistic needs have historically overlapped, which has reached its current form in association and response to its natural environment.
Agricultural activities, which have largely affected the Cilentan territory, have not eliminated the biological potentialities in terms of biodiversity, but instead have determined agroforested and semi-natural ecosystems of notable landscape value.
Therefore, assessment of ecosystem services provides support to public decision-makers in identifying actions that can be implemented in the conservation of habitats and species that generate ecosystem services. Moreover, it is functional to the identification and quantification of the economic and social benefits deriving from it. In particular, regarding our case study, the internal areas of the National Park of Cilento, Vallo di Diano and Alburni, as strong ecosystem services producers, need policies that are careful to contain the very high trend of depopulation. Coastal areas, with their strong summer tourist flows, could offset the disparities in the production of ecosystem services with a payment that could act as an incentive for the mitigation of the depopulation trend of the internal areas.
A suitable management plan of the environment passes necessarily through the integration of ecological, economic and socio-political elements within an interdisciplinary framework [63]. For this reason, evaluations of ecosystem services are an important and essential tool for territory knowledge. They could enrich municipal or wide area urban plans, which always seems too subjective and not very feasible from the point of view of landscape and environment protection.

Author Contributions

This paper was conceived and written jointly by the authors. P.D.T. formulated the research questions; N.F. performed the calculations and analyzed the data; E.M. was involved in data collection and analysis; A.D. were concerned with the research motivations, the structure and comprehensiveness of the paper.

Funding

This research received no external funding.

Conflicts of Interest

The authors declare no conflict of interest.

References

  1. De Groot, R.; Fisher, B.; Christie, M.; Aronson, J.; Braat, L.; Gowdy, J.; Haines-Young, R.; Maltby, E.; Neuville, A.; Polasky, S.; et al. Integrating the ecological and economic dimension in biodiversity and ecosystem service valuation. In The Economics of Ecosystems and Biodiversity: Ecological and Economic Foundations; Kumar, P., Ed.; Earthscan: London, UK, 2010; pp. 11–40. [Google Scholar]
  2. Burkhard, B.; Muller, F. Drivers-Pressure-State-Impact-Response. In Ecological Indicators; Volume 2 of Encyclopedia of Ecology; Jørgensen, S.E., Fath, B.D., Eds.; Elsevier: Oxford, UK, 2008; pp. 967–970. [Google Scholar]
  3. Millennium Ecosystem Assessment. Ecosystems and Human Well-Being: Biodiversity Synthesis; World Resources Institute: Washington, DC, USA, 2005; Available online: http://www.millenniumassessment.org/ (accessed on 1 June 2018).
  4. Costanza, R.; dArge, R.; de Groot, R.; Farber, S.; Grasso, M.; Hannon, B.; Limburg, K.; Naeem, S.; Oneill, R.V.; Paruelo, J.; et al. The value of the world’s ecosystem services and natural capital. Nature 1997, 387, 253–260. [Google Scholar] [CrossRef]
  5. D’Auria, A.; Monti, B. The guardianship of the landscapes between identification and assessment: Ischia and its lost identity. In Society, Integration, Education: Utopias and Dystopias in Landscape and Cultural Mosaic: Visions Values; Vulnerability, Vol. IV, Proceedings of the International Scientific Conference on Society, Integration, and Education Location, Udine, Italy, 27–28 June 2013; PSRI of Rezekne Higher Education Institution: Rezekne, Latvia, 2013; pp. 165–176. [Google Scholar]
  6. D’Auria, A.; Pugliese, S. The governance of UNESCO cultural landscapes between universal values and local identity: The case of Campania. In Society, Integration, Education: Utopias and Dystopias in Landscape and Cultural Mosaic: Visions Values Vulnerability, Vol. V, Proceedings of the International Scientific Conference on Society, Integration, and Education Location, Udine, Italy, 27–28 June 2013; PSRI of Rezekne Higher Education Institution: Rezekne, Latvia, 2013; pp. 189–200. [Google Scholar]
  7. Layke, C.; Mapendembe, A.; Brown, C.; Walpole, M.; Winn, J. Indicators from the global and sub-global Millennium Ecosystem Assessments: An analysis and next steps. Ecol. Indic. 2012, 17, 77–87. [Google Scholar] [CrossRef]
  8. TEEB. The Economics of Ecosystems and Biodiversity—An Interim Report 2008. Available online: http://www.teebweb.org/media/2008/05/TEEB-Interim-Report_English.pdf (accessed on 1 June 2018).
  9. Scolozzi, R.; Morri, E.; Santolini, R. Delphi-based change assessment in ecosystem service values to support strategic spatial planning in Italian landscapes. Ecol. Indic. 2012, 21, 134–144. [Google Scholar] [CrossRef]
  10. ISPRAAnnuario Dei Dati Ambientali 2010. Available online: http://annuario.isprambiente.it (accessed on 1 June 2018).
  11. Kumar, P.; Geneletti, D.; Nagendra, H. Spatial assessment of climate change vulnerability at city scale: A study in Bangalore, India. Land Use Policy 2016, 58, 514–532. [Google Scholar] [CrossRef]
  12. Syrbe, R.-U.; Walz, U. Spatial indicators for the assessment of ecosystem services: Providing, benefiting and connecting areas and landscape metrics. Ecol. Indic. 2012, 21, 80–88. [Google Scholar] [CrossRef]
  13. Van der Ploeg, S.W.F.; Vlijm, L. Ecological evaluation, nature conservation, and land-use planning with particular reference to methods used in the Netherlands. Biol. Conserv. 1978, 14, 197–221. [Google Scholar] [CrossRef]
  14. Geneletti, D. A GIS-based decision support system to identify nature conservation priorities in an alpine valley. Land Use Policy 2004, 21, 149–160. [Google Scholar] [CrossRef]
  15. Maes, J.; Egoh, B.; Willemen, L.; Liquete, C.; Vihervaara, P.; Schägner, J.P.; Grizzetti, B.; Drakou, E.G.; La Notte, A.; Zulian, G.; et al. Mapping ecosystem services for policy support and decision making in the European Union. Ecosyst. Serv. 2012, 1, 31–39. [Google Scholar] [CrossRef]
  16. Burkhardt, B.; Kroll, F.; Müller, F.; Windhorst, W. Landscapes’ capacity to provide ecosystem services: A concept for land cover based assessments. Landsc. Online 2009, 15, 1–22. [Google Scholar] [CrossRef]
  17. Vihervaara, P.; Kumpula, T.; Tanskanen, A.; Burkhard, B. Ecosystem services—A tool for sustainable management of human-environment systems. Case study Finnish Forest Lapland. Ecol. Complex. 2009, 7, 410–420. [Google Scholar] [CrossRef]
  18. InVEST (Integrated Valuation of Ecosystem Service and Tradoff), Natural Capital Project. Available online: https://naturalcapitalproject.stanford.edu/invest/ (accessed on 20 July 2018).
  19. Burke, V.J. Landscape ecology and species conservation. Lands. Ecol. 2000, 15, 1–3. [Google Scholar] [CrossRef]
  20. De Toro, P.; Iodice, S. Qualità degli habitat nei sistemi urbani: Un esperimento per l’area metropolitana di Napoli. Le Valutazioni Ambient. 2018, 1, 137–152. [Google Scholar]
  21. Schirpke, U.; Scolozzi, R.; De Marco, C. Modello Dimostrativo di Valutazione Qualitativa e Quantitativa dei Servizi Ecosistemici Nei Siti Pilota; Report Dell’azione B.1 del Progetto Making Good Natura; EURAC Research: Bolzano, Italy, 2014. [Google Scholar]
  22. Bagstad, K.J.; Semmens, D.J.; Waage, S.; Winthrop, R. A comparative assessment of decision-support tools for ecosystem services quantification and valuation. Ecosyst. Serv. 2013, 5, 27–39. [Google Scholar] [CrossRef]
  23. Fischer, B.; Turner, R.K.; Morling, P. Defining and classifying ecosystem services for decision making. Ecol. Econ. 2009, 68, 643–653. [Google Scholar] [CrossRef] [Green Version]
  24. De Groot, R.; Wilson, M.; Boumans, R. A typology for the description, classification and valuation of ecosystem functions, goods and services. Ecol. Econ. 2002, 41, 393–408. [Google Scholar] [CrossRef]
  25. De Groot, R.S.; Alkemade, R.; Braat, L.; Hein, L.; Willmen, L. Challenges in integrating the concept of ecosystem services and values in landscape planning, management and decision making. Ecol. Complex. 2010, 7, 260–272. [Google Scholar] [CrossRef]
  26. Geneletti, D. Reasons and options for integrating ecosystem services in strategic environmental assessment of spatial planning. J. Biodivers. Sci. Ecosyst. Serv. Manag. 2011, 7, 143–149. [Google Scholar] [CrossRef] [Green Version]
  27. Geneletti, D. Assessing the impact of alternative land-use zoning policies on future ecosystem services. Environ. Impact Assess. Rev. 2013, 40, 25–35. [Google Scholar] [CrossRef]
  28. Burkhard, B.; Müller, A.; Müller, F.; Grescho, V.; Anh, Q.; Arida, G.; Bustamante, J.V.; Chien, H.V.; Heong, K.L.; Escalada, M.; et al. Land cover-based ecosystem service assessment of irrigated rice cropping systems in southeast Asia. an explorative study. Ecosyst. Serv. 2015, 14, 76–87. [Google Scholar] [CrossRef]
  29. ARIES (Artificial Intelligence for Ecosystem Services). Available online: http://aries.integratedmodelling.org/ (accessed on 20 July 2018).
  30. SolVES (Social Values for Ecosystem Services). Available online: http://solves.cr.usgs.gov/ (accessed on 20 July 2018).
  31. TESSA (Toolkit for Ecosystem Service Site-based Assessments). Available online: http://tessa.tools/ (accessed on 20 July 2018).
  32. Cuccurullo, A.; De Toro, P. La valutazione dei servizi ecosistemici: Una sperimentazione del modello InVEST al territorio dei Campi Flegrei. Urban. Inf. 2017, 271, 817–822. [Google Scholar]
  33. Santolini, R. Servizi ecosistemici e sostenibilità. Ecoscienza 2011, 3, 20–23. [Google Scholar]
  34. Santolini, R.; Morri, E.; Scolozzi, R. Mettere in gioco i servizi ecosistemici: Limiti e opportunità di nuovi scenari sociali ed economici. Ri-Vista. Ricerche Progett. Paesaggio 2011, 4, 41–55. [Google Scholar]
  35. Vector MCDA (Multi-Criteria Decision Analysis). Available online: http://maplab.alwaysdata.net/doc/html_VectoMCDA/manual.html (accessed on 5 July 2018).
  36. Rocchi, L.; Massei, G.; Paolotti, L.; Boggia, A. Geographic MCDA for sustainability assessment: The new tool VectorMCDA. In Proceedings of the 27th European Conference on Operational Research, Glasgow, UK, 12–15 July 2015; EURO: Glasgow, UK. [Google Scholar]
  37. Carone, P.; De Toro, P.; Franciosa, A. Evaluation of urban processes on health in Historic Urban Landscape approach: Experimentation in the Metropolitan Area of Naples (Italy). Qual. Innov. Prosper. 2016, 21, 202–222. [Google Scholar] [CrossRef]
  38. Fusco Girard, L.; Cerreta, M.; De Toro, P. Towards a local comprehensive productive development strategy: A methodological proposal for the Metropolitan City of Naples. Qual. Innov. Prosper. 2016, 21, 223–240. [Google Scholar] [CrossRef]
  39. Cerreta, M.; Poli, G. Landscape services assessment: A hybrid Multi-Criteria Spatial Decision Support System (MC-SDSS). Sustainability 2017, 9, 1311. [Google Scholar] [CrossRef]
  40. SINAnet—Rete del Sistema Informativo Nazionale Ambientale. DEM (Digital Elevation Model). Available online: http://www.sinanet.isprambiente.it/it/sia-ispra/download-mais/dem75/view (accessed on 8 June 2018).
  41. Regione Campania. Cartografia Piano Territoriale Regionale. Available online: https://sit2.regione.campania.it/content/download (accessed on 8 June 2018).
  42. ISTAT. Censimento Dell’agricoltura 2010. Available online: https://www4.istat.it/it/censimento-agricoltura (accessed on 8 June 2018).
  43. ISTAT. Censimento Della Popolazione 2011. Available online: http://dati-censimentopopolazione.istat.it/Index.aspx (accessed on 8 June 2018).
  44. ISTAT. Mappa dei Rischi dei Comuni Italiani. Available online: http://www4.istat.it/it/mappa-rischi/metadati (accessed on 8 June 2018).
  45. INEA—Istituto Nazionale Economia Agraria. Annuario Dell’agricoltura Italiana 2012. Available online: http://dspace.crea.gov.it/bitstream/inea/821/1/Annuario_agricoltura_italiana_2012.pdf (accessed on 8 June 2018).
  46. Regione Campania. Piano Tutela delle Acque. Available online: http://www.regione.campania.it/regione/it/tematiche/acque (accessed on 8 June 2018).
  47. INFC—Inventario Nazionale Delle Foreste e dei Serbatoi Forestali di Carbonio (2005–2015). I Risultati; le Stime di Superficie; i Pools di Carbonio; il Metod. Available online: https://www.sian.it/inventarioforestale/ (accessed on 8 June 2018).
  48. Agenzia delle Entrate. Tabella 3, 2007. Available online: http://www.agenziaentrate.gov.it/wps/content/Nsilib/Nsi/Archivio/Modelli+e+istruzioni/Modelli+2008-2016/Modelli+di+dichiarazione/2007/Unico+PF+2007/Fascicolo_3/Tabelle_allegate_al_decreto.html (accessed on 8 June 2018).
  49. Schirpke, U.; Scolozzi, R.; De Marco, C. Modello Dimostrativo di Valutazione Qualitativa e Quantitativa dei Servizi Ecosistemici Nei Siti Pilota; Parte1: Metodi di Valutazione. Report del Progetto Making Good Natura (LIFE+11 ENV/IT/000168); EURAC Research: Bolzano, Italy; Available online: http://www.lifemgn-serviziecosistemici.eu/IT/Documents/doc_mgn/LIFE+MGN_Report_B1.1.pdf (accessed on 20 June 2018).
  50. Olson, D.L. Comparison of weights in TOPSIS models. Math. Comput. Model. 2004, 40, 721–727. [Google Scholar] [CrossRef]
  51. Huang, I.B.; Keisler, J.; Linkov, I. Multi-criteria decision analysis in environmental sciences: Ten years of applications and trends. Sci. Total Environ. 2011, 409, 3578–3594. [Google Scholar] [CrossRef] [PubMed]
  52. Ananda, J.; Herath, A. A critical review of multi-criteria decision making methods with special reference to forest management and planning. Ecol. Econ. 2009, 68, 2535–2548. [Google Scholar] [CrossRef]
  53. Regione Campania. Norme Tecniche Generali per la Produzione Integrata 2017. Available online: http://www.agricoltura.regione.campania.it/disciplinari/2017/norme_tecniche_2017.pdf (accessed on 20 June 2018).
  54. ISTAT. Agricoltura e Zootecnia. Available online: http://agri.istat.it/ (accessed on 20 June 2018).
  55. SINAnet—Rete del Sistema Informativo Nazionale Ambientale. Corine Land Cover IV livello 2012. Available online: http://www.sinanet.isprambiente.it/it/sia-ispra/download-mais/corine-land-cover (accessed on 20 June 2018).
  56. Italiasicura. Il Portale dell’Acqua. Available online: http://www.acqua.gov.it/index.php?id=45 (accessed on 20 June 2018).
  57. Federici, A.B.; Mannucci, P.M.; Castaman, G.; Baronciani, L.; Bucciarelli, P.; Canciani, M.T.; Pecci, A.; Lenting, P.J.; De Groot, P.G. Clinical and molecular predictors of thrombocytopenia and risk of bleeding in patients with von Willebrand disease type 2B: A cohort study of 67 patients. Blood 2008, 113, 526–534. [Google Scholar] [CrossRef] [PubMed]
  58. INFC—Inventario Nazionale delle Foreste e dei Serbatoi Forestali di Carbonio (2005–2015). Available online: https://www.sian.it/inventarioforestale/jsp/dati_carquant_tab.jsp?menu=3 (accessed on 20 June 2018).
  59. Regione Campania CUAS—Carta Utilizzazione Agricola dei Suoli. Available online: https://sit2.regione.campania.it/content/carta-utilizzazione-agricola-dei-suoli (accessed on 20 June 2018).
  60. Mees, H.L.P.; Dijk, J.; van Soest, D.; Driessen, P.P.J.; van Rijswick, M.H.F.M.W.; Runhaar, H. A method for the deliberate and deliberative selection of policy instrument mixes for climate change adaptation. Ecol. Soc. 1998, 19, 58. [Google Scholar] [CrossRef]
  61. Engel, S.; Pagiola, S.; Wunder, S. Designing payments for environmental services in theory and practice: An overview of the issues. Ecol. Econ. 2008, 65, 663–674. [Google Scholar] [CrossRef] [Green Version]
  62. Wunder, S. Payments for environmental services: Some nuts and bolts. CIFOR Occas. Pap. 2005, 42, 24. [Google Scholar]
  63. Nocca, F. The role of cultural heritage in sustainable development: Multidimensional indicators as decision-making tool. Sustainability 2017, 9, 1882. [Google Scholar] [CrossRef]
Figure 1. National Park of Cilento, Vallo di Diano and Alburni (NPCVD) localization and morphology.
Sustainability 10 03329 g001
Figure 2. Methodological approach.
Sustainability 10 03329 g002
Figure 3. Attribute tables of alphanumeric data.
Sustainability 10 03329 g003
Figure 4. GeoTOPSIS calculation window.
Sustainability 10 03329 g004
Figure 5. Attributes table with the geoTOPSIS results.
Sustainability 10 03329 g005
Figure 6. Example of estimation of supply (a), demand (b) and partial evaluation (c) for crops.
Sustainability 10 03329 g006
Figure 7. Example of estimation of supply (a), demand (b) and partial evaluation (c) for forage and pasture.
Sustainability 10 03329 g007
Figure 8. Example of estimation of supply (a), demand (b) and partial evaluation (c) for wood and fibers.
Sustainability 10 03329 g008
Figure 9. Example of estimation of supply (a), demand (b) and partial evaluation (c) for non-wood forest products.
Sustainability 10 03329 g009
Figure 10. Example of estimation of supply (a), demand (b) and partial evaluation (c) for water.
Sustainability 10 03329 g010
Figure 11. Example of estimation of supply (a), of demand (b) and the partial evaluation (c) for CO2 sequestration.
Sustainability 10 03329 g011
Figure 12. Example of estimation of supply (a), demand (b) and partial evaluation (c) for water purification.
Sustainability 10 03329 g012
Figure 13. Example of estimation of supply (a), demand (b) and partial evaluation (c) for air purification.
Sustainability 10 03329 g013
Figure 14. Recreational goods (a), cultural goods (b), enogastronomic peculiarility (c) and environmental goods (d).
Sustainability 10 03329 g014
Figure 15. TOPSIS maps for provisioning services.
Sustainability 10 03329 g015
Figure 16. TOPSIS maps for regulation services.
Sustainability 10 03329 g016
Figure 17. TOPSIS maps for cultural services.
Sustainability 10 03329 g017
Figure 18. Graphs of market regulation (adapted from Bemelmans-Videc et al., 1998 [60]).
Sustainability 10 03329 g018

