Changing Agro-Pastoral Livelihoods under Collective and Private Land Use in Xinjiang, China


1
College of Environmental Sciences and Engineering, Peking University, Beijing 100871, China
2
Environmental Science, Policy, & Management Department, UC Berkeley, CA 94720, USA
*
Author to whom correspondence should be addressed.
Sustainability 2019, 11(1), 166; https://0-doi-org.brum.beds.ac.uk/10.3390/su11010166
Submission received: 15 October 2018
/
Revised: 19 December 2018
/
Accepted: 21 December 2018
/
Published: 30 December 2018
(This article belongs to the Special Issue Land Use/Cover Drivers and Impacts: New Trends and Experiences from Asia)
Abstract
:After the founding of P. R. China, land use in rural China was organized under two successive paradigms: state-directed collectivization from 1958–1984 (the Collective Era), and privatization after 1984 (the Household Land Contract Period, HLCP). Taking Nileke County of Xinjiang as a case study, this research analyzed the livelihood changes of agro-pastoralists over the two periods using quantitative household livelihood assets—financial, physical, natural, human, and social capital—as indicators. Using annual series data of the five livelihood capitals, a comprehensive livelihood assets index (CLAI) was calculated by two-stage factor analysis. Higher CLAI scores meant better living and reduced poverty for agro-pastoralists. Quantitative results were validated and detailed with semi-structured household interviews. The results showed that CLAI slightly increased during the HLCP in comparison to the Collective Era, mainly due to increases in financial and physical capital. In contrast, natural and social capital showed downward trends, indicating that alleviation of poverty came at the cost of natural resources and social justice. Natural capital was the main contributor to agro-pastoralist livelihoods during the Collective Era, but diminished and was replaced by financial capital during the HLCP. Based on the findings, we put forward policy suggestions to improve community land management and sustainable livelihoods as part of future poverty alleviation efforts.
1. Introduction
The international extreme poverty line is 1.9 U.S. dollars (USD) per person per day [1], but this simplified standard has been controversial. Some argue that poverty standards should be defined according to fair distribution of resources and social security [2]. Global poverty is predominantly a rural problem, and China’s impoverished population is overwhelmingly and increasingly located in rural areas [3]. Given China’s economic growth and declining poverty rates, it is vital to reevaluate rural poverty and its evolution so that it can be adequately addressed.
Since the founding of the People’s Republic of China (China) in 1949, there have been two successive land tenure paradigms in rural areas: the Collective Era from 1958 to 1984 and the Household Land Contract Period (HLCP) after 1984. During the Collective Era, agricultural production was organized and directed in large agricultural collectives with shared property rights and benefits. During the HLCP, privatized use rights were allocated to individual households. While these property regimes were principally designed for China’s wetter and more populated eastern crop farming areas, they were also enforced in the more arid and topographically rugged pastoral (livestock-based) areas in the west and north, where communal land tenure historically dominated [4].
Land use privatization has long been espoused as a way to improve economic efficiency [5,6], agricultural productivity, and rural livelihoods [7]. Chinese agricultural production increased substantially under the Household Land Contract System [8]. However, criticism of land privatization has been especially vocal regarding pastoral areas, frequently drawing on notions of “common pool resources” developed by Ostrom [9]. Globally, critiques of pastoral land privatization have focused on the incompatibility of individualized tenure and the herd mobility needed to respond to highly spatial and temporal variability of rainfall and thus forage production [10,11,12]. Privatization of grazing lands in China, specifically, has been blamed for environmental degradation and destroying the social cooperation necessary to manage livestock herds [13,14,15,16,17]. Such studies have tended to focus specifically on land tenure change as the explanatory variable, rarely analyzing changes in land use and production mode. There has also been little research on communities that raise both livestock and crops, the combination of which is increasingly common in China. This study addresses these gaps by examining livelihood indicators for agro-pastoral communities in the Yili Valley of Xinjiang Uyghur Autonomous Region (Xinjiang) to determine how poverty and livelihoods changed over the two land tenure regimes, and what types of resources have most contributed to the change.
1.1. Modern History of Chinese Land Tenure
Land reform was completed by the end of 1952, and agricultural cooperation was promoted from 1953 to 1957. During this period, cooperatives of slowly increasing size were established, starting with 8–15 households and slowly consolidating into larger and larger units [18,19]. By the formal beginning of the Collective Era in 1958, the central government was establishing People’s Communes in rural areas throughout the country, often containing 1000 to 4000 households. From 1958 to 1981, the People’s Commune Policy directed the cooperative land use and production mode throughout most rural areas. One People’s Commune (administratively equal to a township) contained several production ‘brigades’ (natural villages), each of which consisted of 2–3 ‘production teams’ that were the basic units of production. All members of a production team worked collectively to produce agricultural goods. Productive labor was remunerated in ‘work-points,’ which would be translated into a cash payment at the end of the year [20].
Production team leaders were responsible for establishing the pay rate of work-points, which was based on laborer traits and capabilities (sex, age, physical strength, etc.), and for assigning daily work duties to team members. For example, in the busy harvest season, young men harvested and transported crops and herded livestock in distant pastures, while women and old people dried and packaged crops and milked cows and ewes. At the end of the year, after turning in the team’s quota of food, livestock or livestock products, cotton, and/or oil to the state, the leader distributed remaining agricultural products to team member households. Agricultural products were generally allocated by the rule of “member six while work-points four” (or sometimes “member five while work-points five”), which meant 60% of the agricultural products were distributed according to household size, while 40% was distributed based on the work-points they earned in the past year. Cash income was paid according to the average work-points of the household. If the household’s average of work-points was higher than the team average, the household received a bonus; if the household average was below the team average, the household had to forfeit some money to the team [21,22]. In this collective production mode, farmers worked with heavy burdens, few amenities, and little income, sapping their enthusiasm. Many of them showed up every day to get the work-points but did little work [22,23,24].
In the late 1970s, as China transitioned from a planned economy to a market economy, the Household Land Contract System was implemented. Under this system, official collective ownership of rural land was retained while use rights were contracted to individual households. Since then, all forms of collective land use and agricultural production, along with production quotas, have been eliminated. All agricultural outputs are owned by the household except for a state agricultural tax (which was cancelled in 2006). Land use privatization greatly enhanced farmers’ production enthusiasm, increased labor productivity and rural economic development, and thus helped numerous farmers climb out of poverty [8]. From 1975–1985, the national agricultural production value increased from 19.6 billion to 297.6 billion USD [25].
1.2. Livelihoods and Agricultural Production in Pastoral China
Crop agriculture and pastoralism were historically geographically distinct, with crop cultivation concentrated in the river valleys and humid southern and eastern lowlands, while pastoralism dominated the more arid areas in the north and the cold highlands in the west. There is, however, a transition zone where the two productions systems overlap to create agro-pastoral areas [26]. The agro-pastoral zone runs northeast to southwest, with an area of 129,600 km2, accounting for 13.5% of China’s land area [22]. China’s agro-pastoral production is mainly distributed in three areas: southern Inner Mongolia, the eastern Tibetan Plateau, and the Yili Valley in western Xinjiang [27]. These areas are especially important for the study of rural livelihoods, as the government has promoted crop agriculture in formerly livestock-dominated areas as one way to improve household income in the face of increasing population density and declining pasture availability per capita. Agro-pastoralism is particularly interesting in light of changing land tenure policies given the evidence that land privatization has less benefit for pastoralism than for crop production [28]. It is important to know whether privatization has improved livelihoods in agro-pastoral zones as it has in pure farming areas, or whether it has caused significant harms as it has in pure pastoral areas.
The adoption of crop agriculture by pastoralist communities in Xinjiang is at least partly a result of state military activity that began in imperial times. After the founding of PR China and broad state intervention during the Collective Era, including transportation and irrigation construction, agriculture was increasingly promoted in pastoralist regions. In the HLCP, extensive livestock grazing has been hampered by the erosion of pasture access systems and social structures that supported seasonal migration of livestock herds (transhumance) [29]. Some former livestock herders no longer retain sufficient resources to maintain viable herds and cannot generate equivalent earnings from alternative agricultural livelihoods [30,31].
1.3. Livelihood Assets Framework
To assess changing rural livelihoods in the agro-pastoral area over time, this study applied the Sustainable Livelihoods Framework (SLF) to an agro-pastoral county in Yili Valley of Xinjiang. The SLF emerged out of a new “livelihoods” approach to rural development that focused on the ways that the rural poor actually earn a living and build meaningful lives, and was partly inspired by Chamber and Conway’s [32] influential work [33]. The SLF proposed that the rural poor attempt to improve their livelihoods through expansion or intensification of agriculture, diversification of income streams, or migration, or a combination of these [34]. It also outlined a range of resources (or assets, capitals) which could be drawn on to develop livelihoods; these assets later became standardized into five types of capitals: financial, physical, human, natural, and social capital [35]. Counterbalancing prior economistic approaches that focused on financial and physical capital, the sustainable livelihoods approach [33] often emphasized aspects of social capital, including the importance of cultural values and group dynamics in selecting livelihood strategies [36], and how social network connections and political power mediate access to other resources [37].
The SLF is helpful for analyzing the lives of the poor to understand the factors limiting their economic advancement. It has been widely applied to analyze development opportunities and poverty from the micro to macro level, and particularly for designing or evaluating economic development interventions [38]. Research has shown that evaluating livelihood assets illuminates the conditions that do or do not allow households to escape rural poverty. For example, poor farmers were found to be more dependent on natural capital than wealthy ones [39], while the income level of Peruvian farmers was inversely related to the availability of nature resources [40]. An expansion of the labor force (part of human capital) can drive farmers to take up more non-agricultural activities, thus diversifying their livelihoods and alleviating poverty [41], whereas households with reduced human capital (e.g., divorced or widowed female-headed households) often face difficulties [42]. Livelihoods and poverty of a region can be assessed quantitatively via a comprehensive index of livelihood assets integrating financial, physical, natural, human and social capitals [43,44,45,46].
This study hypothesized that livelihood assets were influenced by the collective or private land use and production in light of other factors. By using the livelihood assets index combined with historical statistical data (1958–2015) and in-depth interviews (2015–2016), we assess how the five livelihood capitals of agro-pastoral communities in Nileke County in Yili Valley, Xinjiang changed over time from the Collective Era to the current HLCP. We used factor analysis to calculate five livelihood capital factors independently and further calculated the comprehensive livelihood assets index (CLAI) to measure changes. Higher CLAI meant a greater supply of livelihood assets for agro-pastoralists and thus better living. Based on the factor score coefficients, key capitals influencing agro-pastoralists’ livelihoods in each of the two periods were analyzed. Insights from fieldwork flesh out the discussion of livelihood impacts from changes in land use and production, combined with other factors. Research results indicate not only whether regional development and land use policies aimed at reducing rural poverty have been effective, but also suggest why and how negative outcomes (such as grassland degradation) have occurred. The results suggest policy recommendations for land use and agro-pastoral production that would benefit rural livelihoods.
2. Materials and Methods
2.1. Study Areas
Xinjiang’s Yili Valley agro-pastoral zone is stratified by elevation, transitioning from semi-arid agriculture at elevations below 1000 m to humid alpine meadow pasture above 1000 m. The annual precipitation below 1000 m is 400–500 mm and annual accumulated temperature is about 3000 °C [47]. With relatively abundant snowmelt from the Tianshan Mountains, the valley’s lowlands and riparian corridors provide a significant share of Xinjiang’s irrigated agriculture. The middle and upper regions of the mountains are humid alpine meadow grassland that has been used for extensive livestock grazing (mainly sheep, but also cows, goats, horses, and some camels) for thousands of years. The Yili Valley is a typical example of the agro-pastoral zone, with highly productive pastoralism and agriculture.
The Kazakh people have a long history of agriculture and livestock production in Yili Valley. Kazakh agriculture in this region has been recorded back to the 16th century. As the Kazakh traditionally practiced transhumance (moving herds to higher mountain pastures in the summer and back down to lowlands in the winter), they historically plowed and sowed seeds before leaving winter pastures, and returned to harvest crops in the autumn [22]. Subsequent state military reclamation projects, immigration of Han and Hui Chinese from eastern China, and nomad sedentarization schemes increased the local population and food demand, driving agricultural expansion and intensification [48]. The region experienced the Collective Era (1958–1984) and the Household Land Contract Period (after 1984) much as did elsewhere in pastoral western China, including development of new farmlands under the People’s Communes. National nomad sedentarization schemes were rolled out around 2009, which promoted the establishment of permanent villages within pastoral areas by building schools and hospitals and subsidizing construction of houses and livestock barns [49]. Sedentarization and winter livestock feeding in pens was thought to promote investment and economic development under a privatized production model.
Nileke County is located on the western slope of the Tianshan Mountains in the headwaters of the Yili River, in the Yili Kazak Autonomous Prefecture. Pastoralism and agriculture coexist in Nileke County, and the former plays a dominant role. Nileke County has a population of 189,000 and about one million ha of land, of which 678,000 ha are natural pasture and 38,000 ha are farmland. At the end of 2015, agro-pastoralists in the county owned 625,000 sheep, 196,000 cattle, 63,000 horses, and 23,000 goats, for a total of 1.94 million sheep units, with 83% of all stock being female [50]. The main crops were historically wheat, corn, and flax, with an increase in forage crops in recent years, especially alfalfa. In 2015, the top three crops were wheat (132,000 tons), corn (93,000 tons) and alfalfa (29,000 tons). Earnings from livestock totaled 297.4 million USD, while crop earnings totaled 114.1 million USD. In 2015, net per capita income in Nileke County was 1833 USD [51], around half the national average of 3477 USD [52]. As such, Nileke is a good example of an impoverished rural county in China.
We selected two case study villages, T Village in the western part and W Village in central Nileke County (Figure 1). In 2015, there were 423 households with 1803 people in T Village, and Kazakhs accounted for more than 90% of the population (village statistics). Natural pasture area was about 10,667 ha, divided into three seasonal pasture areas: spring-autumn, summer, and winter pasture. Farmland area is about 720 ha. W Village had 558 households with 2273 people, of which 50% were Kazakhs. Natural pasture area is about 9333 ha, also divided into three seasonal pastures. Farmland area is about 504 ha. The main cash income for agro-pastoralists is from livestock sales rather than agriculture.
Prior to collectivization in the 1950s, most people in both T Village and W Village had no permanent homes, instead moving seasonally with their herds and living in yurts. During the Collective Era, more grazing land was converted to farmland. The sites of the current villages were near their spring-autumn pastures. Land and people were aggregated into People’s Communes, with farming and livestock grazing allocated to production teams. Each village (production brigade) contained 1–2 livestock grazing teams and one agriculture team. Members of livestock grazing teams used summer, winter and spring-autumn pastures collectively, grazed sheep, cattle, goats, and young animals in different groups, and were responsible for building and cleaning shelters, milking cows, and cutting hay. Members of agriculture teams were in charge of farming. Both crops and livestock products were shared across the whole village.
During the HLCP, collective ownership of land was retained by the village but use rights were privatized. In T Village, land use rights were allotted first to groups and later (in the 1990s) to individual households, while in W Village, land use rights were individualized in 1984. Herding was managed in groups of 8–10 households or individually, though with significant conflict over pasture use. Livestock and farm equipment from the production teams were divided and allocated to individual households as private property in 1984, and every household was responsible for tending and selling livestock and farm products, retaining all profits. Privatization narrowed the production scale to the household level, which increased production enthusiasm of each family and improved income levels (Table 1). Construction of permanent houses and barns expanded rapidly in both villages after 2009. Government subsidies covered part of the construction costs and the remainder were paid with bank loans, which represented the first use of formal credit for many households. Construction of primary schools in the two villages was responsible for the increase in education rate.
2.2. Data Collection
Annual data for the factor analysis were drawn primarily from government statistics from 1958 to 2015 and related sources. The time period was selected to include the Collective Era and HLCP up to the most recent available data.
Livelihood asset indicators were selected based on the need to account for all five capital categories (financial, physical, human, natural, and social) from the SLF, within the constraints of available data. Indicators were selected based on association with the land privatization process. Bank deposits, loans, livestock, and agricultural products were selected as the main forms of financial capital. Farm machinery and infrastructure such as house construction, tap water, and irrigation canals were selected to represent physical capital. Natural capital included pasture area, farmland area, net primary productivity (NPP), and irrigation water supply, factors necessary for production of saleable crop or animal products. Human capital included indicators of pastoral and agriculture labor supply, while social capital included economic inequality (Gini coefficient), the relative abundance of local government officials, the number of production cooperatives, and cooperation between farmers and herders. 22 livelihood asset indicators were identified (Table 2), with each asset category having 4–5 indicators. Indicators were continuous except canal construction and agro-pastoral cooperation, which were nominal. The ratio of pastoral labor to agricultural labor reflects the relative labor pool in each sector in the two periods. The ratio of government officials to total population indicates the intensity and accessibility of administrative management. Canal construction included no canal (0), mud canal started in 1968 (1), cement canal started around 1990 (2), and anti-seepage concrete canal started in 2014 (3). Agro-pastoral cooperation included farmers and herders’ cooperation in Collective Era since 1958 (3), livestock distributed to households but pasture still in common in 1980s (2), and livestock and pasture double contracted with agro-pastoralists trading on a relatively open market after 1989 (1).
Field research was completed in 2015–2016, using semi-structured interviews with agro-pastoral households in T Village and W Village. Interviewees were selected by researchers with help from local guides using a non-statistically representative stratified sampling protocol accounting for income, age, and livelihood type. 60 households in T Village and 83 households in W Village were interviewed, more than 15% of the total household number. Interviews were conducted on a saturation basis, with interviews being added until no new trends or patterns were revealed. Interview topics were mainly about family livestock grazing and farming production, living condition, and natural resource use. Interviews focused on differences in land tenure/use and production mode between the two tenure periods and on perceptions and opinions of environmental and social changes. Interviews collected both qualitative and quantitative data not available elsewhere, including local history, accounts of change, and explanations of causation. Additional interviews of local government officials provided overall information on Nileke County.
2.3. Analytical Methods
2.3.1. Correlation Analysis of Livelihood Asset Indicators
This study focused on the change in livelihood assets over the two periods, which was analyzed using factor analysis. Correlation analysis was performed before the factor analysis of five types of livelihood assets, using a correlation coefficient matrix to test the correlation between each indicator. Statistically, the absolute values of the correlation coefficients are determined to be uncorrelated (lower than 0.3), weakly correlated (0.3–0.5), moderately correlated (0.5–0.8), or highly correlated (higher than 0.8) [57]. Factor analysis can be used when most variables are significantly correlated; that is, they have a correlation coefficient higher than 0.5 and a significance level lower than 0.1 [58].
Most of the livelihood asset indicators were significantly correlated (Table 3). The correlation coefficient for more than 80% of the indicators were higher than 0.5, and were significantly correlated, which met the conditions of factor analysis.
2.3.2. Factor Analysis of Livelihood Assets Indicators
Factor analysis is used to describe latent basic variables that cannot be directly measured. Based on a covariance matrix, the original variables are grouped according to the correlation coefficient. Each group of variables is represented by an unobservable latent variable, known as a common factor, which reflects the main information of the original variables.
The livelihood assets of financial, physical, natural, human and social capital in Nileke County in the Collective Era and HLCP, regarded as latent variables, were analyzed under two-stage factor analysis using SPSS.22. First, factor analysis was applied to acquire one (or two) common factors (F) for each livelihood capital to show the separate trend of each livelihood capital. Second, factor analysis was applied to acquire a single combined livelihood assets factor, the comprehensive livelihood assets index (CLAI), from the five common factors, and the contribution rate of each livelihood asset factor. The CLAI reflected agro-pastoralists’ livelihoods; a higher index meant a greater supply of livelihood assets and, presumably, better quality of life. The most important livelihood capitals in the two periods were identified by the index score coefficient.
Livelihood asset X is made up of random vectors X (X1, X2..., Xp) that can be observed. F is a set of common factors of livelihood assets, F = (F1, F2...Fm) (m < P). F fits covariance matrix cov(X) = 1, which means F1, F2...Fm are independent of each other. ɛ is a specific factor, ɛ = (ɛ1, ɛ2…, ɛm) are independent of F.
The Factor Model is expressed as a linear combination of the common factor F: Xp = αp1F1 + αp2F2 + … αpmFm + ɛp.
The matrix form of the Factor Model is: X = AF + ɛ. A is a factor loading matrix, including the correlation coefficient of common factors.
Conversely, common factor F can also be expressed as a linear combination of the variables X in Factor Score Function. Fi can be calculated by:
Fi = βi1X1 + βi2X2 + … βipXp (i = 1, 2,… m) where βip is the score coefficient of common factor Fi in original variable Xp. The larger absolute value of βip means greater influence of original variable Xp to common factor Fi.
3. Results
3.1. Quantitative Analysis of Livelihood Assets
Factor analysis was applied to the 22 financial, physical, natural, human and social capital indicators to reduce the specific, observed indicators to a smaller number of categorical common factors (F). The four original indicators of financial capital were replaced by two common factors (Ff1, Ff2), covering 96.80% of the original variable information. Agricultural output per capita, loans and deposits per capita are closely correlated with Ff1, while livestock per capita is closely correlated with Ff2. So Ff1 mainly represents economic activity in cash, and Ff2 represents livestock capital, which was the most important determinant of wealth for agro-pastoralists. The two financial common factors (Ff1, Ff2) were combined into Ff according to the variance contribution rate. The five original indicators of physical capital were replaced by one common factor (Fp), covering 83.59% of the original variable information. The four original indicators of natural capital were replaced by one common factor (Fn), covering 74.74% of the original variable information. The five original indicators of human capital were replaced by one common factor (Fh), covering 85.46% of the original variable information. The four original indicators of social capital were replaced by one common factor (Fs), covering 84.51% of the original variable information (Table 4).
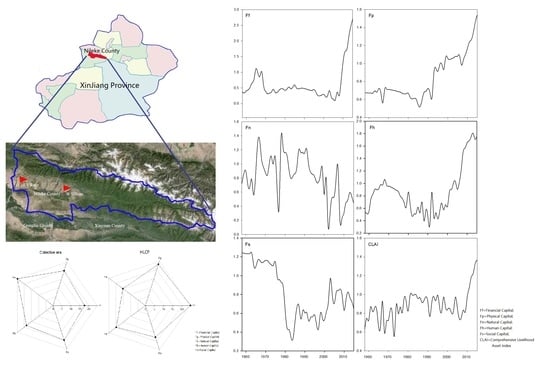
Comparing the average value of five livelihood common factors—Ff, Fp, Fn, Fh, Fs—over two periods (Table 5), financial, physical and human capital were higher during the HLCP than during the Collective Era, while natural and social capital was lower in the HLCP. Figure 2 graphed the annual variation of the five common factors Ff, Fp, Fn, Fh, Fs. These factors did not change suddenly in the mid-1980s, but showed an upward or downward trend between the Collective Era and HLCP.
The score coefficients of the common factors Ff, Fp, Fn, Fh, and Fs were shown in Table 6. In financial capital, livestock capital had the greatest influence on Ff during the Collective Era, during which time loans and deposits were uncommon. However, in the HLCP, the influence of livestock capital became the weakest influence, and cash capital such as loans and deposits played a bigger role in agro-pastoralists’ financial livelihoods. In physical capital, rural construction area, family fixed investment and agricultural machinery had significant influence on Fp in both periods. Tap water and canal construction were increasingly important in the HLCP, as part of the development of irrigated agriculture. In natural capital, pasture area had the largest influence on Fn over both periods, but the influence of NPP decreased in the HLCP. In human capital, the influence of education on Fh increased significantly in the HLCP, while the influence of the size of the labor force decreased. Non-agro-pastoral labor had relatively small influence on Fh, while the ratio of pastoral labor to agricultural labor played a key role. In social capital, all four indicators were similarly influential on Fs. Government officials’ population (the scale of government officials in total population, which reflects administrative influence on social management) was the most influential indicator during the Collective Era, while the rural Gini coefficient became the biggest influence in the HLCP. Agro-pastoral cooperation was an important indicator over both periods.
3.2. Quantitative Analysis of Livelihood Level
Factor analysis was carried out to replace the common factors for the five livelihood capital categories (Ff, Fp, Fn, Fh, Fs) with a single comprehensive livelihood assets index (CLAI). The load coefficient values in Table 7 represent the variance contribution rate of five livelihood common factors to CLAI, which covered 76.61% of the variance in the livelihood common factors.
Comparing the average value and growth rate of CLAI in the Collective Era and HLCP, the average value had increased from 0.808 in the Collective Era to 0.944 in the HLCP. The inter-annual variability of CLAI also showed a slight upward trend between the Collective Era and HLCP (Table 8, Figure 2). This change can be interpreted as a decrease in poverty and an increase in living level for agro-pastoralists over time. The score coefficients of CLAI (Table 9, Figure 3) indicate that natural capital strongly influenced agro-pastoralist poverty during the Collective Era, but the influence was significantly weakened in the HLCP. The influence of financial and physical capital on poverty gradually increased over the two periods.
3.3. Findings from Household Interviews
Financial capital significantly increased over time, partly reflecting increased household income. The main source of income for all households in the two villages was livestock sales. In the years we conducted the survey, livestock income accounted for 66% and 72% of the total income in T Village and W Village, respectively. Other sources of income included renting grazing land and labor, selling livestock products such as milk and wool, government subsidies, and wage work (Figure 4). Only 1 household earned a majority of income from farming (by renting 240 ha of farmland to grow high-value medicinal herbs). For most households, the area for farming was too small and common crop prices too low. 52% of families claimed to be poor families with less than 50 livestock, and 3 households with no livestock rented out their pasture. Livestock ownership was limited by availability of herding labor and episodes of financial problems that forced selling off herds. Major household expenditures were living costs (52%), including weddings and medical fees. Production costs accounted for 48% of household expenditures, and livestock costs such as buying forage, paying herders to graze herds, and renting pasture were significantly greater than agricultural costs (Figure 4). The significant rise in Ff around 2010 (Figure 2) correlates with the onset of home and barn construction, instigated by nomad sedentarization schemes. House and barn construction were paid for with bank loans, the first time that formal credit was used by most households. The use of winter pen/barn feeding required the purchase of additional fodder, which was also often paid for with bank loans. The sedentarization program thus stimulated an initial debt and subsequent annual debts. The continuous increase in Fp and Fh were also attributed to the influences of private production and sedentarization programs, which promoted production facilities and primary school construction, increasing the educated labor supply.
The problems of pasture degradation and significantly reduced social cohesion were clearly expressed during interviews. All interviewees thought that village pastures had degraded over the HLCP, meaning they were less productive and had greater coverage of undesirable plant species. The degradation was most pronounced in the spring-autumn pastures (reported by 71% of interviewees), which were nearest the villages, and was attributed to both reduced rainfall and to overgrazing. The reasons for overgrazing were complex. First, the amount of land allocated to each household was too little, and the establishment of private use rights restricted herd movements, both within and between seasonal pastures. Second, before and during the Collective Era, herding livestock between seasonal pastures was a collective effort that saved labor and provided social support. After herds were privatized, especially as household herd sizes gradually became unequal, cooperation between households even within the same group decreased. For logistical reasons (e.g., health, school, jobs in town, farm crops to tend) 65% of the households could not migrate with their herds to summer or winter pastures, which in some cases were more than a day’s travel away.
The pasture degradation caused by lack of rest from grazing pressure was exacerbated by dramatically increased livestock numbers in recent decades. Numbers had increased for three reasons: (1) With the privatized use of land, household livestock expenses (including seasonal migration and fencing) have increased along with the cost of living, meaning that it now takes far more animals to support a household than in the past. Households who had to sell their herds to pay for weddings or medical fees could rarely afford to rebuild their herds, forcing them into the next situation. (2) Livestock have become a common investment for farmers, who often feed the animals farm products and byproducts in the winter and pay a herder to graze the herds (according to the number of animals) on the herder’s land in the rest of the year. The average price in 2015 was 2.4 USD/month/sheep and 15.8 USD/month/cow or horse. Because of the low per-animal payment, relatively high costs associated with seasonal migrations, and high risk of having to repay the owners for sheep that are lost, die from disease, or are killed by wolves, herders normally have to take 300–500 sheep at a time just to turn a profit, far in excess of the number they could legally or sustainably graze on their pastures. Because most households could not afford to fence all their seasonal pastures, and mountain summer pastures were hard to fence, these farmers’ herds ate up the pasture of other households, causing conflicts. (3) With neither the traditional tribal structure nor the state-backed authority of the People’s Commune leadership, the villages have lost the ability to sanction those members who overgraze their own or others’ land.
4. Discussion
Results from the factor analysis and the household interviews showed that agro-pastoralists’ living standards had improved during the HLCP as financial, physical and human capital increased, though natural and social capital decreased sharply. The CLAI showed a slight upward trend between the two periods, roughly in accordance with statistics on household net incomes. By factor analysis, natural capital showed great influence on livelihoods in the Collective Era but became the least important asset category for livelihoods in the HLCP. In essence, agro-pastoralists had improved their material wellbeing at the expense of natural resources and social cohesion.
The influence of livelihood assets on agro-pastoralists’ poverty shifted in important ways over time. For example, while livestock is still the primary source of income in both villages, the economics have changed to place a greater influence on the role of financial capital. Partly because there is insufficient grazing land for most herds, most households now pen-feed their livestock with purchased fodder for at least part of the winter. Most households now carry annual bank debt, with loans used to build their village houses and/or barns, buy livestock fodder, for household expenses before livestock are sold, and to cover large expenses (especially weddings and medical fees). In addition, households who have few livestock now shepherd farmers’ herds as their primary income source, essentially a combination of wage labor and land rent. The increasing importance of financial capital is both cause and effect of declining natural capital, given the spiral of increasing livestock numbers, declining pasture productivity, and purchased supplemental fodder. This spiral was instigated by the combination of land privatization (low herd mobility, pasture rental) and sedentarization policies (winter pen/barn feeding in the village), which shifted livestock production toward a more intensive model.
While the factor analysis showed that human capital has increased, interview results indicate it was not as important for poverty alleviation as in agricultural zones. Research has shown that increasing the labor force promotes the income of farmers [58] and that increasing the labor force encourages farmers to diversify into non-agricultural activities [41]. In most of the Chinese agricultural zone, increasing population and declining farm economic viability pushed a large number of surplus rural laborers to find higher wages in cities, and rural migrant workers’ incomes have gradually become the main source of farm households’ income [59]. However, non-agro-pastoral activities are less common in Xinjiang’s agro-pastoral zone, and the main source of income for agro-pastoralists is still livestock grazing [60]. This is due to the economic marginalization of western China, and language and cultural barriers of Kazakh minorities making it difficult to work outside the region, despite increasing access to bilingual primary and secondary education. Additionally, while the total labor force has expanded over time, household labor demands have actually increased. As pasture and farmland was distributed to individual households, many households were concurrently engaged in livestock grazing and agricultural work, requiring more labor within the family. The relative labor shortage results in reduced opportunities for agricultural intensification or diversification into non-agro-pastoral work, as is typical in agricultural zones.
Social capital also suffered a loss during the HLCP. Under essentially private land use, capitalist agro-pastoral production, economic differentiation similar to the agrarian transformation model [61] created a gap between rich and poor that broke down mutually beneficial cooperation between households, with negative effects for social justice and community stability. If a household suffered from natural disasters or family misfortune, lack of help outside the family network reduced recovery speed. If the household loses their core reproductive female livestock, they lose the ability to recover by themselves, forcing them to work for someone else to make a living while slowly rebuild their own herd [62]. Land that is ungrazed by poor households without herds is used by wealthy households to expand, enlarging the social gap between rich and poor. Community cooperation has been found to reduce vulnerability to ecological variability [63,64], and the influence of agro-pastoral cooperation on household wellbeing was significant in this study. It is possible that rebuilding group-scale cooperation through some new type of agro-pastoral cooperative would optimize the allocation of labor and recreate efficiencies of scale for large-scale production of agriculture and livestock grazing, thereby improving the efficiency of resource use and realizing community common prosperity at last.
Livelihood assets were used here as indicators to measure agro-pastoralists’ livelihood levels. While the change over time of CLAI calculated here roughly aligns with statistics on household incomes, the livelihoods approach offers far more insight. The analysis of livelihood assets across the two land tenure policy periods in this study captures the effects of poverty alleviation policies in the region. In this case, the increase in financial capital among agro-pastoralist households came at the expense of natural capital and household resilience, which were exacerbated by declining social capital. Land privatization and sedentarization policies did increase financial capital over time in Nileke County, but the increase is connected to pasture degradation and social conflict, with an increasingly tenuous reliance on loans to cover rising living and production costs.
The livelihood assets indicators aid in the multidimensional measurement of living standards, are more insightful at the community and sub-community scales, and better inform sustainable development solutions. It is encouraging that livelihood asset indicators provide specific, relatively easy to collect, and reliable data sets to serve as indicators for livelihood levels. It is important to note, however, that quantitative methods based on regional or national statistics must be corroborated (or corrected) with community-level research.
Policy Implications
By examining the influence of land tenure and production mode on agro-pastoralists poverty, we found that land privatization has created some problems in the agro-pastoral zone. This finding aligns with the large majority of studies on Chinese pastoral land tenure [14,56]. The distribution of pastoral and agricultural labor and cooperation between households were key components of agro-pastoralist livelihoods, and growing problems in these areas must be addressed. Grassland vegetation fluctuates due to abiotic variability (e.g., precipitation, temperature), but it evidenced widespread degradation during the HLCP. Developing new modes of cooperative land management and production may improve the current situation.
We recommend the formation of agro-pastoral cooperatives in the agro-pastoral zone, an idea that many interviewees favored. Cooperative members would join their land and labor on the basis of voluntary mutual benefit and risk-sharing to meet the needs for production and development. Cooperatives should have the following characteristics: first, they should be voluntary and mutually beneficial. Agro-pastoralists should have the freedom to join and withdraw from the cooperative. Second, they should be self-managed by the community, with each member retaining the right to participate in decision-making. Third, they should be based on resource and labor sharing. Members share pasture use and labor at a certain scale, and distribute products according to a consensus principle. Fourth, government funds should be allocated for resource protection and risk management. Fifth, cooperatives should have a formal method to sanction (punish) members who violate the rules of the cooperative, backed by village authority. The village must also retain the ability to sanction activities by non-members against the cooperative. Through the form of cooperatives, fragmented pasture resources can be integrated while solving the problem of labor shortage through economies of scale and restoring a cooperative relationship in the community. Group-scale agro-pastoral cooperation needs to be reestablished to improve land use and management, helping to alleviate poverty in a manner sustainable for society and the environment.
5. Conclusions
This study investigated a type of livelihood (agro-pastoralism) that has received extensive government investment and managerial intervention, but which has an unclear path out of poverty. Privatization has been found to be beneficial for farming communities but negative for pastoral communities in China, and it is not clear which trend will win out in the agro-pastoral zone, where both livelihoods are carried out simultaneously. Results from our factor analysis and household interviews show that agro-pastoralists’ livelihood level improved during the HLCP as financial, physical and human capital increased. While material standard of living had improved and monetary income had increased, natural and social capital decreased sharply. In other words, agro-pastoralists improved their financial welfare at the cost of their natural resource base and social cohesion.
During the HLCP, privatized production increased production costs per household, leading to the rapid growth of livestock numbers in order to make ends meet. Greater livestock numbers, combined with pasture loss due to government reallocation of land and reduced livestock mobility due to land fragmentation, are causing degradation of remaining pastures. Sedentarization in villages has led to a more capital-intensive livestock production method which has caused increasing levels of household debt. The government’s strategy of expanding crop production to improve rural livelihoods has had no obvious effect due to lack of economies of scale. Now, households concurrently attempting livestock grazing and agricultural work often suffer from labor shortages. Cooperation between households used to be a central feature of Kazakh transhumant pastoralism but has been almost entirely eliminated by private land use and expanding inequality. This lack of mutual aid has significantly reduced household resilience to economic and environmental shocks.
Like farming communities, the agro-pastoralist communities in Nileke County have benefited financially from privatization and state development efforts. However, our results show that agro-pastoralists are also hurt by these processes, much as pastoralists elsewhere in China have been, with similarly negative outcome of nature resource and social stability. The formation of agro-pastoral cooperatives may be capable of mediating sustainable pasture use and economies of scale for future sustainable development in China’s agro-pastoral zones.
Author Contributions
Conceptualization and methodology, D.L.; Investigation, D.L., T.H. and S.T.; Analysis of the data, D.L.; Paper writing, D.L., T.H.; Review & editing and validation, D.L., T.H., S.T. and W.L.; Supervision, project administration and funding acquisition, W.L.
Funding
This paper was financially supported by the National Natural Science Foundation of China (41671522) and the National Research Foundation of Korea Grant (NRF-2017S1A3A2067220). Hruska’s research participation was supported by a Summer Research Grant from the Center for Chinese Studies at the University of California, Berkeley.
Acknowledgments
Lynn Huntsinger of UC Berkeley helped to design the interview questionnaire in our first fieldwork in 2015. Research design, D.L. and W.L. We thank all the students in our team for their contributions to the case study analysis and for their discussion during our weekly group meeting. We especially thank the local guides and agro-pastoralists for their help and contributions.
Conflicts of Interest
The authors declare no conflicts of interest.
References
- World Bank Group. Poverty and Shared Prosperity 2016: Taking on Inequality. World Bank Publications No. 25078. 2016. Available online: http://www.pse-journal.hr/upload/files/pse/2017/4/pezer.pdf (accessed on 7 September 2017).
- Ravallion, M.; Datt, G.; Walle, D. Quantifying absolute poverty in the developing world. Rev. Income Wealth 2010, 37, 345–361. [Google Scholar] [CrossRef]
- Ravallion, M.; Chen, S. China’s (uneven) progress against poverty. J. Dev. Econ. 2004, 82, 1–42. [Google Scholar] [CrossRef]
- Humphrey, C.; Sneath, D. The End of Nomadism? Society, State, and the Environment in Inner Asia, 1st ed.; The George Washington University Institute for Ethnographic Research: Washington, DC, USA, 1999; p. 368. ISBN 9780822321071. [Google Scholar]
- North, C. Structure and Change in Economic History, 2nd ed.; W.W. Norton & Company: New York, NY, USA, 1981; p. 166. ISBN 9780393952414. [Google Scholar]
- Soto, D. The Mystery of Capital: Why Capitalism Triumphs in the West and Fails Everywhere Else, 1st ed.; Basic Books: New York, NY, USA, 2000; p. 259. ISBN 9780326686520. [Google Scholar]
- Deinlnger, K.; Binswanger, H. The Evolution of the World Bank’s Land Policy: Principles, Experience, and Future Challenges. World Bank Publications No. 76633. 1999. Available online: http://documents.worldbank.org/curated/en/614861468326135799/pdf/766330JRN0WBRO00Box374385B00PUBLIC0.pdf (accessed on 2 August 1999).
- Lin, Y. Policy, Technology and Agriculture Development in China, 1st ed.; Shanghai People’s Press: Shanghai, China, 1994; p. 265. ISBN 9787543223691. [Google Scholar]
- Ostrom, E. Governing the Commons, 1st ed.; Cambridge University Press: Cambriage, UK, 1990; p. 144. ISBN 780521405997. [Google Scholar]
- Fernandez-Gimenez, M.E.; Le Febre, S. Mobility in pastoral systems: Dynamic flux or downward trend? Int. J. Sustain. Dev. 2006, 13, 341–362. [Google Scholar] [CrossRef]
- Hobbs, N.T.; Galvin, K.A.; Stokes, C.J. Fragmentation of rangelands: Implications for humans, animals, and landscapes. Glob. Environ. Chang. 2008, 18, 776–785. [Google Scholar] [CrossRef]
- Reid, R.S.; Fernándezgiménez, M.E.; Galvin, K.A. Dynamics and Resilience of Rangelands and Pastoral Peoples Around the Globe. Annu. Rev. Environ. Resour. 2014, 39, 217–242. [Google Scholar] [CrossRef]
- Li, W.; Ali, S.H.; Zhang, Q. Property rights and grassland degradation: A study of the Xilingol pasture, Inner Mongolia, China. J. Environ. Manag. 2007, 85, 461–470. [Google Scholar] [CrossRef]
- Li, W.; Huntsinger, L. China’s Grassland Contract Policy and its Impacts on Herder Ability to Benefit in Inner Mongolia: Tragic Feedbacks. Ecol. Soc. 2011, 16, 1–14. [Google Scholar] [CrossRef]
- Li, W.; Li, Y. Managing Rangeland as a Complex System: How Government Interventions Decouple Social Systems from Ecological Systems. Ecol. Soc. 2012. [Google Scholar] [CrossRef]
- Williams, D.M. The barbed walls of China: A contemporary grassland drama. J. Asian Stud. 1996, 55, 665–691. [Google Scholar] [CrossRef]
- Yu, L.; Farrell, K.N. Individualized Pastureland Use: Responses of Herders to Institutional Arrangements in Pastoral China. Hum. Ecol. 2013, 41, 759–771. [Google Scholar] [CrossRef]
- Chai, Y.; Joseph, C.H. An Economic History of Modern China, 1st ed.; Edward Elgar Publishers: Cheltenham, UK, 2011; p. 112. ISBN 9781847209375. [Google Scholar]
- McMillen, D.H. Chinese Communist Power and Policy in Xinjiang, 1949–1977, 1st ed.; Westview Press: Boulder, CO, USA, 1979; p. 373. ISBN 0891584528. [Google Scholar]
- Luo, P. History of the Agricultural Cooperative Movement, 1st ed.; Fujian People’s Press: Fujian, China, 2004; p. 381. ISBN 9787211046621. [Google Scholar]
- Luo, P. History of the People’s Commune, 1st ed.; Fujian People’s Press: Fujian, China, 2006; p. 267. ISBN 9787211051762. [Google Scholar]
- Hong, T.; Jiangbozi, K. Brief History of Kazak; National Press: Beijing, China, 2008; pp. 15–16. ISBN 9787105086979. [Google Scholar]
- Huang, J. The Social Psyche of the Peasants and the Campaign to the People’s Commune. J. Lingling Univ. 2003, 4, 80–83. [Google Scholar] [CrossRef]
- Yu, L. Retrospect and Prospect of China’s Rural Development Since 1949. Agric. Outlook 2013, 9, 25–30. [Google Scholar] [CrossRef]
- China Statistical Yearbooks, 1st ed.; National Bureau of Statistics of China: Beijing, China, 1985; p. 297. ISBN 9787503782534.
- Cheng, X. Frontier issue of modem ecology in the study of ecotone between agriculture and animal husbandry. Resour. Sci. 1999. [Google Scholar] [CrossRef]
- Zhao, H.; Zhao, X.; Zhang, T. Boundary line on agro-pasture zigzag zone in north China and its problems on eco-environment. Adv. Earth Sci. 2002, 17, 739–747. [Google Scholar] [CrossRef]
- Cai, Y. Study on Income Change of Pastoralists before and after the Double Contract of Land and Livestock Period. Master’s Thesis, Renmin University of China, Beijing, China, June 2012. [Google Scholar]
- Liao, C.; Fei, D. Sedentarization as constrained adaptation: Evidence from pastoral regions in far northwestern China. Hum. Ecol. 2016. [Google Scholar] [CrossRef]
- Liao, C.; Barrett, C.; Kassam, K. Does diversification improve livelihoods? Pastoral households in Xinjiang, China. Dev. Chang. 2015, 46, 1302–1330. [Google Scholar] [CrossRef]
- Fan, M.; Li, W.; Zhang, C. Impacts of Nomad Sedentarization on Social and Ecological Systems at Multiple Scales in Xinjiang Uyghur Autonomous Region, China. AMBIO 2014, 43, 673–686. [Google Scholar] [CrossRef]
- Chambers, R.; Conway, G. Sustainable Rural Livelihoods: Practical Concepts for the 21st Century, 1st ed.; IDS Discussion Paper 296; IDS: Brighton, UK, 1992; p. 27. ISBN 0903715589. [Google Scholar]
- Scoones, I. Livelihoods perspectives and rural development. J. Peasant Stud. 2009, 36, 171–196. [Google Scholar] [CrossRef] [Green Version]
- Scoones, I. Sustainable Rural Livelihoods: A Framework for Analysis; IDS Working Paper 72; IDS: Brighton, UK, 1998; p. 22. Available online: http://opendocs.ids.ac.uk/opendocs/handle/123456789/3390 (accessed on 25 January 1998).
- DFID. Sustainable Livelihoods Guidance Sheets; Department for International Development: London, UK, 1999. Available online: http://files.ennonline.net/attachments/872/section2.pdf (accessed on 2 April 1999).
- Bebbington, A. Capitals and capabilities: A framework for analyzing peasant viability, rural livelihoods and poverty. World Dev. 1999, 27, 2021–2044. [Google Scholar] [CrossRef]
- De Haan, L.; Zoomers, A. Exploring the frontier of livelihoods research. Dev. Chang. 2005, 36, 27–47. [Google Scholar] [CrossRef]
- Ashley, C.; Carney, D. Sustainable Livelihoods: Lessons from Early Experience, 1st ed.; Department for International Development: London, UK, 1999; p. 55. ISBN 0850034191.
- Aune, B.; Babulo, A. Agricultural Intensification in the Sahel—The Ladder Approach. Agric. Syst. 2008, 98, 119–125. [Google Scholar] [CrossRef]
- Mazzarino, M. Environmental Change and the Agro-Pastoralist Livelihood in the Andes of Peru. Ph.D. Thesis, University of Massachusetts, Amherst, MA, USA, May 2014. [Google Scholar]
- Kelman, I.; Mather, T. Living with Volcanos: The Sustainable Livelihoods Approach for Volcano-related Opportunities. J. Volcanol. Geotherm. Res. 2008, 172, 189–198. [Google Scholar] [CrossRef]
- Orr, A.; Mwale, B. Adapting to Adjustment: Smallholder Livelihood Strategies in Southern Malawi. World Dev. 2001, 29, 1325–1343. [Google Scholar] [CrossRef]
- Erenstein, O.; Hellin, J.; Chandna, P. Poverty Mapping Based on Livelihood Assets: A Meso-level Application in the Indo-Gangetic Plains, India. Appl. Geogr. 2010, 30, 112–125. [Google Scholar] [CrossRef]
- Howe, L.; Hargreaves, D.; Huttly, S. Issues in the construction of wealth indices for the measurement of socio-economic position in low-income countries. Emerg. Themes Epidemiol. 2008, 5, 1172–1186. [Google Scholar] [CrossRef] [PubMed]
- Fofack, H. Combining Light Monitoring Surveys with Integrated Surveys to Improve Targeting for Poverty Reduction: The Case of Ghana. The World Bank Economic Review No. 77309. 2000. Available online: https://0-www-jstor-org.brum.beds.ac.uk/stable/3990041 (accessed on 5 January 2000).
- Lanjouw, J. Combining Census and Survey Data to Trace the Spatial Dimensions of Poverty: A Case Study of Ecuador. The World Bank Economic Review No. 77308. 2000. Available online: https://0-www-jstor-org.brum.beds.ac.uk/stable/3990039 (accessed on 5 January 2000).
- Chen, J. The Sustainable Development Strategies of Agro-Pastoral Transition Zone, 1st ed.; Chemical Industry Press: Beijing, China, 2004; p. 102. ISBN 7502554998. [Google Scholar]
- State Ethnic Affairs Commission of China. Literature Compilation of Ethnic Work in New Era, 1st ed.; Central Party Literature Press: Beijing, China, 1990; p. 263. ISBN 7507300528.
- Munate, S.; Yang, L.; Yimiti, H. The ecological, economy and social benefits analysis of herdsmen settlement project in Xinjiang. Pratacult. Sci. 2011, 3, 478–482. [Google Scholar] [CrossRef]
- Nileke County Statistics, 1st ed.; Bureau of Statistics of Xinjiang: Xinjiang, China, 2015; p. 286. ISBN 9787503779022.
- Yili Kazakh Autonomous Prefecture Statistics, 1st ed.; Bureau of Statistics of Xinjiang: Xinjiang, China, 2015; p. 378. ISBN 9787503756832.
- National Economic and Social Development Statistics, 1st ed.; National Bureau of Statistics of China: Beijing, China, 2015; p. 351. ISBN 9787503776380.
- Pu, Z.; Zhang, S.; Wang, S. Response of NPP to Climate Change over last 47 Years in Tianshan Mountain Areas. Chin. J. Agrometeorol. 2009, 30, 283–288. [Google Scholar] [CrossRef]
- He, Y.; Dong, W.; Guo, X. The Chinese Terrestrial NPP Simulation from 1971 to 2000. J. Glaciol. Geocryol. 2007, 29, 226–232. [Google Scholar] [CrossRef]
- Liu, W.; Wei, W.; Liu, Z. NPP Change in Vegetation in Xinjiang under Climate Change. Arid. Zone Res. 2009, 26, 207–211. [Google Scholar] [CrossRef]
- Yang, H.; Gang, C.; Mu, S. Analysis of the spatio-temporal variation in net primary productivity of grassland during the past 10 years in Xinjiang. Acta Prataculturae Sin. 2014, 23, 39–50. [Google Scholar] [CrossRef]
- Xue, W. SPSS Statistical Analysis Method and Application, 1st ed.; Electronic Industry Press: Beijing, China, 2013; p. 241. ISBN 9787121189494. [Google Scholar]
- Guo, Z.; Chang, Y. The investment of human capital of peasant household and the growth of farmers’ income. Front. Econ. China 2008, 3, 296–311. [Google Scholar] [CrossRef]
- Wang, X.; Zhang, Y. Analysis of the rural migrant workers’ employment in cities. Agric. Econ. 2006, 2, 37–38. [Google Scholar] [CrossRef]
- Li, P. Income of Agro-pastoralists in Ethnic Region—A Study in Xinjiang Uygur Autonomous Region. China Econ. Stud. 2009, 4, 59–64. [Google Scholar] [CrossRef]
- Kautsky, K. The Agrarian Question; Milano Feltrinelli: Milan, Italy, 1958; p. 608. ISBN 19601800158. [Google Scholar]
- Zheng, G. The Restriction of the Household Contract Responsibility System for Agricultural Modernization Production. Master’s Thesis, Minzu University of China, Beijing, China, June 2007. [Google Scholar]
- Scoones, I. Living with Uncertainty: New Directions in Pastoral Development in Africa, 1st ed.; Institute of Development Studies: Brighton, UK, 1995; p. 383. [Google Scholar]
- Li, Y.; Gongbuzeren, A.; Li, W. A Review of China’s Rangeland Management Policies; IIED Country Report; IIED: London, UK, 2014; p. 28. ISBN 9781784310493. [Google Scholar]
Figure 1.
Case study sites.

Figure 2.
Annual variation of Ff, Fp, Fn, Fh, Fs, CLAI.

Figure 3.
Influence of livelihood common factors on CLAI.

Figure 4.
The income and expenditure of households in two villages.


Table 1.
Policy changes in Collective Era and Household Land Contract Period in Nileke County.
| Period | Year | Policies |
|---|---|---|
| Collective | 1958–1984 | i. Collectively (Commune) owned land and livestock; production teams used land collectively ii. Agricultural and livestock grazing work conducted collectively by all members of production team |
| iii. Income earned by production team and distributed to households at end of year | ||
| Household Land Contract | 1984–present | i. Collectively (Village) own land, household use pasture and farmland privately, and own livestock (private user rights) ii. Agricultural and livestock grazing work conducted by individual household iii. Income earned by individual household |
Table 2.
Livelihood asset indicators.
| Livelihood Assets | Indicators | Mean | Maximum | Minimum | Standard Deviation |
|---|---|---|---|---|---|
| Financial capital | 1. Livestock per capita (sheep unit) a,b | 10.07 | 19.66 | 7.01 | 2.78 |
| 2. Agricultural outputs per capita(t) a,b | 0.41 | 1.23 | 0.15 | 0.25 | |
| 3. Loans per capita (USD) a,b | 92.90 | 1063.21 | 0 | 219.93 | |
| 4. Deposits per capita (USD) a,b | 115.75 | 1112.21 | 0 | 286.48 | |
| Physical capital | 5. Family fixed investment (Thousand USD) a,b | 938.79 | 7648.18 | 0 | 1664.31 |
| 6. Rural construction area (million m2) a,b | 9.41 | 68.25 | 0.3 | 12.47 | |
| 7. Agricultural machinery per capita (tractor/cultivator) a,b | 2373.29 | 11454 | 23 | 3005.4 | |
| 8. Number of villages with tap water a,b | 21.29 | 69 | 0 | 26.63 | |
| 9. Canal construction d | 1.41 | 3 | 0 | 0.84 | |
| Natural capital | 10. Pasture area per capita(ha) a,b | 74.74 | 80.03 | 67.76 | 6.13 |
| 11. Farmland area per capita(ha) a,b | 2.49 | 3.02 | 2 | 0.29 | |
| 12. Pasture vegetation NPP e | 171.74 | 196 | 150 | 13.08 | |
| 13. Irrigation water use efficiency (kg/m3) a,b | 0.05 | 0.23 | 0.01 | 0.05 | |
| Human capital | 14. Pastoral labor a,b | 6772.86 | 20,804 | 1150 | 5299.69 |
| 15. Agricultural labor a,b | 13,711.55 | 27,892 | 4461 | 7553.92 | |
| 16. Non-agro-pastoral labor a,b | 6906.07 | 35,034 | 286 | 9429.66 | |
| 17. Educated population a,b | 6185.59 | 11,328 | 2200 | 2861.58 | |
| 18. Ratio of pastoral labor to agricultural labor (%) a.b | 46.43 | 94.39 | 25.78 | 18.65 | |
| Social capital | 19. Rural Gini coefficient c | 0.25 | 0.48 | 0.1 | 0.15 |
| 20. Ratio of government officials to total population (%) a.b | 4.10 | 9.29 | 1.96 | 2.09 | |
| 21. Cooperatives a.b | 66.83 | 108 | 30 | 23.05 | |
| 22. Agro-pastoral cooperation d | 2.09 | 3 | 1 | 0.82 |
Note: a. “The Changes of Nileke County in 60 Years Statistics 1949–2010”; b. “Nileke County Statistics 2011–2015”; c. “Yili Kazak Autonomous Prefecture Statistics 1980–2015”; d. Interviews and field work results in county level; e. NPP of general Nileke County area from 1958–2015, Pu Z C et al., 2009; He Y et al., 2007; Liu W G et al., 2009; Yang H F et al., 2014. [53,54,55,56]. The livelihood assets variables 1–8 and 10–21 are annual continuous data from 1958 to 2015 in Nileke County level, and livelihood assets variables 9 and 22 are nominal data in county level from 1958–2015 obtained from interviews and field work.
Table 3.
The correlation coefficients of livelihood assets indicators.
| Livelihood Assets | Indicators | 1 | 2 | 3 | 4 | 5 |
|---|---|---|---|---|---|---|
| Financial Capital | 1. Livestock per capita (sheep unit) | 1 | 0.022 | 0.035 | 0.047 | |
| 2. Agricultural outputs per capita (t) | 1 | 0.913 r,* | 0.940 r,* | |||
| 3. Loans per capita (USD) | 1 | 0.951 r,* | ||||
| 4. Deposits per capita (USD) | 1 | |||||
| Physical Capital | 1. Family fixed investment (Thousand USD) | 1 | 0.908 r,* | 0.956 r,* | 0.774 r,* | 0.678 r,* |
| 2. Rural construction area (million m2) | 1 | 0.886 r,* | 0.779 r,* | 0.762 r,* | ||
| 3. Agricultural machinery per capita (tractor/cultivator) | 1 | 0.830 r,* | 0.756 r,* | |||
| 4. Number of villages with tap water | 1 | 0.794 r,* | ||||
| 5. Canal construction | 1 | |||||
| Natural Capital | 1. Pasture area per capita (ha) | 1 | 0.556 r,* | 0.369 | 0.718 r,* | |
| 2. Farmland area per capita (ha) | 1 | 0.374 | 0.572 r,* | |||
| 3. Pasture vegetation NPP | 1 | 0.362 | ||||
| 4. Irrigation water use efficiency (kg/m3) | 1 | |||||
| Human Capital | 1. Pastoral labor | 1 | 0.846 r,* | 0.936 r,* | 0.704 r,* | 0.631 r,* |
| 2. Agricultural labor | 1 | 0.653 r,* | 0.851 r,* | 0.239 | ||
| 3. Non-agro-pastoral labor | 1 | 0.479 | 0.709 r,* | |||
| 4. Educated population | 1 | 0.412 | ||||
| 5. Ratio of pastoral labor to agricultural labor (%) | 1 | |||||
| Social Capital | 1. Rural Gini coefficient | 1 | 0.932 r,* | 0.641 r,* | 0.963 r,* | |
| 2. Ratio of government officials’ population (%) | 1 | 0.564 r,* | 0.902 r,* | |||
| 3. Cooperatives | 1 | 0.713 r,* | ||||
| 4. Agro-pastoral cooperation | 1 | |||||
| Livelihood common factor (second-stage FA) | 1. Financial common factor | 1 | 0.552 r,* | 0.338 | 0.712 r,* | 0.311 |
| 2. Physical common factor | 1 | 0.637 r,* | 0.698 r,* | 0.340 | ||
| 3. Natural common factor | 1 | 0.526 r,* | 0.515 r | |||
| 4. Human common factor | 1 | 0.579 r | ||||
| 5. Social common factor | 1 |
Note: r: Significantly correlated: correlation coefficient higher than 0.5. *: Significance level lower than 0.1.
Table 4.
The load coefficients of livelihood assets indicators.
| Livelihood Assets | Indexes | Ff1 | Ff2 | Fp | Fn | Fh | Fs |
|---|---|---|---|---|---|---|---|
| Financial Capital | 1. Livestock per capita (sheep unit) | 0.032 | 0.999 | ||||
| 2. Agricultural outputs per capita (t) | 0.972 | 0.056 | |||||
| 3. Loans per capita (USD) | 0.976 | 0.006 | |||||
| 4. Deposits per capita (USD) | 0.986 | 0.017 | |||||
| Physical Capital | 5. Family fixed investment (Thousand USD) | 0.878 | |||||
| 6. Rural construction area (million m2) | 0.889 | ||||||
| 7. Agricultural machinery per capita (tractor/cultivator) | 0.929 | ||||||
| 8. Number of villages with tap water | 0.802 | ||||||
| 9. Canal construction | 0.681 | ||||||
| Natural Capital | 10. Pasture area per capita (ha) | 0.780 | |||||
| 11. Farmland area per capita (ha) | 0.503 | ||||||
| 12. Pasture vegetation NPP | 0.535 | ||||||
| 13. Irrigation water use efficiency (kg/m3) | 0.638 | ||||||
| Human Capital | 14. Pastoral labor | 0.980 | |||||
| 15. Agricultural labor | 0.880 | ||||||
| 16. Non-agro-pastoral labor | 0.908 | ||||||
| 17. Educated population | 0.837 | ||||||
| 18. Ratio of pastoral labor to agricultural labor (%) | 0.700 | ||||||
| Social Capital | 19. Rural Gini coefficient | 0.943 | |||||
| 20. Ratio of government officials’ population (%) | 0.875 | ||||||
| 21. Cooperatives | 0.603 | ||||||
| 22. Agro-pastoral cooperation | 0.960 | ||||||
| Variance Contribution Rate | 71.74 | 25.06 | 83.59 | 74.74 | 85.46 | 84.51 | |
Table 5.
Arithmetic mean of Ff, Fp, Fn, Fh, Fs in the Collective Era and Household Land Contract Period.
Table 5.
Arithmetic mean of Ff, Fp, Fn, Fh, Fs in the Collective Era and Household Land Contract Period.
| Livelihood Common Factors | Arithmetic Mean | |
|---|---|---|
| Collective | Household Land Contract | |
| Ff | 0.534 | 0.683 |
| Fp | 0.670 | 0.981 |
| Fn | 0.931 | 0.721 |
| Fh | 0.788 | 0.949 |
| Fs | 0.918 | 0.424 |
Table 6.
Ratio of score coefficients of Ff, Fp, Fn, Fh, Fs (%).
| Livelihood Assets | Indexes | Ff | Fp | Fn | Fh | Fs | |||||
|---|---|---|---|---|---|---|---|---|---|---|---|
| C | H | ||||||||||
| Financial Capital | 1. Livestock per capita (sheep unit) | 61.6 | 19.6 | ||||||||
| 2. Agricultural outputs per capita (t) | 38.4 | 20.4 | |||||||||
| 3. Loans per capita (USD) | 0 | 30.7 | |||||||||
| 4. Deposits per capita (USD) | 1.0 | 29.3 | |||||||||
| C | H | ||||||||||
| Physical Capital | 5. Family fixed investment (Thousand USD) | 25.5 | 21.3 | ||||||||
| 6. Rural construction area (million m2) | 27.1 | 21.9 | |||||||||
| 7. Agricultural machinery per capita (tractor/cultivator) | 23.3 | 21.3 | |||||||||
| 8. Number of villages with tap water | 0 | 16.6 | |||||||||
| 9. Canal construction | 24.1 | 19.0 | |||||||||
| C | H | ||||||||||
| Natural Capital | 10. Pasture area per capita (ha) | 31.6 | 33.7 | ||||||||
| 11. Farmland area per capita (ha) | 20.5 | 21.0 | |||||||||
| 12. Pasture vegetation NPP | 22.5 | 19.4 | |||||||||
| 13. Irrigation water use efficiency (kg/m3) | 25.4 | 25.9 | |||||||||
| C | H | ||||||||||
| Human Capital | 14. Pastoral labor | 21.0 | 17.6 | ||||||||
| 15. Agricultural labor | 22.6 | 16.6 | |||||||||
| 16. Non-agro-pastoral labor | 13.1 | 15.1 | |||||||||
| 17. Educated population | 18.7 | 25.4 | |||||||||
| 18. Ratio of pastoral labor to agricultural labor (%) | 24.6 | 25.3 | |||||||||
| C | H | ||||||||||
| Social Capital | 19. Rural Gini coefficient | 24.0 | 26.8 | ||||||||
| 20. Ratio of government officials’ population (%) | 25.4 | 25.9 | |||||||||
| 21. Cooperatives | 25.8 | 25.0 | |||||||||
| 22. Agro-pastoral cooperation | 24.8 | 22.3 | |||||||||
Note: C is Collective Era. H is HLCP.
Table 7.
Load coefficients of CLAI.
| F | Load Coefficients |
|---|---|
| Ff | 0.613 |
| Fp | 0.859 |
| Fn | 0.539 |
| Fh | 0.892 |
| Fs | 0.928 |
| Variance Contribution Rate (%) | 76.61 |
Table 8.
Arithmetic mean of CLAI in the Collective Era and Household Land Contract Period.
| Time | Arithmetic Mean |
|---|---|
| Collective | 0.808 |
| Household Land Contract | 0.944 |
Table 9.
Ratio of score coefficients of CLAI (%).
| Livelihood Common Factors | Ratio of Score Coefficients of CLAI (%) | |
|---|---|---|
| Collective Era | HLCS Period | |
| Ff | 17.53 | 24.62 |
| Fp | 19.81 | 22.90 |
| Fn | 24.65 | 15.15 |
| Fh | 18.37 | 19.66 |
| Fs | 19.64 | 17.67 |
© 2018 by the authors. Licensee MDPI, Basel, Switzerland. This article is an open access article distributed under the terms and conditions of the Creative Commons Attribution (CC BY) license (http://creativecommons.org/licenses/by/4.0/).
Share and Cite
MDPI and ACS Style
Li, D.; Hruska, T.; Talinbayi, S.; Li, W. Changing Agro-Pastoral Livelihoods under Collective and Private Land Use in Xinjiang, China. Sustainability 2019, 11, 166. https://0-doi-org.brum.beds.ac.uk/10.3390/su11010166
AMA Style
Li D, Hruska T, Talinbayi S, Li W. Changing Agro-Pastoral Livelihoods under Collective and Private Land Use in Xinjiang, China. Sustainability. 2019; 11(1):166. https://0-doi-org.brum.beds.ac.uk/10.3390/su11010166
Chicago/Turabian StyleLi, Dan, Tracy Hruska, Shalima Talinbayi, and Wenjun Li. 2019. "Changing Agro-Pastoral Livelihoods under Collective and Private Land Use in Xinjiang, China" Sustainability 11, no. 1: 166. https://0-doi-org.brum.beds.ac.uk/10.3390/su11010166
Note that from the first issue of 2016, this journal uses article numbers instead of page numbers. See further details here.