A Multi-Objective Hierarchical Model for Irrigation Scheduling in the Complex Canal System


1
Centre for Agricultural Water Research in China, China Agricultural University, Beijing 100083, China
2
Department of Building, Civil and Environmental Engineering, Concordia University, Montréal, QC H3G 1M8, Canada
*
Authors to whom correspondence should be addressed.
Sustainability 2019, 11(1), 24; https://0-doi-org.brum.beds.ac.uk/10.3390/su11010024
Submission received: 31 October 2018
/
Revised: 15 December 2018
/
Accepted: 17 December 2018
/
Published: 20 December 2018
(This article belongs to the Special Issue Rural Sustainable Environmental Management)
Abstract
:Due to population growth, environmental pollution and climate change, the lack of water resources has become a critical factor which threatens sustainable agricultural development. Reasonable irrigation scheduling strategies can reduce the waste of water and enhance agricultural water-use efficiency. In the present study, the decomposition-coordination theory was adopted to analyze the hierarchical canal system. A novel nonlinear multi-level multi-objective optimization model for complex canal systems was established, taking account of the multiple demands from decision makers and realistic factors of canal operation. An interactive method of the technique for order preference using similarity algorithm and genetic algorithm was proposed to solve the developed model. The developed model was successfully applied for the operational strategy making of a canal system located in the arid area of northwest China. The results indicated that the optimization model could help shorten the operational duration by two days, achieve about 26% reduction of irrigation water consumption, and improve the efficiency of water delivery from 0.566 to 0.687. That will be very favorable for the promotion of the agricultural water productivity, the relief of water shortage crisis and the sustainable development of agriculture. The outcomes can provide a wide range of support for decision making and make irrigation decision-making more scientific and systematic.
1. Introduction
Due to population growth, environmental pollution and climate change, the lack of water resources has become a critical factor which threatens the sustainable agricultural development [1,2,3,4,5,6], which has been widely recognized as an effective way for human society and natural system harmonization [7]. Irrigation, as a measure to improve crop production, is one of the main ways of agricultural water consumption, especially in semi-arid and arid areas [8]. There are several methods for irrigation, in which the canal irrigation is a traditional one that is widely used around the world [3,9,10,11]. The canal system usually consists of main canal, branch canal and lateral canal in hierarchy. The irrigation scheduling is usually made according to design flow and design irrigation area. In real-world contexts, the irrigation scheduling is complex when considering the influence of various factors, such as cropping pattern, irrigation quota and irrigation duration. It is a challenge to make canal scheduling only based on experience and simple computation. Meanwhile, unreasonable irrigation scheduling may lead to remarkable water leakage and loss. For example, the utilization coefficient of irrigation water is only 0.542 in China and a large amount of water has been wasted in irrigation [12]. Therefore, there is an urgent need to develop efficient and practical irrigation scheduling for canal irrigation through sound methods.
Over the past decades, many studies have been done regarding canal irrigation scheduling. Suryavanshi and Reddy [13] firstly proposed stream tube hypothesis, in which canal was considered as a tube with equal discharge and the 0–1 linear programming was established to optimize the irrigation scheduling. Wang et al. [14] further improved 0–1 linear programming through coordinating the irrigation runtime and discharge. However, these approaches are limited by the hypothesis that the lowest-level canals have same discharge capacity. On the basis of the concept of time block, Anwar and Clarke [15] presented a mixed-integer linear programming to optimize the canal scheduling among a group of users. It was assumed that canals ran at fixed flow rates and the difference between the scheduled start time and the required time decided by farmers was minimized, while it still has the same limitation with the approaches proposed by Suryavanshi [13] and Wang [14]. Linear programming could be unrealistic for practical planning. With the development of heuristic methods such as evolutionary algorithms, the developed models can also be non-linear and non-convex. For nonlinear canal scheduling optimization with single objective, genetic algorithm has been proved to be an efficient method [16,17,18,19,20].
However, the scheduling optimization with single objective can hardly meet the multiple requirements of decision makers in reality, thus leading to multi-objective programming [21]. This kind of canal scheduling problem needs an integrated solution using metaheuristic techniques such as genetic algorithm (GA) and simulated annealing [22]. Peng et al. [23] generated a multi-objective model for canal scheduling with different flow rates of lowest-level canals. Only the discharge and sequence of secondary canals were considered in decision variables, while there was no consideration of operation duration of each canal.
Although there is an increasing trend in using multi-objective model to optimize canal scheduling [10,24], many following limitations still exist. (i) The distribution of canal system is hierarchical for real cases and the requirements of decision makers may vary with each other. Thus, canal irrigation scheduling making is a multi-level and multi-objective problem. (ii) In order to simplify the model, the runtime or flow rate of each canal were often fixed without change in previous studies. Based on the premise that there is known crop water demand of each canal in irrigation, the runtime of each canal is inversely proportional to the flow rate, which means the optimal flow rates will affect irrigation runtime. Therefore, it is necessary to optimize the flow rate and runtime simultaneously. (iii) The more complex the established model is, the more difficult it is to find an efficient algorithm for solving optimization problems. Due to the large number of decision variables and complex searching process, such irrigation problem will be a NP-hard problem [25] and more efficient method is needed to improve the solving of model.
In this study, therefore, a nonlinear multi-level multi-objective optimization model for complex canal systems will be established, taking account of the multiple demands from decision makers and realistic factors of canal operation in practice. An interactive solving method integrating the technique for order preference by similarity to ideal solution (TOPSIS) and GA will be proposed to solve the abovementioned model. The framework of this study is shown in Figure 1.
2. Methodology
2.1. Decomposition-Coordination Theory for Canal Systems
Canal system refers to the irrigation canals in this paper. The canals are often classified as main canal, branch canal, lateral canal, etc., according to hierarchy. In some complex irrigation systems, the main canal can be divided into a general main canal and sub-main canal, and so can the branch canal. A schematic diagram of a typical canal system is shown in Figure 2. Large-scale system decomposition-coordination methods, which is an algorithm for solving large-scale, multi-reservoir systems, can simplify complex problems into several interrelated sub-problems and to obtain the global optimum on the global through coordination among sub-systems [26]. Though the solving method was not actually adopted, its principle would provide a clear model framework for large-scale system [27]. Thus, the decomposition-coordination theory was adopted to analyze such multi-level canal system.
Based on the decomposition-coordination theory, the large scale systems can be split into several relatively independent subsystems and the coordination variables can be used to connect with each other. The generalized model framework according to the decomposition-coordination theory for large-scale canal irrigation system is shown in Figure 3. The related coordination variables include flow rate, start time, and end time of canals.
2.2. Model Development
A nonlinear multi-level multi-objective model was developed to optimize irrigation scheduling for complex canal systems. The decision variables were flow rates, operational start times, and operational end times of the last-stage canals. The objectives of first-level model were to minimize the total leakage loss of the whole irrigation system and the flow fluctuation of the first-level canal. The total leakage loss was also minimized for each subsystem. The corresponding mathematical expressions are shown as follows and the meaning of parameters is shown in Table 1.
First level:
Second level:
Third level:
where, the and , which mean the flow rate of the upper level in a specific moment was an accumulation of the gross flow rates of its controlled canals. Equation (1) denoted the variance of flow rate at different times.
The leakage loss of each subsystem was the sum of the water loss from the dominant canal and its controlled lower canals, as shown in Equations (2)–(4). Though the aforementioned expressions established a three-level canal system, more complex canal system can be involved by applying the same principle. The leakage loss of canal was calculated as follows, in which the empirical formula by Guo [28] was used. The leakage flow quantity was the product of leakage flow rate and the duration.
Taking account of the operational demand in reality, four constrains, including the flow capacity of canal, runtime, discharge into the field, and flow continuity, were considered in this study.
(1) Flow capacity constraint
For the security of canal operation, the gross flow rate should not exceed the maximum flow rate. Meanwhile, in order to ensure the sufficient flow movement, the net flow rate should not be lower than minimum flow rate.
(2) Runtime constraint
The irrigation time should be within the requested irrigation period. If assuming the canal operation begins at 0, the start time should be equal or greater than 0 and the end time should not exceed T. Additionally, the end time should be higher than the start time.
(3) Discharge constraint
The net discharge of each lowest-level canal should meet the net water demand of the crops in the canal area. The total gross water consumption of the canal system should not exceed the available water supply. Note that the water demand was regarded as changeable but known, including the effect of soil water, precipitation and even the deficit irrigation requirement.
(4) Flow continuity constraints
The flow rate at the entrance of a canal should equal the sum of flow rates at the entrance of each subordinate plus its leakage loss.
2.3. Model Solving
In multi-level programming, the upper-level decision makers first make their own decision and then ask each subordinate to search its optimal decision based on the upper-level outcomes. Then the lower-level decision can be submitted to upper level and the upper-level decision makers will modify their decision based on lower-level feedback. In such a way, the decision made by lower levels can also impact the decision of upper levels. The solution requires continuous adjustment among different levels. Recently, much attention has been paid to the nonlinear multi-level multi-objective programming in systems optimization [29,30,31,32]. Due to its complexity, it is often difficult to have the problem solved effectively and conveniently through single algorithm. In this study, an interactive technique for order preference by similarity algorithm to ideal solution (TOPSIS) [33] was used. Meanwhile, GA was combined with TOPSIS for solving this problem. The diagram of solution procedure is shown in Figure 4. Due to the large number of decision variables, the initial population generation of GA was further improved. Other procedures in GA can be referred to the works of Wardlaw and Bhaktikul [18], and Haq and Anwar [16].
3. Case Study
3.1. Study Area and Data Collection
The study area is located in the middle reaches of Heihe River Basin (98°00′–101°30′ E, 38°00′–42°30′ N), Zhangye City, Gansu Province of China (Figure 5a,b). The area has a typical arid and semi-arid climate, with low precipitation (about 200 mm/year) and high potential evaporation (above 1500 mm/year) according to the Zhangye Statistical Yearbook. Agriculture is the main water-use sector and agricultural water consumption accounts for 87.6% of the total water consumption in Zhangye [34]. Under the changing environment, the conflicts between water supply and demand are aggravated and agricultural development has been threatened by scarce water resources. Meanwhile, Zhangye has a long history of agricultural irrigation and possesses relatively complete irrigation canal networks. The water-use efficiency of canal networks by artesian irrigation at Zhangye is about 0.535 in 2016 according to the water efficiency calculation and analysis report for farm irrigation of Zhangye in 2016, which is lower than the average level in China, 0.542, according to the China water resources bulletin of 2016. Such low water-use efficiency and inappropriate water resources management have further worsened the existing conflicts [35,36]. Therefore, it is necessary to improve the water-use efficiency in irrigation. This study focused on the Mingyong submain canal and its subordinate canals, which belong to Xigan irrigation district in Ganzhou district, Zhangye City. Figure 5d shows the distribution of the Mingyong submain canal and its subordinate canals. The canal system consists of one first-level canal, four second-level canals and twenty-three third-level canals. The attributes of the canal system are listed in Table 2, where the canal number will be used to represent the canal name in the following section. The lateral canal of the canal system has no lining. When calculating canal leakage, its reduction coefficient by canal lining is 1 according to Guo [28]. However, the branch canal and submain canal have concrete lining, whose reduction coefficient by canal lining is 0.5 [28]. The third round of summer irrigation in 2016 is selected as study phase. The data of irrigation area, water demand and water availability came from the water allocation project of 2016 in Xigan irrigation district, Ganzhou district, Zhangye (WAP), which are listed in Table 3. Meanwhile, the planning irrigation period as the requirement of the WAP is from 18 June to 9 July, 22 days in total. The empirical water efficiency of Mingyong submain canal system is 0.566 according to the WAP of Xigan irrigation district in 2016.
Based on the decomposition-coordination theory, a nonlinear bi-level multi-objective model was established. The parameter identification is listed in Table 4. The empirical coefficients of canal leakage computation were referred to the literature of Guo [28]. The time step was set as half day and then there were 44 periods of time within the whole irrigation period, i.e., the T = 44 in Equation (1).
3.2. Result Analysis and Discussion
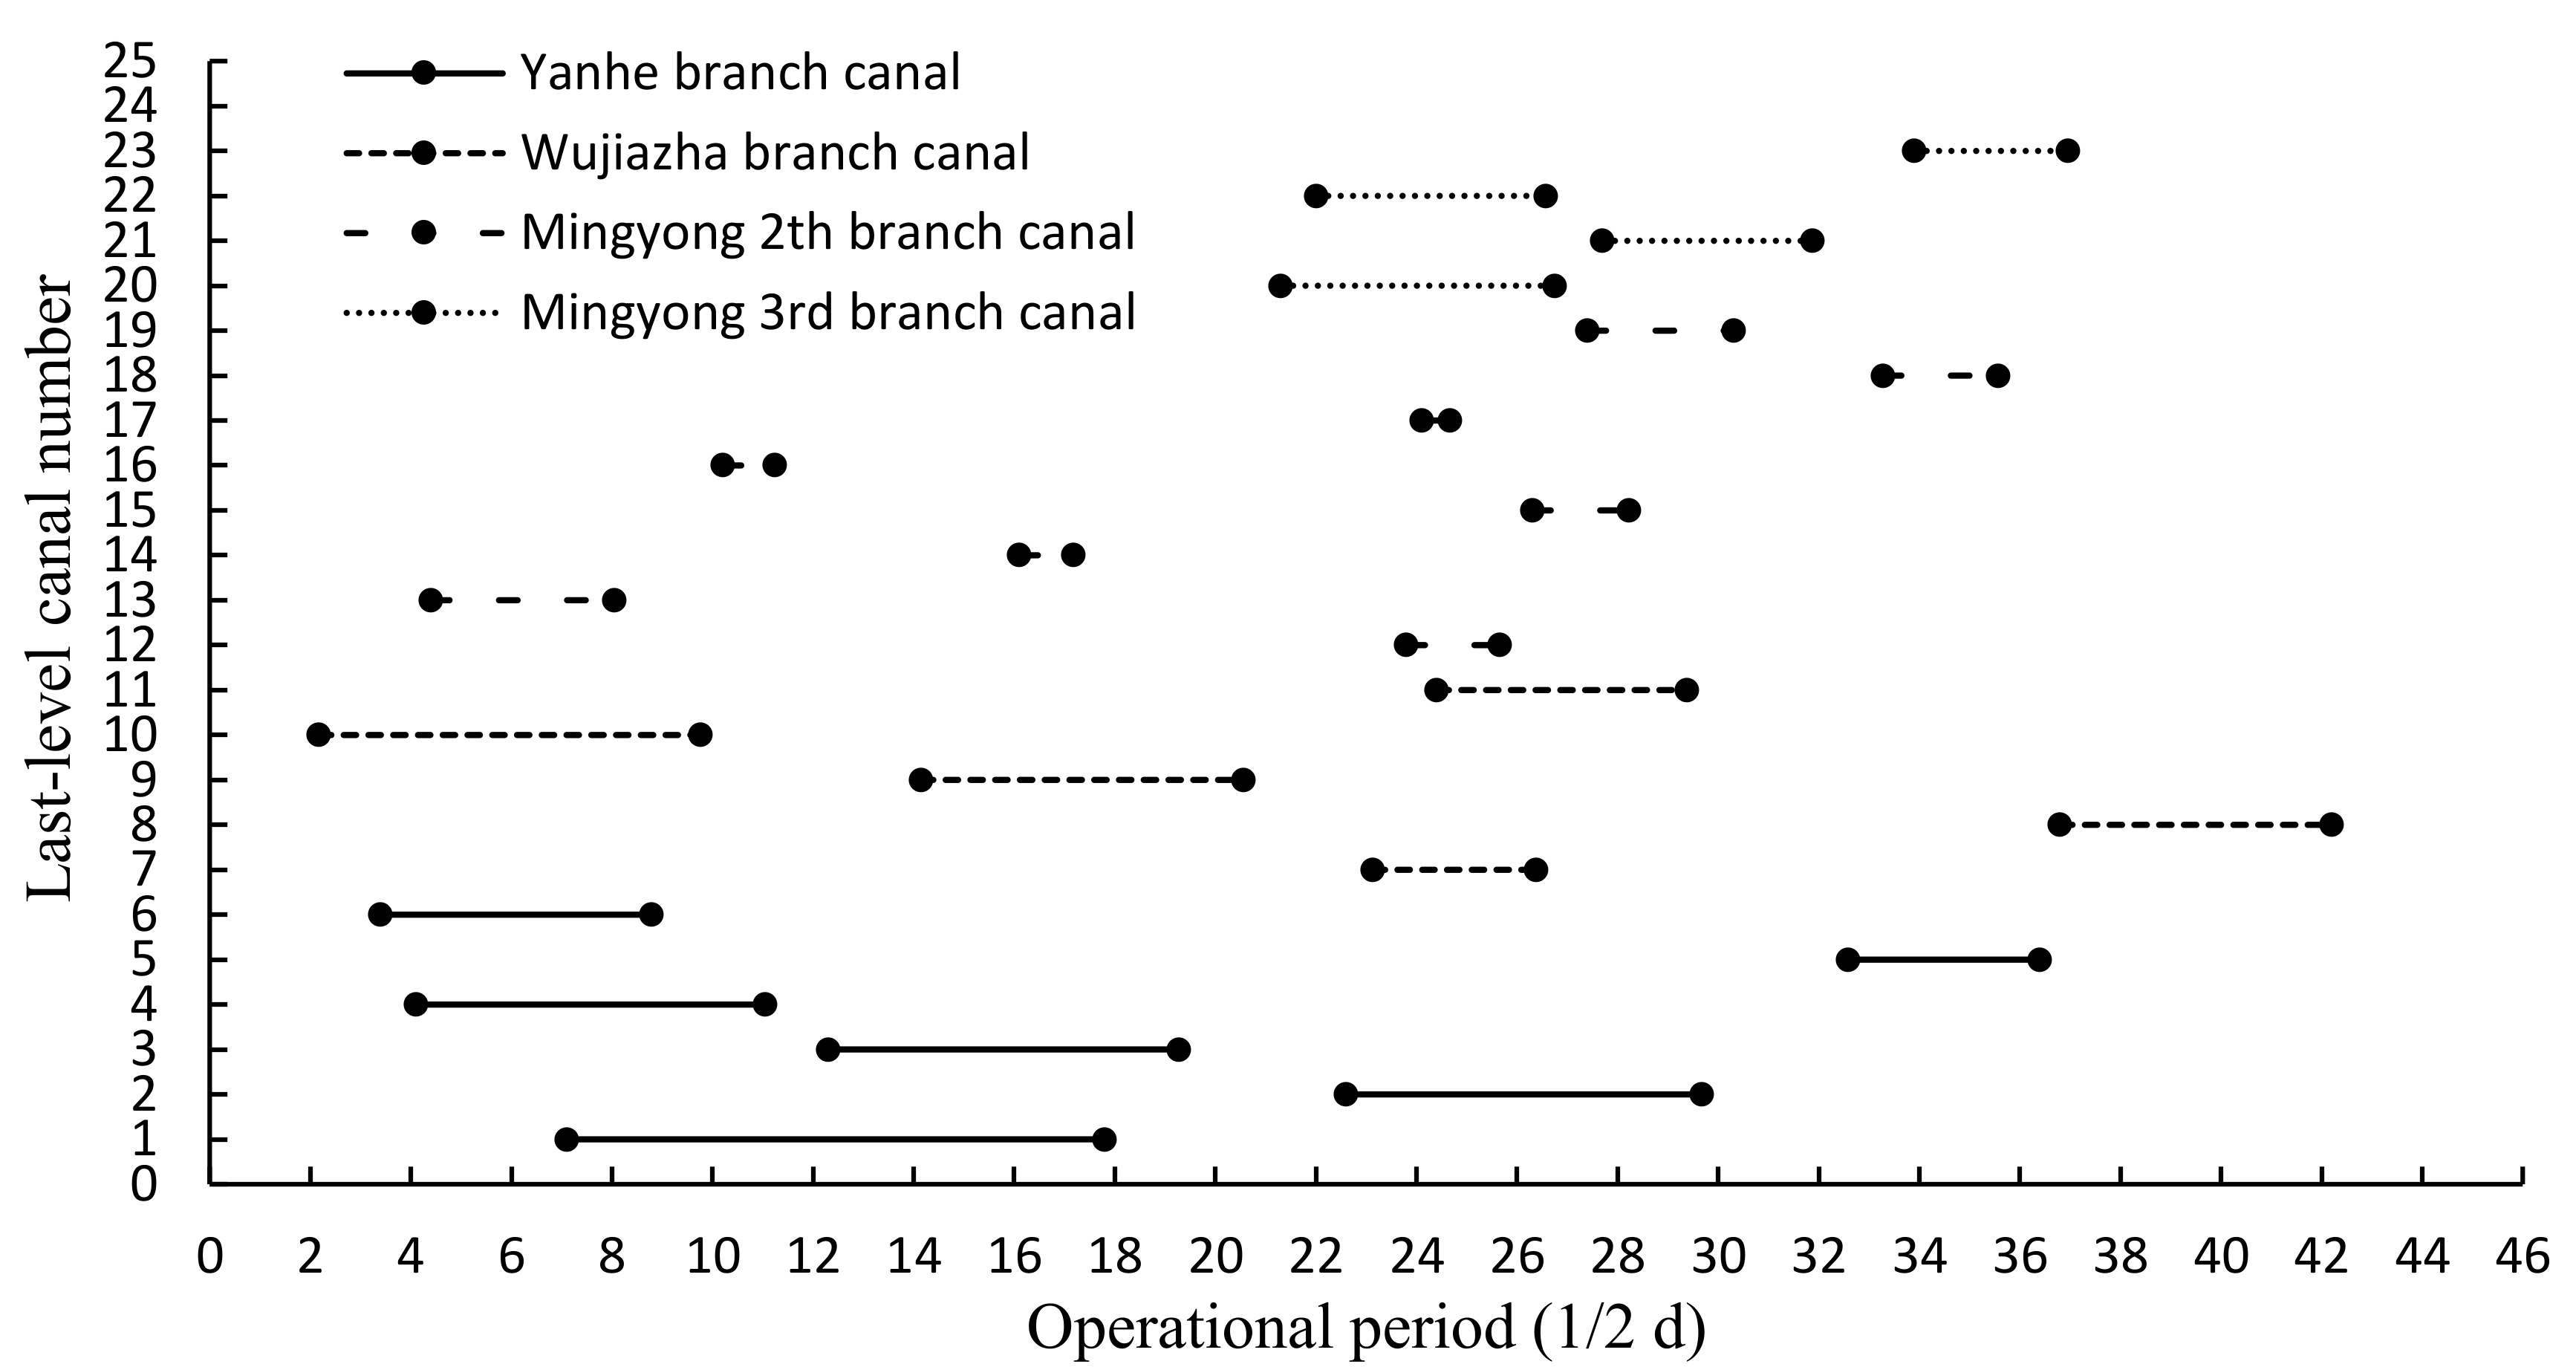
Figure 6 shows the irrigation scheduling of the lowest-level canals. The optimal duration of the whole canal system decreased from 44 periods to 40 periods, indicating the increase of the average flow rate of canal system. As is shown in Figure 6, the operational duration of the lowest-level canals attached to Mingyong 2nd branch canal was significantly less than others. That could be attributed to the relatively small water demands in this area (Table 3). Their higher design flow rates also suggested their demand flow rates were high and, thus, the amount of required time for delivery was low. Meanwhile, given that the crops which needed irrigating in this study phase were spring wheat, seed maize and field maize, another reason for low operational duration could be due to less cropping area of these types of crops irrigated by the Mingyong 2nd branch canal and its subordinate canals compared with other areas.
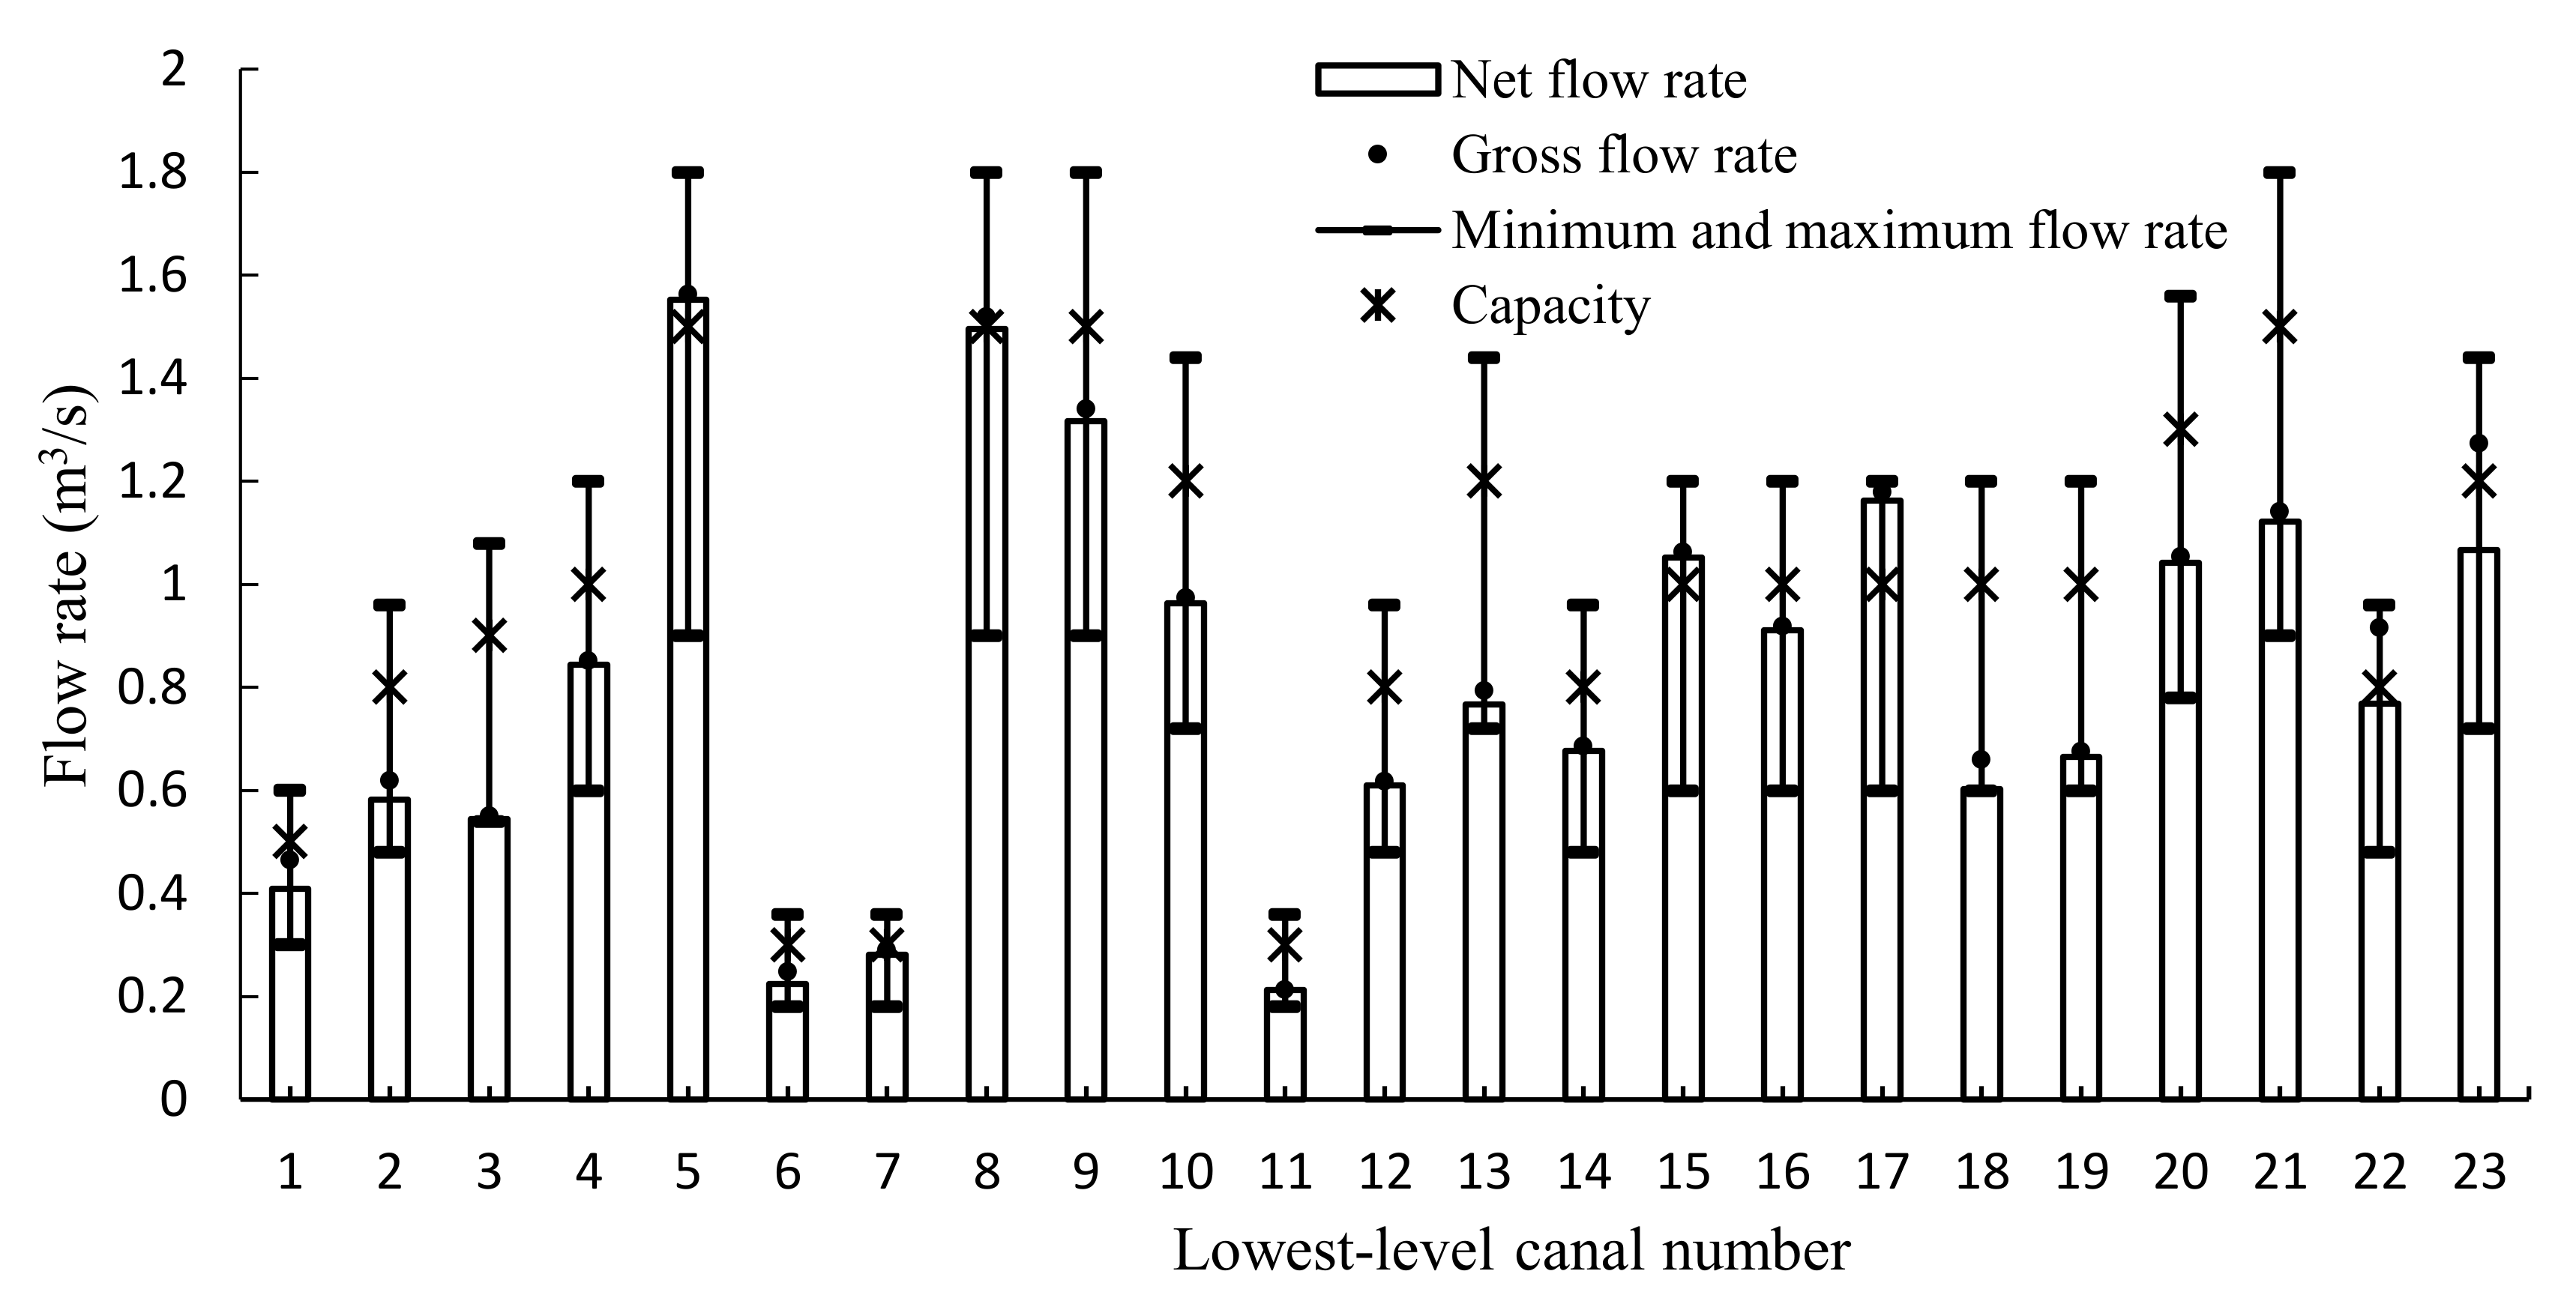
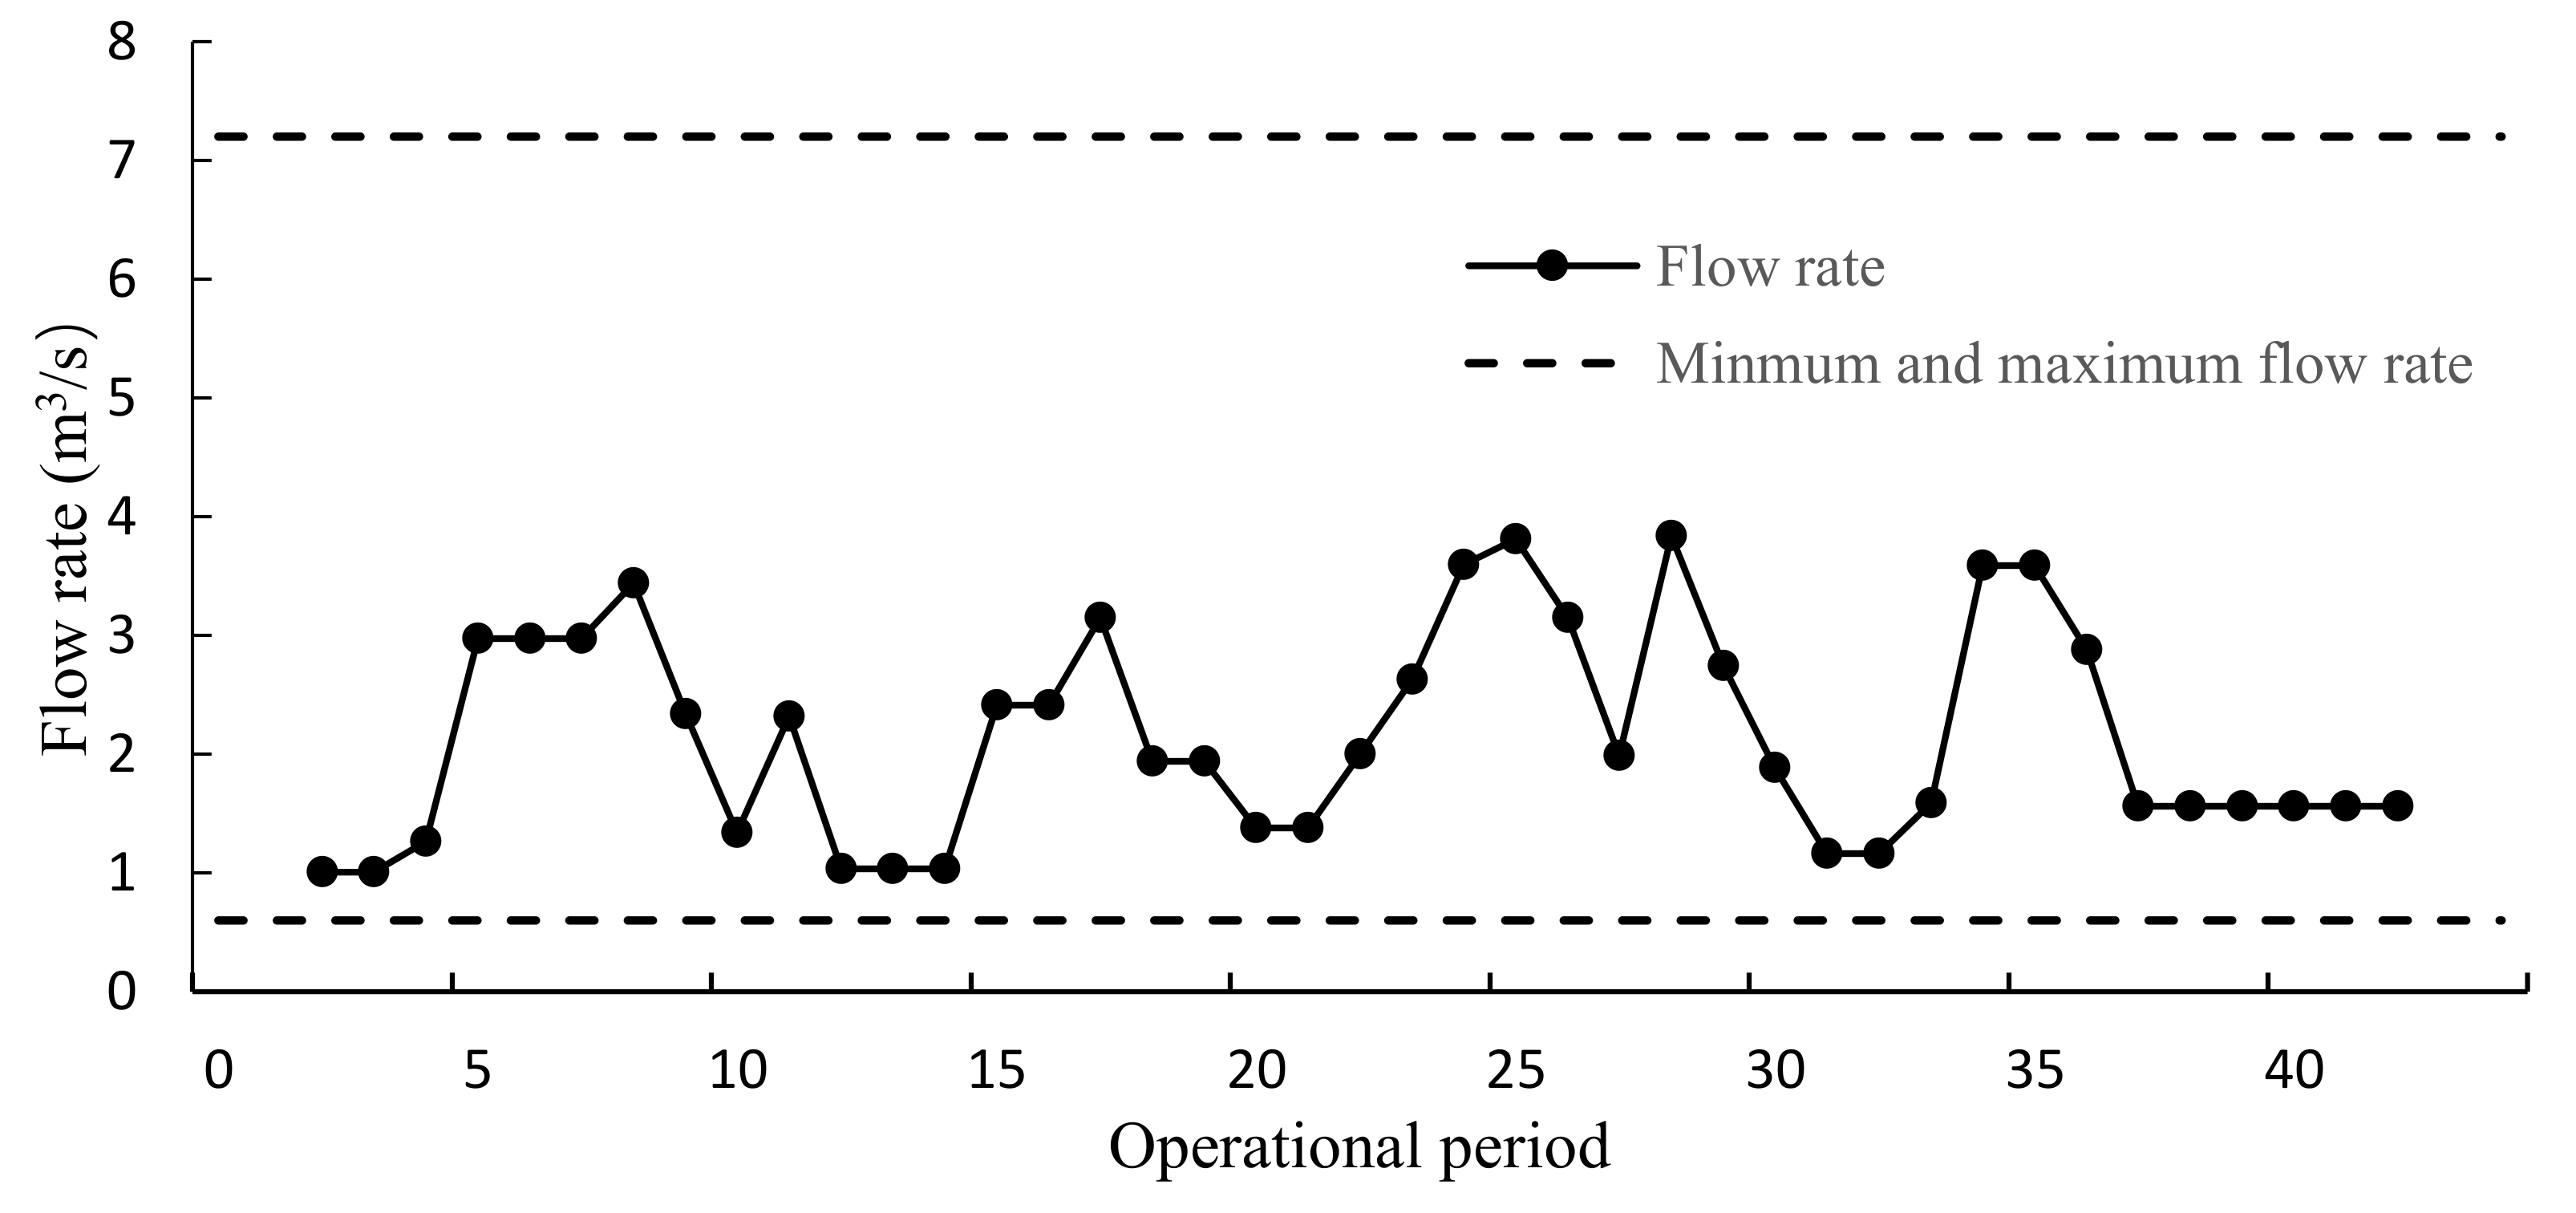
Figure 7 shows the optimal net flow rates, gross flow rates, design flow rates, minimum and maximum flow rates of the lowest-level canals. The optimal flow rates were within the range between minimum and maximum flow rates, which means the optimal flow rates meet the operational requirement in reality. The operation flow rate of the first-level canal is exhibited in Figure 8. The results show that the flow rate can also be within the range between maximum and minimum flow rates, which would guarantee the normal operation of canal irrigation. Moreover, the flow rates of each second-level canal can also meet the normal irrigation operation requirement (Figure 9). However, it was also noted that the irrigation operation of second-level canals was not continuous (Figure 6). The reason could be that the solution of the model was dominated by first-level objectives and the flow continuity in lower-level canals was not guaranteed. Although it may result in the frequent open and close of the canal sluice gates for second-level canals, the whole irrigation system can still meet best the requirements of decision makers.
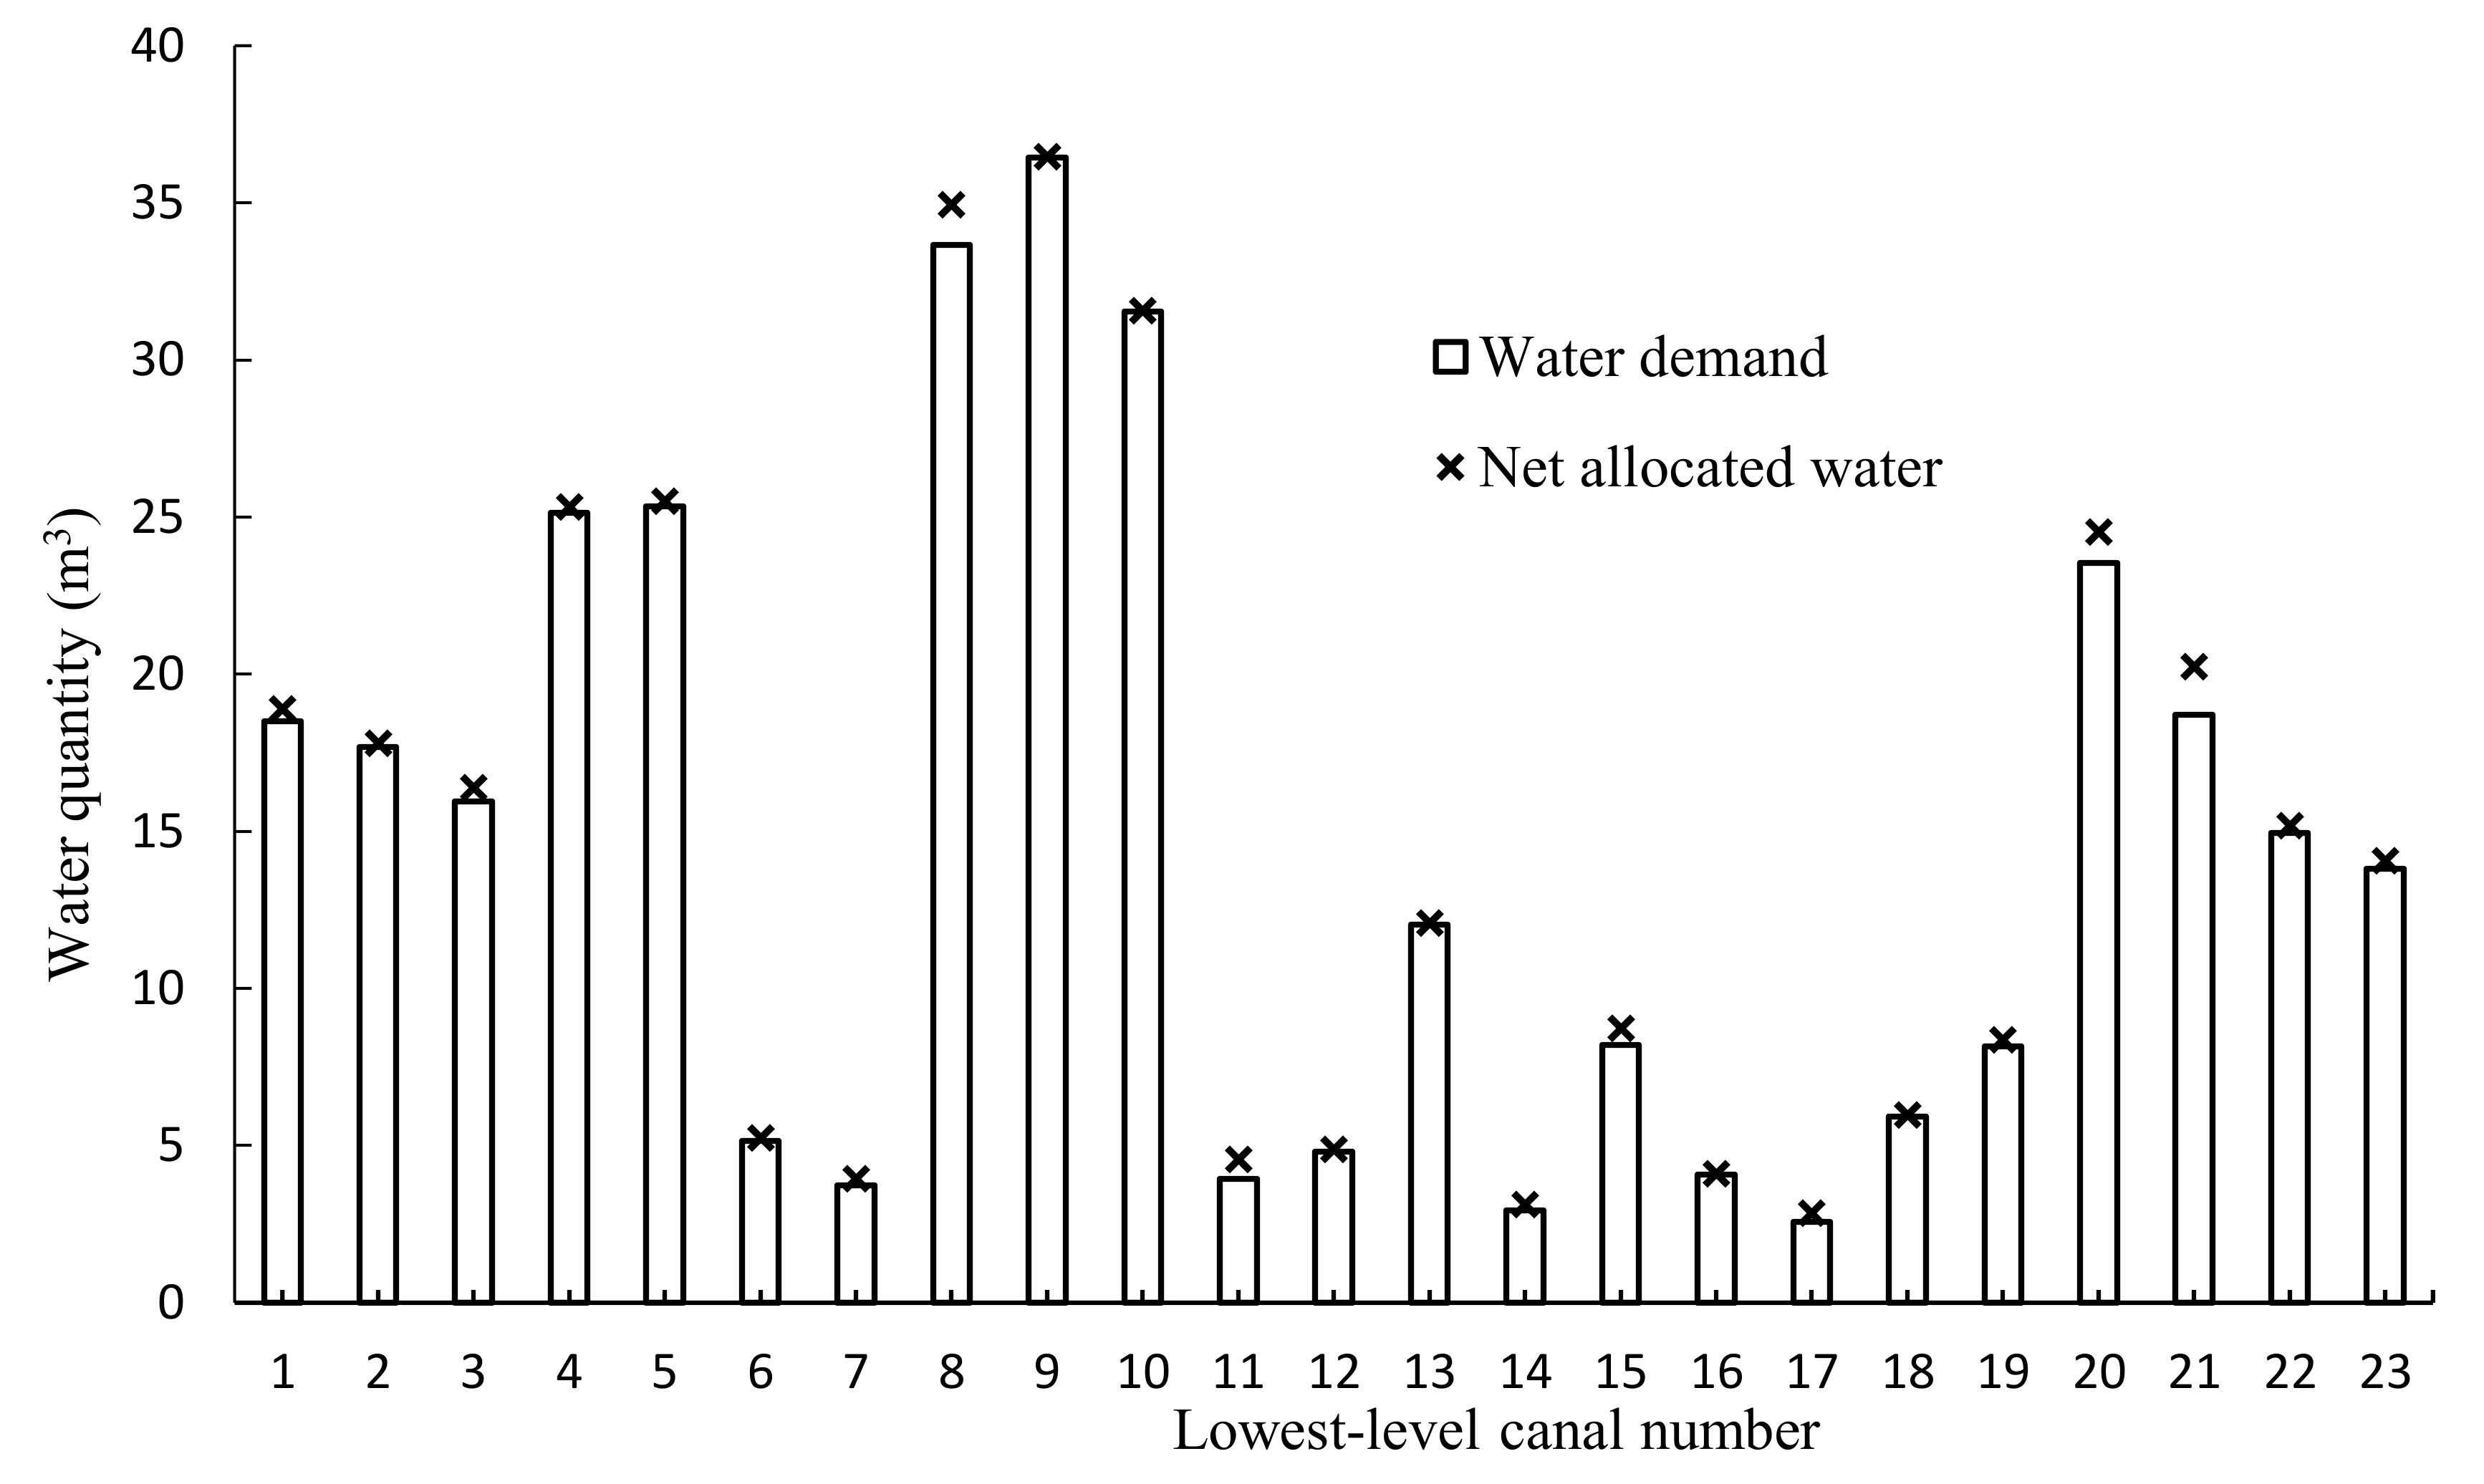
Figure 10 presents the optimal allocated water and the planned water demand. The results indicated the optimal allocated water resources could satisfy the planned water demands. Table 5 shows the canal leakage loss of each level canal system. Compared with other second-level canals, the Mingyong 3rd branch canal and its subordinates had less leakage loss. The subordinates of Mingyong 3rd branch canal are sub-branch canals with higher rates of lining, which can significantly reduce the leakage loss. It also proved that effective lining would be an efficient way to reduce the leakage loss of canals. The total water consumption was 4.23 million m3 under optimal conditions, saving about 150 × 104 m3 water (26%) compared with planned water use of 5.73 million m3 according to the WAP.
Table 6 shows the optimal net allocated water resources, the optimal and empirical effective utilization coefficients, correspondingly. The empirical data was referred to the WAP of Xigan irrigation district in 2016. It can be seen the canal water-use efficiency was significantly improved through using the developed optimization model. Compared with the results for lateral canals, an obvious efficiency enhancement of the main canals and branch canals was obtained after optimization. That proves the reasonable management would be an effective measure to enhance water-use efficiency when the certain requirement for lining was met. The total water-use efficiency of the Mingyong canal system increased from 0.566 to 0.687, indicating that water saving can be achieved by optimizing the canal operation scheduling.
Therefore, the results show that (i) the optimal flow rates can meet the requirement of the canal operation, which guarantees the canal operational reliability. (ii) The optimal water allocation can satisfy the net crop water demand, showing its practicability. (iii) The reduction of operational duration and water leakage loss demonstrate the advancement of the developed model. Compared with previous studies [3,10,23,24,37], the developed model has some advantages as follows. (i) From the perspective of model structure, it is a multi-level and multi-objective model which can reflect the actual distribution of the canal system and deal with the conflict of different decision makers in practice. (ii) From the angle of model component, the model takes account of the restrictive relationship of canal flow rate and runtime, making it more consistent with the reality. (iii) From the algorithm, the algorithm possess the ability to solve the model with more complex structure and more accurate time step. The model can solve the half-day time step with a 22-day period, while one day is usually selected as the time step when the time constraint is beyond 10 days in previous studies [3,8,20,21,34]. Additionally, the model and algorithm can be modified and applied to other canal systems. Nonetheless, the established optimization model has some limitation. One limitation of the proposed approach is about the use of a simplified equation when calculating the variance of the superior canal. That could make runtime discrete and rather than continuous variable. Though the accuracy of the outcome will increase with the decrease of the time step, the associated computation effort will also increase, which calls for a more efficient algorithm in further work. Furthermore, considering the deep percolation is an important source of groundwater recharge and may also play a critical part in recharging the wetlands [33], the further improvement can also be conducted by involving the contribution of canal percolation to local ecology.
4. Conclusions
In order to resolve the irrigation management problem for complex canal system, a multi-level nonlinear multi-objective model was established to meet the multiple requirements of decision makers under different positions. The decomposition-coordination principle was adopted to help analyze the relationship among canals in different levels and clarify the connection among different components of the established model. Then an improved algorithm which combined GA and TOPSIS was applied to resolve the multilevel and multi-objective model.
As a demonstration, the developed model and algorithm were applied for the scheduling making of a canal system located in the arid area of northwest China. The results indicated that the integrated algorithm can solve the problem more efficiently by using a shorter time step and the optimization model can shorten the operational duration by two days, achieve about 26% reduction of irrigation water consumption, and improve the efficiency of water delivery from 0.566 to 0.687. The model can also reflect the tradeoffs of multiple targets from the same level and give an insight into the effects of various demands of the different levels. Thus, the decision-makers can make informed operation decisions by given the flexibility to change their expectation according to the feedback from other levels. That will be very favorable for the promotion of the agricultural water productivity, the relief of water shortage crisis and the sustainable development of agriculture. This proposed approach also has a great potential for being further modified based on the characteristics of other canal systems. The outcomes can provide a wide range of support for decision making and make irrigation decision-making more scientific and systematic.
Author Contributions
Conceptualization: S.G.; methodology: S.G.; data curation: F.Z. and C.Z.; writing—original draft preparation: S.G., F.Z. and C.Z..; writing—review and editing: C.A., S.W. and P.G.; supervision: S.W. and P.G.
Funding
This research was supported by the National Key Research and Development Plan (no. 2016YFC0400207), and the National Natural Science Foundation of China (51621061).
Conflicts of Interest
On behalf of all authors, the corresponding author states that there is no conflict of interest.
References
- Piao, S.; Ciais, P.; Huang, Y.; Shen, Z.; Peng, S.; Li, J.; Zhou, L.; Liu, H.; Ma, Y.; Ding, Y.; et al. The impacts of climate change on water resources and agriculture in China. Nature 2010, 467, 43–51. [Google Scholar] [CrossRef] [PubMed]
- Li, M.; Guo, P. A multi-objective optimal allocation model for irrigation water resources under multiple uncertainties. Appl. Math. Model. 2014, 38, 4897–4911. [Google Scholar] [CrossRef]
- Delgoda, D.; Malano, H.; Saleem, S.K.; Halgamuge, M.N. A novel generic optimization method for irrigation scheduling under multiple objectives and multiple hierarchical layers in a canal network. Adv. Water Resour. 2017, 105, 188–204. [Google Scholar] [CrossRef]
- Fu, Q.; Li, L.; Li, M.; Li, T.; Liu, D.; Hou, R.; Zhou, Z. An interval parameter conditional value-at-risk two-stage stochastic programming model for sustainable regional water allocation under different representative concentration pathways scenarios. J. Hydrol. 2018, 564, 115–124. [Google Scholar] [CrossRef]
- Tan, Q.; Zhang, T. Robust fractional programming approach for improving agricultural water-use efficiency under uncertainty. J. Hydrol. 2018, 564, 1110–1119. [Google Scholar] [CrossRef]
- He, X.J. Information on Impacts of Climate Change and Adaptation in China. J. Environ. Inform. 2017, 29, 110–121. [Google Scholar] [CrossRef]
- Li, Y.P.; Nie, S.; Huang, C.Z.; McBean, E.A.; Fan, Y.R.; Huang, G.H. An Integrated Risk Analysis Method for Planning Water Resource Systems to Support Sustainable Development of An Arid Region. J. Environ. Inform. 2017, 29, 1–15. [Google Scholar] [CrossRef]
- Kang, S.; Hao, X.; Du, T.; Tong, L.; Su, X.; Lu, H.; Li, X.; Huo, Z.; Li, S.; Ding, R. Improving agricultural water productivity to ensure food security in China under changing environment: From research to practice. Agric. Water Manag. 2017, 179, 5–17. [Google Scholar] [CrossRef]
- Mekonnen, D.; Siddiqi, A.; Ringler, C. Drivers of groundwater use and technical efficiency of groundwater, canal water, and conjunctive use in Pakistan’s Indus Basin Irrigation System. Int. J. Water Resour. Dev. 2016, 32, 459–476. [Google Scholar] [CrossRef]
- Kanooni, A.; Monem, M.J. Integrated stepwise approach for optimal water allocation in irrigation canals. Irrig. Drain. 2014, 63, 12–21. [Google Scholar] [CrossRef]
- Hong, S.; Malaterre, P.; Belaud, G.; Dejean, C. Optimization of water distribution for open-channel irrigation networks. J. Hydroinform. 2014, 16, 341–353. [Google Scholar] [CrossRef]
- China Water Resources Bulletin. 2015; China Water Power Press: Beijing, China, 2016.
- Suryavanshi, A.R.; Reddy, J.M. Optimal operation schedule of irrigation distribution systems. Agric. Water Manag. 1986, 11, 23–30. [Google Scholar] [CrossRef]
- Wang, Z.; Reddy, J.M.; Feyen, J. Improved 0-1 programming model for optimal flow scheduling in irrigation canals. Irrig. Drain. Syst. 1995, 9, 105–116. [Google Scholar] [CrossRef]
- Anwar, A.A.; Clarke, D. Irrigation scheduling using mixed-integer linear programming. J. Irrig. Drain. Eng. 2001, 127, 63–69. [Google Scholar] [CrossRef]
- Haq, Z.U.; Anwar, A.A. Irrigation scheduling with genetic algorithms. J. Irrig. Drain. Eng. 2010, 136, 704–714. [Google Scholar] [CrossRef]
- Moghimi, M.M.; Sepaskhah, A.R. Effect of various on-farm water management scenarios on equity and productivity in irrigation networks. Water Resour. Manag. 2016, 30, 2405–2424. [Google Scholar] [CrossRef]
- Wardlaw, R.; Bhaktikul, K. Application of genetic algorithms for irrigation water scheduling. Irrig. Drain. 2004, 53, 397–414. [Google Scholar] [CrossRef]
- Kuo, S.F.; Liu, C.W.; Chen, S.K. Comparative study of optimization techniques for irrigation project planning. J. Am. Water Resour. Assoc. 2003, 39, 59–73. [Google Scholar] [CrossRef]
- Kuo, S.F.; Merkley, G.P.; Liu, C.W. Decision support for irrigation project planning using a genetic algorithm. Agric. Water Manag. 2000, 45, 243–266. [Google Scholar] [CrossRef]
- Pastori, M. A Multi-objective approach to evaluate the economic and environmental impacts of alternative water and nutrient management strategies in Africa. J. Environ. Inform. 2015, 29, 16–28. [Google Scholar] [CrossRef]
- Haq, Z.U.; Anwar, A.A.; Clarke, D. Evaluation of a Genetic Algorithm for the irrigation scheduling problem. J. Irrig. Drain. Eng. 2008, 134, 737–744. [Google Scholar] [CrossRef]
- Peng, S.Z.; Wang, Y.; Khan, S.; Rana, T.; Luo, Y.F. A simplified multi-objective genetic algorithm optimization model for canal scheduling. Irrig. Drain. 2012, 61, 294–305. [Google Scholar] [CrossRef]
- Pawde, A.W.; Mathur, Y.P.; Kumar, R. Optimal water scheduling in irrigation canal network usding particle swarm optimization. Irrig. Drain. 2013, 62, 135–144. [Google Scholar] [CrossRef]
- Anwar, A.A.; Haq, Z.U. Genetic algorithms for the sequential irrigation scheduling problem. Irrig. Sci. 2013, 31, 815–829. [Google Scholar] [CrossRef]
- Li, A. A study on the large-scale system decomposition-coordination method used in optimal operation of a hydroelectric system. Water Int. 2004, 29, 228–231. [Google Scholar]
- Shangguan, Z.; Shao, M.; Horton, R.; Lei, T.; Qin, L.; Ma, J. A model for regional optimal allocation of irrigation water resources under de®cit irrigation and its applications. Agric. Water Manag. 2002, 139–154. [Google Scholar] [CrossRef]
- Guo, Y. Irrigation and Drainage Engineering; China Water Power Press: Beijing, China, 1997. (In Chinese) [Google Scholar]
- Osman, M.S.; Abo-Sinna, M.A.; Amer, A.H.; Emam, O.E. A multi-level non-linear multi-objective decision-making under fuzziness. Appl. Math. Comput. 2004, 153, 239–252. [Google Scholar] [CrossRef]
- Abo-Sinna, M.A.; Baky, I.A. Interactive balance space approach for solving multi-level multi-objective programming problems. Inf. Sci. 2007, 177, 3397–3410. [Google Scholar] [CrossRef]
- Besheli, S.F.; Keshteli, R.N.; Emami, S.; Rasouli, S.M. A fuzzy dynamic multi-objective multi-item model by considering customer satisfaction in a supply chain. Sci. Iran. 2017, 24, 2623–2639. [Google Scholar] [CrossRef]
- Dalman, H.; Bayram, M. Interactive fuzzy goal programming based on Taylor series to solve multiobjective nonlinear programming problems with interval type-2 fuzzy numbers. IEEE Trans. Fuzzy Syst. 2018, 26, 2434–2449. [Google Scholar] [CrossRef]
- Baky, I.A. Interactive TOPSIS algorithms for solving multi-level non-linear multi-objective decision-making problems. Appl. Math. Model. 2014, 38, 1417–1433. [Google Scholar] [CrossRef]
- Feng, L.; Chen, B.; Hayat, T.; Alsaedi, A.; Ahmad, B. The driving force of water footprint under the rapid urbanization process: A structural decomposition analysis for Zhangye city in China. J. Clean. Prod. 2017, 163, S322–S328. [Google Scholar] [CrossRef]
- Wang, G.; Chen, J.; Wu, F.; Li, Z. An integrated analysis of agricultural water-use efficiency: A case study in the Heihe River Basin in Northwest China. Phys. Chem. Earth 2015, 89–90, 3–9. [Google Scholar] [CrossRef]
- Liu, Y.; Hu, X.; Zhang, Q.; Zheng, M. Improving agricultural water use efficiency: A quantitative study of zhangye city using the static CGE model with a CES water-land resources account. Sustainability 2017, 9, 308. [Google Scholar] [CrossRef]
- Kaur, S.; Srivastava, D.K.; Arya, D.S. Improved planning model for canal scheduling of rotational irrigation. J. Irrig. Drain. Eng. 2013, 139, 560–570. [Google Scholar] [CrossRef]
Figure 1.
The framework of study.

Figure 2.
A schematic representation of canal distribution. The actual example takes a typical canal system distribution in reality for example. The model example is ranked by the level of canals, which will be used in the model description.
Figure 2.
A schematic representation of canal distribution. The actual example takes a typical canal system distribution in reality for example. The model example is ranked by the level of canals, which will be used in the model description.

Figure 3.
The generalized model framework according to the decomposition-coordination theory for a large-scale system. The hypothetical additional variables are represented by an ellipsis.
Figure 3.
The generalized model framework according to the decomposition-coordination theory for a large-scale system. The hypothetical additional variables are represented by an ellipsis.

Figure 4.
The solving procedure of the developed model.

Figure 5.
Map of the Mingyong submain canal network. (a) The location of Gansu Province in China. (b) The location of Ganzhou District, Zhangye City, Gansu Province. (c) The distribution of Ganzhou irrigation network and the location of Mingyong submain network. (d) The distribution of Mingyong submain network.

Figure 6.
The operation schedule of the lowest-level canals. The legend means the lowest-level canal is attached to the second-level canal.
Figure 6.
The operation schedule of the lowest-level canals. The legend means the lowest-level canal is attached to the second-level canal.

Figure 7.
The optimal net flow rates, gross flow rates, min-max flow rates, and capacities of the lowest-level canals.
Figure 7.
The optimal net flow rates, gross flow rates, min-max flow rates, and capacities of the lowest-level canals.

Figure 8.
The optimal flow rates of the first-level canal over time.

Figure 9.
The optimal flow rates of the second-level canals over time.

Figure 10.
The optimal allocated water and the planned water demand.


Table 1.
Nomenclatures for parameters.
| Parameter | Description | Unit |
|---|---|---|
| S0 | The leakage loss of the first-level canal | m3 |
| Si | The leakage loss of the second-level canal | m3 |
| Sji | The leakage loss of the third-level canal | m3 |
| Skij | The leakage loss of the forth-level canal | m3 |
| Q0t | The net flow rate of fisrt-level canal at the t th time moment | m3/s |
| The mean of all Q0t within a rotation period | m3/s | |
| t | The sequence number of irrigation time period with total number T | |
| i | The sequence number of secondary canals in the second level with total number I | |
| ji | The sequence number of canals in the third level affiliated with i th second-level canal. The total number is Ji | |
| kij | The sequence number of canals in the fourth level affiliated with ji th third-level canal, which belongs to i th second-level canal. The total number is Kij | |
| s | The leakage loss of the canal | m3 |
| Δq | The leakage flow rate of the canal | m3/s |
| q | The net flow rate of the canal | m3/s |
| t′ | The start runtime of the canal | |
| t′′ | The end runtime of the canal | |
| β | Reduction coefficient by canal lining | |
| A | Infiltration coefficient of canal bed | |
| l | The canal length | m |
| m | Infiltration index of canal bed | |
| qd | The design flow rate of the canal | m3/s |
| a | The coefficient of minimum capacity | |
| b | The coefficient of maximum capacity | |
| qf | The flow rate of the f th last-level canal | m3/s |
| tf′ | The start time of the f th last-level canal | |
| tf′′ | The end time of the f th last-level canal | |
| S | The total leakage loss of the whole canal system | m3 |
| Wa | The available water supply | m3 |
| Mf | The irrigation quota of the area controlled by the f th last-level canal | m3 |
| Areaf | The area controlled by the f th last-level canal | m2 |
Table 2.
The attributes of Mingyong submain canal and its subordinates (I, II, III, IV represent the second-level canals. 1–23 represent the lowest-level canals, corresponding to the Figure 5d. The canal number will be used in the following parts.).
Table 2.
The attributes of Mingyong submain canal and its subordinates (I, II, III, IV represent the second-level canals. 1–23 represent the lowest-level canals, corresponding to the Figure 5d. The canal number will be used in the following parts.).
| Canal Number | Name | Type | Capacity (m3/s) | Total Length (km) | Design Irrigation Area (hm2) |
|---|---|---|---|---|---|
| Mingyong | Submain canal | 6.00 | 1.780 | 3445.067 | |
| I | Yanhe | Branch canal | 2.00 | 2.410 | 870.000 |
| 1 | Zhishu | Lateral canal | 0.50 | 2.580 | 149.400 |
| 2 | Yanhe 1st | Lateral canal | 0.80 | 1.400 | 142.733 |
| 3 | Yanhe 2nd | Lateral canal | 0.90 | 1.510 | 128.800 |
| 4 | Yanhe 3rd | Lateral canal | 1.00 | 1.520 | 203.000 |
| 5 | Yanhe 4th | Lateral canal | 1.50 | 1.650 | 204.600 |
| 6 | Yanhe 5th | Lateral canal | 0.30 | 1.700 | 41.467 |
| II | Wujiazha | Branch canal | 1.30 | 5.000 | 808.667 |
| 7 | Wujiazha 1st | Lateral canal | 0.30 | 0.600 | 27.667 |
| 8 | Wujiazha 2nd | Lateral canal | 1.30 | 1.940 | 248.933 |
| 9 | Wujiazha 3rd | Lateral canal | 1.30 | 2.180 | 269.533 |
| 10 | Wujiazha 4th | Lateral canal | 1.20 | 1.830 | 233.333 |
| 11 | Wujiazha 5th | Lateral canal | 0.30 | 0.300 | 29.200 |
| III | Mingyong 2nd | Branch canal | 2.50 | 11.420 | 947.200 |
| 12 | Yongji | Lateral canal | 0.80 | 1.700 | 86.667 |
| 13 | Zhongnan | Lateral canal | 1.20 | 5.830 | 216.467 |
| 14 | Yonghe 1st | Lateral canal | 0.80 | 2.260 | 52.933 |
| 15 | Yonghe 2nd | Lateral canal | 1.00 | 1.840 | 147.467 |
| 16 | Yonghe 3rd | Lateral canal | 1.00 | 1.540 | 73.400 |
| 17 | Mingyong 1st | Lateral canal | 1.00 | 1.200 | 46.200 |
| 18 | Mingyong 2nd | Lateral canal | 1.00 | 2.150 | 106.267 |
| 19 | Liaoyan | Lateral canal | 1.00 | 2.370 | 146.533 |
| IV | Mingyong 3rd | Branch canal | 2.00 | 2.320 | 819.200 |
| 20 | Yongji | Branch canal | 1.30 | 2.280 | 284.933 |
| 21 | Shangya | Branch canal | 1.50 | 3.420 | 226.533 |
| 22 | Xiaya | Branch canal | 0.80 | 4.910 | 180.933 |
| 23 | Jiahe | Branch canal | 1.20 | 5.890 | 167.067 |
Table 3.
Water allocation plan of the 3rd summer-irrigation period in 2016.
| Canal | Actual Irrigation Area (hm2) | Irrigating Quota (m3/hm2) | Water Demand (m3) | Allocating Proportion (%) | Available Water (m3) |
|---|---|---|---|---|---|
| Mingyong submain canal | 2382 | 1080 | 257.23 | 100.00 | 572.53 |
| I | 798 | 1080 | 86.18 | 31.91 | 182.68 |
| II | 810 | 1080 | 87.48 | 33.42 | 191.34 |
| III | 390 | 1080 | 42.12 | 17.61 | 100.81 |
| IV | 384 | 1080 | 41.44 | 15.99 | 91.52 |
Table 4.
The parameter identification of optimal model.
| Parameter | Value |
|---|---|
| The coefficient of minimum capacity in lowest-level canal | 0.6 |
| The coefficient of maximum capacity in lowest-level canal | 1.2 |
| The coefficient of minimum capacity in second-level canal | 0.2 |
| The coefficient of maximum capacity in second-level canal | 1.2 |
| The coefficient of minimum capacity in superior canal | 0.1 |
| The coefficient of maximum capacity in superior canal | 1.2 |
| The water utilization coefficient from lateral canal to field | 0.8 |
| Reduction coefficient by canal lining | 0.5 |
| Infiltration coefficient of canal bed | 3.4 |
| Infiltration index of canal bed | 0.5 |
| The water utilization coefficient from lateral canal to field | 0.6125 |
Table 5.
The leakage loss of canals (104 m3).
| I | II | III | IV | Total | |
|---|---|---|---|---|---|
| The total leakage loss of the subordinates | 26.63 | 23.88 | 11.37 | 6.23 | 68.11 |
| The leakage loss of the second-level canal | 1.38 | 2.71 | 3.15 | 0.75 | 7.99 |
| The leakage loss of the superior canal | 2.16 | ||||
| The total leakage loss of the Minyong canal system | 78.26 |
Table 6.
The optimal net allocated water resources and the optimal and empirical effective utilization coefficients correspondingly.
Table 6.
The optimal net allocated water resources and the optimal and empirical effective utilization coefficients correspondingly.
| Net Water to Field (104 m3) | Allocated Water (104 m3) | Optimal Effective Utilization Coefficients | Empirical Effective Utilization Coefficients | |||||||
|---|---|---|---|---|---|---|---|---|---|---|
| Lateral/Sub-Branch Canal | Branch Canal | Sub-Main Canal | Lateral/Sub-Branch Canal | Branch Canal | Sub-Main Canal | Lateral/Sub-Branch Canal | Branch Canal | Sub-Main Canal | ||
| I | 87.30 | 135.76 | 137.14 | 422.93 | 0.643 | 0.990 | 0.995 | 0.613 | 0.970 | 0.989 |
| II | 89.16 | 135.33 | 138.04 | 0.659 | 0.980 | 0.613 | 0.940 | |||
| III | 40.06 | 61.45 | 64.60 | 0.652 | 0.951 | 0.613 | 0.859 | |||
| IV | 74.01 | 80.24 | 80.99 | 0.922 | 0.991 | 0.931 | 0.931 | |||
© 2018 by the authors. Licensee MDPI, Basel, Switzerland. This article is an open access article distributed under the terms and conditions of the Creative Commons Attribution (CC BY) license (http://creativecommons.org/licenses/by/4.0/).
Share and Cite
MDPI and ACS Style
Guo, S.; Zhang, F.; Zhang, C.; An, C.; Wang, S.; Guo, P. A Multi-Objective Hierarchical Model for Irrigation Scheduling in the Complex Canal System. Sustainability 2019, 11, 24. https://0-doi-org.brum.beds.ac.uk/10.3390/su11010024
AMA Style
Guo S, Zhang F, Zhang C, An C, Wang S, Guo P. A Multi-Objective Hierarchical Model for Irrigation Scheduling in the Complex Canal System. Sustainability. 2019; 11(1):24. https://0-doi-org.brum.beds.ac.uk/10.3390/su11010024
Chicago/Turabian StyleGuo, Shanshan, Fan Zhang, Chenglong Zhang, Chunjiang An, Sufen Wang, and Ping Guo. 2019. "A Multi-Objective Hierarchical Model for Irrigation Scheduling in the Complex Canal System" Sustainability 11, no. 1: 24. https://0-doi-org.brum.beds.ac.uk/10.3390/su11010024
Note that from the first issue of 2016, this journal uses article numbers instead of page numbers. See further details here.