Assessment of Physicochemical and Nutritional Characteristics of Waste Mushroom Substrate Biochar under Various Pyrolysis Temperatures and Times


Abstract
:1. Introduction
2. Materials and Methods
2.1. Feedstock Collection
2.2. Preparation of Biochar
2.3. Determination of Biochar Properties
2.4. Fourier Transform Infrared Spectroscopy Analysis
2.5. Statistical Analysis
3. Results
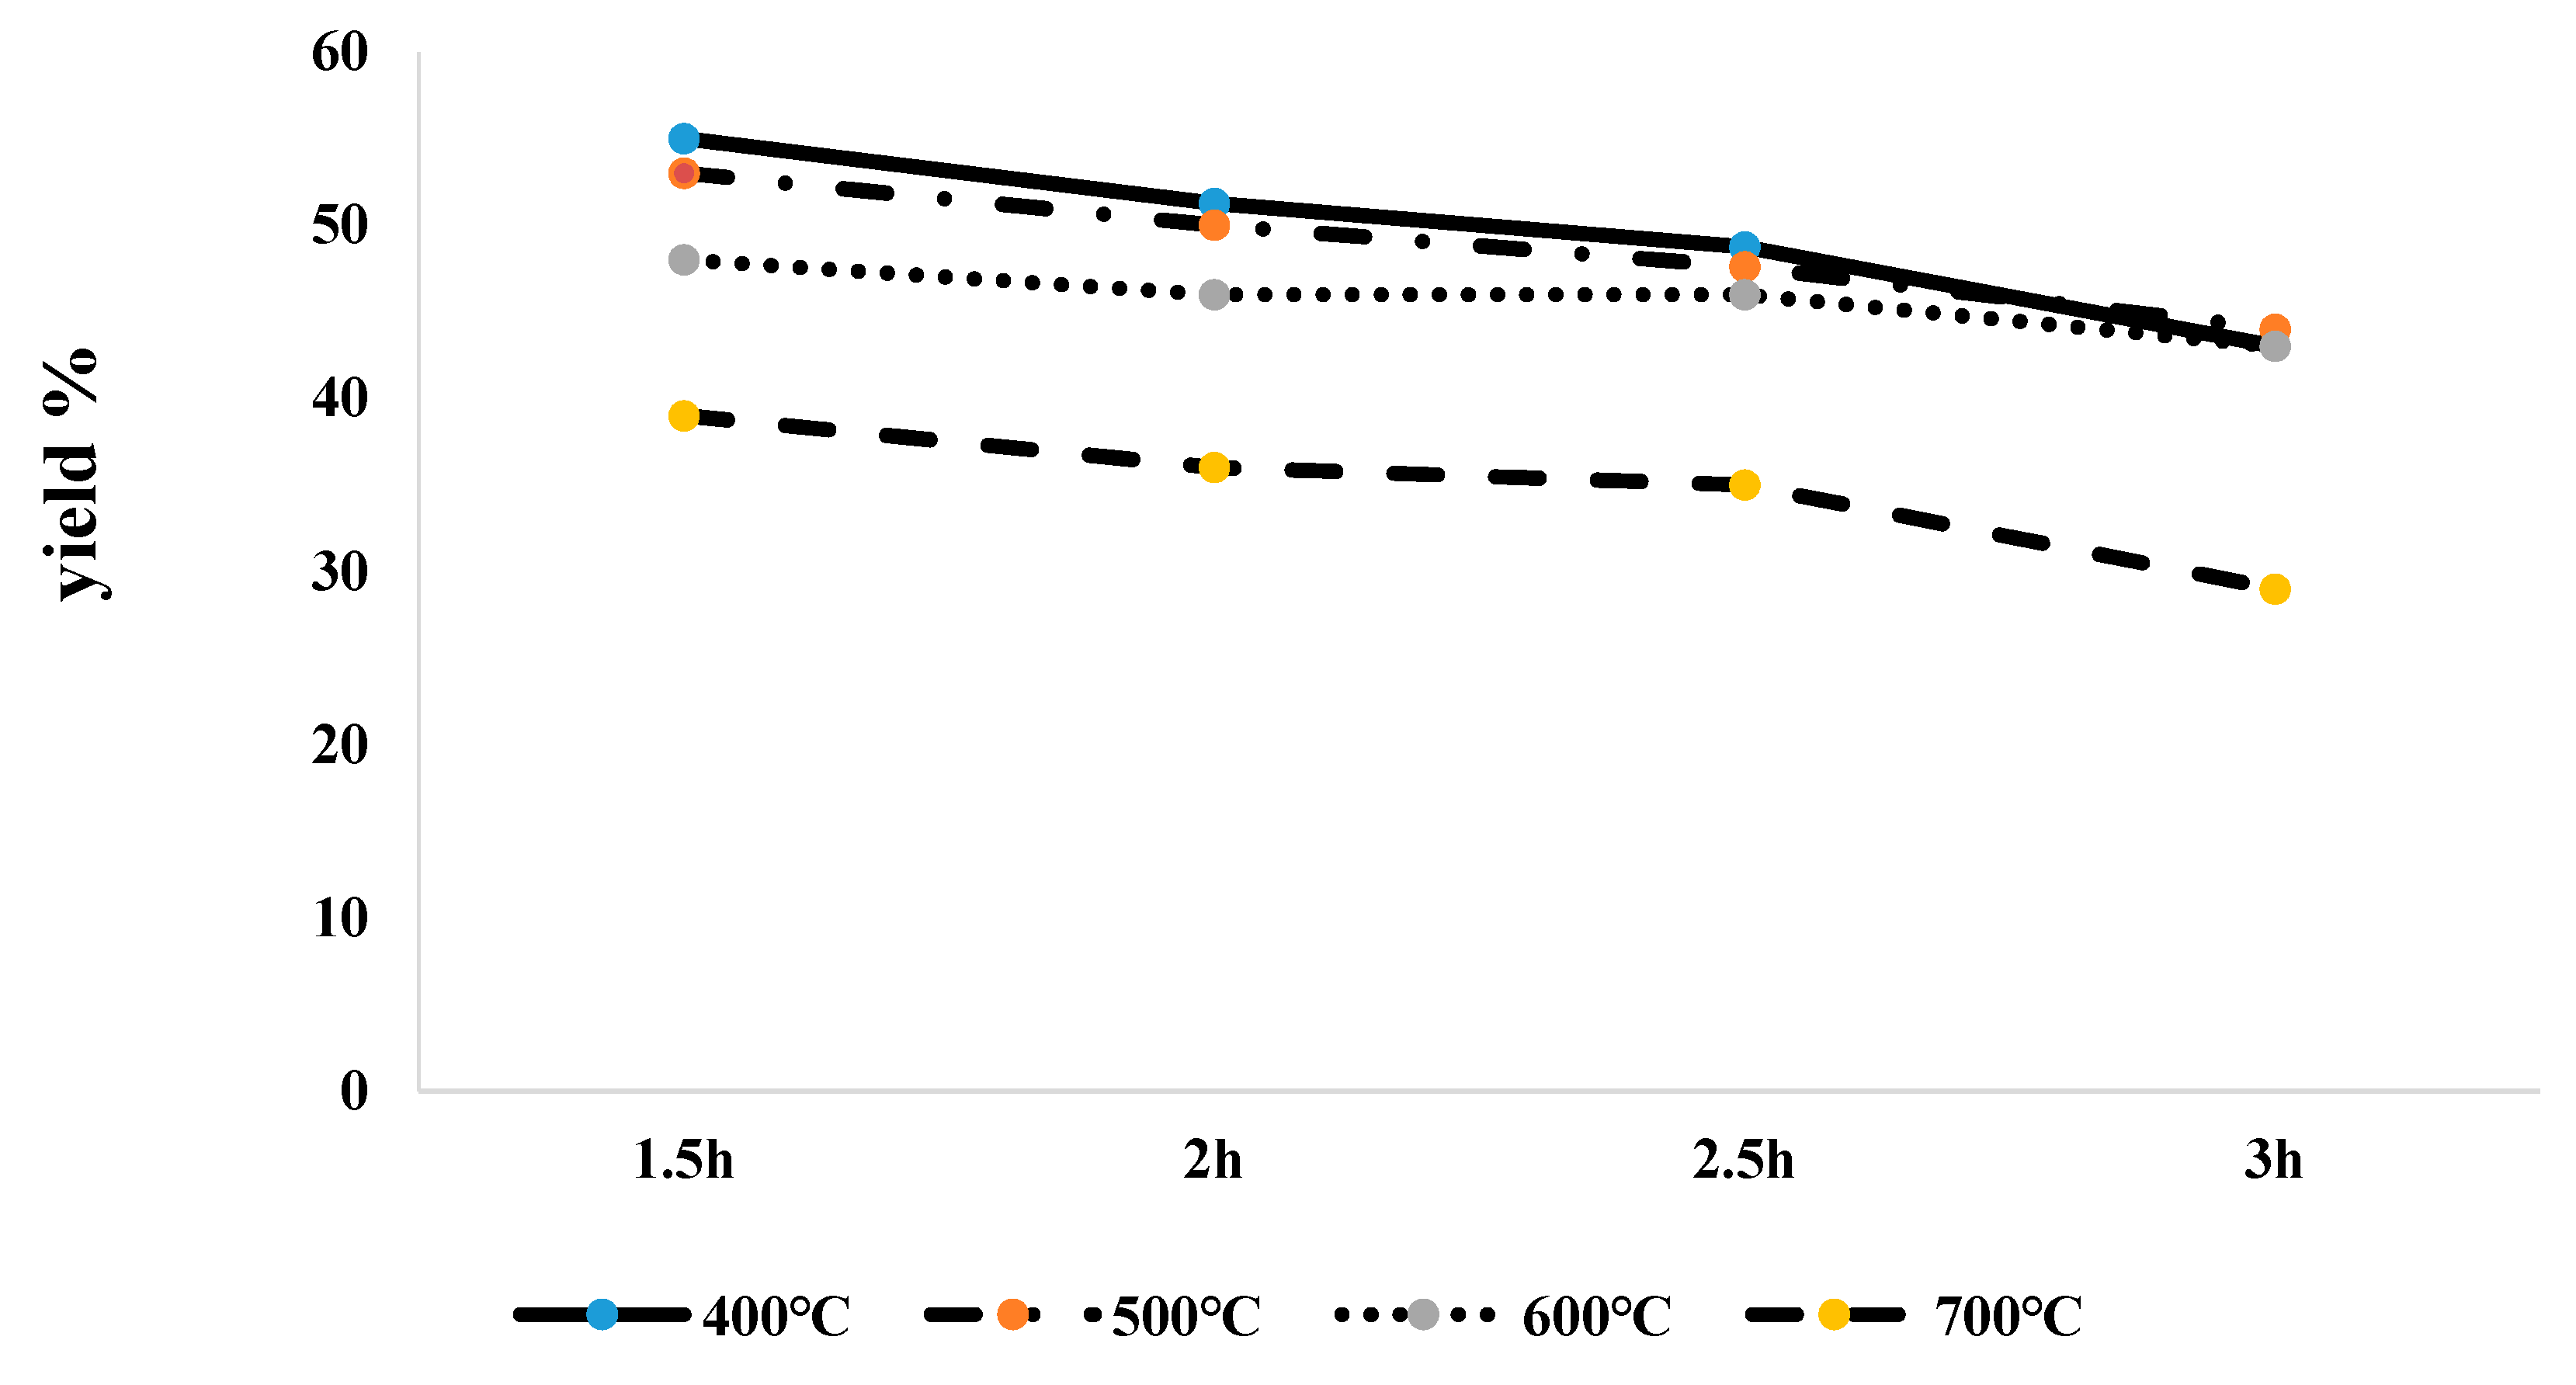
3.1. Biochar Yield
3.2. pH and Ash Contents of WMS Biochar
3.3. CEC and BET Surface Area of WMS Biochar
3.4. C, N Contents of WMS Biochar
3.5. Nutritional Analysis
3.6. Heavy Metal Analysis
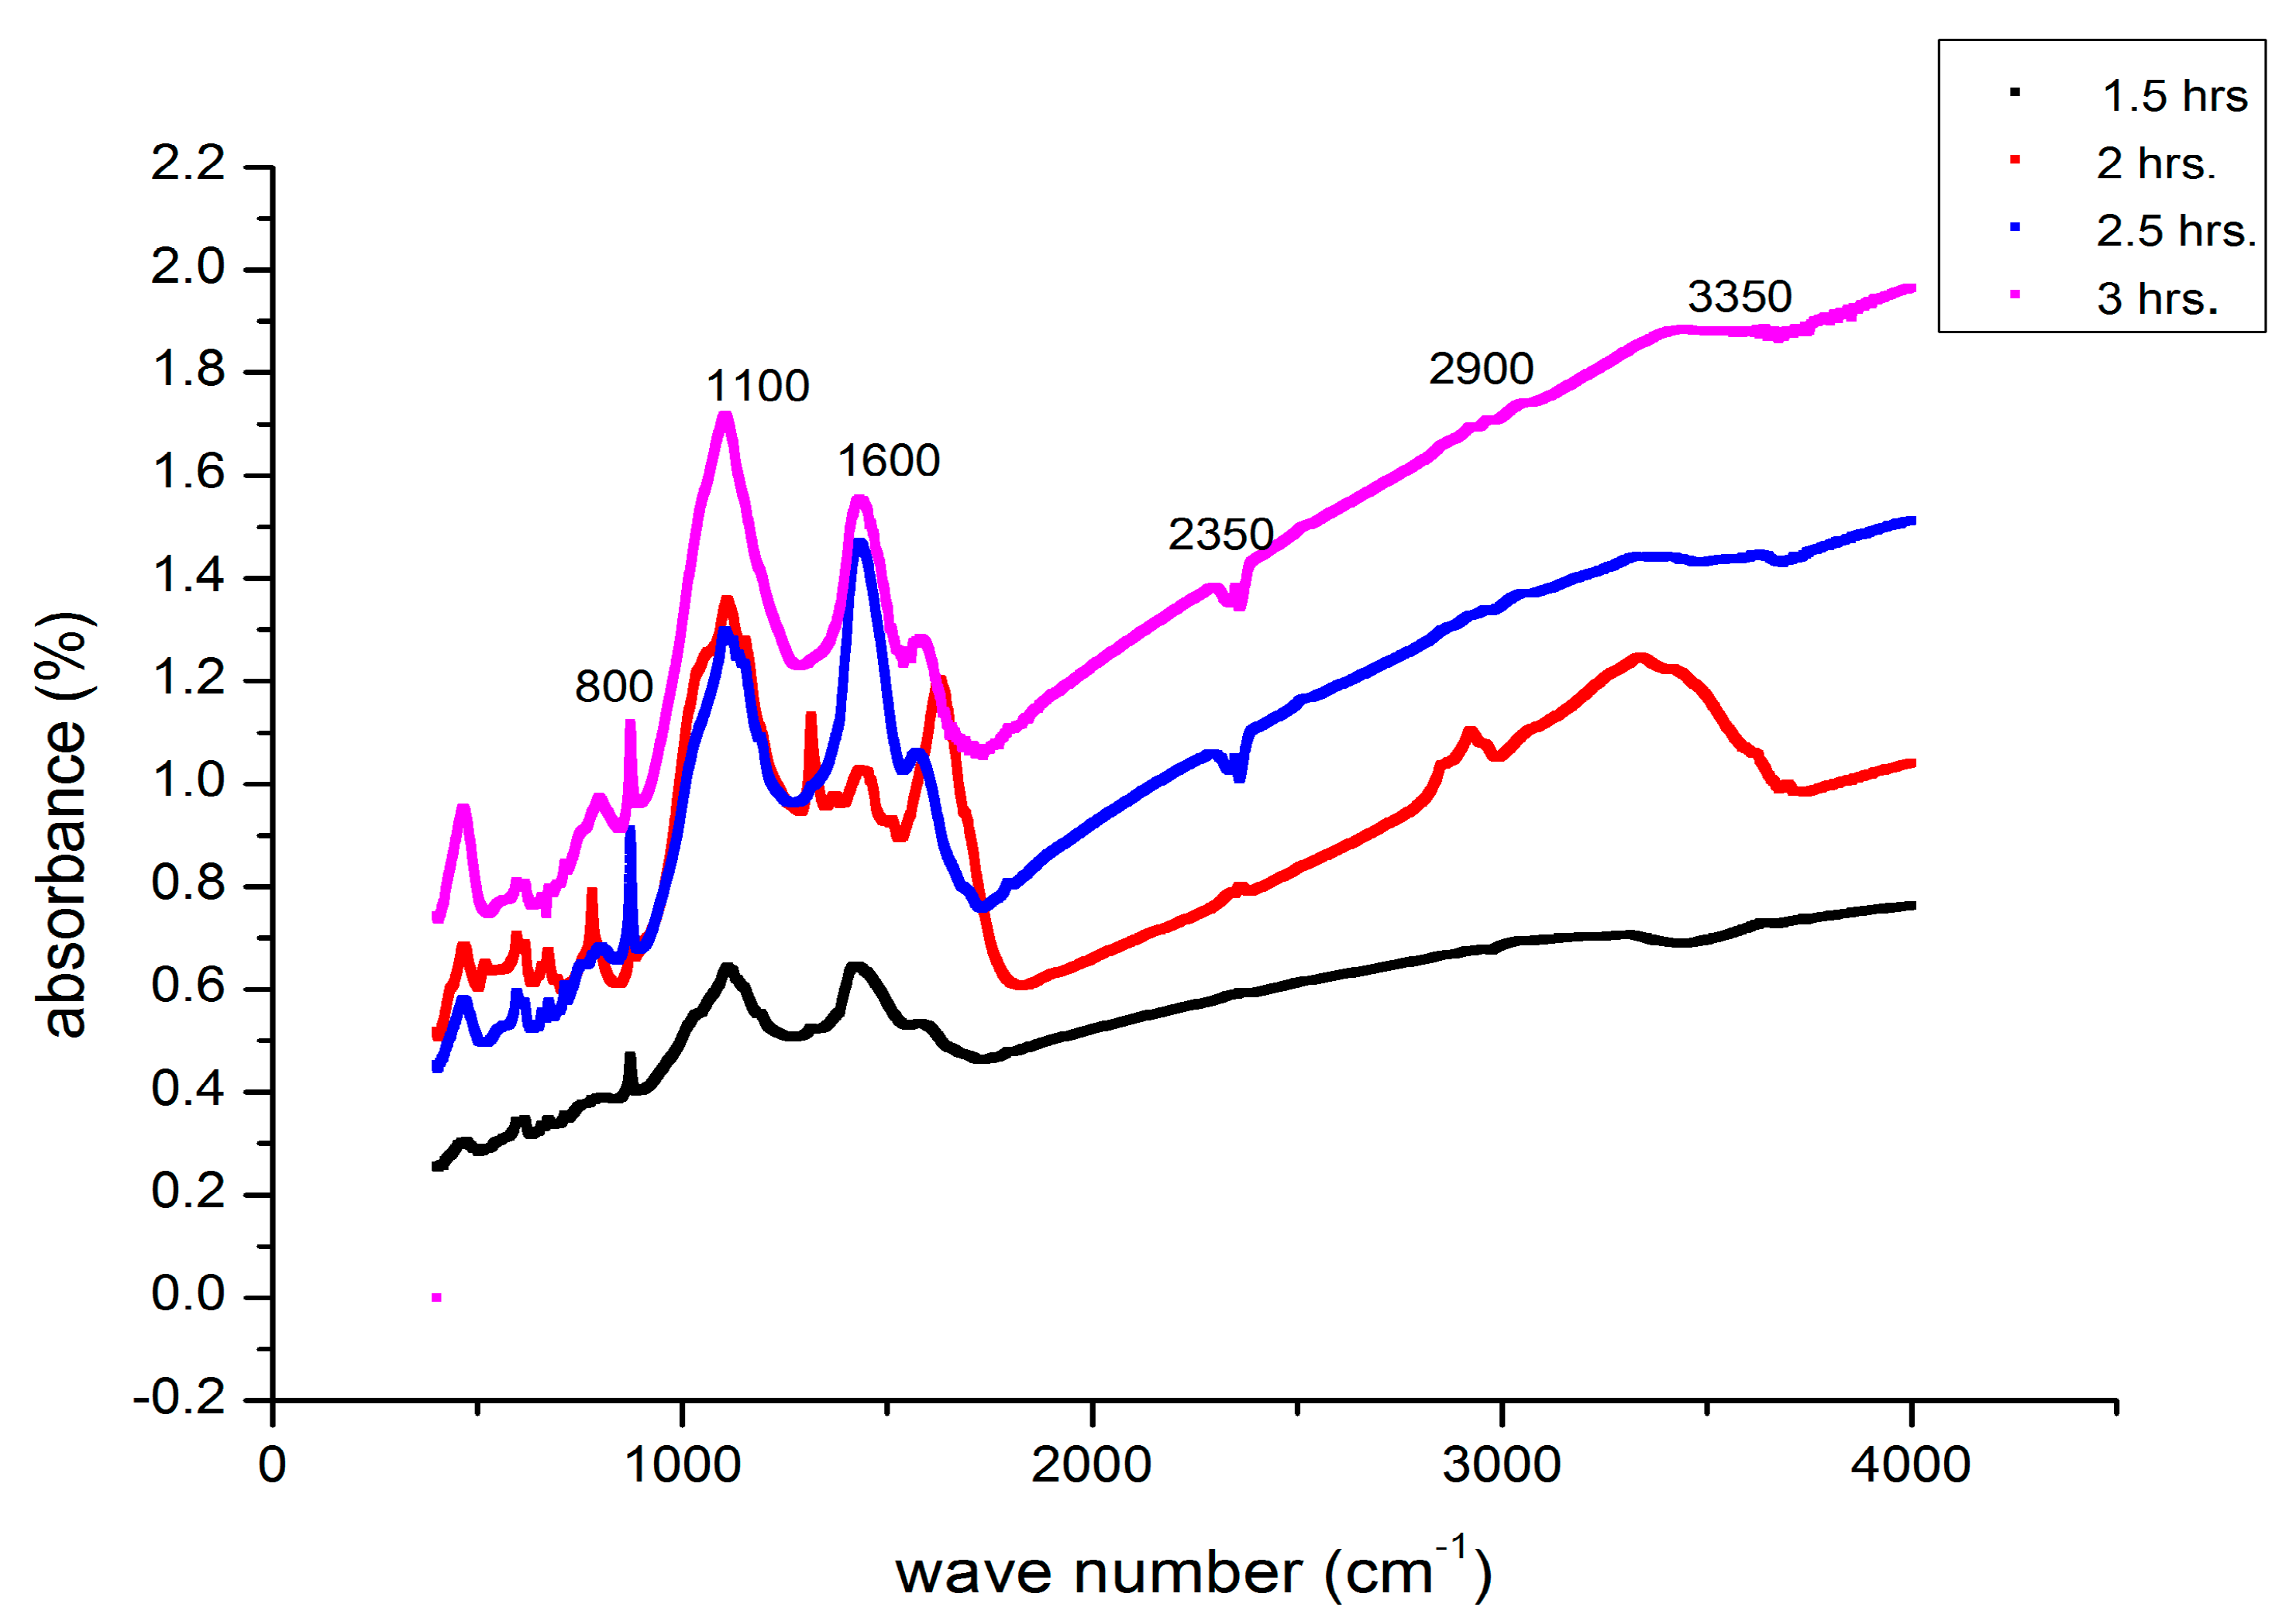
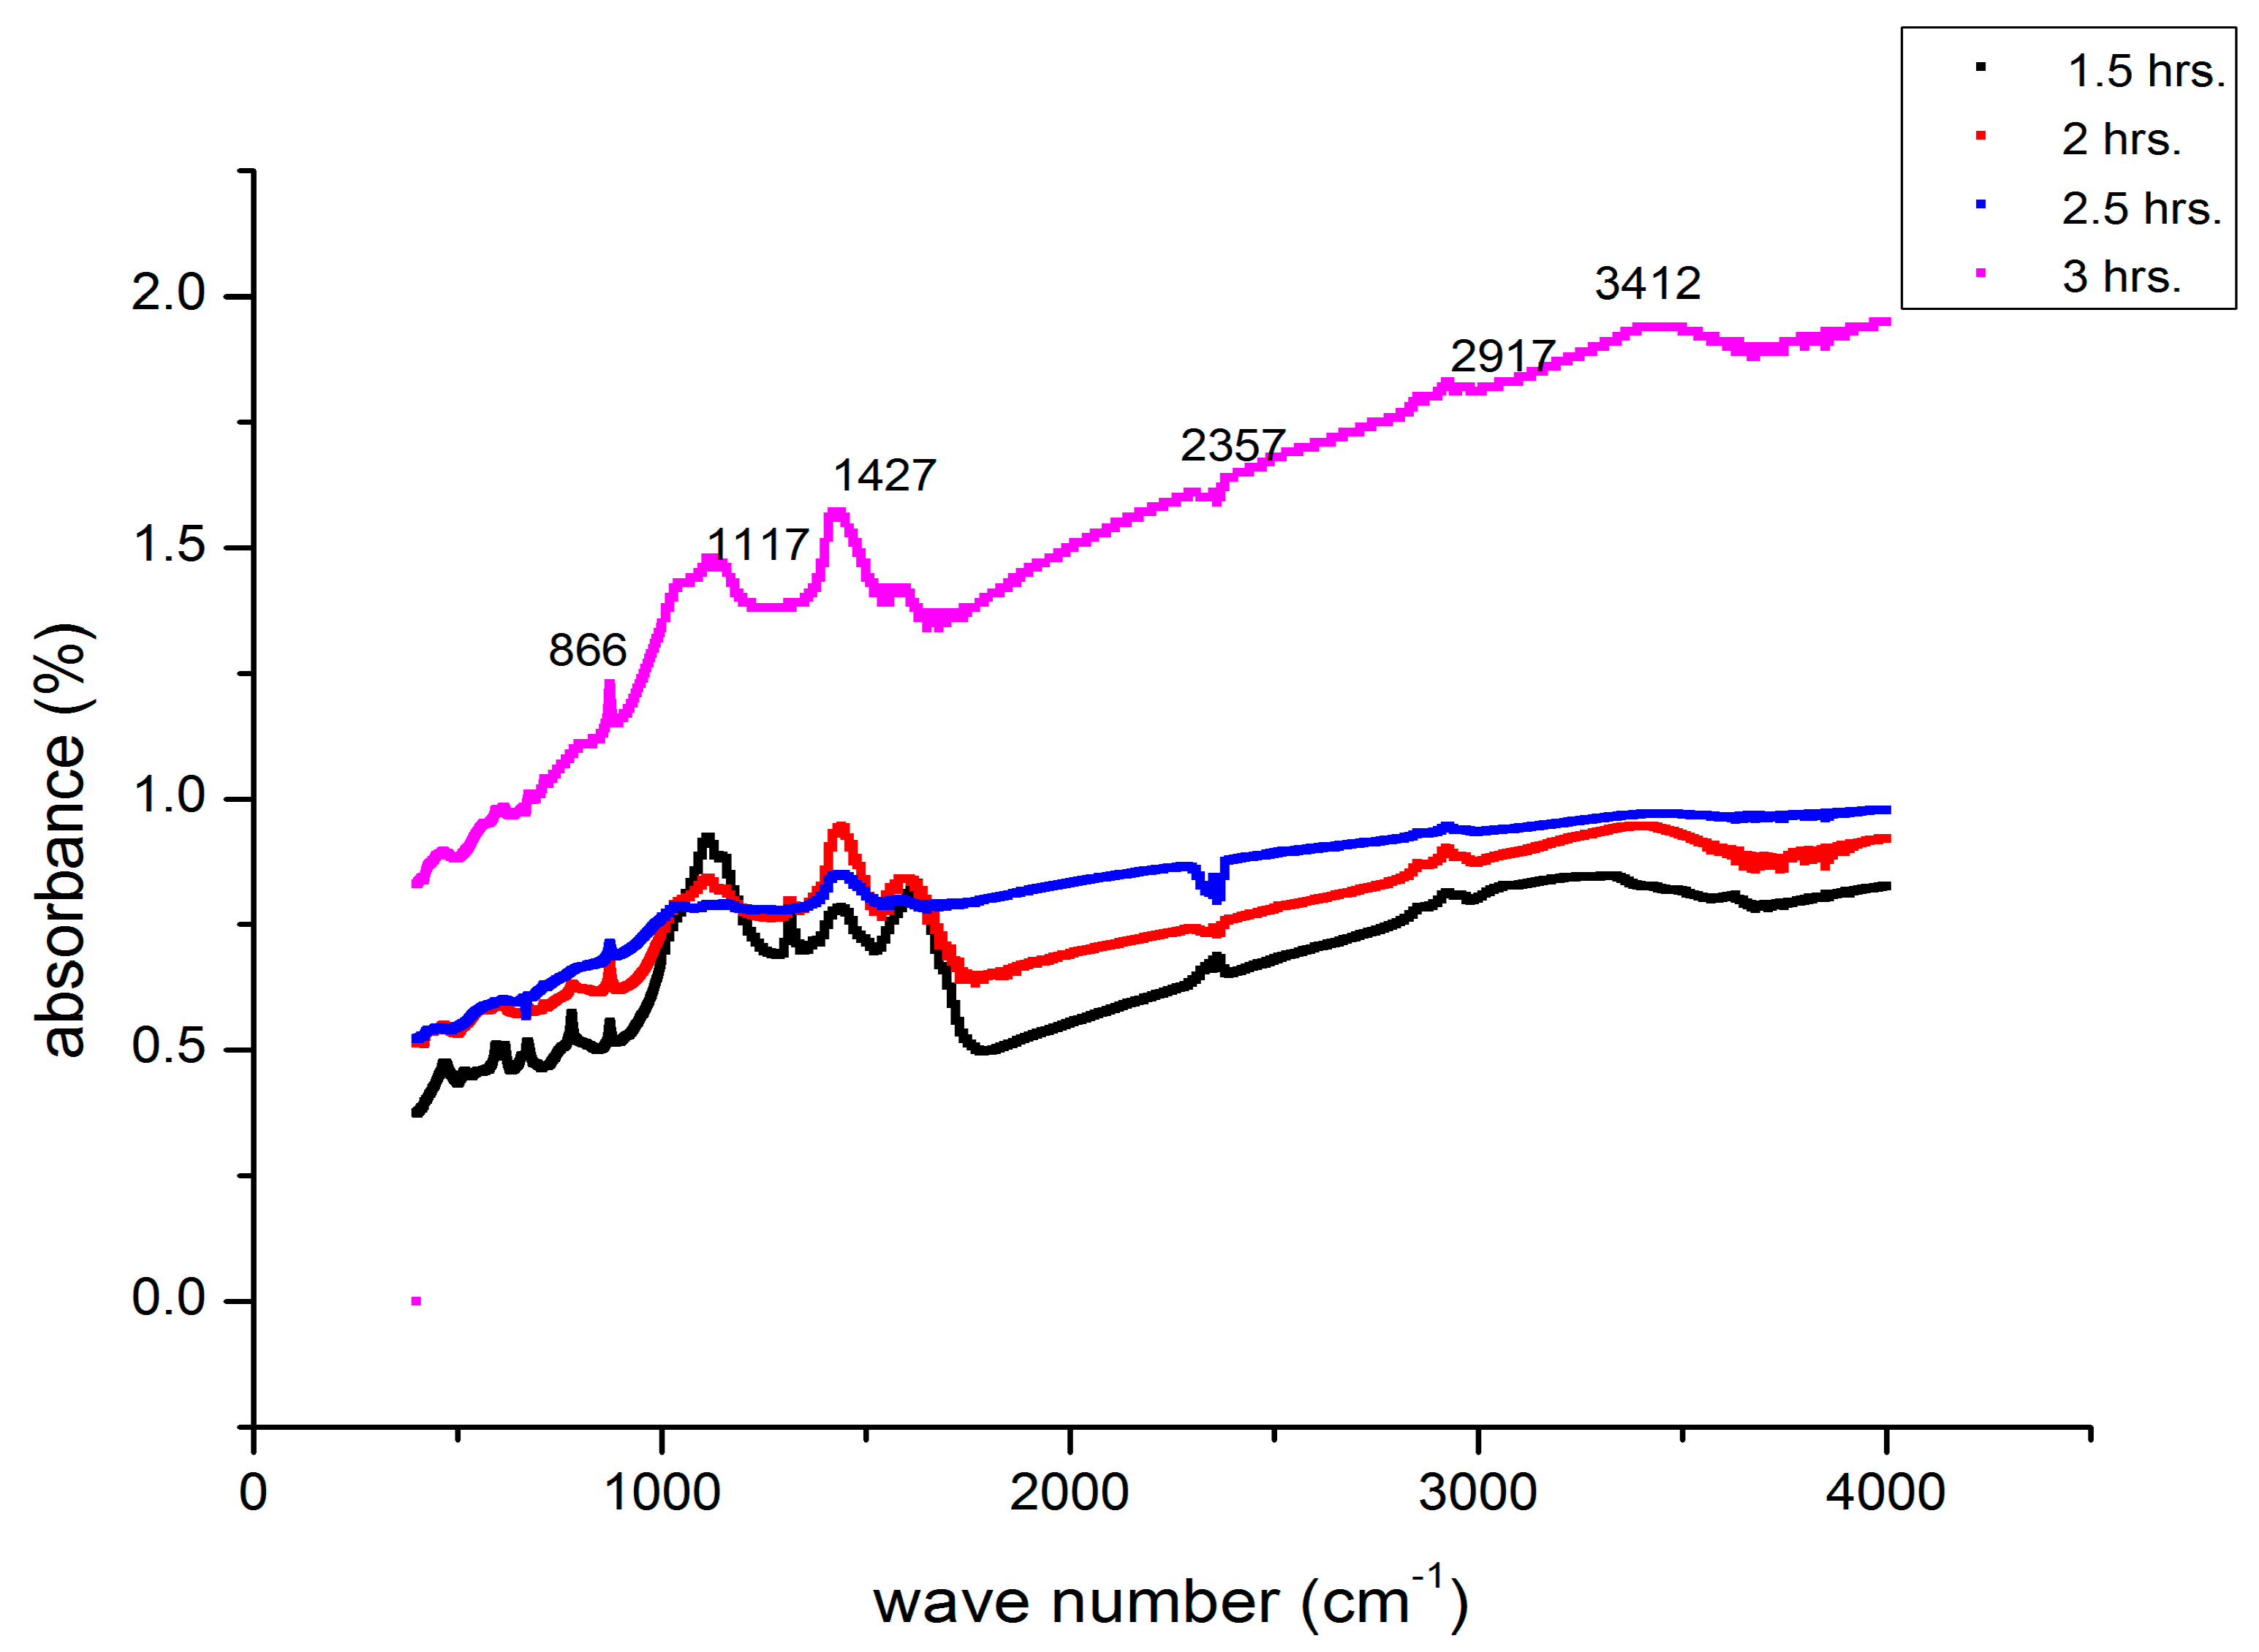
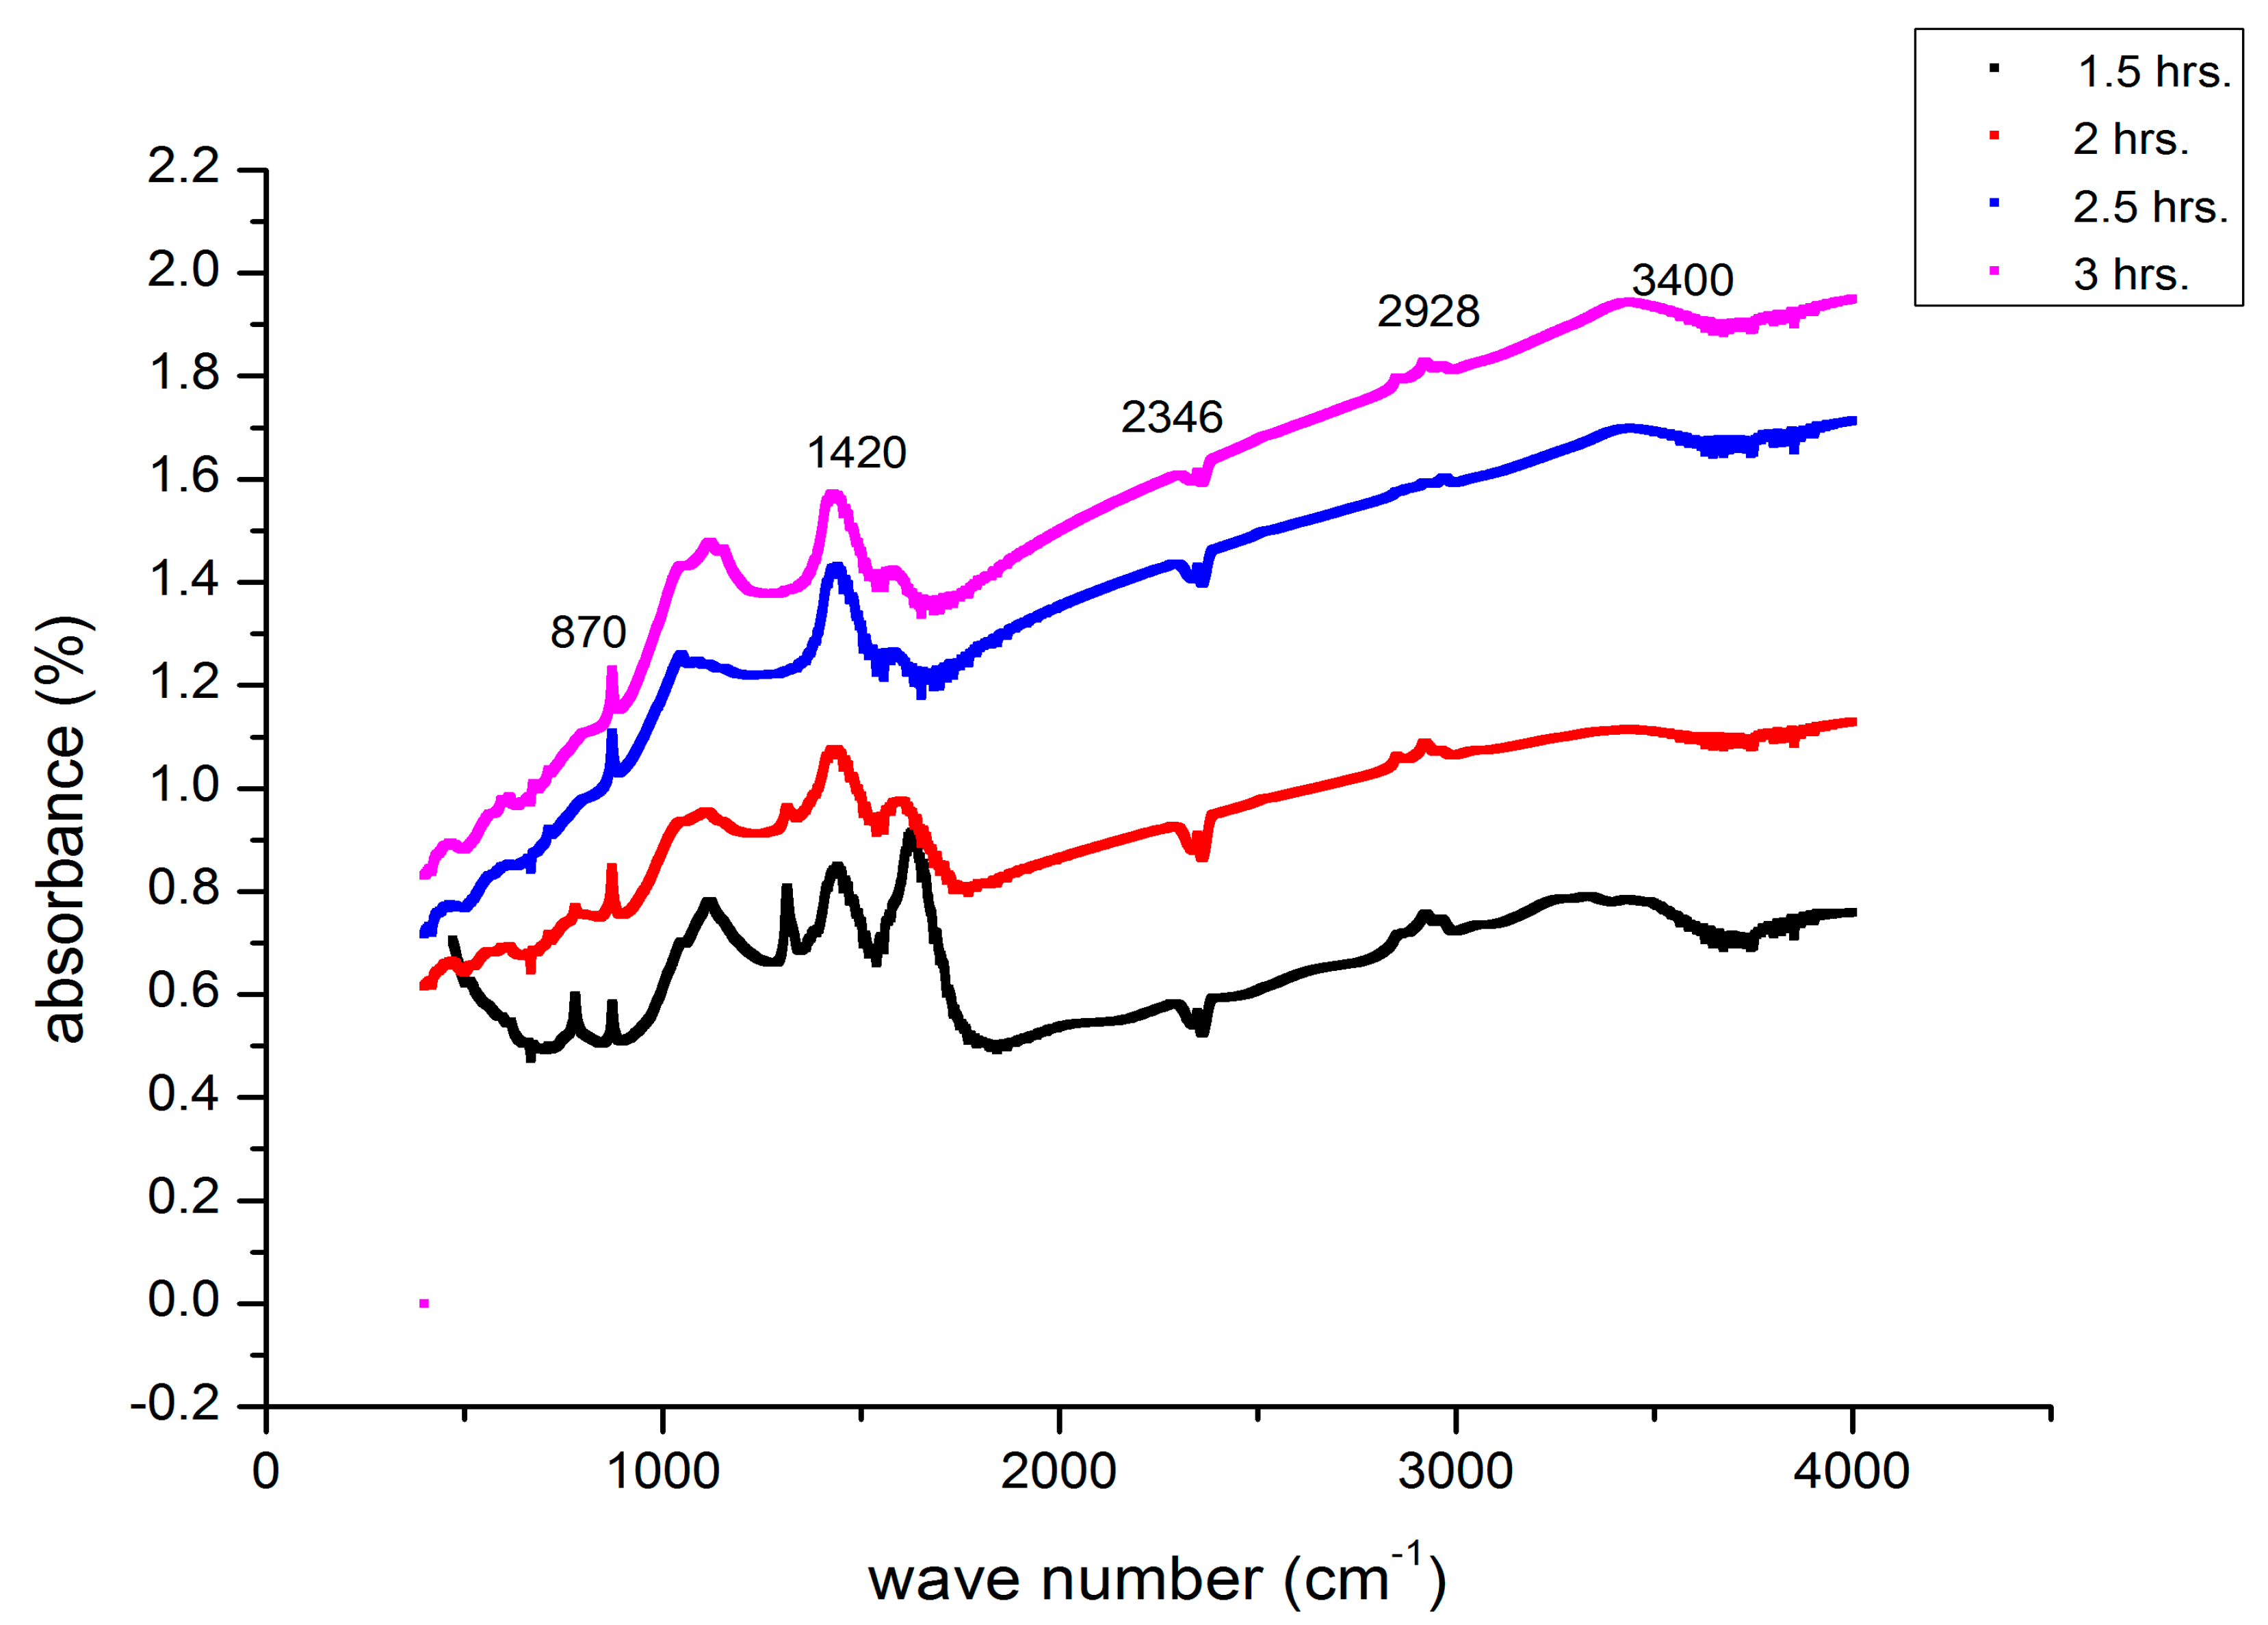
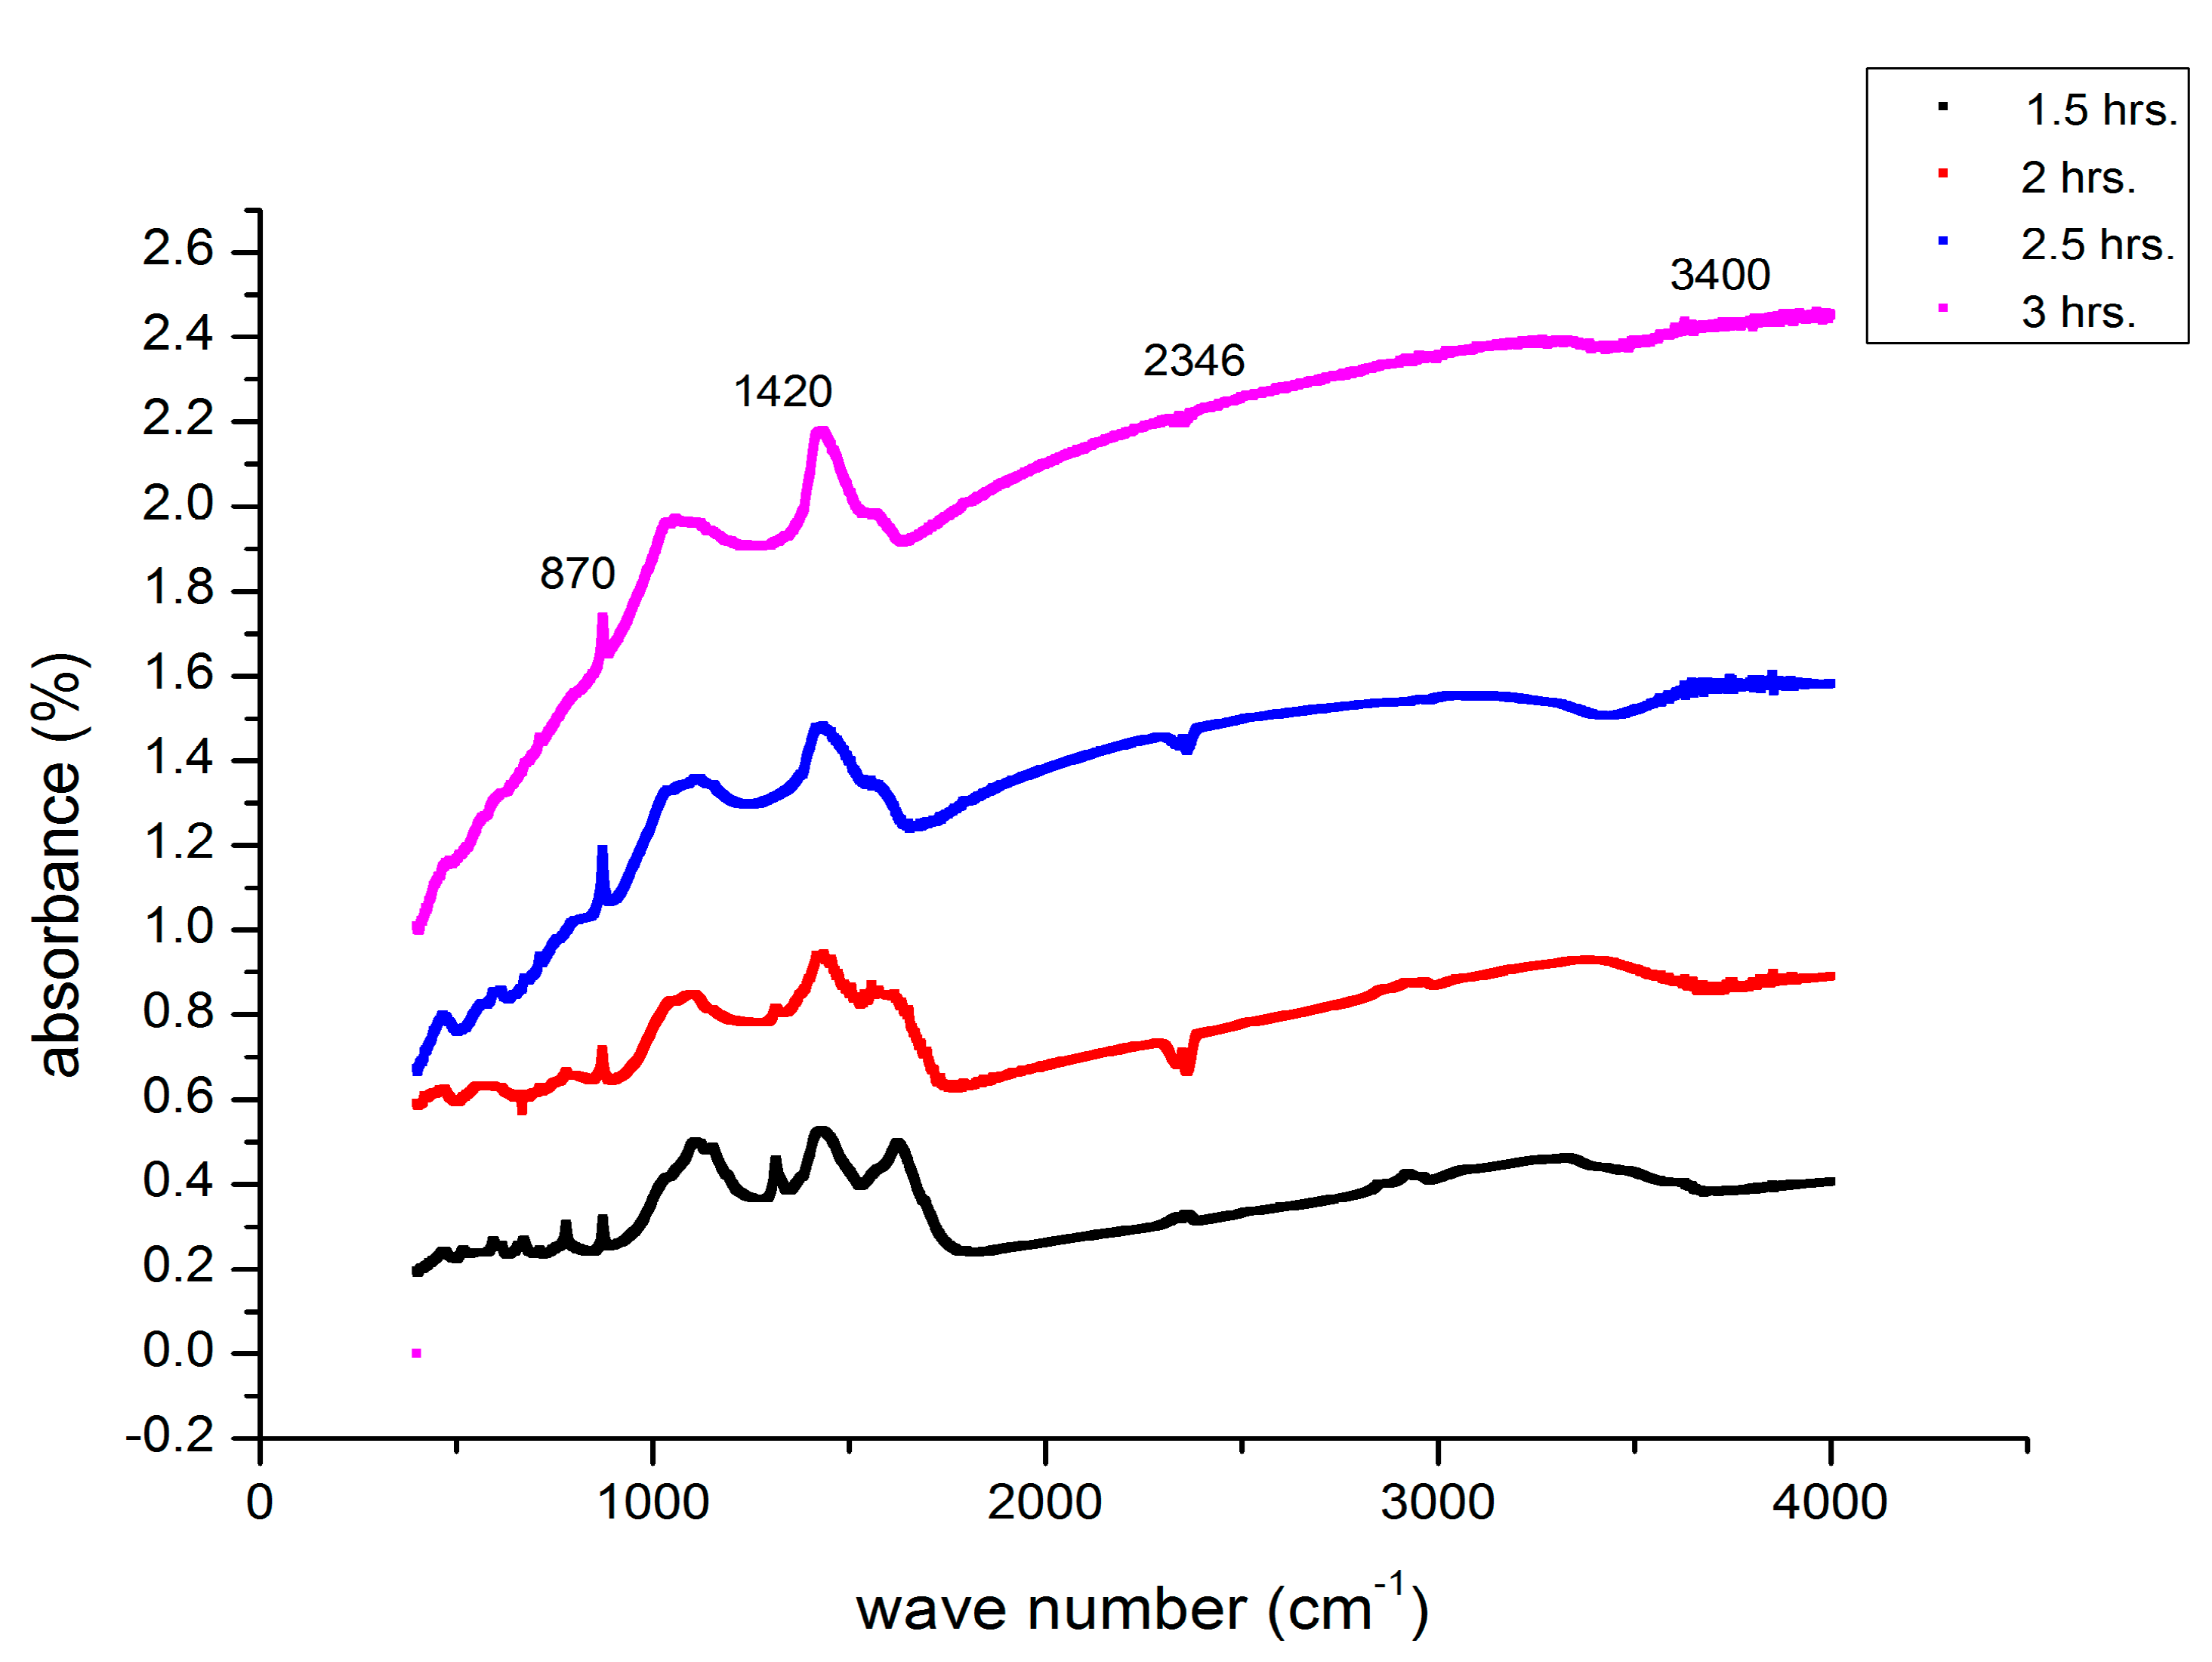
3.7. FTIR Analysis
4. Discussion
4.1. Physicochemical Properties of WMS Biochar under Various Pyrolysis Temperatures and Times
4.2. Nutritional Properties of WMS Biochar under Various Pyrolysis Temperatures and Times
5. Conclusions
Author Contributions
Funding
Conflicts of Interest
References
- Al-Wabel, M.I.; Al-Omran, A.; El-Naggar, A.H.; Nadeem, M.; Usman, A.R.A. Pyrolysis temperature induced changes in characteristics and chemical composition of biochar produced from conocarpus wastes. Bioresour. Technol. 2013, 131, 374–379. [Google Scholar] [CrossRef]
- Zhao, R.; Coles, N.; Wu, J. Carbon mineralization following additions of fresh and aged biochar to an infertile soil. Catena 2015, 125, 183–189. [Google Scholar] [CrossRef]
- Atkinson, C.J.; Fitzgerald, J.D.; Hipps, N.A. Potential mechanisms for achieving agricultural benefits from biochar application to temperate soils: A review. Plant Soil 2010, 337, 1–18. [Google Scholar] [CrossRef]
- Angin, D. Effect of pyrolysis temperature and heating rate on biochar obtained from pyrolysis of safflower seed press cake. Bioresour. Technol. 2013, 128, 593–597. [Google Scholar] [CrossRef] [PubMed]
- Chang, K.L.; Chen, X.M.; Sun, J.; Liu, J.Y.; Sun, S.Y.; Yang, Z.Y.; Wang, Y. Spent mushroom substrate biochar as a potential amendment in pig manure and rice straw composting processes. Environ. Technol. 2017, 38, 1765–1769. [Google Scholar] [CrossRef]
- Glaser, B.; Lehmann, J.; Zech, W. Ameliorating physical and chemical properties of highly weathered soils in the tropics with charcoal—A review. Biol. Fertil. Soils 2002, 35, 219–230. [Google Scholar] [CrossRef]
- Joseph, S.D.; Camps-Arbestain, M.; Lin, Y.; Munroe, P.; Chia, C.H.; Hook, J.; Van Zwieten, L.; Kimber, S.; Cowie, A.; Singh, B.P.; et al. An investigation into the reactions of biochar in soil. Soil Res. 2010, 48, 501–515. [Google Scholar] [CrossRef] [Green Version]
- Zhang, H.; Chen, C.; Gray, E.M.; Boyd, S.E.; Yang, H.; Zhang, D. Roles of biochar in improving phosphorus availability in soils: A phosphate adsorbent and a source of available phosphorus. Geoderma 2016, 276, 1–6. [Google Scholar] [CrossRef]
- Sarfraz, R.; Shakoor, A.; Abdullah, M.; Arooj, A.; Hussain, A.; Xing, S. Impact of integrated application of biochar and nitrogen fertilizers on maize growth and nitrogen recovery in alkaline calcareous soil. Soil Sci. Plant Nutr. 2017, 63, 488–498. [Google Scholar] [CrossRef]
- Li, H.; Dong, X.; da Silva, E.B.; de Oliveira, L.M.; Chen, Y.; Ma, L.Q. Mechanisms of metal sorption by biochars: Biochar characteristics and modifications. Chemosphere 2017, 178, 466–478. [Google Scholar] [CrossRef]
- Luo, S.; Wang, S.; Tian, L.; Li, S.; Li, X.; Shen, Y.; Tian, C. Long-term biochar application influences soil microbial community and its potential roles in semiarid farmland. Appl. Soil Ecol. 2017, 117–118, 10–15. [Google Scholar] [CrossRef]
- Sun, L.; Li, L.; Chen, Z.; Wang, J.; Xiong, Z. Combined effects of nitrogen deposition and biochar application on emissions of N2O, CO2 and NH3 from agricultural and forest soils. Soil Sci. Plant Nutr. 2014, 60, 254–265. [Google Scholar] [CrossRef]
- Keiluweit, M.; Nico, P.S.; Johnson, M.; Kleber, M. Dynamic molecular structure of plant biomass-derived black carbon (biochar). Environ. Sci. Technol. 2010, 44, 1247–1253. [Google Scholar] [CrossRef] [PubMed]
- Wiedner, K.; Rumpel, C.; Steiner, C.; Pozzi, A.; Maas, R.; Glaser, B. Chemical evaluation of chars produced by thermochemical conversion (gasification, pyrolysis and hydrothermal carbonization) of agro-industrial biomass on a commercial scale. Biomass Bioenergy 2013, 59, 264–278. [Google Scholar] [CrossRef]
- Tarin, M.W.K.; Fan, L.; Tayyab, M.; Sarfraz, R.; Chen, L.; He, T.; Rong, J.; Chen, L.; Zheng, Y. Effects of bamboo biochar amendment on the growth and physiological characteristics of Fokienia hodginsii. Appl. Ecol. Env. Res. 2018, 16, 8055–8074. [Google Scholar]
- Sun, J.; He, F.; Pan, Y.; Zhang, Z. Effects of pyrolysis temperature and residence time on physicochemical properties of different biochar types. Acta Agric. Scand. Sect. B Soil Plant Sci. 2017, 67, 12–22. [Google Scholar] [CrossRef]
- Suman, S.; Gautam, S. Pyrolysis of coconut husk biomass: Analysis of its biochar properties. Energy Sources Part A Recovery Util. Environ. Effects 2017, 39, 761–767. [Google Scholar] [CrossRef]
- Brewer, C.E. Biochar characterization and engineering. Doctorl Thesis, Iowa State University, Amesn, Iowa, USA. Grad. Teses Diss. 2012, 12284. [Google Scholar]
- Cantrell, K.B.; Hunt, P.G.; Uchimiya, M.; Novak, J.M.; Ro, K.S. Impact of pyrolysis temperature and manure source on physicochemical characteristics of biochar. Bioresour. Technol. 2012, 107, 419–428. [Google Scholar] [CrossRef]
- Higashikawa, F.S.; Silva, C.A.; Bettiol, W. Chemical and physical properties of organic residues. Rev. Bras. Ciência do Solo 2010, 34, 1742–1752. [Google Scholar] [CrossRef] [Green Version]
- Domingues, R.R.; Trugilho, P.F.; Silva, C.A.; De Melo, I.C.N.A.; Melo, L.C.A.; Magriotis, Z.M.; Sánchez-Monedero, M.A. Properties of biochar derived from wood and high-nutrient biomasses with the aim of agronomic and environmental benefits. PLoS ONE 2017, 12, e0176884. [Google Scholar] [CrossRef]
- McLean, E.O. Soil pH and lime requirement. In Methods of Soil Analysis. Part 2. Chemical and Microbiological Properties; American Society of Agronomy, Soil Science Society of America: Madison, WI, USA, 1982; ISBN 978-0-89118-204-7. [Google Scholar]
- Gaskin, J.W.; Speir, R.A.; Harris, K.; Das, K.C.; Lee, R.D.; Morris, L.A.; Fisher, D.S. Effect of peanut hull and pine chip biochar on soil nutrients, corn nutrient status, and yield. Agron. J. 2010, 102, 623–633. [Google Scholar] [CrossRef]
- Feola Conz, R.; Abbruzzini, T.F.; de Andrade, C.A.; P. Milori, D.M.B.; E. P. Cerri, C. Effect of Pyrolysis Temperature and Feedstock Type on Agricultural Properties and Stability of Biochars. Agric. Sci. 2017, 8, 914–933. [Google Scholar] [CrossRef]
- Yao, Y.; Gao, B.; Zhang, M.; Inyang, M.; Zimmerman, A.R. Effect of biochar amendment on sorption and leaching of nitrate, ammonium, and phosphate in a sandy soil. Chemosphere 2012, 89, 1467–1471. [Google Scholar] [CrossRef] [PubMed]
- Jindarom, C.; Meeyoo, V.; Kitiyanan, B.; Rirksomboon, T.; Rangsunvigit, P. Surface characterization and dye adsorptive capacities of char obtained from pyrolysis/gasification of sewage sludge. Chem. Eng. J. 2007, 133, 239–246. [Google Scholar] [CrossRef]
- Inyang, M.; Dickenson, E. The potential role of biochar in the removal of organic and microbial contaminants from potable and reuse water: A review. Chemosphere 2015, 134, 232–240. [Google Scholar] [CrossRef]
- Yuan, J.H.; Xu, R.K.; Zhang, H. The forms of alkalis in the biochar produced from crop residues at different temperatures. Bioresour. Technol. 2011, 102, 3488–3497. [Google Scholar] [CrossRef]
- Mukherjee, A.; Zimmerman, A.R. Organic carbon and nutrient release from a range of laboratory-produced biochars and biochar-soil mixtures. Geoderma 2013, 193–194, 122–130. [Google Scholar] [CrossRef]
- Song, W.; Guo, M. Quality variations of poultry litter biochar generated at different pyrolysis temperatures. J. Anal. Appl. Pyrolysis 2012, 94, 138–145. [Google Scholar] [CrossRef]
- Melo, L.C.A.; Coscione, A.R.; Abreu, C.A.; Puga, A.P.; Camargo, O.A. Influence of pyrolysis temperature on cadmium and zinc sorption capacity of sugar cane straw-derived biochar. BioResources 2013, 8, 4992–5004. [Google Scholar] [CrossRef]
- Houben, D.; Evrard, L.; Sonnet, P. Mobility, bioavailability and pH-dependent leaching of cadmium, zinc and lead in a contaminated soil amended with biochar. Chemosphere 2013, 92, 1450–1457. [Google Scholar] [CrossRef]
- Singh, B.P.; Joseph, S. The mean residence time of biochar-mineral complexes in soil. In Proceedings of the Asia Pacific Biochar Conference 2011, Kyoto, Japan, 15–18 September 2011; Volume 2119. [Google Scholar]
- Kloss, S.; Zehetner, F.; Dellantonio, A.; Hamid, R.; Ottner, F.; Liedtke, V.; Schwanninger, M.; Gerzabek, M.H.; Soja, G. Characterization of Slow Pyrolysis Biochars: Effects of Feedstocks and Pyrolysis Temperature on Biochar Properties. J. Environ. Qual. 2012, 41, 990–1000. [Google Scholar] [CrossRef] [PubMed]
- Novak, J.; Lima, I.; Xing, B.; Gaskin, J.W.; Steiner, C.; Das, K.C.; Ahmedna, M.; Rehrah, D.; Watts, D.W.; Busscher, W.J.; et al. Characterization of designer biochar produced at different temperatures and their effects on a loamy sand. Ann. Environ. Sci. 2009, 3, 195–206. [Google Scholar]
- Uchimiya, M.; Hiradate, S. Pyrolysis temperature-dependent changes in dissolved phosphorus speciation of plant and manure biochars. J. Agric. Food Chem. 2014, 62, 1802–1809. [Google Scholar] [CrossRef] [PubMed]
- Chen, F.S.; Yavitt, J.; Hu, X.F. Phosphorus enrichment helps increase soil carbon mineralization in vegetation along an urban-to-rural gradient, Nanchang, China. Appl. Soil Ecol. 2014, 75, 181–188. [Google Scholar] [CrossRef]
- Bruun, S.; Harmer, S.L.; Bekiaris, G.; Christel, W.; Zuin, L.; Hu, Y.; Jensen, L.S.; Lombi, E. The effect of different pyrolysis temperatures on the speciation and availability in soil of P in biochar produced from the solid fraction of manure. Chemosphere 2017, 169, 377–386. [Google Scholar] [CrossRef] [PubMed]
- Zhang, J.; Liu, J.; Liu, R. Effects of pyrolysis temperature and heating time on biochar obtained from the pyrolysis of straw and lignosulfonate. Bioresour. Technol. 2015, 176, 288–291. [Google Scholar] [CrossRef]
- Zhang, H.; Voroney, R.P.; Price, G.W. Effects of temperature and processing conditions on biochar chemical properties and their influence on soil C and N transformations. Soil Biol. Biochem. 2015, 83, 19–28. [Google Scholar] [CrossRef]
- Naeem, M.A.; Khalid, M.; Arshad, M.; Ahmad, R. Yield and nutrient composition of biochar produced from different feedstocks at varying pyrolytic temperatures. Pak. J. Agric. Sci. 2014, 51, 75–82. [Google Scholar]
- Hossain, M.K.; Strezov Vladimir, V.; Chan, K.Y.; Ziolkowski, A.; Nelson, P.F. Influence of pyrolysis temperature on production and nutrient properties of wastewater sludge biochar. J. Environ. Manag. 2011, 92, 223–228. [Google Scholar] [CrossRef]
- Zhang, H.; Chen, C.; Gray, E.M.; Boyd, S.E. Effect of feedstock and pyrolysis temperature on properties of biochar governing end use efficacy. Biomass Bioenergy 2017, 105, 136–146. [Google Scholar] [CrossRef]
- Augustenborg, C.A.; Hepp, S.; Kammann, C.; Hagan, D.; Schmidt, O.; Müller, C. Biochar and Earthworm Effects on Soil Nitrous Oxide and Carbon Dioxide Emissions. J. Environ. Qual. 2012, 41, 1203–1209. [Google Scholar] [CrossRef] [PubMed]
- Chintala, R.; Schumacher, T.E.; Mcdonald, L.M.; Clay, D.E.; Malo, D.D.; Papiernik, S.K.; Clay, S.A.; Julson, J.L. Phosphorus sorption and availability from biochars and soil/biochar mixtures. Clean Soil Air Water 2014, 42, 626–634. [Google Scholar] [CrossRef]
- Christel, W.; Bruun, S.; Magid, J.; Jensen, L.S. Phosphorus availability from the solid fraction of pig slurry is altered by composting or thermal treatment. Bioresour. Technol. 2014, 169, 543–551. [Google Scholar] [CrossRef] [PubMed]
- Christel, W.; Zhu, K.; Hoefer, C.; Kreuzeder, A.; Santner, J.; Bruun, S.; Magid, J.; Jensen, L.S. Spatiotemporal dynamics of phosphorus release, oxygen consumption and greenhouse gas emissions after localised soil amendment with organic fertilisers. Sci. Total Environ. 2016, 554, 119–129. [Google Scholar] [CrossRef] [PubMed] [Green Version]


| Property | Value/Unit | Property | Value/Unit | Property | Value/Unit |
|---|---|---|---|---|---|
| pH | 6.34 | N | 2.18% | Cr | 5.581 (mg kg−1) |
| CEC | 12 (cmol kg−1) | Ca | 33.48 (g kg−1) | Cu | 12.64 (mg kg−1) |
| Total P | 3.72 (g kg−1) | Mg | 6.57 (g kg−1) | Zn | 96.58 (mg kg−1) |
| Total K | 0.68 % | Pb | 25.26 (mg kg−1) | Tl | 0.076 (mg kg−1) |
| C % | 35.69% | Ni | 5.36 (mg kg−1) | Mn | 1108.90 (mg kg−1) |
| -- | -- | -- | -- | Cd | 0.40 (mg kg−1) |
| Temperature (°C) | Ash (%) | pH | CEC (cmol kg−1) | Surface Area (m2g−1) |
|---|---|---|---|---|
| 400 | 32.33 ± 0.79 d | 8.95 ± 0.32 c | 32.24 ± 0.95 a | 3.36 ± 0.24 a |
| 500 | 41.08 ± 1.31 c | 9.24 ± 0.15 b | 31.10 ± 1.72 ab | 2.72 ± 0.13 b |
| 600 | 47.08 ± 0.97 b | 9.40 ± 0.18 b | 28.24 ± 1.42 ab | 1.97 ± 1.77 c |
| 700 | 54.34 ± 0.81 a | 10.28 ± 0.17 a | 22.70 ± 1.73 b | 1.71 ± 1.49 c |
| Temperature (°C) | Time (h) | Ash (%) | pH | CEC (cmol kg−1) | Surface Area (m2g−1) |
|---|---|---|---|---|---|
| 400 | 1.5 | 28.67 ± 0.88 b | 8.66 ± 0.13 c | 29.53 ± 0.39 a | 3.86 ± 0.49 a |
| 2 | 32.67 ± 1.2 a | 8.67 ± 0.13 c | 31.90 ± 0.97 a | 4.04 ± 0.37 a | |
| 2.5 | 33.33 ± 0.88 a | 9.10 ± 0.21 b | 33.80 ± 3.36 a | 2.95 ± 0.11 ab | |
| 3 | 34.67 ± 0.88 a | 9.38 ± 0.04 a | 34.56 ± 0.29 a | 2.60 ± 0.32 b | |
| 500 | 1.5 | 35.67 ± 0.88 b | 8.57 ± 0.06 c | 29.28 ± 0.92 b | 2.65 ± 0.37 a |
| 2 | 38.67 ± 0.88 b | 8.72 ± 0.17 b | 32.40 ± 4.16 a | 2.88 ± 0.24 a | |
| 2.5 | 43.67 ± 1.2 a | 9.78 ± 0.16 b | 32.25 ± 0.25 a | 2.72 ± 0.28 a | |
| 3 | 46.33 ± 0.67 a | 9.89 ± 0.17 a | 30.5 ± 0.39 ab | 2.57 ± 0.26 a | |
| 600 | 1.5 | 44.33 ± 1.33 b | 8.69 ± 0.11 d | 30.0 ± 0.64 a | 2.45 ± 0.39 a |
| 2 | 45.33 ± 0.33 b | 9.10 ± 0.03 c | 26.57 ± 0.53 b | 2.27 ± 0.25 a | |
| 2.5 | 47.33 ± 0.67 ab | 9.53 ± 0.037 b | 25.69 ± 0.29 b | 1.95 ± 0.42 ab | |
| 3 | 51.33 ± 2.02 a | 10.26 ± 0.12 a | 25.39 ± 0.26 b | 1.19 ± 0.78 b | |
| 700 | 1.5 | 53.00 ± 1.76 a | 9.37 ± 0.16 b | 25.15 ± 0.67 a | 2.04 ± 0.24 a |
| 2 | 53.67 ± 1.76 a | 10.52 ± 0.19 a | 22.14 ± 0.148 b | 2.00 ± 0.16 a | |
| 2.5 | 53.37 ± 1.88 a | 10.60 ± 0.20 a | 21.84 ± 0.256 b | 1.74 ± 0.28 ab | |
| 3 | 55.33 ± 1.86 a | 10.63 ± 0.15 a | 21.69 ± 0.148 b | 1.05 ± 0.12 b |
| Temperature (°C) | C (%) | N (%) | C:N | Total P (g kg−1) | Total K (%) |
|---|---|---|---|---|---|
| 400 | 36.46 ± 0.42 d | 2.36 ± 0.08 a | 15.68 ± 0.64 d | 18.00 ± 0.56 a | 1.97 ± 0.09 d |
| 500 | 38.46 ± 0.13 c | 1.76 ± 0.06 b | 22.10 ± 0.79 c | 18.01 ± 0.82 a | 2.23 ± 0.05 c |
| 600 | 39.98 ± 0.08 b | 1.28 ± 0.01 c | 32.55 ± 0.49 b | 19.70 ± 1.25 a | 2.39 ± 0.08 b |
| 700 | 41.08 ± 0.16 a | 1.17 ± 0.01 c | 35.11 ± 0.91 a | 19.75 ± 1.05 a | 2.53 ± 0.07 a |
| Temperature (°C) | Time (h) | C (%) | N (%) | C:N | Total P (g kg−1) | Total K (%) |
|---|---|---|---|---|---|---|
| 400 | 1.5 | 34.55 ± 0.11 c | 2.58 ± 0.26 a | 13.71 ± 1.54 b | 16.83 ± 0.46 bc | 1.37 ± 0.038 b |
| 2 | 36.23 ± 0.35 b | 2.46 ± 0.01 a | 14.73 ± 0.13 b | 18.09 ± 0.50 ab | 2.14 ± 0.058 a | |
| 2 | 37.22 ± 0.60 ab | 2.30 ± 0.08 a | 16.22 ± 0.86 ab | 18.32 ± 2.63 ab | 2.16 ± 0.038 a | |
| 3 | 37.83 ± 0.51 a | 2.09 ± 0.06 a | 18.07 ± 0.76 a | 18.78 ± 0.69 ab | 2.23 ± 0.057 a | |
| 500 | 1.50 | 37.99 ± 0.11 b | 2.01 ± 0.02 a | 18.91 ± 0.22 b | 16.95 ± 1.59 bc | 2.07 ± 0.019 c |
| 2 | 38.17 ± 0.05 ab | 1.87 ± 0.06 b | 20.48 ± 0.76 b | 18.90 ± 1.13 ab | 2.10 ± 0.038 c | |
| 2.5 | 38.71 ± 0.02 a | 1.61 ± 0.03 c | 23.93 ± 0.36 a | 18.21 ± 0.40 ab | 2.28 ± 0.019 b | |
| 3 | 38.60 ± 0.32 a | 1.56 ± 0.03 c | 25.09 ± 0.63 a | 18.32 ± 0.19 ab | 2.49 ± 0.057 a | |
| 600 | 1.50 | 39.59 ± 0.03 b | 1.32 ± 0.01 a | 29.91 ± 0.13 b | 18.54 ± 1.79 bc | 2.10 ± 0.03 c |
| 2 | 39.98 ± 0.01 ab | 1.35 ± 0.02 a | 32.92 ± 0.71 a | 19.02 ± 1.09 ab | 2.18 ± 0.03 c | |
| 2.5 | 40.13 ± 0.11 a | 1.25 ± 0.02 b | 33.54 ± 0.09 a | 19.70 ± 0.59 ab | 2.51 ± 0.019 b | |
| 3 | 40.22 ± 0.11 a | 1.21 ± 0.02 b | 33.84 ± 0.15 a | 21.55 ± 0.64 a | 2.78 ± 0.00 a | |
| 700 | 1.50 | 40.76 ± 0.13 b | 1.20 ± 0.01 a | 25.14 ± 0.62 c | 16.75 ± 1.70b c | 2.12 ± 0.019 b |
| 2 | 40.67 ± 0.45 ab | 1.18 ± 0.02 a | 29.05 ± 0.10 b | 19.40 ± 3.018 ab | 2.51 ± 0.07 b | |
| 2.5 | 41.16 ± 0.19 a | 1.16 ± 0.05 b | 30.19 ± 0.54 b | 20.51 ± 0.64 ab | 2.58 ± 0.019 a | |
| 3 | 41.74 ± 0.14 a | 1.12 ± 0.01 c | 33.38 ± 0.51 a | 22.35 ± 1.28 a | 2.92 ± 0.019 a |
| Temperature (°C) | Ca (g kg−1) | Mg (g kg−1) | Fe (g kg−1) | Mn (mg kg−1) |
|---|---|---|---|---|
| 400 | 98.65 ± 8.38 a | 5.16 ± 0.41 b | 25.36 ± 1.76 b | 586.07 ± 78.18 a |
| 500 | 105.67 ± 7.98 a | 5.19 ± 0.15 b | 25.41 ± 1.30 b | 643.11 ± 65.11 a |
| 600 | 115.47 ± 3.14 a | 5.81 ± 0.15 ab | 26.25 ± 2.15 b | 682.53 ± 28.25 a |
| 700 | 117.47 ± 3.10 a | 6.61 ± 0.13 a | 31.97 ± 1.96 a | 705.6 ± 19.312 a |
| Temperature (°C) | Time (h) | Ca (g kg−1) | Mg (g kg−1) | Fe (g kg−1) | Mn (mg kg−1) |
|---|---|---|---|---|---|
| 400 | 1.5 | 72.038 ± 30.17 a | 4.08 ± 1.58 b | 20.50 ± 0.20 b | 528.59 ± 22.27 b |
| 2 | 101.68 ± 1.58 a | 5.09 ± 0.08 b | 24.80 ± 4.16 ab | 570.3 ± 8.679 ab | |
| 2.5 | 102.90 ± 2.63 a | 5.10 ± 0.22 a | 23.26 ± 2.46 b | 598.09 ± 22.18 a | |
| 3 | 117.93 ± 8.44 a | 5.68 ± 0.52 a | 32.85 ± 1.70 a | 627.23 ± 212.7 a | |
| 500 | 1.5 | 81.65 ± 7.43 c | 4.64 ± 0.07 b | 19.8 ± 0.58 b | 614.82 ± 15.58 a |
| 2 | 97.58 ± 22.1 bc | 5.08 ± 0.25 b | 25.48 ± 1.80 a | 624.49 ± 7.32 a | |
| 2.5 | 119.39 ± 3.24 ab | 5.78 ± 0.086 a | 26.24 ± 0.20 a | 658.6 ± 22.49 a | |
| 3 | 124.09 ± 1.35 a | 5.95 ± 0.019 a | 30.12 ± 2.80 a | 681.46 ± 45.07 a | |
| 600 | 1.5 | 102.70 ± 9.19 b | 5.24 ± 0.18 b | 19.38 ± 0.68 c | 662.26 ± 20 b |
| 2 | 115.84 ± 1.29 ab | 5.64 ± 0.37 ab | 22.346 ± 0.58 bc | 684.32 ± 8.5 a | |
| 2.5 | 119.19 ± 2.29 a | 6.18 ± 0.09 a | 26.7 ± 3.47 b | 690.65 ± 41.2 a | |
| 3 | 124.09 ± 1.35 a | 6.20 ± 0.054 a | 36.56 ± 2.19 a | 692.91 ± 46.5 a | |
| 700 | 1.5 | 102.70 ± 9.19 b | 6.19 ± 0.108 c | 31.12 ± 4.60 a | 621.67 ± 9.69 d |
| 2 | 118.24 ± 1.23 ab | 6.44 ± 0.21 bc | 34.97 ± 0.75 a | 681.5 ± 12.54 c | |
| 2.5 | 121.29 ± 2.26 ab | 6.93 ± 0.048 ab | 30.26 ± 5.00 a | 726.25 ± 9.9 b | |
| 3 | 130.16 ± 1.81 a | 7.02 ± 0.24 a | 31.55 ± 5.50 a | 792.97 ± 3.65 a |
| Temperature (°C) | Cu (mg kg−1) | Zn (mg kg−1) | Cr (mg kg−1) | Ni (mg kg−1) | Pb | Tl |
|---|---|---|---|---|---|---|
| 400 | 21.74 ± 3.71 b | 150.32 ± 27.65 d | 4.33 ± 0.57 b | 6.15 ± 0.73 b | Below detection limit | Below detection limit |
| 500 | 24.21 ± 1.59 ab | 173.8 ± 26.18 c | 5.24 ± 0.96 ab | 8.33 ± 1.32 ab | ||
| 600 | 24.76 ± 4.28 ab | 222.27 ± 47.62 b | 8.70 ± 1.30 a | 9.05 ± 2.00 ab | ||
| 700 | 29.52 ± 1.20 a | 265.79 ± 10.33 a | 9.84 ± 1.120 a | 11.70 ± 1.66 a |
| Temperature (°C) | Time (h) | Cu (mg kg−1) | Zn (mg kg−1) | Cr (mg kg−1) | Ni (mg kg−1) | Pb | Tl |
|---|---|---|---|---|---|---|---|
| 400 | 1.5 | 19.49 ± 3.69 a | 108.8 ± 23.41 b | 3.63 ± 0.27 a | 4.41 ± 0.25 b | Below detection limit | Below detection limit |
| 2 | 22.23 ± 5.77 a | 135.9 ± 4.3 ab | 3.18 ± 0.85 a | 4.59 ± 1.47 ab | |||
| 2.5 | 22.77 ± 10.7 a | 167.59 ± 9.8 ab | 4.37 ± 1.47 a | 6.89 ± 0.49 ab | |||
| 3 | 22.47 ± 1.27 a | 191 ± 20.48 a | 6.16 ± 1.27 a | 8.68 ± 1.82 a | |||
| 500 | 1.5 | 19.82 ± 1.449 b | 146.33 ± 23.14 b | 3.64 ± 0.91 a | 4.16 ± 1.08 c | ||
| 2 | 21.23 ± 0.316 b | 164.82 ± 9.38 ab | 4.94 ± 1.50 a | 5.44 ± 0.134 c | |||
| 2.5 | 26.93 ± 1.62 ab | 169.5 ± 17.14 ab | 5.89 ± 0.88 a | 8.78 ± 1.63 b | |||
| 3 | 28.86 ± 4.33 a | 211.73 ± 10.7 a | 6.49 ± 3.75 a | 14.92 ± 0.26 a | |||
| 600 | 1.5 | 21.84 ± 0.42 c | 148.00 ± 15 ab | 4.56 ± 0.70 c | 6.33 ± 2.38 c | ||
| 2 | 23.23 ± 15.84 ab | 217.9 ± 12.08 ab | 5.11 ± 1.69 c | 6.37 ± 0.07 c | |||
| 2.5 | 24.96 ± 0.547 ab | 219.7 ± 15.14 ab | 12.50 ± 7.31 b | 7.48 ± 3.96 b | |||
| 3 | 29.03 ± 4.422 a | 305.35 ± 17.10 a | 13.09 ± 2.48 a | 16.03 ± 5.82 a | |||
| 700 | 1.5 | 28.46 ± 2.15 b | 153.7 ± 21.43 c | 6.44 ± 1.96 b | 7.18 ± 0.49 b | ||
| 2 | 29.18 ± 1.09 ab | 230.9 ± 18.8 bc | 6.55 ± 2.22 b | 9.25 ± 1.51 b | |||
| 2.5 | 29.68 ± 1.84 ab | 338.4 ± 2.238 ab | 13.20 ± 1.92 a | 11.92 ± 1.74 ab | |||
| 3 | 30.79 ± 0.47 a | 341.09 ± 7.676 a | 13.23 ± 1.98 a | 18.48 ± 4.37 a |
© 2019 by the authors. Licensee MDPI, Basel, Switzerland. This article is an open access article distributed under the terms and conditions of the Creative Commons Attribution (CC BY) license (http://creativecommons.org/licenses/by/4.0/).
Share and Cite
Sarfraz, R.; Li, S.; Yang, W.; Zhou, B.; Xing, S. Assessment of Physicochemical and Nutritional Characteristics of Waste Mushroom Substrate Biochar under Various Pyrolysis Temperatures and Times. Sustainability 2019, 11, 277. https://0-doi-org.brum.beds.ac.uk/10.3390/su11010277
Sarfraz R, Li S, Yang W, Zhou B, Xing S. Assessment of Physicochemical and Nutritional Characteristics of Waste Mushroom Substrate Biochar under Various Pyrolysis Temperatures and Times. Sustainability. 2019; 11(1):277. https://0-doi-org.brum.beds.ac.uk/10.3390/su11010277
Chicago/Turabian StyleSarfraz, Rubab, Siwei Li, Wenhao Yang, Biqing Zhou, and Shihe Xing. 2019. "Assessment of Physicochemical and Nutritional Characteristics of Waste Mushroom Substrate Biochar under Various Pyrolysis Temperatures and Times" Sustainability 11, no. 1: 277. https://0-doi-org.brum.beds.ac.uk/10.3390/su11010277