Article

Framework for a Systematic Parametric Analysis to Maximize Energy Output of PV Modules Using an Experimental Design

by
Mohammad K. Najjar
1,*,
Eduardo Linhares Qualharini
1,
Ahmed W. A. Hammad
2,
Dieter Boer
3 and
Assed Haddad
1,*
1
Programa de Engenharia Ambiental, Universidade Federal do Rio de Janeiro, Rio de Janeiro 21941-901, Brazil
2
Faculty of Built Environment, University of New South Wales, Sydney, NSW 2052, Australia
3
Department of Mechanical Engineering, Universitat Rovira i Virgili, 43003 Tarragona, Spain
*
Authors to whom correspondence should be addressed.
Sustainability 2019, 11(10), 2992; https://0-doi-org.brum.beds.ac.uk/10.3390/su11102992
Submission received: 9 April 2019 / Revised: 30 April 2019 / Accepted: 11 May 2019 / Published: 27 May 2019
(This article belongs to the Section Energy Sustainability)

Abstract

:
Use of photovoltaic modules in buildings has been reported to be an effective tool in managing energy consumption. The novelty in the research herein is in a framework that integrates different performance parameters through the use of an experimental design to expect all variables via linear regression analysis. An emphasis is placed on making the method readily available to practitioners and experts in the area of renewable energy, using standard procedure and easily accessible software. This work empowers the decision-making process and sustainability through a parametric analysis of the installation of photovoltaic modules to increase their energy output towards nearly zero energy buildings. A case study of a group of photovoltaic modules is examined in four cities with different locations and climate data to validate the proposed framework. Results demonstrate that the installation of photovoltaic modules on the mounted roof is better than elevations, and the vertical installation of modules is the worst possible inclination to maximize the yielded energy. The impact of inclination is higher than orientation in influencing the energy productivity of photovoltaic modules. This work specifies integrating such modules mounted on roofs and elevations towards the equator line, by a proportion of inclination/latitude equal to 85 ± 3%, to maximize the energy output.

1. Introduction

The construction sector is renowned for its high consumption of energy and natural resources [1]. It is reported to be responsible for almost 30% of annual greenhouse gas (GHG) emissions and 34 × 106 Gigawatt-hours of total energy consumption worldwide, making it one of the top contributors to pollution [2], and causing several environmental impacts, such as global warming [3]. Soaring rates of urbanization will also exacerbate the issue even further, leading to an increase in energy consumption and GHG emissions [4]. Worldwide access to electricity has increased from around 73% in 1990 to 85% in 2014 [5]. The identification of sustainable energy solutions is a crucial need to enhance the effectiveness of energy consumption within the built environment [6], hence, it is highly important to understand the concept and the structure of future energy utilization [7].
The global desire for renewable energy systems witnessed an unprecedented upsurge in its uptake since 2014 [8], due to the augmentation of the global debate on energy costs and consumption rates [9]. Renewable energy systems provide a range of options for meeting the mounting demand for energy, particularly in a sustainable context that considers social and environmental aspects when planning the consumption of energy [10]. Specifically, solar energy is considered to be one of the most important renewable energy sources [11]; it can be converted into a useful form of energy using photovoltaic (PV) modules [12]. The focus of this study is hence on incorporating the installation of PV modules in a complete Building Integrated Photovoltaic (BIPV) system to increase energy efficiency in buildings and aid their transformation towards nearly zero energy buildings (nZEBs).
Although several aspects regarding the performance and design of PV modules have been examined in the literature, a systematic procedure for the assessment of critical performance and design parameters for installation of PV modules that can be easily accessed by practitioners is required, particularly, the orientation and inclination parameters [13]. In an attempt to address this, factorial design analysis, along with a visualization aid, for designing solar energy systems for buildings are adopted in order to assess and choose the best installation of PV modules at various inclinations and orientations on roofs and elevations of buildings. Enhancing the energy output (EO) of PV modules is conducted through a simulation and parametric analysis approach. Initially, an experimental design, which involves a systematic collection of data, is utilized to focus on the planning of the installation process itself rather than defining the coefficients of the design factors, based on a linear regression analysis. Such method helps to model all expected technical variables that maximize the performance of PV modules [14].
The novelty of this paper is to establish a framework that captures different performance parameters and design factors that determine the design energy efficiency of PV modules in a complete BIPV system. A reliance is on the use of standard procedure and software that make the work readily available to practitioners and experts in the area of renewable energy. PV*Sol software validates the extracted results and facilitates the selection process of the desired PV module by relying on the MeteoSyn climate database that contains thousands of global climate datasets and the use of an online component database that involves thousands of modules and inverters [15]. A case study of a group of PV modules is examined in different cities with varying irradiations, latitudes, and climate data to validate the developed methodological framework; the energy efficiency of PV modules in a complete BIPV system is examined, taking into consideration the energy produced, the installed capacity, and the potential of optimizing the EO of PV modules.

2. Background

In this section, a description of the components of a complete BIPV system is given. Moreover, a related literature review to the recent publications in the same field of the study is presented.

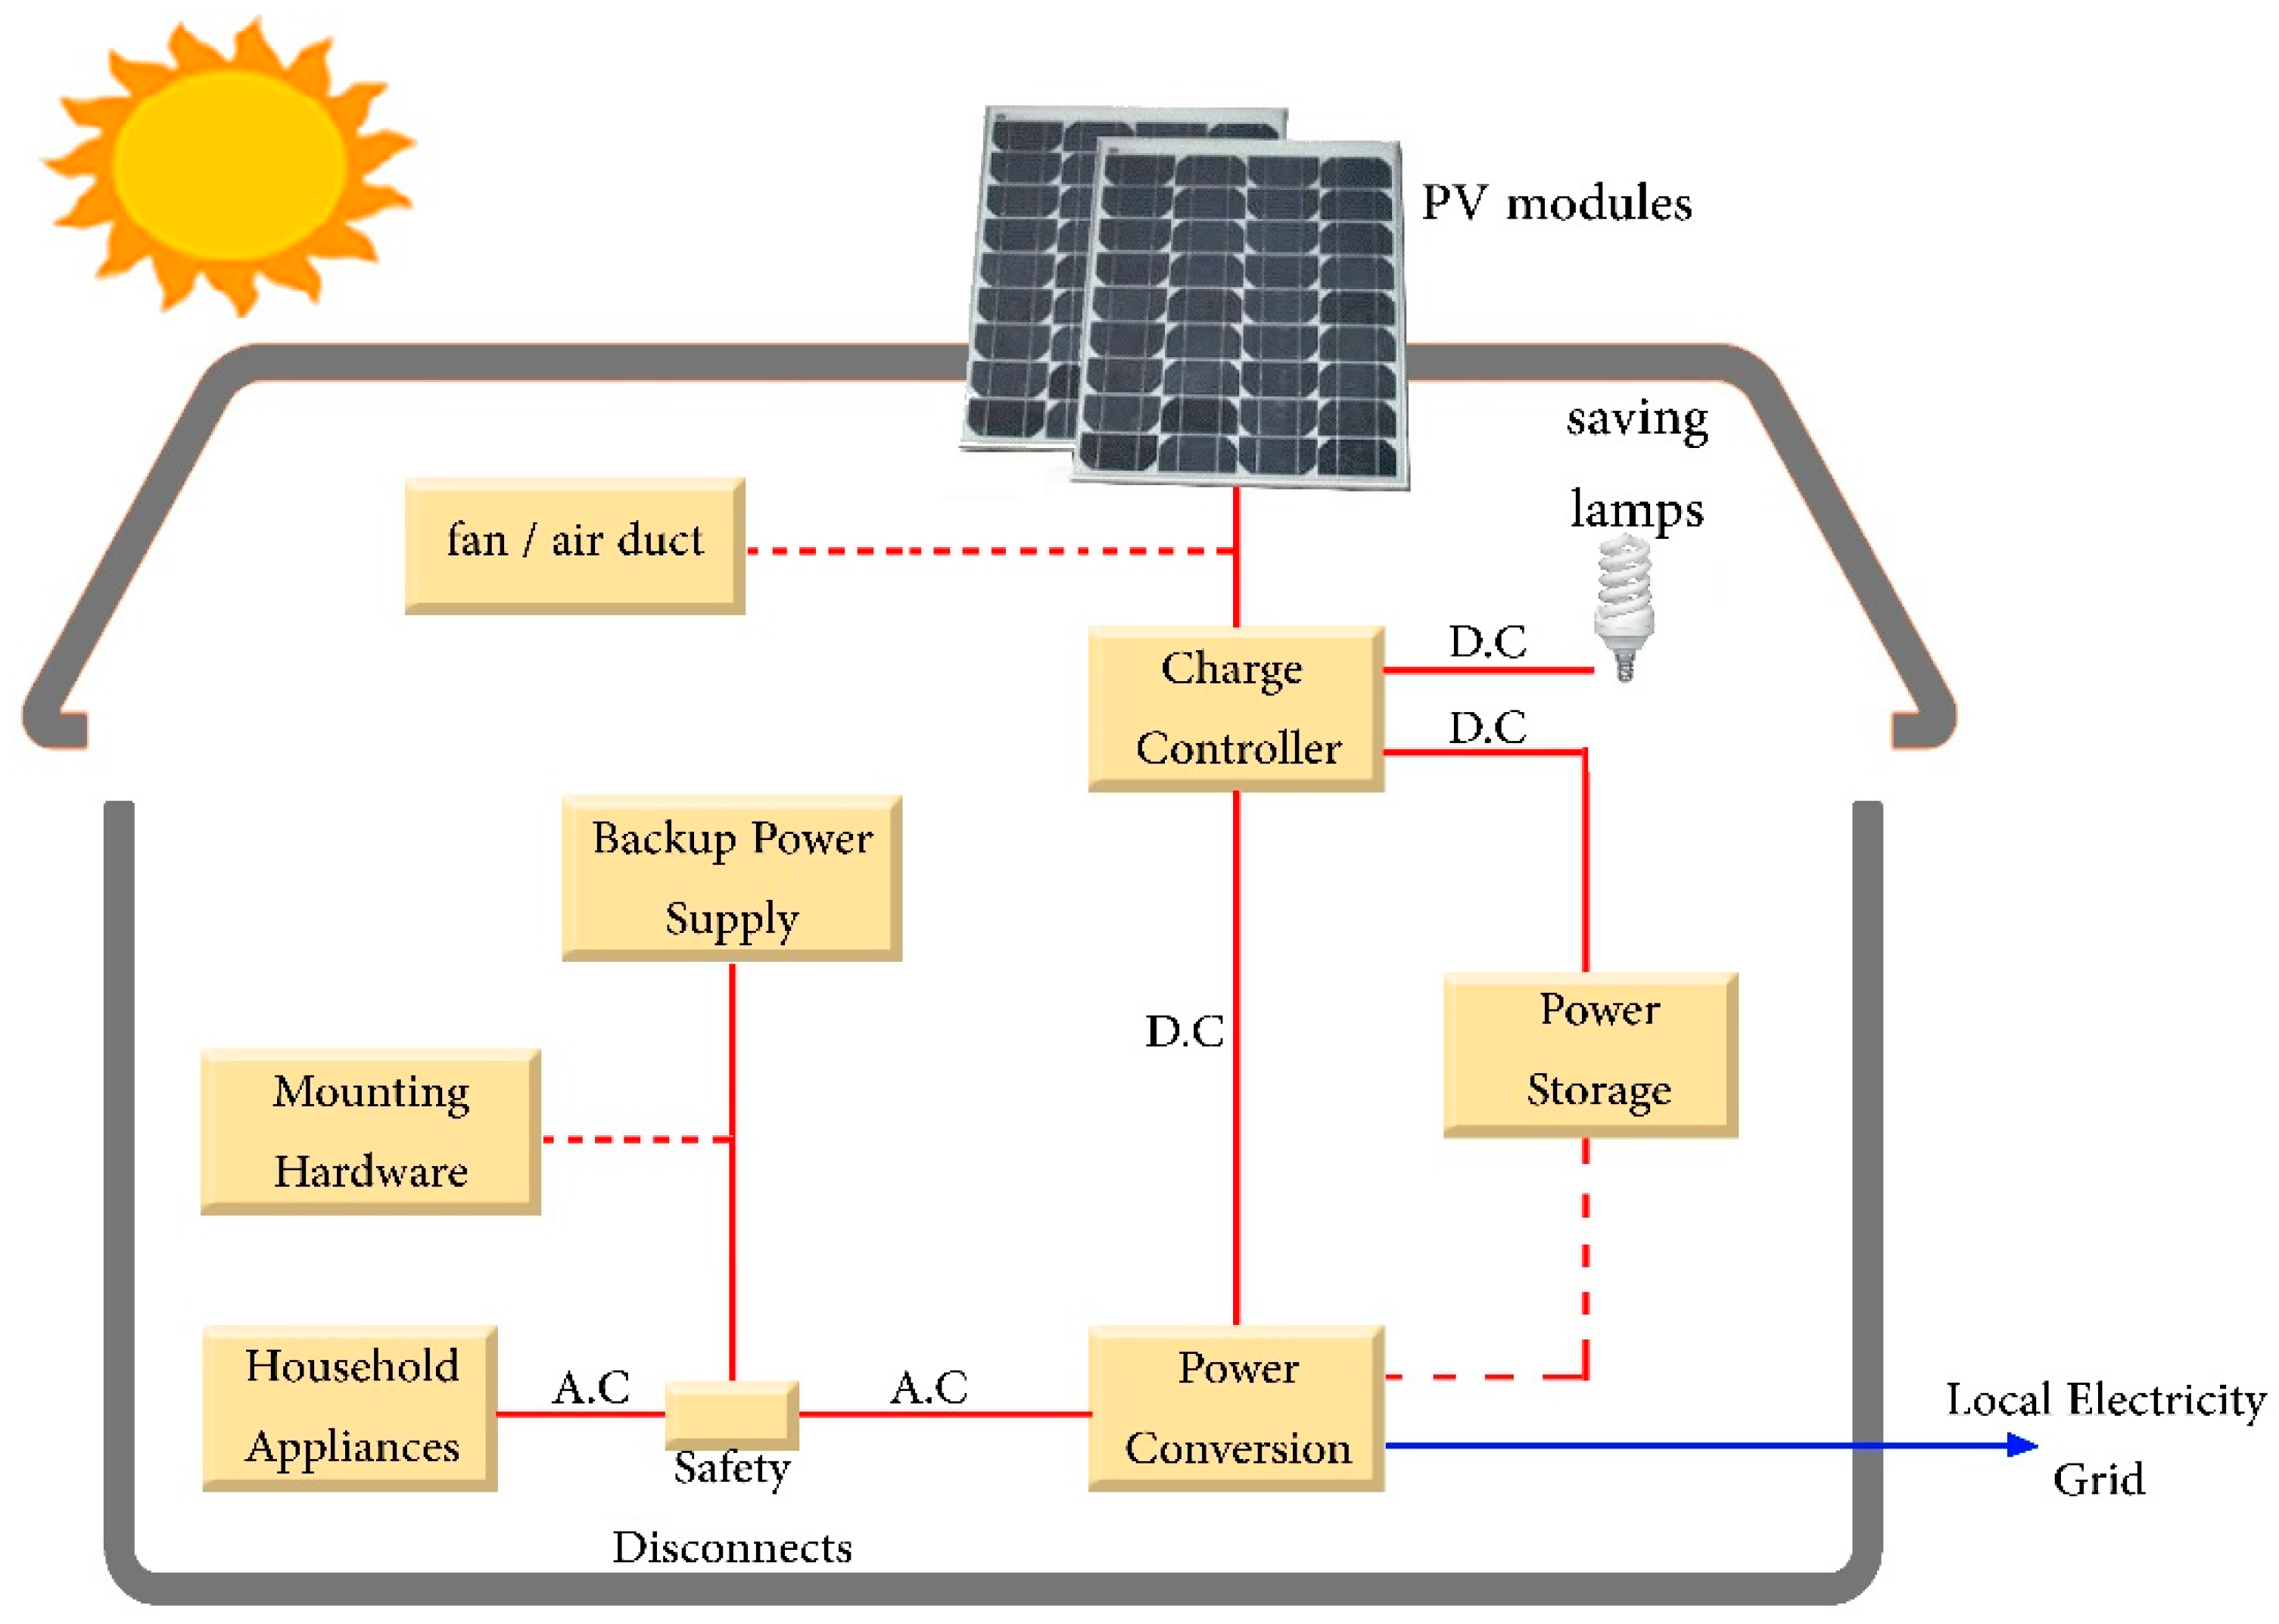
2.1. Components of a BIPV System

The built environment allows several forms of PV modules to be integrated into different parts of the structure of buildings, such as roofs, windows and semitransparent facades, facades, skylights, and shading systems [16]. The successful installation of BIPV systems necessitates the cooperation of both the functional and aesthetic issues within the financial constraints [17]. BIPV systems provide weather and sun protection, thermal insulation, noise protection, electromagnetic shielding, aesthetic quality, visual cover, and safety for construction projects. This comes back to the fact that the conventional building materials that are covering the final roof or façades of the building are being replaced by PV modules [18].
PV modules are classified into three generations based on the basic material used and the level of commercial maturity. The first-generation systems are the wafer-based crystalline silicon (c-Si), the most used material in the PV industry [19,20]. In 2013, c-Si wafers presented 91% of the total share in the global market of PV systems [21], and within the European Union, they accounted for around 85% of all new PV systems installed [22]. C-Si modules are basically manufactured using two common materials: Poly-crystalline (p-Si) and mono-crystalline (mono-Si); mono-Si occupies less space and has the ability to produce higher energy output compared to p-Si; mono-Si is less affected by high temperatures compared to p-Si, which has a shorter lifespan. The choice between these two types depends mainly on the climate data of the installed region; the efficiency rate of mono-Si is higher than p-Si—20% and 15%, respectively—however, p-Si is cheaper than mono-Si. [23]. The second-generation systems use thin-film technology, such as cadmium telluride solar cell (CdTe) [24]. This generation is the most efficient among all other generations if they face the sun at a perfect angle [25]. The third-generation systems use other technologies such as thin-film solar cells (TFSC) [25]. The advantage of this generation is that the modules are less affected by high temperatures and allow opportunities for better alternative installation, however, they occupy more space and have a shorter lifespan compared to the first generation [24].
The basic components of a BIPV system are presented in Figure 1, including the PV modules, a charge controller, a power storage system, a power conversion equipment, a backup power supply, and appropriate supports, such as mounting hardware, wiring, and safety disconnects [19,20], in addition to a fan and air duct, which are optional components that help reduce the heating load in winter by drawing the heated air into the space [18]. The characteristic parameters of PV modules are measured under standard test conditions that require defining the solar irradiance, module temperature, and wind speed [26]. The PV modules can be first, second, or third generation [19], while a power storage system can refer to the utility grid itself or the number of batteries [27]. The charge controller can provide and reduce the pure flow of power energy to the utility grid [28]. The charge controller regulates the power into and out of the power storage. The power conversion equipment, such as an inverter, converts the output direct current (D.C) energy of PV modules to output alternating current (A.C) energy that is used for household appliances. The inverter is a piece of very important equipment that operates the power energy in the utility grid and delivers the maximum power to the electric power grid [29]. The backup power supply is optional equipment, such as a diesel generator, used for providing the necessary power when the input power source fails [20]. However, ensuring the safety of the instalment of PV modules and the reliability of the utility grid are two major technical requirements that need to be satisfied when installing a complete BIPV system [18].
The grid-interconnection of PV modules in a BIPV system can be designed in three main circumstances [28]: (i) Grid-connected without storage; (ii) grid-connected with storage; and (iii) off-grid with storage. The EO of PV modules in any of these circumstances can be influenced by several factors, such as the characteristics of the components of the PV modules, their geographical location, and the installation variables, as well as the local solar radiation [29]. The successful installation of such modules facilitates the achievement of ambitious energy targets [30], where the generated energy can be stored in the power storage as a D.C energy or can be converted by the power conversion to A.C energy. At this level, the A.C energy is ready to be consumed directly or fed into the local energy grid if it accepts such an interconnection agreement [31], as illustrated in the blue line in Figure 1, where the excess renewable energy generated can be transferred to the local electricity grid; it is rated by a policy mechanism called “feed-in tariffs” [32]. This mechanism is considered the most effective policy that stimulates the rapid development of renewable energy sources and has been implemented in several regions worldwide [33].

2.2. Related Literature

Renewable energy systems appear as sustainable and alternative energy forms; they are extensively utilized in nearly Zero Energy Buildings (nZEBs) to reduce the consumption of energy and, consequently, reduce the environmental impacts associated with climate change [34]. Several publications in the literature have been dedicated to evaluating the performance of PV modules from different aspects. This section reviews the recent academic papers of PV performance evaluation based on three axes of literature: (i) The application of PV modules towards sustainability; (ii) the factors that are influencing the performance of PV modules; and (iii) the recent trends to optimize the application of PV modules.
First, several publications observed the use of PV modules towards more sustainable built environment, such as D’Adamo [35], who analysed the profitability of residential PV systems as the main resource towards the clean global economy of the future. This work stimulated a new diffusion of PV plants, considering the output energy over 20 years. The author found that PV modules are important alternatives to improve environmental impacts and reduce the dependence on fossil fuels. Similarly, Ferreira et al. [36] conducted an economic overview of the application and production of PV modules in Brazil and observed that the energy generation of PV modules is a convenient alternative to the diversification of the energy matrix in the country. Khan and Arsalan [37] reviewed the technologies of solar PV modules towards sustainable electricity generation, taking into consideration their types, efficiency, cost factors, and mechanism. The authors indicated that the mature technology of PV modules is well-suited for all scale applications, and is more commercially developed in addition to the fact that PV modules are a major source of clean energy as they have the potential to supply the global increasing requirements of electricity. In addition to this, Stropnik and Stritih [38] studied methods for increasing the electrical efficiency and power output of PV panels using phase change materials (PCM). The authors focused on the experimental setup and simulation heat extraction from PV panels to evaluate the PV-PCM integration in a Canadian city and found that the annual energy efficiency could increase by more than 7% in the city. Traverso et al. [39] evaluated the sustainability assessment performance of the assembly production of p-Si PV modules in order to compare their life cycle sustainability assessment (LCSA). The authors indicated that LCSA methodology empowers the decision-making process of the different stakeholders towards the more sustainable performance of PV modules.
Second, some authors highlighted several factors that are influencing the application and, consequently, the EO of PV modules. For instance, the geographical location of the application site, where the longer sunshine hours of high-latitude regions result in better EO of PV modules than shorter sunshine hours of low-latitude regions [40]. You et al. [3] compared the environmental efficiency of four PV plants in China, including a mountain plant, desert plant, rooftop plant, and complementary plant. Taking into consideration several input variables (i.e., insolation, covering area, and annual sunshine duration) and output variables (i.e., annual electricity generation, the installed capacity, coal saving, and CO2 emission reduction), the authors found that there is a difference in the performance of PV plants. However, serious aerosol pollution and the high urbanization rate are the main agents of the inefficiencies of the output energy of these plants. Carstens and Cunha [41] identified the challenges and opportunities of PV use in Brazil, considering two main approaches: The multilevel perspective and the functions of the innovation system. The authors found that the vast territory and the high solar irradiance play a basic role in improving the EO of PV modules, while the lack of new technology development, the shortage of skilled professionals, and insufficient knowledge transfer are the main challenges of implementing PV modules.
Third, some authors proposed a new model for the optimum tilt angle of a soiled PV module. They found that the cell temperature of a PV panel and the tilt angle are key factors to evaluate the power output of PV modules [42]. Another study investigated the PV panels’ optimum tilt angles for various cities in the Kingdom of Saudi Arabia. The authors used MATLAB software to optimize the tilt angle by maximizing solar radiation, considering the experimental work to validate the theoretical requirement for negative tilt angles during summer. The authors concluded that adjusting tilt angles six times per year harvests 99.5% of the solar radiation that could be achieved with daily PV panel adjustment [43]. Yu et al. [13] established a database to optimize the PV applications in Japan. The authors focused on the orientations and inclinations of installing PV modules as two major factors to achieve the aim of their study, while Han and Kim [44] developed an optimization-based framework to design renewable energy systems for the residential sector in Korea.
Furthermore, Gunerhan and Hepbasli [45], and Benghanem [46] in their studies indicated that the yearly optimum inclination of PV modules is nearly equal to the latitude of the installation site. Landau [47] examined the optimum inclination of PV modules in various cities around the world as shown in Table 1. The author suggested several formulae to find the best inclination at which the panel should be tilted. This work used a proportion of the best inclination compared to the latitude. At this level of the analysis, the results presented in Table 1 are collected from the proportion of dividing the optimum inclination of PV modules, suggested by Landau, for each city by the representative latitude, individually, ((inclination/latitude) × 100).
Accordingly, it is apparent that an emphasis is placed in the literature on the optimization of certain design factors associated with the installation of PV modules, such as the orientation and inclination. Nevertheless, there is little focus on the development of a methodological framework that could integrate such installation in buildings using the experimental design on the one hand, and optimizing the EO of PV modules in a complete BIPV system by indicating the best geographic orientation and inclination, on the other hand. In the next section, the proposed framework to cover this apparent gap in the literature is presented.
Furthermore, several studies in the literature have evaluated the energy performance of renewable energy systems based on the use of yearly data. Researchers that implemented this common practice include Bellos and Tzivanidis [48], Hasan et al. [49], Pillai et al. [50], Kim and Lim [51], and Han et al. [52]. Additionally, Autodesk reviewed the energy analysis and summarized the amount of electricity that a building site could produce using solar panels and wind turbines based on the use of yearly data [53,54]. Thus, the proposed framework in this work will be demonstrated on yearly data, but the same concept can still be extended for other temporal data as well.

3. Materials and Methods

A novel framework is proposed and highlighted in Figure 2, where the link between performance parameters and design factors is outlined. The installation of PV modules in a BIPV system requires the identification of various performance parameters and their associated design factors. Performance parameters refer to the characteristics that are defining and classifying a particular system in the model, while design factors are features and variables that define the performance parameters, and these are displayed in Figure 2, including building modelling, climate data, and PV module installation. Evaluating the parameters of PV module installation that are influencing their EO is the concern of this study. However, the next subsections highlight the main components of the proposed framework.

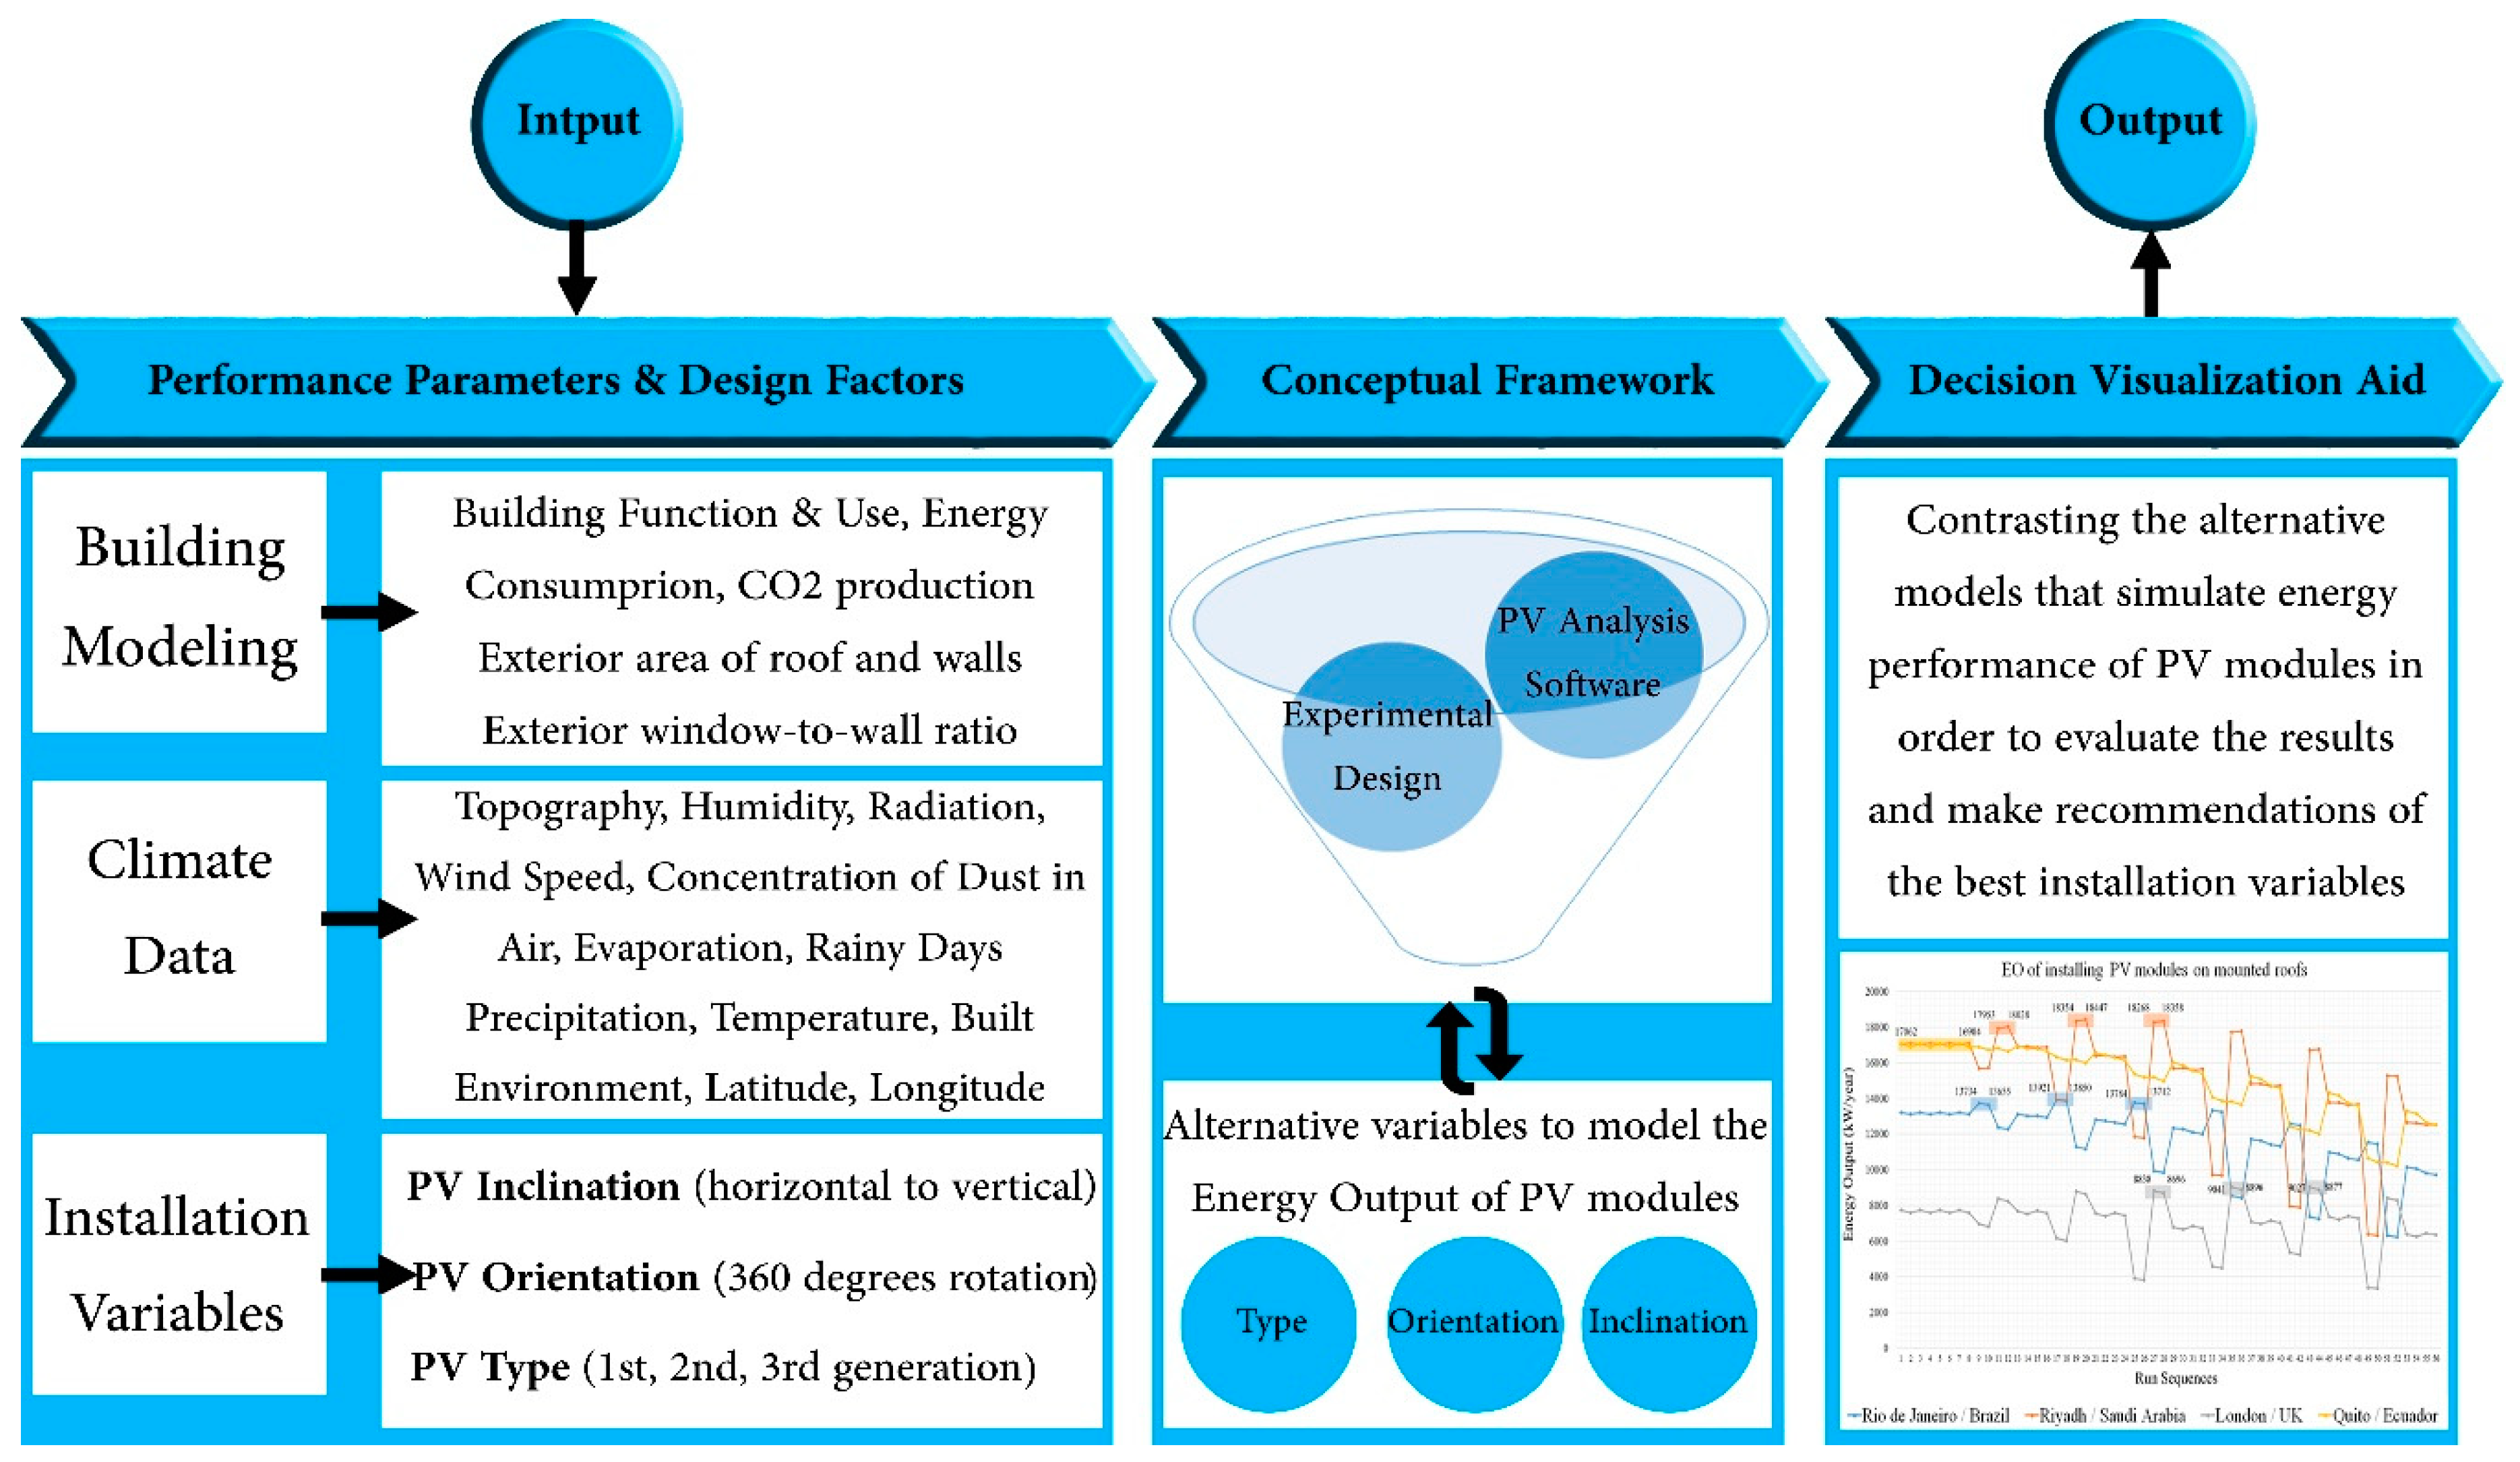
3.1. Performance Parameters and Design Factors

The initial step in the proposed approach is the integration of a number of performance parameters that impact the operation phase EO of PV modules. In these terms, the building modelling parameter means recognizing the type of building design (the design of the final roof and elevations) [32]. The design factors relevant to this parameter include: (i) The identification of the function and use of the building; (ii) type of energy use and consumption; (iii) CO2 production; (iv) exterior area of roof and walls; and (v) the exterior window-to-wall ratio associated with the building [55,56,57]. Examples of the associated design features of the climate data parameter include the topography, humidity level, solar radiation, wind speed, the concentration of dust in the air, evaporation, rainy days, precipitation, temperature, built environment, latitude, and longitude of the exact location where the PV modules are to be installed [58,59,60]. The third performance parameter of the proposed framework of this study is PV module installation, which means defining the model of the installed panels, quantity, and installation variables (i.e., PV type, PV inclination, and PV orientation) [29].
The geographic orientation and inclination are two vital installation variables playing a fundamental role in the installation of PV modules in a successful BIPV system [61]. Determining the PV orientation involves analysing the wind, rain, and site conditions in order to define the best geographic orientation for the PV modules [62,63]. The PV inclination refers to the analysis of the sun movement and latitude in order to identify the preferable inclination of the PV modules [64,65]. It is reported that the performance of PV modules is affected by the orientation and inclination, which are the main factors influencing the amount of solar energy incident upon the surface of the PV module [66]. Thus, this work will focus on these two installation variables. In addition, the PV type is another parameter to be considered to validate the impact on the energy yielded from the installed module [20]. The proposed methodological framework of this analysis can accommodate a large number of PV inclinations (i.e., from horizontal to vertical inclination) and PV orientations (i.e., 360 degrees rotation) as well as the available PV types on the local market. However, some specific PV types, PV inclination, and PV orientation are chosen in the case study, shown in Section 5, to validate the proposed framework.

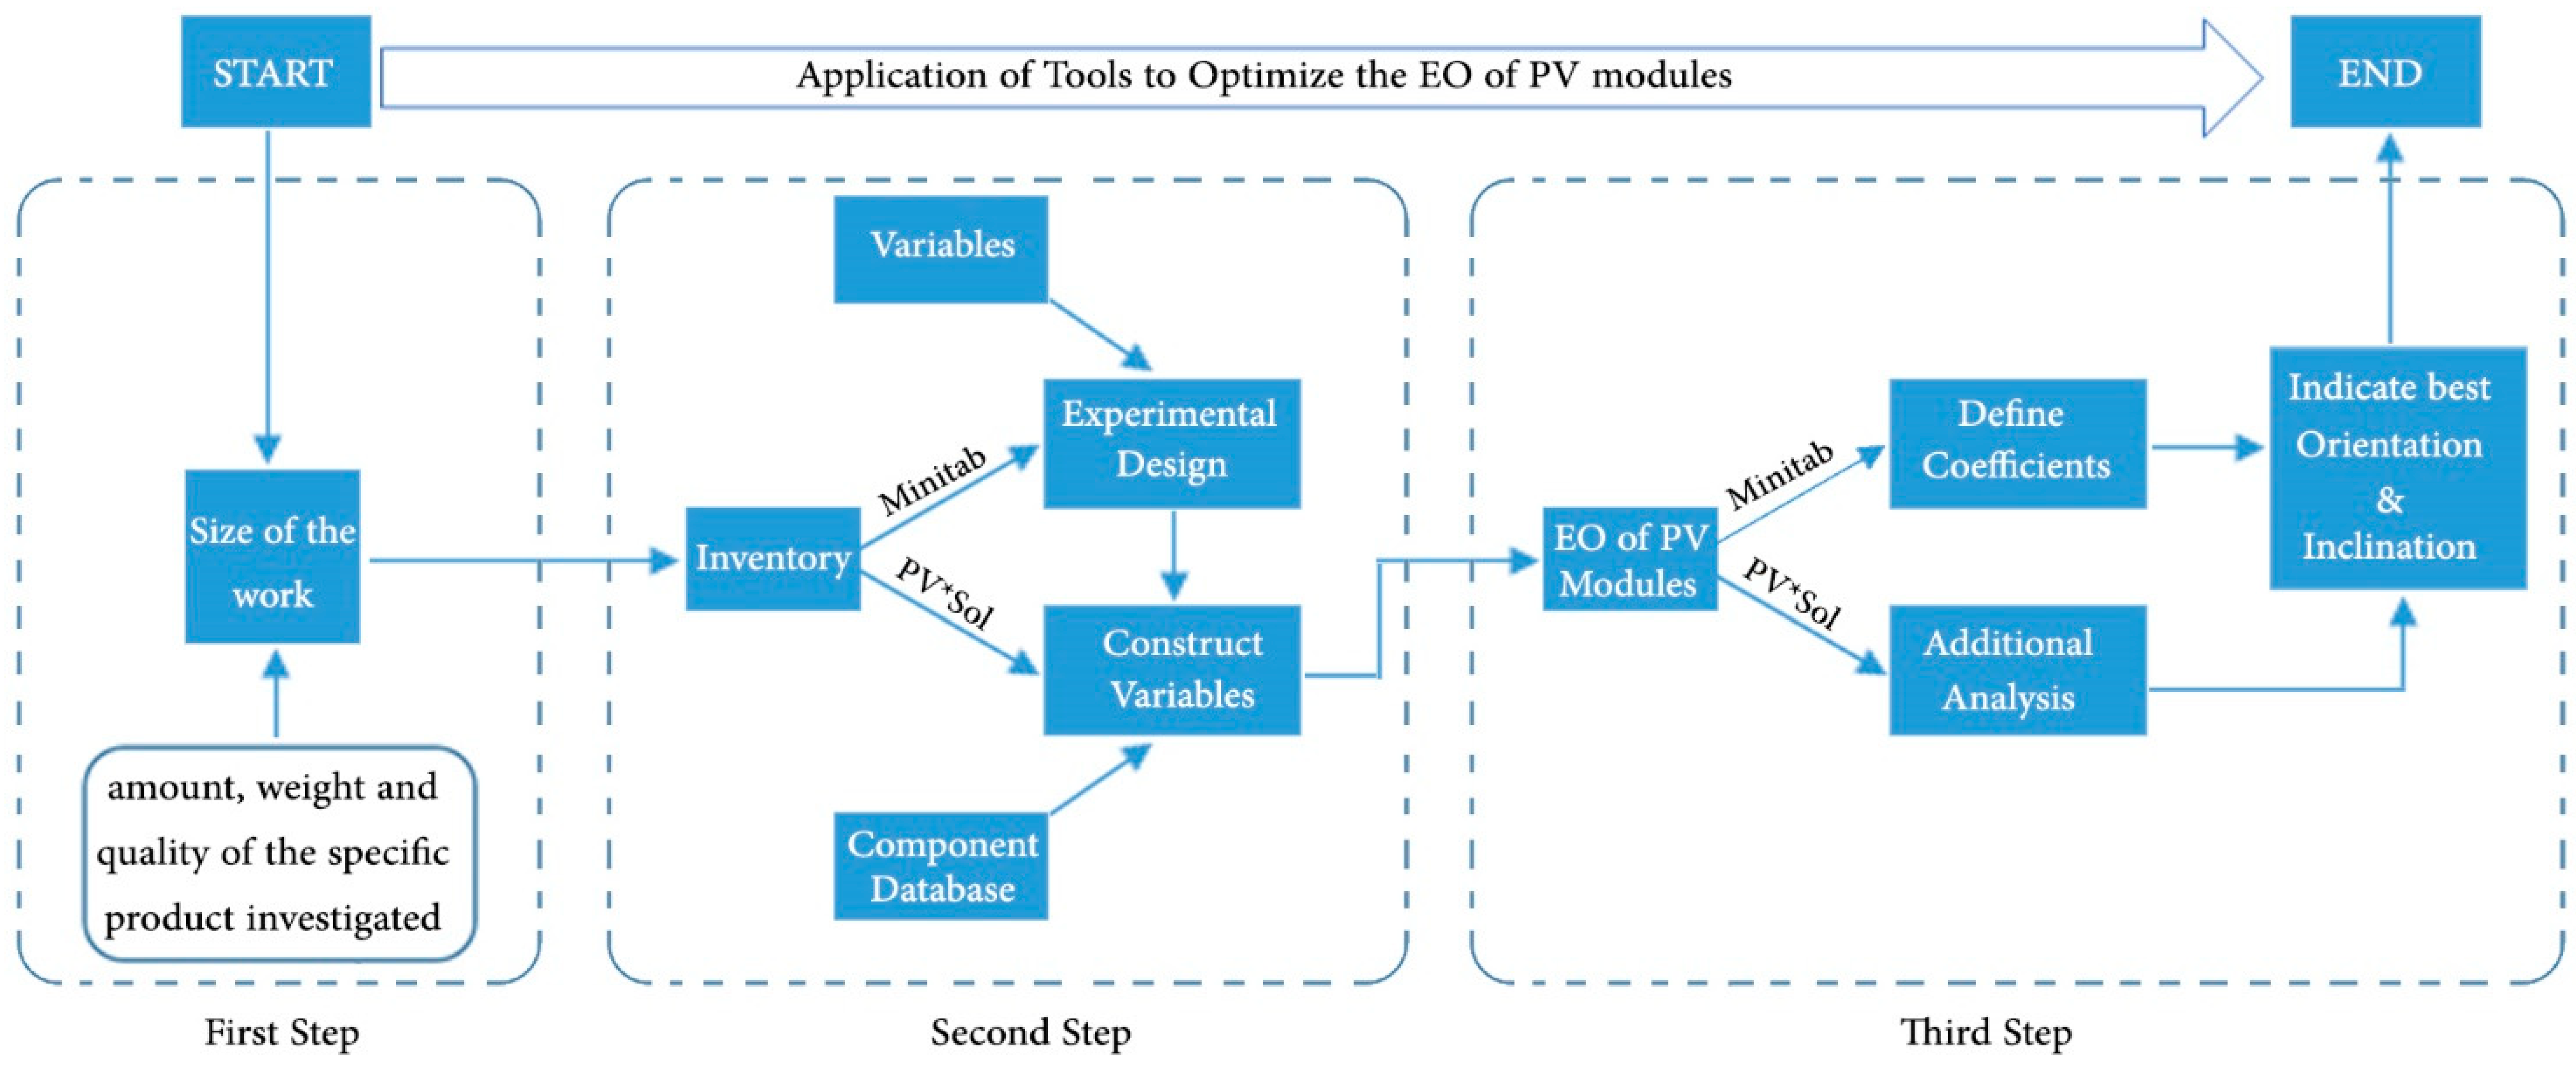
3.2. Evaluation Method

This step starts by evaluating the collected database of energy consumption and output emissions using indicators of sustainability, which can lead to better decisions and more actions that are effective. This is achieved by simplifying, clarifying, and making aggregated information available to policy makers. Hence, sustainability indicators are used to calibrate the progress toward sustainable development goals by communicating the thoughts and values of the collected results [67]. The methodology of this study makes use of an experimental design procedure to indicate the best geographic orientation and inclination of PV modules in buildings. The experimental design work, which was applied via linear regression, is based on a parametric analysis that examines different values for several design factors related to the PV type, PV orientation, and PV inclination. Such a process provides maximum information at minimum experimental cost [68]. This work examines the performance of PV modules at various types, inclinations, and orientations to support policy makers in planning the features required to be targeted when installing such energy sources. Hence, the expected variables generated via the experimental design were accommodated individually and evaluated using PV*Sol software to integrate the installation process of PV modules and estimate the EO of PV modules installed in a complete BIPV system [15]. This software allows the simulation of PV systems and facilitates the process of design and analysis of grid connected PV systems [69]. In the literature, PV*Sol software has been applied as a PV analysis software to validate such results and design and model the performance of PV systems and low-energy solar buildings [70,71].

3.3. Decision Visualization Aid

The last step of the methodological framework of this study is to evaluate the collected results by contrasting the alternative models that simulate the energy performance of PV modules to define the best installation variables that could improve their energy efficiency. This process starts by clarifying and classifying sources of data, comparing results, and suggesting recommendations and new design options. Changes to the variables in experimental design were evaluated using software, such as Minitab. This software was used for determining all the expected variables of the experimental design work and to define the coefficients of the design factors through a linear regression analysis [72].

4. Linking Framework Components

In terms of the required analysis, the first step is to identify the size of the case study, which means identifying the amount, weight, and quality of the specific product investigated (i.e., building), as shown in Figure 3.
The second step is to build the inventory of database. The proposed framework applies an experimental design to estimate all the expected variables using a parametric analysis based on linear regression. At this level of the analysis, the interaction effects are found by the use of statistical factorial design technique [73]. This involves running a full complement of all possible factor combinations and estimating all the interaction effects, through knowing the number of factors (κ) and the number of levels for each factor. A factorial design model is presented in Equation (1) that allows the estimation of all coefficients (β0,…, βκ) [14,74]:
Υ = β0 + β11 + β22 + … + βκκ + ϵ.
Though Equation (1) calculates all the actual responses and interactions of the expected variables [74], in the experimental design, errors are inevitable [75]. Minitab is used to estimate all the expected variables and reduce regression errors and uncertainty [72]. The variables of the experiment are then examined using PV analysis software. This work utilized PV*Sol software to construct the determined variables, individually, and estimate the EO of PV modules [76]. PV*Sol software relies on the MeteoSyn climate database, which contains thousands of global climate datasets. In addition, an online component database that contains thousands of modules and inverters used [15] in order to sort out files and, accordingly, facilitate the selection process of the desired module or inverter type [77]. Collecting a reliable dataset requires assessing the following parameters:
  • System, climate data, and grid: For system, this involves recognizing the type of building design (basically the design of the final roof and elevations); for climate, this is related to obtaining the climate data associated with each region analysed, and identifying the exact location where the PV modules are to be installed, in order to determine the latitude, longitude, annual sum of global irradiation, and annual average temperature; and for grid, this involves determining the usage voltages and phase system of electricity.
  • PV modules: This refers to defining the model of the examined PV module, the number of PV modules, installation type, inclination, orientation, shading, and degradation of the module.
  • Inverters: This refers to selecting the configurations, determining the values of the configuration module, and the number of inverters.
  • Cables: This is associated with calculating the loss of energy in cables, based on their length and thickness, through consideration of the distances between the various components of the BIPV system.
The third step is to evaluate the collected database in order to calculate the EO of PV modules. At this level of the analysis, the collected results of the PV analysis software are evaluated in two phases. First, the results are transferred to the experimental design software to define the coefficients of the assigned design factors through linear regression analysis [72]. Second, analysis of additional PV modules mounted on the roof is conducted to define the specific inclinations that would maximize the EO of the PV modules. This stage requires running another analysis in the PV*Sol software to specify the best inclinations. Conducting such an analysis demands a parametric analysis involving gradual increments of inclinations.

5. Case Example: Installation of PV Modules in a Complete BIPV System

The applied case study aims to validate the proposed framework used to model the decisions involved in installing PV modules in a complete BIPV system. In order to showcase the versatility of the proposed framework, the proposed analysis of the installation of PV modules was conducted in four different cities with differing climate data, latitude, longitude, annual average temperatures, and global annual irradiation. The chosen cities include Rio de Janeiro in Brazil, Riyadh in Saudi Arabia, London in the United Kingdom, and Quito in Ecuador. The choice of these cities was made to ensure comprehensive consideration of various climatic conditions. Rio de Janeiro is located down the equator to the west side of the Greenwich, at a latitude of 22° and longitude of 43°. Riyadh is located up the equator to the east side of the Greenwich, at a latitude of 24° and longitude of 46°. London is located on the north side of the equator on the Greenwich, while Quito is located to the west side of the Greenwich directly on the equator.
It is important to note that Rio de Janeiro and Riyadh are almost located on a symmetric location with respect to the Greenwich and equator. Rio de Janeiro has a tropical climate, while the climate of Riyadh is characterized as dry [78,79]. London and Quito have moist subtropical climates [78,79,80]. In particular, the choice of including Riyadh and London in the study is to analyse the impact of differing climate conditions between the cities, where other performance parameters are near identical, on the total sum of EO of PV modules.

5.1. Size of the Case Study

The case study of this work examines the installation of 100 PV modules, considering two types of 100 W PV modules of the first generation systems, namely poly-crystalline (p-Si) and mono-crystalline (mono-Si), that are commonly adopted worldwide. The parametric analysis considers a range of different inclinations of PV modules mounted on roofs and elevations, which is subsequently incremented by 10° (0, 10, 20, 30, 40, 50, and 60°) based on the four cardinal directions (i.e., North, South, East, and West). An option of integrating PV modules on the exterior walls of elevations at a vertical inclination (90°) was also examined.

5.2. Inventory of Database

The inventory of the database focuses on the operation phase of the case study and was constructed through three main steps based on the guidelines provided in Section 4.
First, the assigned design factors that were determined in the case study, Table 2, were integrated into a linear statistical regression using Minitab software to cover all the expected variables of the experimental design, using three factors within different levels. This is known as a mixed-level design or general full factorial design [14]. The first factor is the PV type (PVT), consisting of two levels which consider the most known types of PV modules of the first generation system (p-Si and mono-Si). The second factor is the PV orientation (PVO), which consists of four levels, associated with the four cardinal directions. The third factor is the PV inclination (PVI), which is considered via two scenarios, namely scenario A and scenario B. Scenario A is associated with seven levels while scenario B is comprised of eight levels; both scenarios consider the various inclinations between the horizontal and vertical positioning of the installation of PV modules within an increment of 10°, as displayed in Table 2. However, this step considers the same distances between the PV modules, disregarding the shading impacts.
The model for such an experiment analysis is presented in Equation (2). The number of sequences for each experiment based on a single iteration will be the result of multiplying the number of levels associated with each factorial design considered within a single analysis together [81]. As an example, the number of sequences that are required to cover all the expected variables on roof mounting installations is 56 (2 × 4 × 7) whereas at elevation, it is 64 (2 × 4 × 8). Applying Equation (2) in the case study example of this work results in the following:
ΕO = β0 + β1.ΡVT + β2.ΡVO + β3.ΡVI + β12.ΡVT × ΡVO + β13.ΡVT × ΡVI + β23.ΡVO × ΡVI + β123.ΡVT × ΡVO × ΡVI + ϵ.
An interaction between the assigned factors that are defining the functional unit is achieved to simulate all expected variables. The effects of such interaction are found only by the use of a statistical factorial design technique, as described in the work of Fegade et al. [73]. The EO response based on the main effects of PVT, PVO, and PVI is captured, in terms of (PVT × PVO), (PVT × PVI), (PVO × PVI), and (PVT × PVO × PVI); these terms were included to consider all possible interactions between the main variables. The constant, β0, is the response of EO when all main effects are equal to 0, while β 1 , β 2 , β 3 , β 12 , β 13 , β 23 , and β 123 denote the unknown parameters to be estimated. The variable, ϵ, refers to the experimental error.
Second, PV*Sol software was applied to estimate the EO of PV modules based on the running sequences that were previously built in the regression model. At this step, the database for each sequence was constructed individually. This means that a total of 120 ( 56   ( for   roof mounted   installements ) + 64 ( for   elevation   installment ) ) separate analyses were performed in this software.
Third, the collected results in the PV*Sol software were integrated into Minitab software in order to evaluate the collected data and estimate the coefficients of the various effects of design factors, based on the EO of PV modules in the chosen cities. Furthermore, an additional and more specific examination of the EO of PV modules mounted on roofs was conducted based on the best geographic orientation of PV modules and the range of optimum inclinations in the chosen cities. This additional examination applied the same PV types as mentioned in Table 2, while it only considered the PV orientations that would optimize the EO of PV modules for each city, individually, taking into consideration a 1° increment to the inclination angle in order to quantify the best choice for positioning the PV modules.

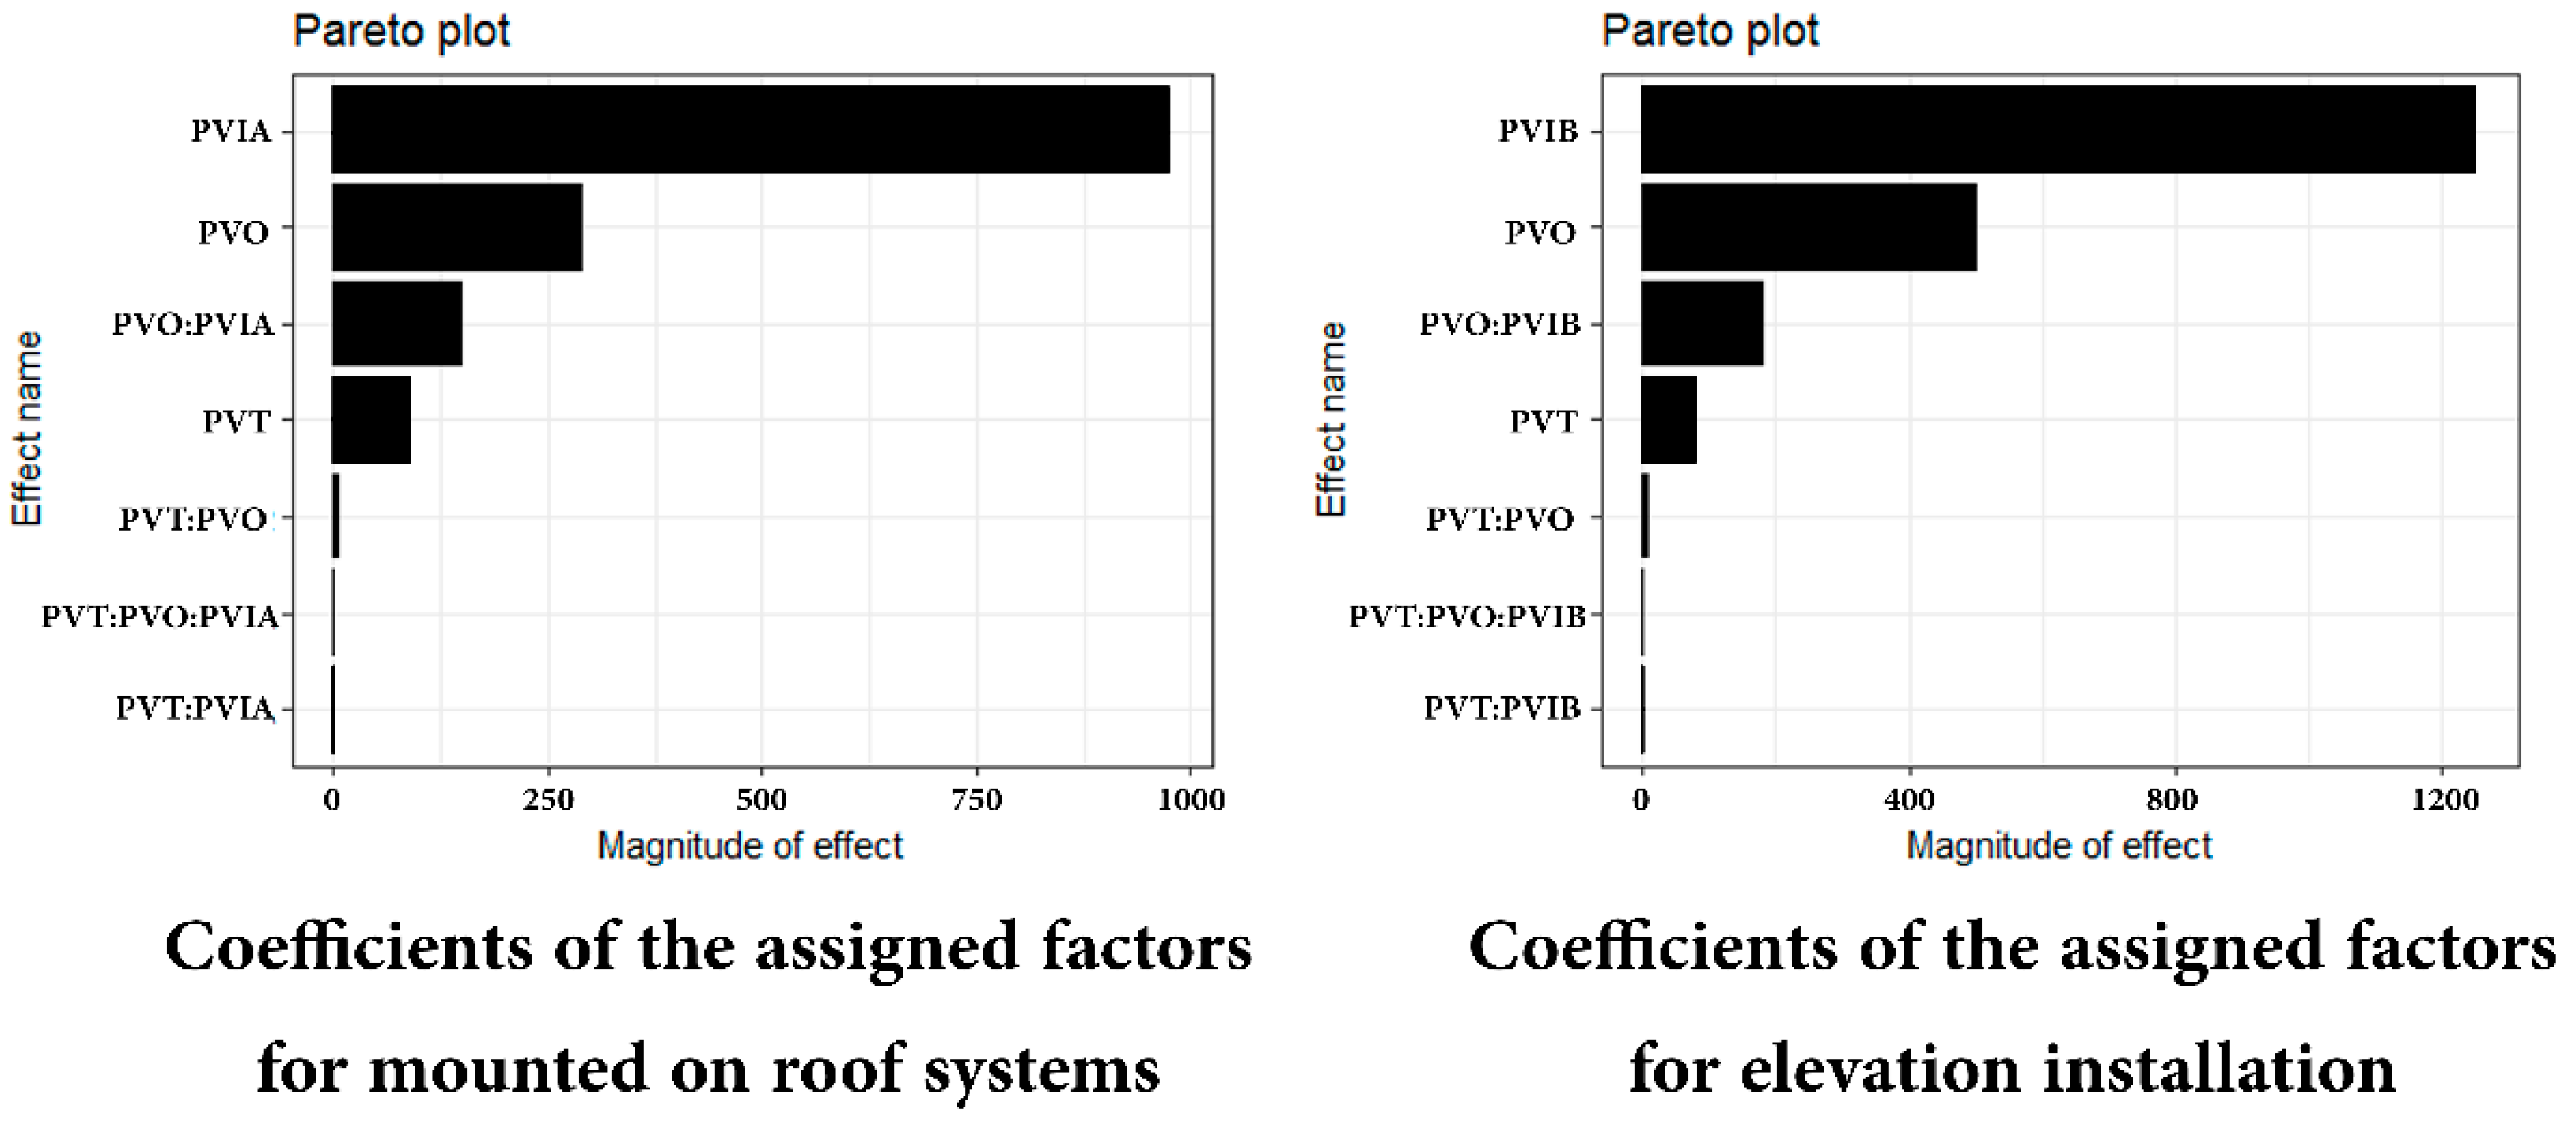
5.3. Assessment of Design Factors

The experimental design was applied at this level of the analysis to clarify the various effects of the assigned design factors. Table 3 and Table 4 present the estimated values of the EO of PV modules in a complete BIPV system mounted on roofs and elevations, respectively.
The results of the regression equation, regression errors, and coefficients are fully presented in the supplementary file. Moreover, the supplementary file illustrates the main effects plot of installing PV modules on mounted roofs (Figures S1–S4) and elevations (Figures S5–S8). The presented information in this file shows that there is no error (error = 0) in building up the analysis of variance in the four examined cities. The estimated coefficients of the assigned factorial designs, which are shown in Figure 4, were analysed in Minitab software based on the collected EO results in the four cities. Figure 4 indicates the factors that have the most influence on the energy efficiency of the PV modules, where PVIA and PVIB refer to the factorial impact of the PV inclination based on scenarios A and B, respectively; PVO refers to the factorial impact of the PV orientation; PVT refers to the factorial impact of the PV type; PVO:PVIA and PVO:PVIB refer to the factorial impact of the interaction between the PV orientation and PV inclination based on scenarios A and B, respectively; PVT:PVIA and PVT:PVIB refer to the factorial impact of the interaction between the PV type and PV inclination based on scenarios A and B, respectively; PVT:PVO refers to the factorial impact of the interaction between the PV type and PV orientation; and PVT:PVT:PVIA and PVT:PVT:PVIB refer to the factorial impact of the interaction between the PV type, PV orientation, and PV inclination based on scenarios A and B, respectively. As can be noticed from Figure 4, PVIA and PVIB have the highest influence regarding the generation of EO for roof mounted instalment and elevations, respectively, while PVO is the second factor that could affect the EO in such models. The third factor that could affect the EO of PV modules is the interaction between the orientation and inclination, while the lowest one is the interaction between the type and the inclination. Yet, the type of PV modules comes as the fourth factor that could influence the EO of PV modules.

5.4. Evaluation of Results

After classifying and evaluating the results collected in the previous section, the aim is to highlight the best geographic orientation and inclination of PV modules that would increase the EO of the functional unit. Table 3 and Table 4 display the results of the EO of PV modules that were installed in a complete BIPV system in the four examined cities. However, Figure 5 and Figure 6 illustrate the same results in a way to facilitate the comparison of EO of PV modules between these cities. The two figures show that the installation of PV modules mounted on the roof would generate more EO than the installation of modules on elevations. Besides, they illustrate that the sequence number (9, 10, 17, 18, 25, and 26) maximizes the EO of PV modules in Rio de Janeiro. The sequence number (11, 12, 19, 20, 27, and 28) maximizes the EO of PV modules in Riyadh. The sequence number (27, 28, 35, 36, 43, and 44) maximizes the EO of PV modules in London. The sequence number (1, 2, 3, 4, 5, 6, 7, and 8) maximizes the EO of PV modules in Quito.
The analysis of the collected results presented in Figure 5 and Figure 6 and the main effects plot for each city presented in the supplementary file (Figures S1–S8) are shown in Table 5, which identifies the basic conclusions yielded from the collected results in the case study. Several performance parameters are required to be considered in order to install PV modules in a complete BIPV system such as latitude, climate data, and building modelling. For example, the EO of PV modules increases in higher global annual irradiation sites and vice versa [82,83]. Table 5 illustrates that the vertical installation of PV modules on elevations is the worst inclination to maximize the EO. Moreover, it shows the best and worst geographic orientation for PV modules on roof mounting systems, and the preferable elevation of the building to install these modules in each city as follows:
In Rio de Janeiro, positioning PV modules towards the North orientation within a range of inclinations between 10° and 30° for mounted roof systems and elevations would maximize the EO of PV modules, while the South geographic orientation is the worst for the same installation. The Northern façade is the best orientation for installing PV modules, while the Eastern and Western façades are the second and third preferable orientations, respectively.
In Riyadh, positioning the PV modules at the Southern orientation within a range of inclinations between 10° and 30° for mounted roof systems and elevations would maximize the EO of PV modules, while the North geographic orientation is the worst for the same installation. The Southern façade is the best orientation to install PV modules, while the Eastern and Western façades are the second and third preferable ones, respectively.
In London, positioning the PV modules at the Southern orientation within a range of inclinations between 30° and 50° for mounted roof systems and elevations would maximize the EO of PV modules, while the North geographic orientation is the worst for the same installation. The Southern façade is the best orientation for installing PV modules, while the Western and Eastern façades are the second and third preferable elevations, respectively. It is estimated that the EO of PV modules installed on any of these facades is equal.
In Quito, positioning PV modules to the East and West geographic orientation for roofs and elevations would maximize the EO of PV modules, while the North and South geographic orientation are the worst orientations at which to install PV modules. However, the horizontal positioning of PV modules installed on roofs and elevations would maximize the EO of these modules. East and West façades are preferable for the installation of PV modules rather than other elevations. It must be noted that the EO of PV modules based on various geographic orientations is significantly smaller than in the other cities analysed in the case study.
On the other hand, Figure 4 illustrates the results of the regression analysis, which evaluated the coefficients of the assigned design factors of the functional unit of this work. It shows that the impact of PV inclination is the main factor that highly affects energy generation in a BIPV system, whether it be mounted on roofs or elevations. This means that the choice of a proper inclination will increase the energy efficiency in PV modules. The impact of the PV orientation is the second main factor that affects the energy generation in a BIPV system, while the third important factor is the interaction between both the inclination and geographic orientation of PV modules. The impact of the PV type is the fourth important factor that influences energy generation in PV modules. However, the impacts of other interactions between PV types, PV orientation, and PV inclination are the lowest coefficient factors that would stimulate the EO of PV modules and can be neglected. This point was confirmed by analysing the figures presented in the supplementary file (Figures S1–S8). It must be noted that p-Si and mono-Si have a slight impact on influencing energy generation compared to the PV orientation. Yet, PV inclination is the main factor that could significantly influence energy generation.

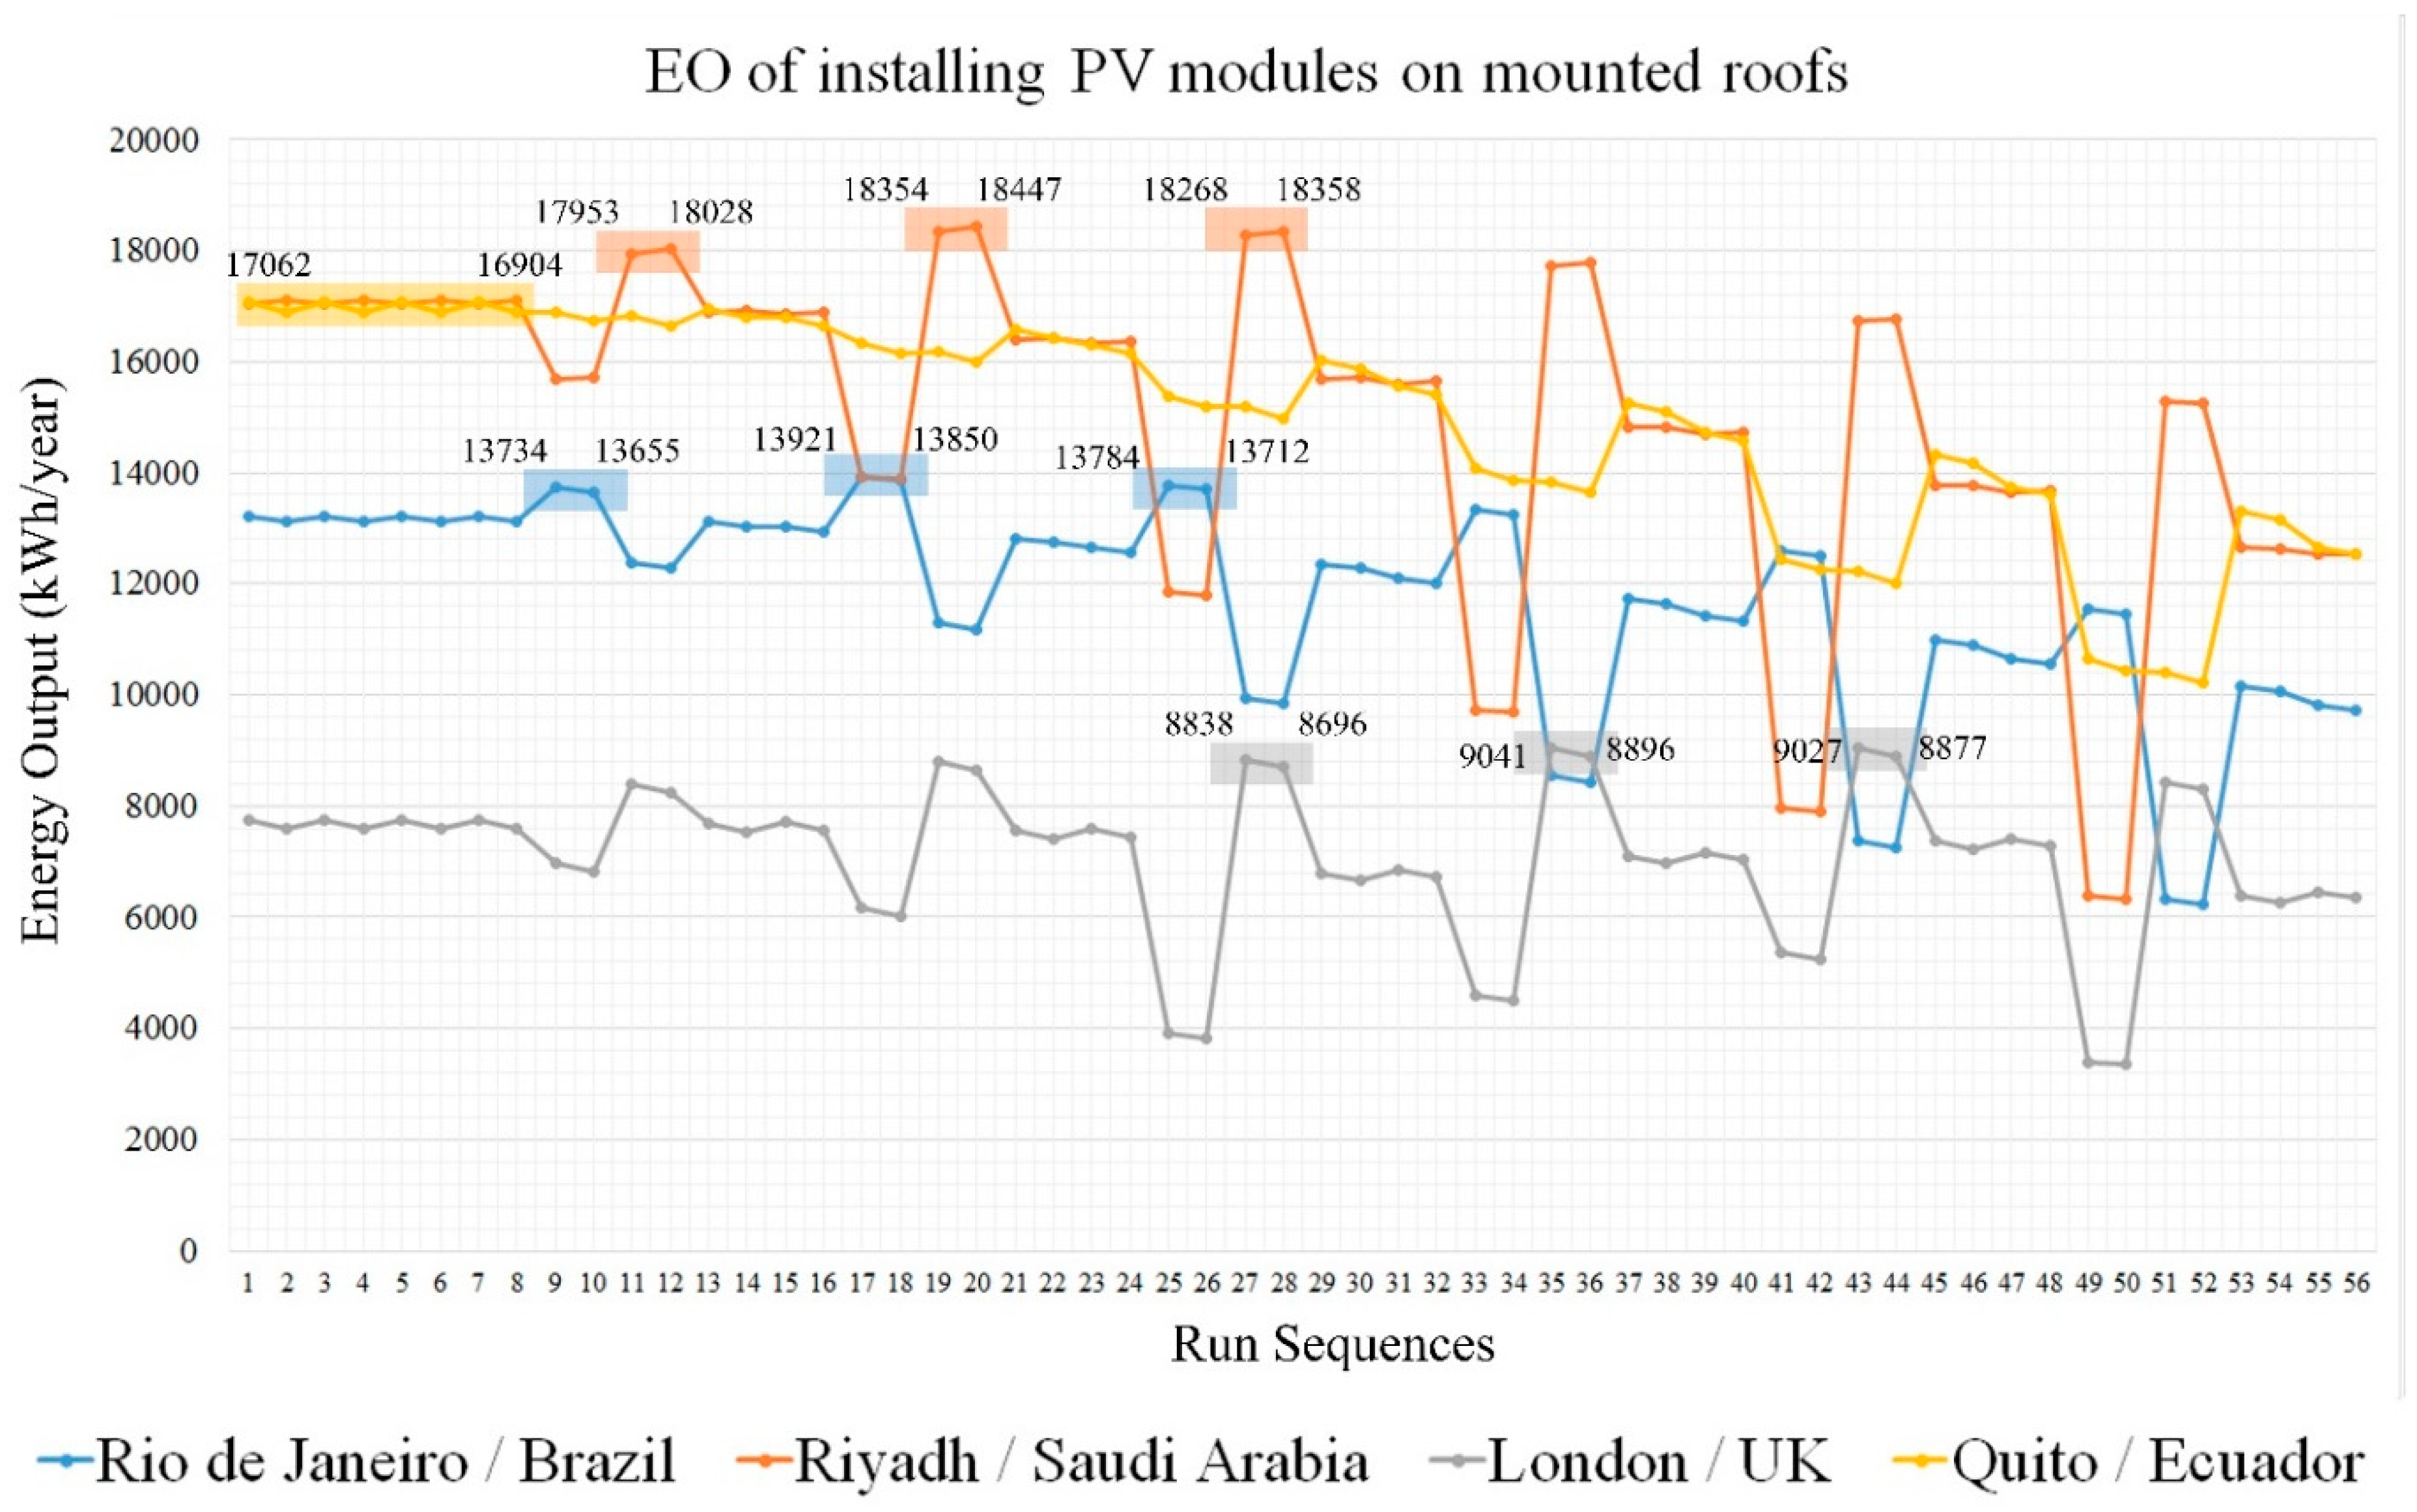
5.5. Additional Roof Mounted Analysis
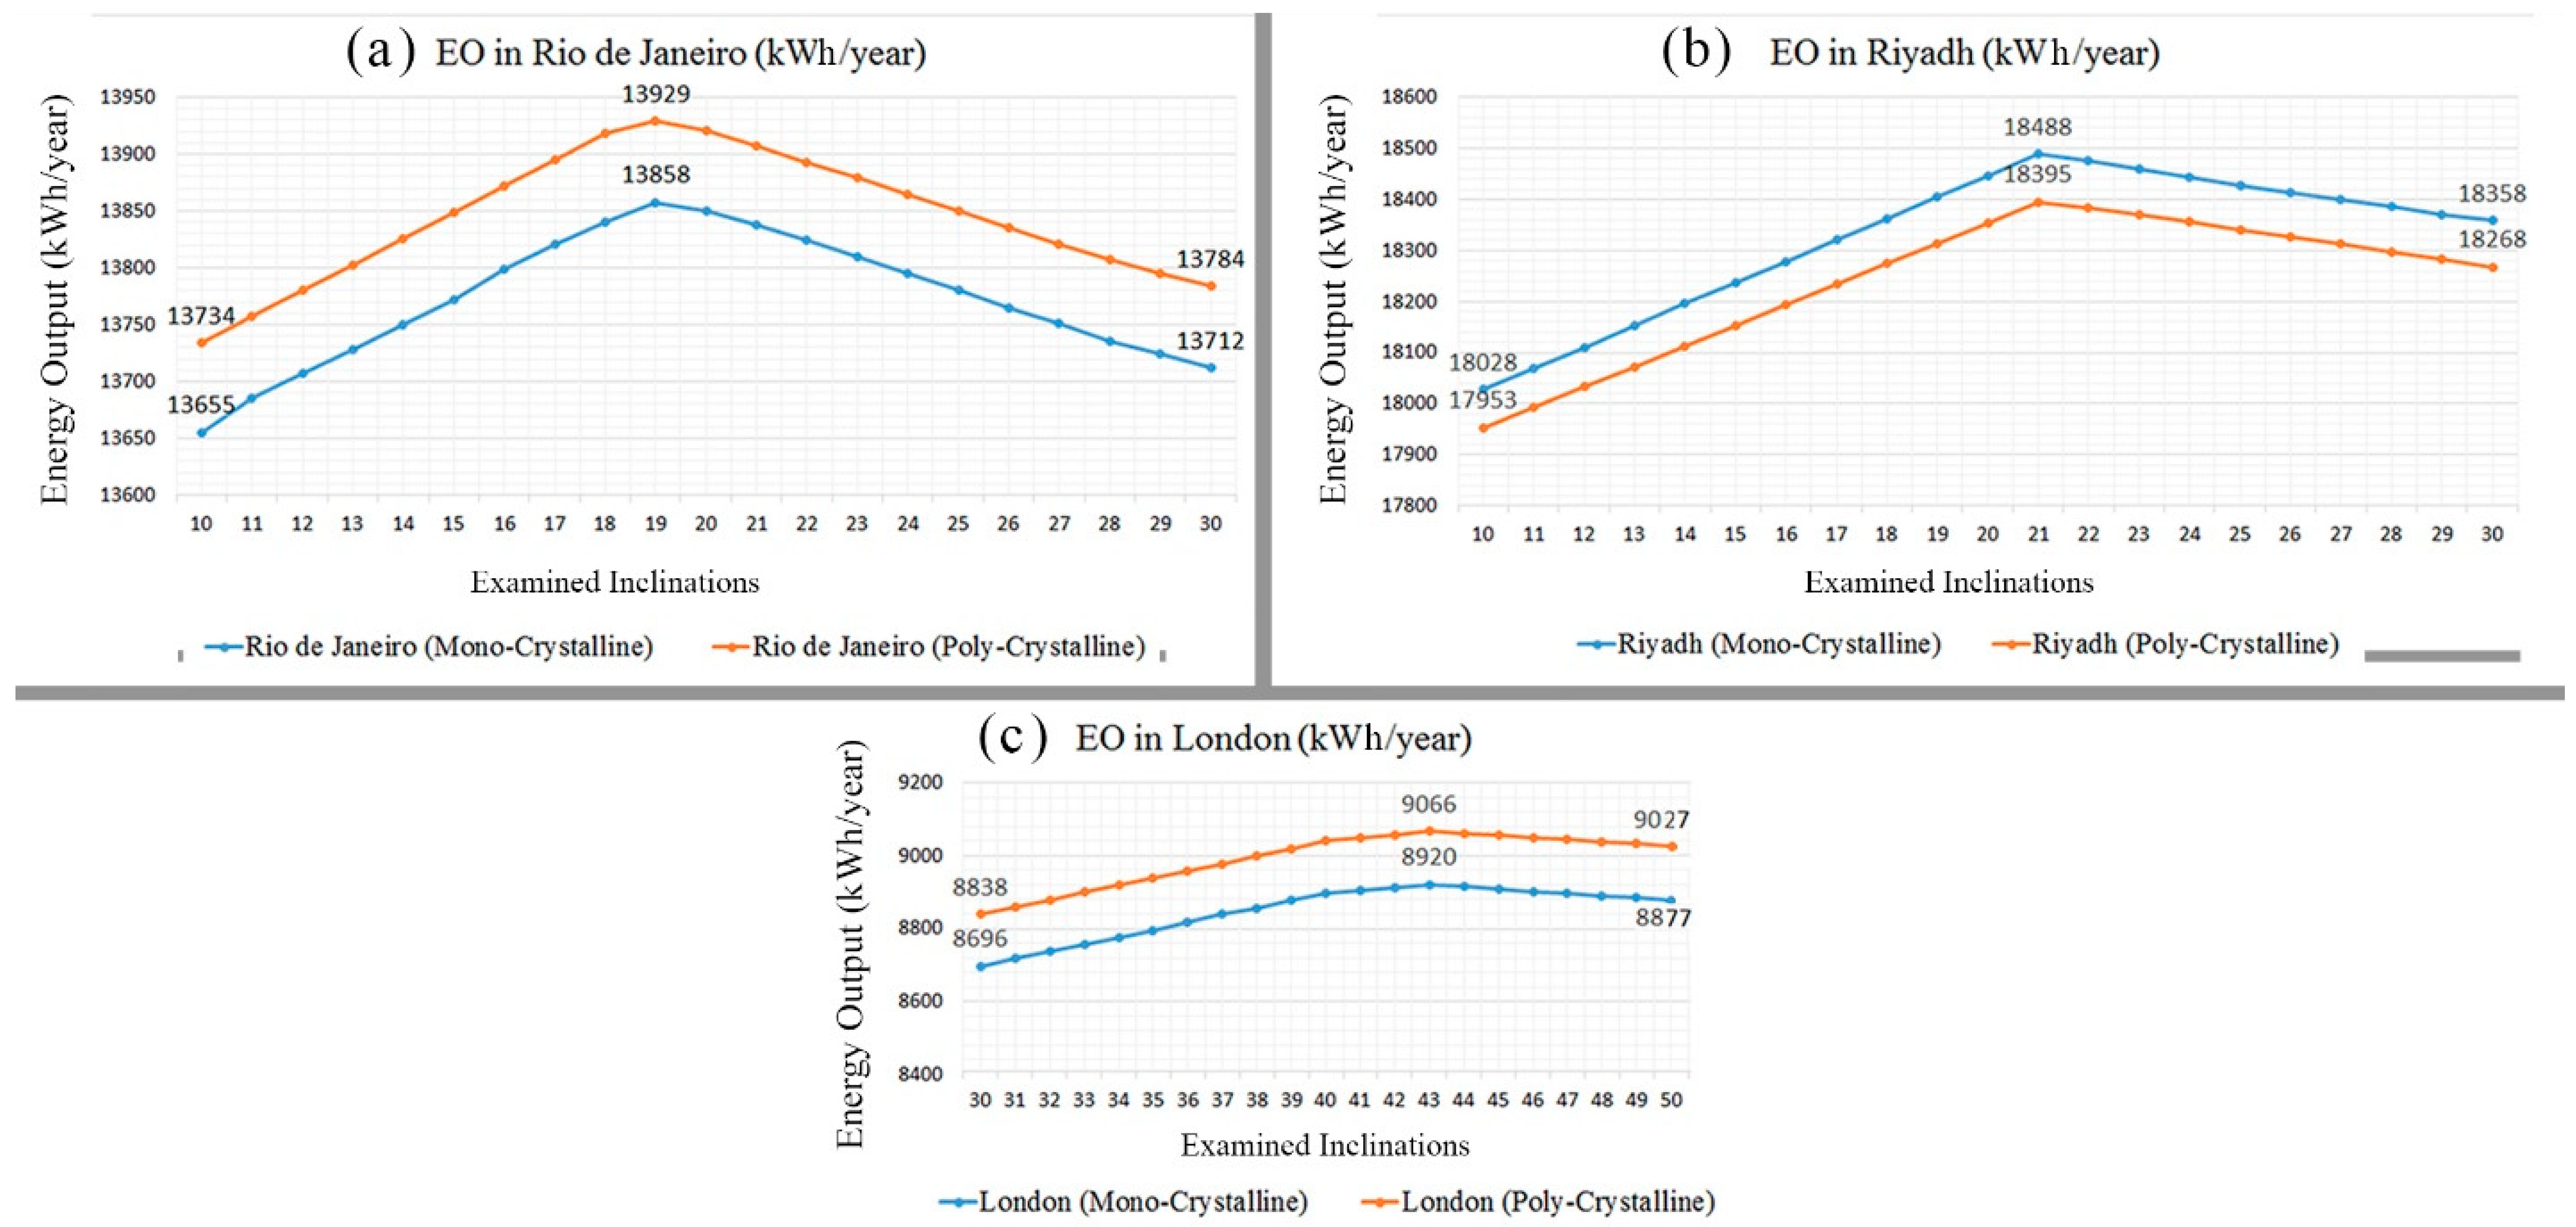
An additional specific examination of the EO of PV modules mounted on roofs was conducted based on the best geographic orientation of PV modules and the range of preferable inclinations in the examined cities. The need for this analysis is due to the aim of defining the specific inclinations that would maximize the EO of PV modules. The city of Quito was excluded from this analysis as Table 5 shows that the horizontal installation of PV modules is the best geographic orientation associated with the city.
The examination was conducted for the other three cities using a subsequent increment of 1° in order to quantify the best angle for positioning PV modules, as shown in Figure 7. The analysis of Rio de Janeiro (a) and Riyadh (b) included 21 frequent inclinations between 10° and 30° within the Northern and Southern geographic orientations, respectively, while the analysis of the city of London (c) included 21 frequent inclinations between 30° and 50° within a Southern geographic orientation. According to this additional analysis, Figure 7 illustrates the best inclination that would optimize the annual EO of PV modules and the proportion of (inclination/latitude), which is evaluated as previously outlined in Section 2.2, as follows:
(a)
In Rio de Janeiro, the best inclination is 19°. The EO equals 13,929 kWh/year and 13,858 kWh/year for poly-crystalline and mono-crystalline, respectively, with a proportion of around 86%. The installation of PV modules within 10° or 30° will cause an annual energy waste of 195 and 145 kWh, respectively, using poly-crystalline modules, and 203 and 146 kWh, respectively, using mono-crystalline modules.
(b)
In Riyadh, the best inclination is 21°. The EO equals 18,395 kWh/year and 18,488 kWh/year for poly-crystalline and mono-crystalline, respectively, with a proportion of 87%. The installation of PV modules within 10° or 30° will cause an annual energy waste of 442 and 127 kWh, respectively, using poly-crystalline modules, and 460 and 130 kWh, respectively, using mono-crystalline modules.
(c)
In London, the best inclination is 43°. The EO equals 9066 kWh/year and 8920 kWh/year for poly-crystalline and mono-crystalline, respectively, with a proportion of 84%. The installation of PV modules within 30° or 50° will cause an annual energy waste of 228 and 634 kWh, respectively, using poly-crystalline modules, and 224 and 629 kWh, respectively, using mono-crystalline modules.

6. Discussion

Analysis of the results of this work illustrate that the performance parameters (building modelling, climate data, and the installation variables) and their related design factors in the proposed framework using the experimental design can significantly evaluate the EO of PV modules. Additionally, this work clarifies that the impact of the PV type is the lowest coefficient factor that could influence energy generation. However, the impact of the PV inclination is the main coefficient factor that influences the process of producing energy in PV modules, while the impact of the PV orientation is considered the second main coefficient factor that simulates energy generation; Figures S1–S8 in the supplementary file have proven this point.
This work indicates that the geographic orientation of PV modules towards the Southern orientation is ideal for cities located North of the Equator while positioning PV modules at a Northern orientation is ideal for cities located South of the Equator. As expected, this means that PV modules should be oriented towards the equator line, however, the installation of PV modules on the East and West elevations of buildings would maximize the EO of PV modules in lower latitude regions close to the equator. In terms of PV inclination, the integration of PV modules on the exterior walls of buildings within a vertical inclination would produce the minimum EO in the four cities. The case study example confirms this point, as shown in Figure 8. It is clear that there would be a loss of one-third to almost one-half of the EO when PV modules are integrated on the exterior walls of buildings within a vertical inclination compared to the preferable inclinations of PV modules for each city: 46.61% in Rio de Janeiro, 49.36% in Riyadh, 31.51% in London, and 42.88% in Quito. This proves that the vertical installation of PV modules on elevations is the worst inclination compared to the preferable inclination for each region, in terms of maximizing the EO of these modules.
It must be noted that the installation of PV modules mounted on the roof is better than the elevation to maximize the EO of these modules. The results associated with the installation of PV modules in buildings located in Rio de Janeiro and Riyadh, which are situated at almost symmetric latitudes, show that the best inclination that increases the EO of PV modules is between 10° and 30°. This inclination increases to be between 30° and 50° in the city of London, while the horizontal inclination is suggested as the best position of PV modules for the city of Quito, which is located directly on the equator. Specifically, the installation of PV modules at inclinations of 0, 19, 21, and 43° would maximise the EO of PV modules in Quito, Rio de Janeiro, Riyadh, and London, respectively. As a result, this work considers that the closer we get towards the equator, the lower the preferred inclination angles for the installation of PV modules. Consequently, comparing the collected results at this level of the analysis with the work of Gunerhan and Hepbasli [45], Benghanem [46], and Landau [47], presented in the literature review, reveals that PV modules should be oriented towards the equator line at inclinations almost equal to the latitude of the site, in the range of {(0.85 × Latitde_of_the_site) ∓ 3%}.

7. Conclusions

It is important to consider the energy performance of PV modules in order to enhance the sustainability of the built environment towards nZEBs. In an attempt to design better energy performing PV modules, the work in this study presented a methodological framework that could help to integrate the experimental design within the installation variable of PV modules in order to examine all possible design variables that influence the energy levels of these modules. The novelty of this work is in the establishment of a framework that captures performance parameters and design factors that determine the design energy efficiency of PV modules in a complete BIPV system. An emphasis was placed on the use of a standard procedure and software, making the work readily available to practitioners and experts in the area of renewable energy. An integrated methodological framework, which considers various performance parameters and related design factors, based on the experimental design was presented in order to empower the decision-making process of PV module installation. This work considers that improvements of the EO efficiency of PV modules as a major source of renewable energy in buildings has the potential to satisfy the increasing requirements of electricity and, consequently, reduce the dependence on fossil fuels, thus achieving sustainability and protection of the built environment.
A case study of 100 PV modules was examined in four cities, each with a different climate, through the use of an experimental design. The cities analysed included Rio de Janeiro, Riyadh, London, and Quito. First generation PV modules were studied, namely mono-crystalline and poly-crystalline modules. These modules were integrated into a complete BIPV system at different inclinations and geographic orientations. PV*Sol software was adopted as an analysis and planning tool in order to estimate the output energy of PV modules. Minitab software was utilized to build up the experimental design, estimate all the expected variables, and to conduct a linear regression analysis to define the coefficients of the assigned design factors.
It is envisaged that the proposed method will empower the decision-making process and sustainability of the installation of PV modules in a complete BIPV system. The results indicate that the performance parameters suggested in the framework significantly impact the maximization of the EO of PV modules. These parameters include the type of building design (i.e., the design of the final roof and elevations), the climate data, in addition to installation variables, such as the PV type, PV orientation, and PV inclination. Among the applied installation variables of this work, it must be noted that the impact of PV inclination was the major coefficient factor influencing energy generation; the impact of PV orientation was the second coefficient factor influencing energy generation; while the impact of PV type was the lowest coefficient factor influencing the energy generation of PV modules. Yet, it was found that the installation of PV modules on roofs would generate more EO compared to the elevation installation, however, the integration of PV modules on the exterior walls of buildings at a vertical inclination produces the minimum EO compared to other configurations in all cities; between 30% and 50% of the EO of PV modules would not be efficient if PV modules were integrated on the exterior walls compared to the mounted roofs of buildings. The results also display that the global positioning of PV modules in buildings should be towards the equator line. The installation of PV modules on the East and West elevations of buildings are preferable in locations close to the equator. However, it is preferable that PV modules are installed at lower inclinations, in cities close to the equator line. Maximizing the EO of PV modules requires positioning PV modules at inclinations almost equal to the latitude of the site, in the range of {(0.85 × Latitde_of_the_site) ∓ 3%}.
This work has three major limitations. First, the case example examined the first generation of PV modules, mounted on roofs and elevations of buildings, thus neglecting the important role of building modelling, in particular, the design of the elevations and roof, in determining the amount of the installed PV modules. Second, it disregarded the possible shadows on the functional unit; shadows have a negative impact on solar systems. Hence, multi-criteria decision analysis (MCDA) can be a viable direction for future works as a way to assess the other generations of PV modules and explicitly evaluate the conflicting criteria of the elevations and roof design. The third limitation is that building up the sequences of the experimental design in the PV*Sol software required that the same data and variables were entered for every sequence, which means plenty of time was consumed building up the case study. Hence, a future recommendation is the use of different software that facilitates entering the input data and saves time.

Supplementary Materials

The following are available online at https://0-www-mdpi-com.brum.beds.ac.uk/2071-1050/11/10/2992/s1, Figure S1. Main effects plot of installing PV modules on mounted roofs for Rio de Janeiro, Figure S2. Main effects plot of installing PV modules on mounted roofs for Riyadh, Figure S3. Main effects plot of installing PV modules on mounted roofs for London, Figure S4. Main effects plot of installing PV modules on mounted roofs for Quito, Figure S5. Main effects plot of installing PV modules on elevations for Rio de Janeiro, Figure S6. Main effects plot of installing PV modules on elevations for Riyadh, Figure S7. Main effects plot of installing PV modules on elevations for London, Figure S8. Main effects plot of installing PV modules on elevations for Quito.

Author Contributions

Data curation, A.W.A.H.; Formal analysis, E.L.Q. and A.H.; Funding acquisition, E.L.Q. and A.H.; Methodology, M.K.N. and A.W.A.H.; Resources, M.K.N.; Software, M.K.N.; Supervision, A.H.; Validation, E.L.Q., D.B. and A.H.; Writing—original draft, M.K.N.

Funding

This research was funded by Departamento de Construção Civil / UFRJ.

Acknowledgments

The authors want to acknowledge the financial support from CAPES Foundation (Coordination for the Improvement of Higher Education Personnel)—Finance Code 001, and CNPq (Brazilian National Council for Scientific and Technological Development) grant number [307084/2015-9]. The authors acknowledge the financial support from the Spanish Ministry of Economy and Competitiveness (RTI2018-093849-B-C33 (MINECO/FEDER).

Conflicts of Interest

The authors declare no conflicts of interest.

References

  1. Akbarnezhad, A.; Xiao, J. Estimation and minimization of embodied carbon of buildings: A review. Buildings 2017, 7, 5. [Google Scholar] [CrossRef]
  2. UNEP. Towards Zero-EmissionEfficient and Resilient Buildings; United Nations Environment Programme: Nairobi, Kenya, 2016. [Google Scholar]
  3. You, H.; Fang, H.; Wang, X.; Fang, S. Environmental efficiency of photovoltaic power plants in China—A comparative study of different economic zones and plant types. Sustainability 2018, 10, 2551. [Google Scholar] [CrossRef]
  4. UNEP. Buildings and Climate Change. Summary for Decision-Makers; United Nations Environment Programme: Nairobi, Kenya, 2009. [Google Scholar]
  5. The World Bank. Access to Electricity. 2014. Available online: https://data.worldbank.org/indicator/EG.ELC.ACCS.ZS (accessed on 27 April 2019).
  6. Najjar, M.K.; Tam, V.W.Y.; Torres, L.; Gregorio, D.; Catarina, A.; Evangelista, J.; Hammad, A.W.A.; Haddad, A. Integrating parametric analysis with building information modeling to improve energy performance of construction projects. Energies 2019, 12, 1515. [Google Scholar] [CrossRef]
  7. Konneh, D.A.; Or, H.; Howlader, R.; Shigenobu, R. A multi-criteria decision maker for grid-connected hybrid renewable energy systems selection using multi-objective particle swarm optimization. Sustainability 2019, 11, 1188. [Google Scholar] [CrossRef]
  8. Shouman, E.R. International and national renewable energy for electricity with optimal cost effective for electricity in Egypt. Renew. Sustain. Energy Rev. 2017, 77, 916–923. [Google Scholar] [CrossRef]
  9. Short-Term Energy Outlook (STEO); U.S. Energy Information Administration: Washington, DC, USA, 2017.
  10. Giannini, M.; Farias, C.; Aurélio, M.; Freitas, V.; Fidelis, N. The renewable energy market in Brazil: Current status and potential. Renew. Sustain. Energy Rev. 2012, 16, 3786–3802. [Google Scholar] [CrossRef]
  11. Kim, S.; Song, Y.; Sung, Y.; Seo, D. Development of a consecutive occupancy estimation framework for improving the energy demand prediction performance of building energy. Energies 2019, 12, 433. [Google Scholar] [CrossRef]
  12. Alsafasfeh, Q.; Saraereh, O.A.; Khan, I. Solar PV grid power flow analysis. Sustainability 2019, 11, 1744. [Google Scholar] [CrossRef]
  13. Yu, C.; Khoo, Y.S.; Chai, J.; Han, S.; Yao, J. Optimal orientation and tilt angle for maximizing in-plane solar irradiation for PV applications in Japan. Sustainability 2019, 11, 2016. [Google Scholar] [CrossRef]
  14. National Institute of Standards and Technology (NIST SEMATECH). e-Handbook of Statistical Methods. 2006. Available online: https://www.itl.nist.gov/div898/handbook/ (accessed on 27 April 2019).
  15. Valentin Software. PV*SOL Premium. 2015. Available online: https://www.valentin-software.com/en/products/photovoltaics/57/pvsol-premium (accessed on 27 April 2019).
  16. Pagliaro, M.; Ciriminna, R.; Palmisano, G. BIPV: Merging the photovoltaic with the construction industry. Prog. Photovolt. Res. Appl. 2010, 18, 61–72. [Google Scholar] [CrossRef]
  17. Hagemann, I.B. New perspectives for BIPV with dye solar cells (DSC). In Proceedings of the 2nd DSC Industrialization Conference, St Gallen, Switzerland, 11–13 September 2007. [Google Scholar]
  18. Biyik, E.; Araz, M.; Hepbasli, A.; Shahrestani, M.; Yao, R.; Shao, L.; Essah, E.; Oliveira, A.C.; del Caño, T.; Rico, E.; et al. A key review of building integrated photovoltaic (BIPV) systems. Eng. Sci. Technol. Int. J. 2017, 20, 833–858. [Google Scholar] [CrossRef]
  19. International Renewable Energy Agency. Renewable Energy Technologies: Cost Analysis Series; International Renewable Energy Agency: Bonn, Germany, 2012; Volume 1. [Google Scholar]
  20. Strong, S. Building Integrated Photovoltaics (BIPV). Whole Building Design Guide (WBDG). 2016. Available online: http://www.wbdg.org/resources/building-integrated-photovoltaics-bipv (accessed on 24 April 2019).
  21. Bhandari, K.P.; Collier, J.M.; Ellingson, R.J.; Apul, D.S. Energy payback time (EPBT) and energy return on energy invested (EROI) of solar photovoltaic systems: A systematic review and meta-analysis. Renew. Sustain. Energy Rev. 2015, 47, 133–141. [Google Scholar] [CrossRef]
  22. European Commission. Strategic Energy Technologies Information System. Available online: https://setis.ec.europa.eu/technologies/photovoltaics (accessed on 27 April 2019).
  23. Green Match. Types of Solar Panels. Available online: https://www.greenmatch.co.uk/blog/2015/09/types-of-solar-panels (accessed on 21 April 2019).
  24. Ranabhat, K.; Patrikeev, L.; Revina, A.A.; Andrianov, K.; Lapshinsky, V.; Sofronova, E. An introduction to solar cell technology. J. Appl. Eng. Sci. 2016, 14, 481–491. [Google Scholar] [CrossRef] [Green Version]
  25. Fthenakis, V. Third Generation Photovoltaics; InTech Open: Rijeka, Croatia, 2012. [Google Scholar]
  26. Gulkowski, S.; Zdyb, A.; Dragan, P. Experimental efficiency analysis of a photovoltaic system with different module technologies under temperate climate conditions. Appl. Sci. 2019, 9, 141. [Google Scholar] [CrossRef]
  27. Dai, Q.; Liu, J.; Wei, Q. Optimal photovoltaic/battery energy storage/electric vehicle charging station design based on multi-agent particle swarm optimization algorithm. Sustainability 2019, 11, 1973. [Google Scholar] [CrossRef]
  28. Whitaker, C.; Newmiller, J.; Ropp, M.; Norris, B. Renewable Systems Interconnection Study: Distributed Photovoltaic Systems Design and Technology Requirements; Sandia National Laboratories: Livermore, CA, USA, 2008. [Google Scholar]
  29. Eltawil, M.A.; Zhao, Z. Grid-connected photovoltaic power systems: Technical and potential problems—A review. Renew. Sustain. Energy Rev. 2010, 14, 112–129. [Google Scholar] [CrossRef]
  30. Scognamiglio, A. Building-Integrated Photovoltaics (BIPV) for cost-effective energy-efficient retrofitting. In Cost-Effective Energy Efficient Building Retrofitting: Materials, Technologies, Optimization and Case Studies; Pacheco-Torgal, F., Granqvist, C., Jelle, B., Vanoli, G., Bianco, N., Kurnitski, J., Eds.; Elsevier: Amsterdam, The Netherlands, 2017. [Google Scholar]
  31. American Physical Society Panel on Public Affairs. Integrating Renewable Electricity on the Grid; American Physical Society Panel on Public Affairs: College Park, MD, USA, 2010. [Google Scholar]
  32. Murphy, F.; McDonnell, K. A feasibility assessment of photovoltaic power systems in Ireland; A case study for the Dublin region. Sustainability (Switzerland) 2017, 9, 302. [Google Scholar] [CrossRef]
  33. Couture, T.; Gagnon, Y. An analysis of feed-in tariff remuneration models: Implications for renewable energy investment. Energy Policy 2010, 38, 955–965. [Google Scholar] [CrossRef]
  34. Fouad, M.M.; Shihata, L.A.; Morgan, E.I. An integrated review of factors influencing the performance of photovoltaic panels. Renew. Sustain. Energy Rev. 2017, 80, 1499–1511. [Google Scholar] [CrossRef]
  35. D’Adamo, I. The profitability of residential photovoltaic systems. A new scheme of subsidies based on the price of CO2 in a developed PV market. Soc. Sci. 2018, 7, 148. [Google Scholar] [CrossRef]
  36. Ferreira, A.; Kunh, S.S.; Fagnani, K.C.; De Souza, T.A.; Tonezer, C.; Dos Santos, G.R.; Coimbra-Araújo, C.H. Economic overview of the use and production of photovoltaic solar energy in Brazil. Renew. Sustain. Energy Rev. 2018, 81, 181–191. [Google Scholar] [CrossRef]
  37. Khan, J.; Arsalan, M.H. Solar power technologies for sustainable electricity generation—A review. Renew. Sustain. Energy Rev. 2016, 55, 414–425. [Google Scholar] [CrossRef]
  38. Stropnik, R.; Stritih, U. Increasing the efficiency of PV panel with the use of PCM. Renew. Energy 2016, 97, 671–679. [Google Scholar] [CrossRef]
  39. Traverso, M.; Asdrubali, F.; Francia, A.; Finkbeiner, M. Towards life cycle sustainability assessment: An implementation to photovoltaic modules. Int. J. Life Cycle Assess. 2012, 17, 1068–1079. [Google Scholar] [CrossRef]
  40. Nayak, S.; Tiwari, G.N. Energy metrics of photovoltaic/thermal and earth air heat exchanger integrated greenhouse for different climatic conditions of India. Appl. Energy 2010, 87, 2984–2993. [Google Scholar] [CrossRef]
  41. Carstens, D.D.; dos Santos Carstens, D.D.; da Cunha, S.K. Challenges and opportunities for the growth of solar photovoltaic energy in Brazil. Energy Policy 2019, 125, 396–404. [Google Scholar] [CrossRef]
  42. Xu, R.; Ni, K.; Hu, Y.; Si, J.; Wen, H.; Yu, D. Analysis of the optimum tilt angle for a soiled PV panel. Energy Convers. Manag. 2017, 148, 100–109. [Google Scholar] [CrossRef]
  43. Kaddoura, T.O.; Ramli, M.A.M.; Al-turki, Y.A. On the estimation of the optimum tilt angle of PV panel in Saudi Arabia. Renew. Sustain. Energy Rev. 2016, 65, 626–634. [Google Scholar] [CrossRef]
  44. Han, S.; Kim, J. An optimization model to design and analysis of renewable energy supply strategies for residential sector. Renew. Energy 2017, 112, 222–234. [Google Scholar] [CrossRef]
  45. Gunerhan, H.; Hepbasli, A. Determination of the optimum tilt angle of solar collectors for building applications. Build. Environ. 2007, 42, 779–783. [Google Scholar] [CrossRef]
  46. Benghanem, M. Optimization of tilt angle for solar panel: Case study for Madinah, Saudi Arabia. Appl. Energy 2011, 88, 1427–1433. [Google Scholar] [CrossRef]
  47. Landau, C.R. Optimum Tilt of Solar Panels. 2015. Available online: http://www.solarpaneltilt.com/#other (accessed on 27 April 2019).
  48. Bellos, E.; Tzivanidis, C. Yearly performance of a hybrid PV operating with nanofluid. Renew. Energy 2017, 113, 867–884. [Google Scholar] [CrossRef]
  49. Hasan, A.; Sarwar, J.; Alnoman, H.; Abdelbaqi, S. Yearly energy performance of a photovoltaic-phase change material (PV-PCM) system in hot climate. Sol. Energy 2017, 146, 417–429. [Google Scholar] [CrossRef]
  50. Pillai, G.; Putrus, G.; Pearsall, N.; Georgitsioti, T. The effect of distribution network on the annual energy yield and economic performance of residential PV systems under high penetration. Renew. Energy 2017, 108, 144–155. [Google Scholar] [CrossRef] [Green Version]
  51. Kim, Y.H.; Lim, H.C. Effect of island topography and surface roughness on the estimation of annual energy production of offshore wind farms. Renew. Energy 2017, 103, 106–114. [Google Scholar] [CrossRef]
  52. Han, W.; Kim, J.; Kim, B. Effects of contamination and erosion at the leading edge of blade tip airfoils on the annual energy production of wind turbines. Renew. Energy 2018, 115, 817–823. [Google Scholar] [CrossRef]
  53. Autodesk Knowledge Network. Energy Use Intensity. Available online: https://knowledge.autodesk.com/support/revit-products/learn-explore/caas/CloudHelp/cloudhelp/2016/ENU/Revit-Analyze/files/GUID-DC115EA5-B157-4C00-82EC-72F6E947E69E-htm.html (accessed on 27 April 2019).
  54. Autodesk. PV Building Energy Offsets with Insight 360 Solar Analysis. Available online: http://blogs.autodesk.com/insight/pv-building-energy-offsets-with-insight-360-solar-analysis-2/ (accessed on 27 April 2019).
  55. Hazyuk, I.; Ghiaus, C.; Penhouet, D. Optimal temperature control of intermittently heated buildings using Model Predictive Control: Part I e Building modeling. Build. Environ. 2012, 51, 379–387. [Google Scholar] [CrossRef]
  56. Yuan, J.; Nian, V.; Su, B.; Meng, Q. A simultaneous calibration and parameter ranking method for building energy models. Appl. Energy 2017, 206, 657–666. [Google Scholar] [CrossRef]
  57. Perrone, D.; Filiatrault, A. Automation in Construction Automated seismic design of non-structural elements with building information modelling. Autom. Constr. 2017, 84, 166–175. [Google Scholar] [CrossRef]
  58. Cao, J.; Li, M.; Wang, M.; Xiong, M.; Meng, F. Effects of climate change on outdoor meteorological parameters for building energy-saving design in the different climate zones of China. Energy Build. 2017, 146, 65–72. [Google Scholar] [CrossRef]
  59. Nik, V.M. Application of typical and extreme weather data sets in the hygrothermal simulation of building components for future climate—A case study for a wooden frame wall. Energy Build. 2017, 154, 30–45. [Google Scholar] [CrossRef]
  60. Chilkoti, V.; Bolisetti, T.; Balachandar, R. Climate change impact assessment on hydropower generation using multi-model climate ensemble. Renew. Energy 2017, 109, 510–517. [Google Scholar] [CrossRef]
  61. Kaplani, E.; Kaplanis, S. Thermal modelling and experimental assessment of the dependence of PV module temperature on wind velocity and direction, module orientation and inclination. Sol. Energy 2014, 107, 443–460. [Google Scholar] [CrossRef] [Green Version]
  62. Litjens, G.B.M.A.; Worrell, E.; Van Sark, W.G.J.H.M. Influence of demand patterns on the optimal orientation of photovoltaic systems. Sol. Energy 2017, 155, 1002–1014. [Google Scholar] [CrossRef] [Green Version]
  63. Haghdadi, N.; Copper, J.; Bruce, A.; Macgill, I. A method to estimate the location and orientation of distributed photovoltaic systems from their generation output data. Renew. Energy 2017, 108, 390–400. [Google Scholar] [CrossRef]
  64. Hu, M.; Zheng, R.; Pei, G.; Wang, Y.; Li, J.; Ji, J. Experimental study of the effect of inclination angle on the thermal performance of heat pipe photovoltaic/thermal (PV/T) systems with wickless heat pipe and wire-meshed heat pipe. Appl. Therm. Eng. 2016, 106, 651–660. [Google Scholar] [CrossRef] [Green Version]
  65. Notton, G.; Lazarov, V.; Stoyanov, L. Optimal sizing of a grid-connected PV system for various PV module technologies and inclinations, inverter efficiency characteristics and locations. Renew. Energy 2010, 35, 541–554. [Google Scholar] [CrossRef]
  66. Kacira, M.; Simsek, M.; Babur, Y. Determining optimum tilt angles and orientations of photovoltaic panels in Sanliurfa, Turkey. Renew. Energy 2004, 29, 1265–1275. [Google Scholar] [CrossRef]
  67. United Nations. Indicators of Sustainable Development: Guidelines and Methodologies; United Nations: New York, NY, USA, 2007. [Google Scholar]
  68. Callao, M.P. Trends in analytical chemistry multivariate experimental design in environmental analysis. Trends Anal. Chem. 2014, 62, 86–92. [Google Scholar] [CrossRef]
  69. Mondoc, B.; Pop, F. Factors influencing the performance of a photovoltaic power plant. In Proceedings of the 3rd International conference Modern Power System MPS 2010, Cluj-Napoca, Romania, 18–21 May 2010; pp. 18–21. [Google Scholar]
  70. Kanters, J.; Horvat, M.; Dubois, M.C. Tools and methods used by architects for solar design. Energy Build. 2014, 68, 721–731. [Google Scholar] [CrossRef]
  71. Kovács, A.; Bátai, R.; Csáji, B.C.; Dudás, P.; Háy, B.; Pedone, G.; Révész, T.; Váncza, J. Intelligent control for energy-positive street lighting. Energy 2016, 114, 40–51. [Google Scholar] [CrossRef] [Green Version]
  72. The Minitab Blog. Regression Analysis Tutorial and Examples. Minitab 18. 2013. Available online: http://blog.minitab.com/blog/adventures-in-statistics-2/regression-analysis-tutorial-and-examples (accessed on 27 April 2019).
  73. Fegade, S.L.; Tande, B.M.; Cho, H.; Seames, W.S.; Inna Sakodynskaya, D.S.M.; Kozliak, E.I. Aromatization of propylene over HZSM-5: A Design of Experiments (DOE) Approach. Chem. Eng. Commun. 2013, 200, 1039–1056. [Google Scholar] [CrossRef]
  74. Montgomery, D.C. Introduction to Statistical Quality Control, 6th ed.; Arizona State University, John Wiley & Sons: Phoenix, AZ, USA, 2009. [Google Scholar]
  75. Taylor, J.R. Experimental Errors and Uncertainty. Measurement; University Science Books: Sausalito, CA, USA, 2002; pp. 2000–2002. [Google Scholar]
  76. Sharma, D.K.; Verma, V.; Singh, A.P. Review and analysis of solar photovoltaic softwares. Int. J. Curr. Eng. Technol. 2014, 4, 725–731. [Google Scholar]
  77. Valentin EnergieSoftware GmbH. Design and Simulation of Photovoltaic Systems; Wagner & Co Solartechnik GmbH: Berlin, Germany, 2010. [Google Scholar]
  78. Chen, D.; Chen, H.W. Using the Köppen classi fi cation to quantify climate variation and change: An example for 1901–2010. Environ. Dev. 2013, 6, 69–79. [Google Scholar] [CrossRef]
  79. John Arnfield, A. Köppen climate classification. Encyclopaedia Britannica. 2017. Available online: https://www.britannica.com/science/Koppen-climate-classification (accessed on 27 April 2019).
  80. Rubel, F.; Kottek, M. Observed and projected climate shifts 1901–2100 depicted by world maps of the Koppen-Geiger climate classif cation World Map of Köppen—Geiger Climate Classification. Meteorologische Zeitschrift 2010, 19, 135–141. [Google Scholar] [CrossRef]
  81. Collins, L.M.; Dziak, J.J.; Li, R. Resource Management perspective on complete and reduced. Psychol. Methods 2009, 14, 202–224. [Google Scholar] [CrossRef] [PubMed]
  82. Lacchini, C.; Antoniolli, A.F.; Rüther, R. The influence of different irradiation databases on the assessment of the return of capital invested in residential PV systems installed in different locations of the Brazilian territory. Sol. Energy 2017, 155, 893–901. [Google Scholar] [CrossRef]
  83. Sivakumar, P.; Arutchelvi, M. Maximum power extractions in a single stage PV sourced grid connected inverter during low irradiations and nonlinear loads. Renew. Energy 2017, 107, 262–270. [Google Scholar] [CrossRef]
Figure 1. The basic components of a complete Building Integrated Photovoltaic system.
Sustainability 11 02992 g001
Figure 2. A methodological framework for installing PV modules in a BIPV system.
Sustainability 11 02992 g002
Figure 3. Linking framework components.
Sustainability 11 02992 g003
Figure 4. Coefficients of the assigned factorial designs.
Sustainability 11 02992 g004
Figure 5. EO of installing PV modules mounted on roofs.
Sustainability 11 02992 g005
Figure 6. EO of installing PV modules on elevations.
Sustainability 11 02992 g006
Figure 7. EO of installing PV modules mounted on roofs within a frequency of (1°).
Sustainability 11 02992 g007
Figure 8. EO loss between the vertical inclination and preferable inclination of PV modules on elevations.
Sustainability 11 02992 g008
Table 1. The optimum inclination of photovoltaic modules in various cities [47], and the proportion of the best inclination compared to the latitude (adapted by the authors).
CityOptimum PV Module InclinationProportion of the Best Inclination Compared to the LatitudeCityOptimum PV Module InclinationProportion of the Best Inclination Compared to the Latitude
Winnipeg41.182%Houston25.986%
Prague41.182%Cairo25.986%
Minneapolis37.383%Dakar13.187%
Milano37.383%Caracas8.787%
Madrid33.584%Mérida17.487%
Denver33.584%Bogotá4.488%
Albuquerque29.785%Key West22.188%
Tokyo29.785%Taipei22.188%
Table 2. The assigned factors defining the functional unit.
PVTPVOPVIAPVIB
p-Si 100 W (1)North (1)0° (1)0° (1)
mono-Si 100 W (2)South (2)10° (2)10° (2)
East (3)20° (3)20° (3)
West (4)30° (4)30° (4)
40° (5)40° (5)
50° (6)50° (6)
60° (7)60° (7)
90° (8)
Table 3. Energy output of PV modules mounted on roofs based on the assigned design factors.
Run SequenceFactorial DesignsEO (kWh/Year)
PVTPVOPVIARio de Janeiro/BrazilRiyadh/Saudi ArabiaLondon/United KingdomQuito/Ecuador
111113,22117,060775817,062
221113,12917,102760116,904
312113,22117,060775817,062
422113,12917,102760116,904
513113,22117,060775817,062
623113,12917,102760116,904
714113,22117,060775817,062
824113,12917,102760116,904
911213,73415,699697316,891
1021213,65515,702682516,733
1112212,38617,953838116,817
1222212,28018,028822316,640
1313213,12616,881769016,963
1423213,03616,919753516,802
1514213,03416,847771616,806
1624212,94416,894756416,651
1711313,92113,931616316,324
1821313,85013,901602716,151
1912311,28218,354880116,180
2022311,16418,447864715,983
2113312,82416,400755116,585
2223312,73716,435740316,424
2314312,64416,329759416,299
2424312,55616,381744916,147
2511413,78411,841389615,371
2621413,71211,794382215,188
27124994918,268883815,180
28224983018,358869614,979
2913412,35715,696678116,030
3023412,27315,724665815,862
3114412,09115,605684615,562
3224412,00515,656673015,421
3311513,3399731459214,067
3421513,2569681449213,867
35125854417,730904113,846
36225843317,795889613,646
3713511,73414,821710715,252
3823511,65014,835697415,098
3914511,41114,691716514,715
4024511,32714,734704014,581
4111612,5877952535112,454
4221612,4897895523112,242
43126736516,731902712,215
44226726016,754887712,014
4513610,99713,783735914,318
4623610,91013,778721914,177
4714610,65313,652741113,740
4824610,56713,680727613,612
4911711,5546378339810,659
5021711,4406324334510,445
51127631015,283843210,414
52227621315,258829110,215
5313710,16012,656638913,292
5423710,06812,627627313,162
55147979912,535645312,646
56247971112,543634612,525
Table 4. Energy output of PV modules on elevations based on the assigned design factors.
Run SequenceFactorial DesignsEO (kWh/Year)
PVTPVOPVIBRio de Janeiro/BrazilRiyadh/Saudi ArabiaLondon/United KingdomQuito/Ecuador
111113,18616,684774416,709
221113,09916,717759016,563
312113,18616,684774416,709
422113,09916,717759016,563
513113,18616,684774416,709
623113,09916,717759016,563
714113,18616,684774416,709
824113,09916,717759016,563
911213,69615,352696116,538
1021213,62315,348681616,390
1112212,35517,558836416,468
1222212,25417,621820916,309
1313213,09116,509767516,616
1423213,00616,538752416,473
1514213,00016,475770216,455
1624212,91516,513755216,313
1711313,88213,622615415,979
1821313,81713,589601915,820
1912311,25617,951878215,845
2022311,14218,031863215,668
2113312,79016,038753716,250
2223312,70916,064739216,106
2314312,61115,968758015,957
2424312,52816,011743815,817
2511413,74611,810389315,329
2621413,67911,768382015,154
27124992818,205881815,140
28224981318,303868014,948
2913412,32515,646676915,988
3023412,24615,680664815,830
3114412,06015,555683315,518
3224411,97915,612671915,386
3311513,3039513458713,761
3421513,2269463448913,563
35125852717,340902013,549
36225841917,394887913,355
3713511,70414,493709314,946
3823511,62514,500696414,800
3914511,38314,365715214,400
4024511,30214,401702914,273
4111612,5547772534412,180
4221612,4617717522511,970
43126735316,362900711,946
44226725016,377886111,749
4513610,97013,477734514,025
4623610,88713,467720713,891
4714610,62713,348739713,445
4824610,54513,372726513,323
4911711,5276369339510,637
5021711,4176316334310,427
51127630115,238841410,392
52227620615,219827710,197
5313710,13712,620637713,257
5423710,04812,597626413,134
55147977712,499644112,612
56247969312,512633712,497
571187411351525726134
582187297350925565975
591283972926961785994
602283933916060525844
611387241888048129544
622387145879247259398
631487030884348819182
642486944878948049045
Table 5. Summary of results of the case study.
Basic NotificationsRio de Janeiro/BrazilRiyadh/Saudi ArabiaLondon/United KingdomQuito/Ecuador
The best geographic orientation of PV modules mounted on roofNorthSouthSouthEast and West
The worst geographic orientation of PV modules mounted on roofSouthNorthNorthNorth and South
Range of preferable inclination of PV module10°–30°10°–30°30°–50°
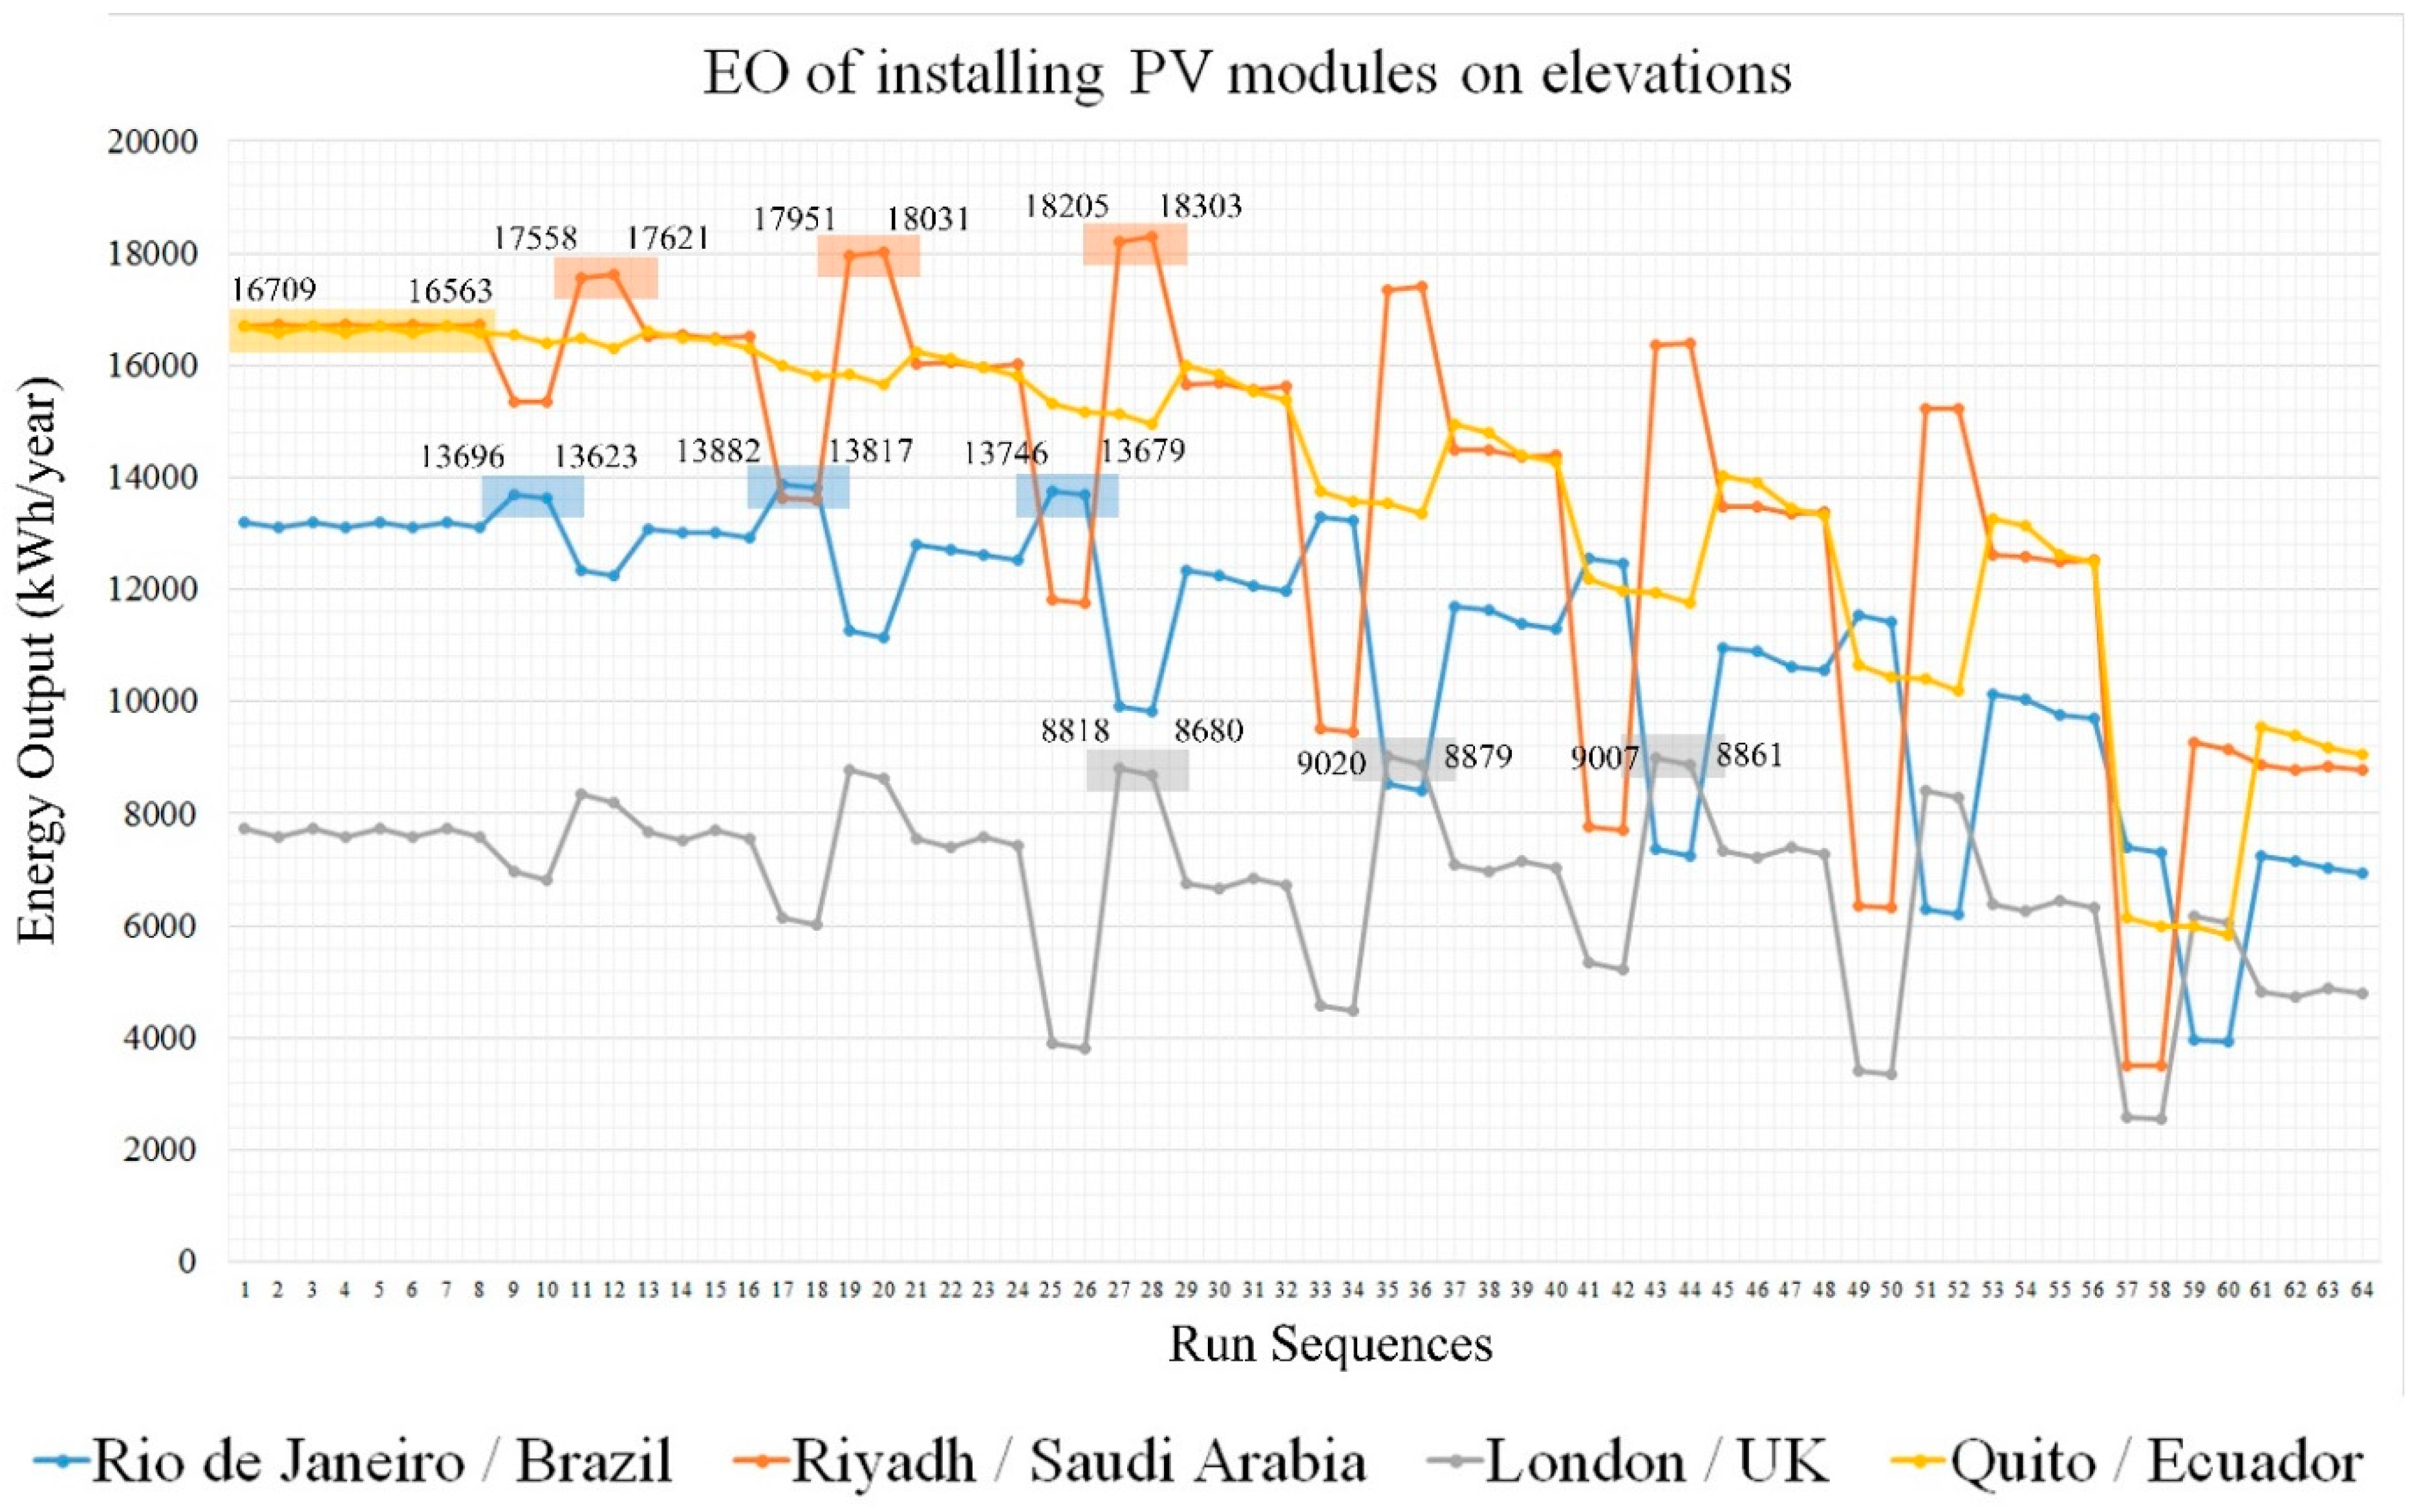
The worst inclination of PV modules on elevations90°90°90°90°
Best elevation to install PV modulesNorthSouthSouthEast and West
Second/Third preferable elevation to install PV modulesEast/WestEast/WestWest/EastNorth/South
Worst elevation to install PV modulesSouthNorthNorthN/A

