Spatial Cluster-Based Model for Static Rebalancing Bike Sharing Problem


1
Department of Civil Engineering, K.N. Toosi University of Technology, Tehran 19697, Iran
2
School of Civil Engineering, The University of Queensland, Brisbane, QLD 4072, Australia
3
Geoinformation Tech. Center of Excellence, Faculty of Geomatics, K.N. Toosi University of Technology, Tehran 19697, Iran
4
Department of Computer Science and Engineering, Sejong University, Seoul 143-747, Korea
*
Author to whom correspondence should be addressed.
Sustainability 2019, 11(11), 3205; https://0-doi-org.brum.beds.ac.uk/10.3390/su11113205
Submission received: 23 April 2019
/
Revised: 31 May 2019
/
Accepted: 3 June 2019
/
Published: 8 June 2019
(This article belongs to the Special Issue Toward Sustainability: Bike-Sharing Systems Design, Simulation and Management)
Abstract
:Bike sharing systems, as one of the complementary modes for public transit networks, are designed to help travelers in traversing the first/last mile of their trips. Different factors such as accessibility, availability, and fares influence these systems. The availability of bikes at certain times and locations is studied under rebalancing problem. The paper proposes a bottom-up cluster-based model to solve the static rebalancing problem in bike sharing systems. First, the spatial and temporal patterns of bike sharing trips in the network are investigated. Second, a similarity measure based on the trips between stations is defined to discover groups of correlated stations, using a hierarchical agglomerative clustering method. Third, two levels for rebalancing are assumed as intra-clusters and inter-clusters with the aim of keeping the balance of the network at the beginning of days. The intra-cluster level keeps the balance of bike distribution inside each cluster, and the inter-cluster level connects different clusters in order to keep the balance between the clusters. Finally, rebalancing tours are optimized according to the positive or negative balance at both levels of the intra-clusters and inter-clusters using a single objective genetic algorithm. The rebalancing problem is modeled as an optimization problem, which aims to minimize the tour length. The proposed model is implemented in one week of bike sharing trip data set in Chicago, USA. Outcomes of the model are validated for two subsequent weekdays. Analyses show that the proposed model can reduce the length of the rebalancing tour by 30%.
1. Introduction
Quality of service in bike sharing systems is an important operational problem for authorities. In order to keep the quality of service at a certain level, these systems need rebalancing to compensate unbalances in the network. The static rebalancing problem is keeping the balance of all stations in the network at a predetermined level. The process of rebalancing usually is carried out by vehicles. The vehicles start from the deposit (depot) and deliver bikes to vacant docks at stations or pick up bikes from overloaded stations; the cost of running this process through the network can be very high, which is an important issue in the management of bike sharing systems. Therefore, finding a rebalancing strategy to keep the balance of network with the least possible cost can be an ideal case for operators.
Bike sharing systems are one of the effective and environmentally friendly solutions to the first/last mile problem; they notably reduce motorized trips, air pollution, fuel consumption and needs for parking spaces [1,2,3,4,5,6,7]. Since the last decade, these systems have become one of the main complementary modes of public transit systems in many urban areas. Different factors such as accessibility to stations, availability of bikes and vacant docks, and fares influence the effectiveness of these systems, among which the availability of bikes during the day is one of the most challenging issues in the designing, operating, and management of these services.
To a large extent, bike sharing systems are used for one-way trips, and such a trend leads to inappropriate bike distribution in time and space [7,8]. As a result, unmet demand and consequently user dissatisfaction occur in the system. To minimize the demand dissatisfaction (i.e., maximize usage and revenue), the redistribution of bikes over stations is required. This redistribution, also called rebalancing, is implemented by employing vehicles (usually trucks) to collect surplus bikes from overloaded stations and deliver to bike deficient stations [9]. The efficiency of rebalancing operations is important to the authorities to ensure that the number of bikes and vacant docks at each station are periodically restored to predefined target values [8].
Rebalancing of bikes in the network is carried out in two different manners: the user-based approach, in which users can rebalance a portion of bikes in the system by their daily trips or taking bonuses for specified trips; and the operator-based approach, where bikes are rebalanced by the system operators whether in a static or dynamic manner [4,6,8,10,11]. The static rebalancing is carried out during the night when the demand in the system is insignificant. The dynamic rebalancing is performed during the day when the system is active by taking into account the real-time usage of the bike sharing system. The operator-based bike rebalancing problem (BRP) is a Pickup and Delivery Traveling Salesman. The aim of rebalancing is minimizing unmet demand, minimizing total travel time and handling costs, minimizing tour length of the vehicles, and minimizing the number of tours.
In contrast to static rebalancing, dynamic rebalancing usually is complex and remarkably expensive enough not to be utilized in most cases where the system is relatively large in size and extent. In bike sharing systems, preferably, static rebalancing is performed by the operator only to rebalance bikes for the morning demand (morning peak). At the other times of day, users handle a dynamic bike rebalancing in the system. To exemplify, person A moves a bike from station i to station j at the morning peak-hour. In the evening, person B collects another bike at station j and drops it off at station k. As a late-night trip, person C picks a bike at station k and returns it back to station i where it needs a bike back for the morning demand. This trilogy of trips can be expanded to a more complex case on the whole network.
Ultimately, users’ behavior and trip patterns have significant impacts on the distribution of bikes over the system and also determine how and how many bikes need to be rebalanced by the operator at nights. Therefore, the origin-destination (OD) matrix of undertaken trips is one of the main factors that needs to be considered in the static rebalancing. As a matter of fact, it is important to specify which stations need to be rebalanced. This will eliminate extra rebalancing tours between stations. In other words, it demonstrates the share of rebalancing done by users and how much needs to be carried out by the bike sharing service staff.
This paper proposes a bottom-up spatial cluster-based model to solve the static rebalancing problem in the bike sharing systems. First, spatial and temporal patterns of bike sharing trips in the network are investigated. Second, a similarity measure based on the trips between stations is defined to discover groups of correlated stations, using a hierarchical agglomerative clustering method. Third, two levels of rebalancing are assumed as intra-clusters and inter-clusters with the aim of keeping the balance of the network as the beginning of the day. The intra-cluster level keeps the balance of bike distribution inside each cluster, and the inter-cluster level connects different clusters in order to keep the balance between the clusters. Finally, rebalancing tours are optimized according to the positive or negative balance at both levels of intra-clusters and inter-clusters using a single objective genetic algorithm. The rebalancing problem is modeled as an optimization problem, which aims to minimize the tour length. The proposed model is implemented in one week of bike sharing trip data set in Chicago, USA.
The remainder of this paper is organized as follows. In Section 2, a literature review on bike rebalancing problem is provided. In Section 3, the mathematical problem definition of the clustering method, elements of the genetic algorithm for the static bike rebalancing problem, and the data are stated. In Section 4, the results of the computational experiments are provided. Finally, the concluding remarks and discussion are presented in Section 5.
2. Literature Review
Bike rebalancing problem is one of the main problems in operating the bike sharing systems [10,12]. The aim of rebalancing is to specify the number of bikes loading/unloading at each station and find the optimal truck routes subject to various constraints [7,9,13]. In order to have an overview on the status quo of the mentioned problem during the recent years, Table 1 gives an outline of some recent and most contributed studies based on their operation type, mathematical approach and algorithms, and objectives. The available studies could be divided into two separate groups as static or dynamic rebalancing problems. Also, choosing between appropriate mathematical approaches has been another challenge for the researchers. In this section, we investigate recent studies on both static and dynamic rebalancing problems in order to clearly present the current research gaps.
Most of the studies on bike sharing systems focus on the static bike rebalancing problem by proposing several optimization algorithms, while a few others are related to dynamic rebalancing by dividing the problem into some static sub-problems. The difference in the number of publications is mainly due to the availability of data, complexity, difficulty in managing the varying demand and setting time slots. In dynamic rebalancing, the vehicle loading/unloading and tours need to be updated regularly to determine the demand variations from time to time [9]. Most studies on both static and dynamic rebalancing adopt different objectives including minimizing vehicle travel time and cost, the tour length, vehicle emission and also minimizing user dissatisfaction and unmet demand.
2.1. Static Rebalancing Problem
The static rebalancing problem mostly deals with solving the optimization problem with different mathematical approaches, which are briefly explained here. Studies in the rebalancing problem are also could be divided into studies with and without clustering steps.
Chemla et al. [14] proposed a math-heuristic to find a route that minimizes the total traveling distance. Their algorithm is based on a solution of a relaxation of the problem that is solved by a branch-and-cut procedure. Dell’Amico et al. [1] presented four mixed integer linear programming with the objective of minimizing the traveling cost. Their computational time efficiently solves networks with up to 50 vertices and extends exponentially with the larger networks. With different objective, Alvarez-Valdes et al. [12] optimized the level of service of bike sharing systems by forecasting the unsatisfied demand at each station and proposing an algorithm upon the estimated measures. Their tested procedure on a relatively small network demonstrates to be an extremely fast heuristic algorithm. Some research consider the problem as 1-Commodity Pickup and Delivery Traveling Salesman Problem (1-PDTSP) using a single vehicle and allowing multiple visits. Erdogan et al. [18] and Erdogan et al. [17] present an exact algorithm to minimize rebalancing costs. Pal and Zhang [5] present mixed integer linear program for solving the static complete rebalancing problem in a free-floating bike sharing (dock-less) system. Similarly, Li et al. [4] present a mixed-integer linear programming to minimize the total rebalancing cost for different types of bikes. They proposed a combined hybrid genetic algorithm in which the hybrid genetic search determines the optimal routes and a greedy heuristic to specify the loading/unloading number of bikes at stations. Their proposed method is efficient for small-sized networks. Cruz et al. [11] proposed a hybrid iterated local search (ILS) algorithm. The authors argue that their heuristic algorithm is capable of finding the optimal solution in 97% of cases compared with previous work. Therefore, the above-mentioned studies focused on proposing a better mathematical approach that could solve the real world size problems in an efficient way.
The other studies use clustering method to simplify the rebalancing problem. Schuijbroek et al. [16] proposed an inventory rebalancing and vehicle routing (cluster-first route-second heuristic) for polynomial size clustering problem and consider the service level feasibility and approximate routing cost simultaneously. Also, Dondo and Cerda [13] investigated the multi-depot routing problem with different time slots and heterogeneous vehicles using a three step heuristic and hybrid. Their approach aims to divide the problem into small mixed-integer linear programming (MILP) sub-problems by a heuristic clustering algorithm and then finding the optimize routing (minimum travel costs) for the multi-depot heterogeneous vehicle routing problem. With the similar approach, Forma et al. [10] geographically clustered stations and then, the vehicle routing is determined. Similarly, Liu et al. [15] proposed adaptive capacity constrained K-centers clustering algorithm to solve the mixed integer nonlinear programming with the objective of minimizing the tour length. Consequently, enriching the rebalancing problems by using clustering algorithms could successfully deal with the size of the problem and break it down into smaller problems.
2.2. Dynamic Rebalancing Problem
The main objective of the dynamic rebalancing is to determine the optimal inventory levels that need to be maintained at each time interval. The challenges, arising in the dynamic rebalancing, necessitate the dedicated and efficient methodologies [6]. However, considering the complexity of fully integrating three key components (the user dissatisfaction estimating, the bicycle rebalancing and the vehicle routing), several partially integrated or sequential solution methodologies of the dynamic rebalancing are proposed [6], which are investigated in the following.
Regue and Recker [19] proposed a sequential framework. First, the demand forecasting model and inventory levels model are solved, then redistribution demand is generated and finally, vehicle routing is calculated. Alongside the optimization of vehicle routing and unmet demand, Shui and Szeto [9] also consider the environmental aspect as their objective for a dynamic rebalancing problem to try to minimize the CO emission and the associated costs. To handle the varying demand on bikes, they used a rolling horizon approach in which the dynamic rebalancing is broken down into several static rebalancing problems. An enhanced artificial bee colony algorithm and a route truncation heuristic are jointly used to optimize the route design in each stage, and the loading and unloading heuristic is used to tackle the loading and unloading sub-problem along the route in each stage. They show that the shorter stage length, the better is the solution; in addition to computation time, total unmet demand and the total fuel and CO emission cost are higher with a longer stage length [9]. This reinforces splitting the problem into sub-problems. The smaller problem, the better and faster solution.
Zhang et al. [6] proposed a non-linear time-space network flow-base formulation to fully integrate three key components of the dynamic rebalandcing (the bicycle rebalancing, the vehicle routing and user dissatisfaction). They estimated the user dissatisfaction by decomposing the forecasting period into two sub-periods based on the vehicle arrival time. The experimental results revealed that significant improvements compared to several benchmark approaches are achieved. On the other hand, Waserhole and Jost [20] present a dynamic pricing mechanism that forces a balanced demand and hence saves the need for rebalancing altogether. However, such an approach clearly comes at the cost of reducing the level of service provided to the users of the system but nevertheless seems the only viable alternative to balancing a car sharing system where rebalancing is too expensive. Contardo et al. [21] proposed methodologies based on a time-space network, in which the estimation of the user dissatisfaction is simplified and consequently the estimation accuracy is sacrificed.
User satisfaction becomes crucial for free-floating bike sharing system and the dynamic rebalancing makes the problem more complicated. In order to reduce the complexity, Caggiani et al. [22] and Caggiani et al. [8] propose a dynamic clustering method in constant time gaps. After the spatio-temporal correlation pattern of different zones in a city, a decision support system is developed to achieve a high degree of user satisfaction and keep the costs of rebalancing operations as low as possible Therefore, the studies in the dynamic rebalancing problem have focused on different heuristic optimization methods to solve the problems in both spatial and temporal dimensions.
In conclusion, bike sharing rebalancing problem has attracted the interest of many researchers in recent years. A large portion of studies focuses on solving the optimization problem itself without considering users’ behavior and their role in the rebalancing problem. Also, most studies conduct experiments on relatively small networks and the literature mostly simplifies and surveys the network as a vector graph. Few studies use clustering in order to reduce the complexity of large-scale optimization problem [8,10,13,15,23], while what is not considered in the most rebalancing studies is the users’ behavior in bike sharing systems. Users’ behavior is the result of the inherent interactions between demand and supply. Availability of bikes (supply) alongside the distance and the geographical terrains affect the users’ behavior and consequently the demand for bikes and docks. Clustering the network by considering trips between stations makes the analysis of the network simpler and more efficient and also as it will be discussed in followings, it eliminates unnecessary tours.
3. Methodology
The state-of-the-art bike sharing systems mostly deals with the rebalancing problem. In the static rebalancing problems, the aforementioned studies in the literature try to simplify the rebalancing into an optimization problem and provide the best possible solution for that, while the effect of users’ trips has been neglected. To overcome the research gap, this paper proposes a bottom-up cluster-based model with the aim of:
- Considering the users’ behavior in the network and determining the user-based rebalancing portion;
- Clustering the stations needed to be rebalanced;
- Minimizing the rebalancing tour length (cost);
- Implementing in a real scale case study.
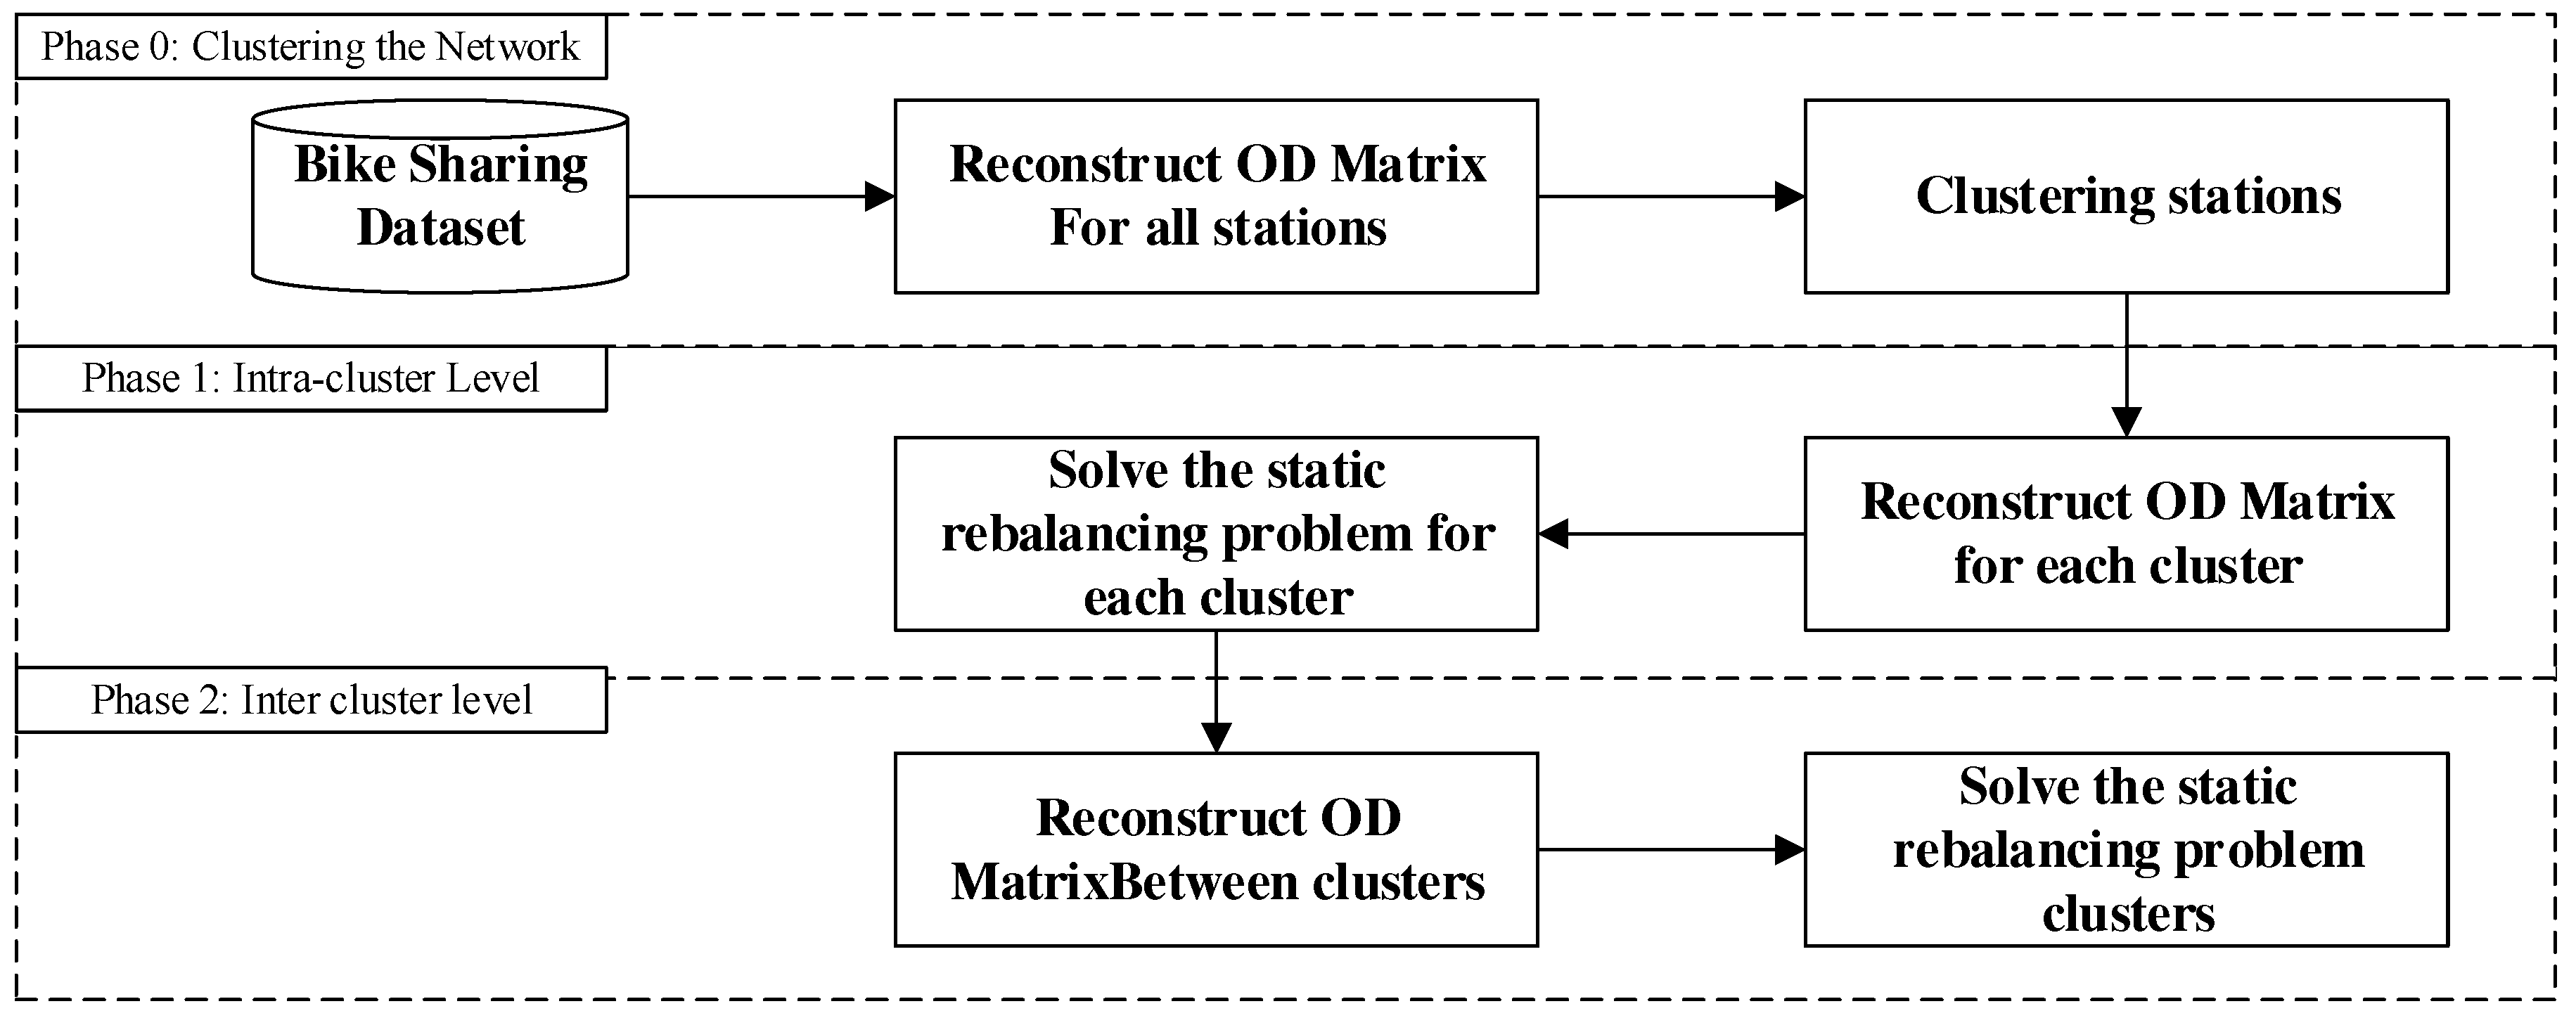
After clustering the stations, trips are divided into two different categories namely intra-clusters and inter-clusters. Intra-cluster trips are those occurring within a cluster, and inter-cluster trips refer to those occurring between two clusters. These trips unbalance the distribution of bikes inside and outside of each cluster and need to be rebalanced again. This rebalancing takes place in part through users activities and in part by a rebalancing vehicle. Therefore, it is necessary to determine the share of user-based rebalancing to specify the volume of bikes need to be rebalanced by the operator. Similar to trips, the rebalancing operations need to be done via inter-clusters and intra-clusters. A static rebalancing operation with a single vehicle of a specific capacity is assumed. The vehicle is allowed to visit a station multiple times in one tour. Also, the vehicle sets off from a deposit with some bikes and returns to the deposit with the same number of bikes at the final stage. This number of bikes is determined at the inter-cluster rebalancing optimization. The implemented procedure for rebalancing is summarized in Figure 1.
The goal of the rebalancing is keeping the balance of every single station at the predetermined level (initial balance). The initial status is computed by the data set of bike sharing transactions. The static rebalancing problem would be solved for each cluster in order to rebalance the stations in each cluster. Rebalancing each cluster would lead to a positive or negative balance for the whole cluster which is compensated by connecting that cluster with other clusters in the next steps. A genetic optimization algorithm is used to solve the rebalancing since it has positive performance in solving the routing problems in the literature [1,8,9]. As the remainder of this section, Section 3.1 displays the deployed notation and describes the problem and decision variables; Section 3.2 discusses the solution approach; and in Section 3.3 the case study and its characteristics are explained.
3.1. Notation
For clarity, the following describes the mathematical symbols adopted throughout the paper. They are notated into three main categories: indices, problem parameters, and decision variables.
- Indices
- i: id of stations
- j: id of vehicles
- Problem parameters
- I: set of id of all stations in the network
- : Number of entering bikes into the station i
- : Number of exiting bikes from the station i
- : Balance of the station i at the end of the day; Bi = IBIi − OBIi
- : Capacity of the vehicle
- Decision variables
- T: Tour for the vehicle; T = , , , , …, ,
- : Number of bikes delivered or picked up to/from m-th station
- : id of the m-th station
The bike sharing network consists of number of stations, which contain docks that can be either occupied or vacant. During a day, a number of bikes enter or exit the stations by users, which lead to unbalance of stations at the end of the day. The difference between entering and exiting bikes for each station is considered as the balance of the station, which needs to be zero. In some stations, users keep the balance of the station as zero at the end of the day (which is notified as user-based rebalancing in this study); however, some other stations need to be rebalanced to zero by the vehicles. The authorities usually use vehicle(s) with specific capacity, to deliver/pick up the bikes in/out the stations in order to balance the network. The number of bikes on the vehicle at the beginning of the tour can be zero or a positive number of bikes inside the vehicle.
The cost of running the vehicles to rebalance the stations is a challenging issue for the authorities and needs to be as minimum as possible. The cost of rebalancing operation depends on many factors, among which the cost is heavily impacted by two factors as the number of vehicles and mileage. Hence, the decision variables are tours of the vehicle that rebalance the network. Every tour includes ID of the station and number of bikes that are needed to be loaded/unloaded (deliver/pick up) from specific stations. The objective function and constraints for the static rebalancing problem are presented in the following Equations (1)–(6); where D stands for the network distance between two stations in the network; m is the number of stations in the tour; and stands for the absolute values.
- Objective function
- Constraints
The objective function is minimizing the total network distance that a vehicle needs to traverse in order to rebalance all the stations. Equation (1) presents the total network distance that is the summation of the distances between every subsequent station in the tour. Also, there are five constraints. Equation (2) presents the number of moved bikes between stations and must be less or equal to the capacity of the vehicle. Equation (3) guarantees that the capacity of the vehicle cannot be a negative number. Equation (4) presents that the number of delivered/picked up bikes at every station cannot be greater than the balance of that station. Equation (5) ensures that the vehicle always helps to rebalance the station, not to strike the balance more; for example, if the balance of a station is negative then the vehicle can only deliver bikes to the station (not make it more negative). Equation (6) guarantees that the balance of every station in the network should be zero at the end of the tour.
3.2. Solution Approach
This section describes the proposed approach for solving the static rebalancing problem. The proposed approach begins with deriving the OD matrix between the stations in the network from the data set of bike sharing transactions. Then, stations are clustered according to the number of trips between them. Next, one OD matrix is reconstructed for each discovered cluster from the previous step. The static rebalancing problem is solved for each cluster in order to rebalance the stations in each cluster (intra-cluster level). Rebalancing each cluster would lead to a positive or negative balance for the whole cluster, which is compensated by connecting that cluster with other clusters in the next steps (inter-cluster level). An OD matrix is calculated by trips between the clusters, which actually focuses on the number of bikes trading by users between the clusters besides bikes from the first level (intra-cluster level) of rebalancing. Figure 2 presents the proposed approach to solving the rebalancing problem.
The bike sharing data set include trips of users. Every trip has a unique ID. Every trip occurs between two stations as the origin and destination. Also, time for starting and ending the trip is included in the data set. It should be noted that the data sets usually need a clarification process in the case of missing data or unreasonable trip length or duration. Every station in the network has a unique ID that helps to reconstruct the OD matrix. Every cell in the OD matrix shows the number of trips between two stations considering the direction of the trip. Figure 3 presents an example for the data set and the derived OD matrix for five stations in the network; this example shows 17 trips between 5 stations in the network; and the derived OD matrix from these trips between these stations is presented at the right hand-side of the figure.
The generated OD matrix for all stations in the network is used to cluster the stations. The similarity measure here is the number of trips between the stations. This paper utilizes the agglomerative hierarchical clustering algorithm using the Ward method that minimizes the total within-cluster variance. While the agglomerative hierarchical clustering algorithm can be implemented with various methods such as Single, Average, Complete and Ward, the Ward method is chosen according to the results of comparing these methods by [24]. It is chosen because it does not need to determine the number of clusters and is flexible with different similarity measures. It begins at the bottom where each object has its own cluster and merges them till all the objects form one cluster at the top. The result of the hierarchical agglomerative clustering is a dendrogram that shows how the objects are merged at each step [25]. According to the shape of the dendrograms and the Silhouette information [25], the dendrogram can be cut at a proper level. The Silhouette information refers to a method of interpretation and validation of consistency within clusters of data [26]. The initial cluster distances in Ward’s minimum variance method are defined to be the squared Euclidean distance between points, which are shown in Equation (7), in which stands for the squared Euclidean distance between two stations q and p [27]. Clustering the stations helps to discover groups of stations that have most interactions (trips) together. An obvious benefit of clustering is dividing the problem into several sub-problems that are computationally easier to solve.
After discovering the clusters of the stations, the static rebalancing problem is solved for each single cluster in the network. The intra-cluster rebalancing problem just focuses on the imbalances that are caused by trips inside the clusters. Intra-cluster rebalancing aims at rebalancing the stations inside each cluster. However, trips between different clusters are unavoidable and must be considered as total positive or negative balance of the cluster, which is addressed at the next level (inter-cluster) rebalancing. The static rebalancing problem is solved for each cluster. The problem is a single objective optimization problem that can be solved, according to the size and complexity of the problem, with a variety of deterministic or heuristic algorithms. The utilized optimization algorithm in this study is the genetic optimization algorithm since it has positive performances in solving the routing problems in the literature [1,8,9].
The next step after the intra-cluster rebalancing is the inter-cluster rebalancing that focuses on trips between clusters and results from the previous step of the rebalancing. Similar to the intra-cluster level, an OD matrix is generated between all trips that have occurred between clusters; origin and destination of trips are not from the same cluster. Also, the static rebalancing problem at inter-cluster level is solved with a similar genetic algorithm as for the previous step.
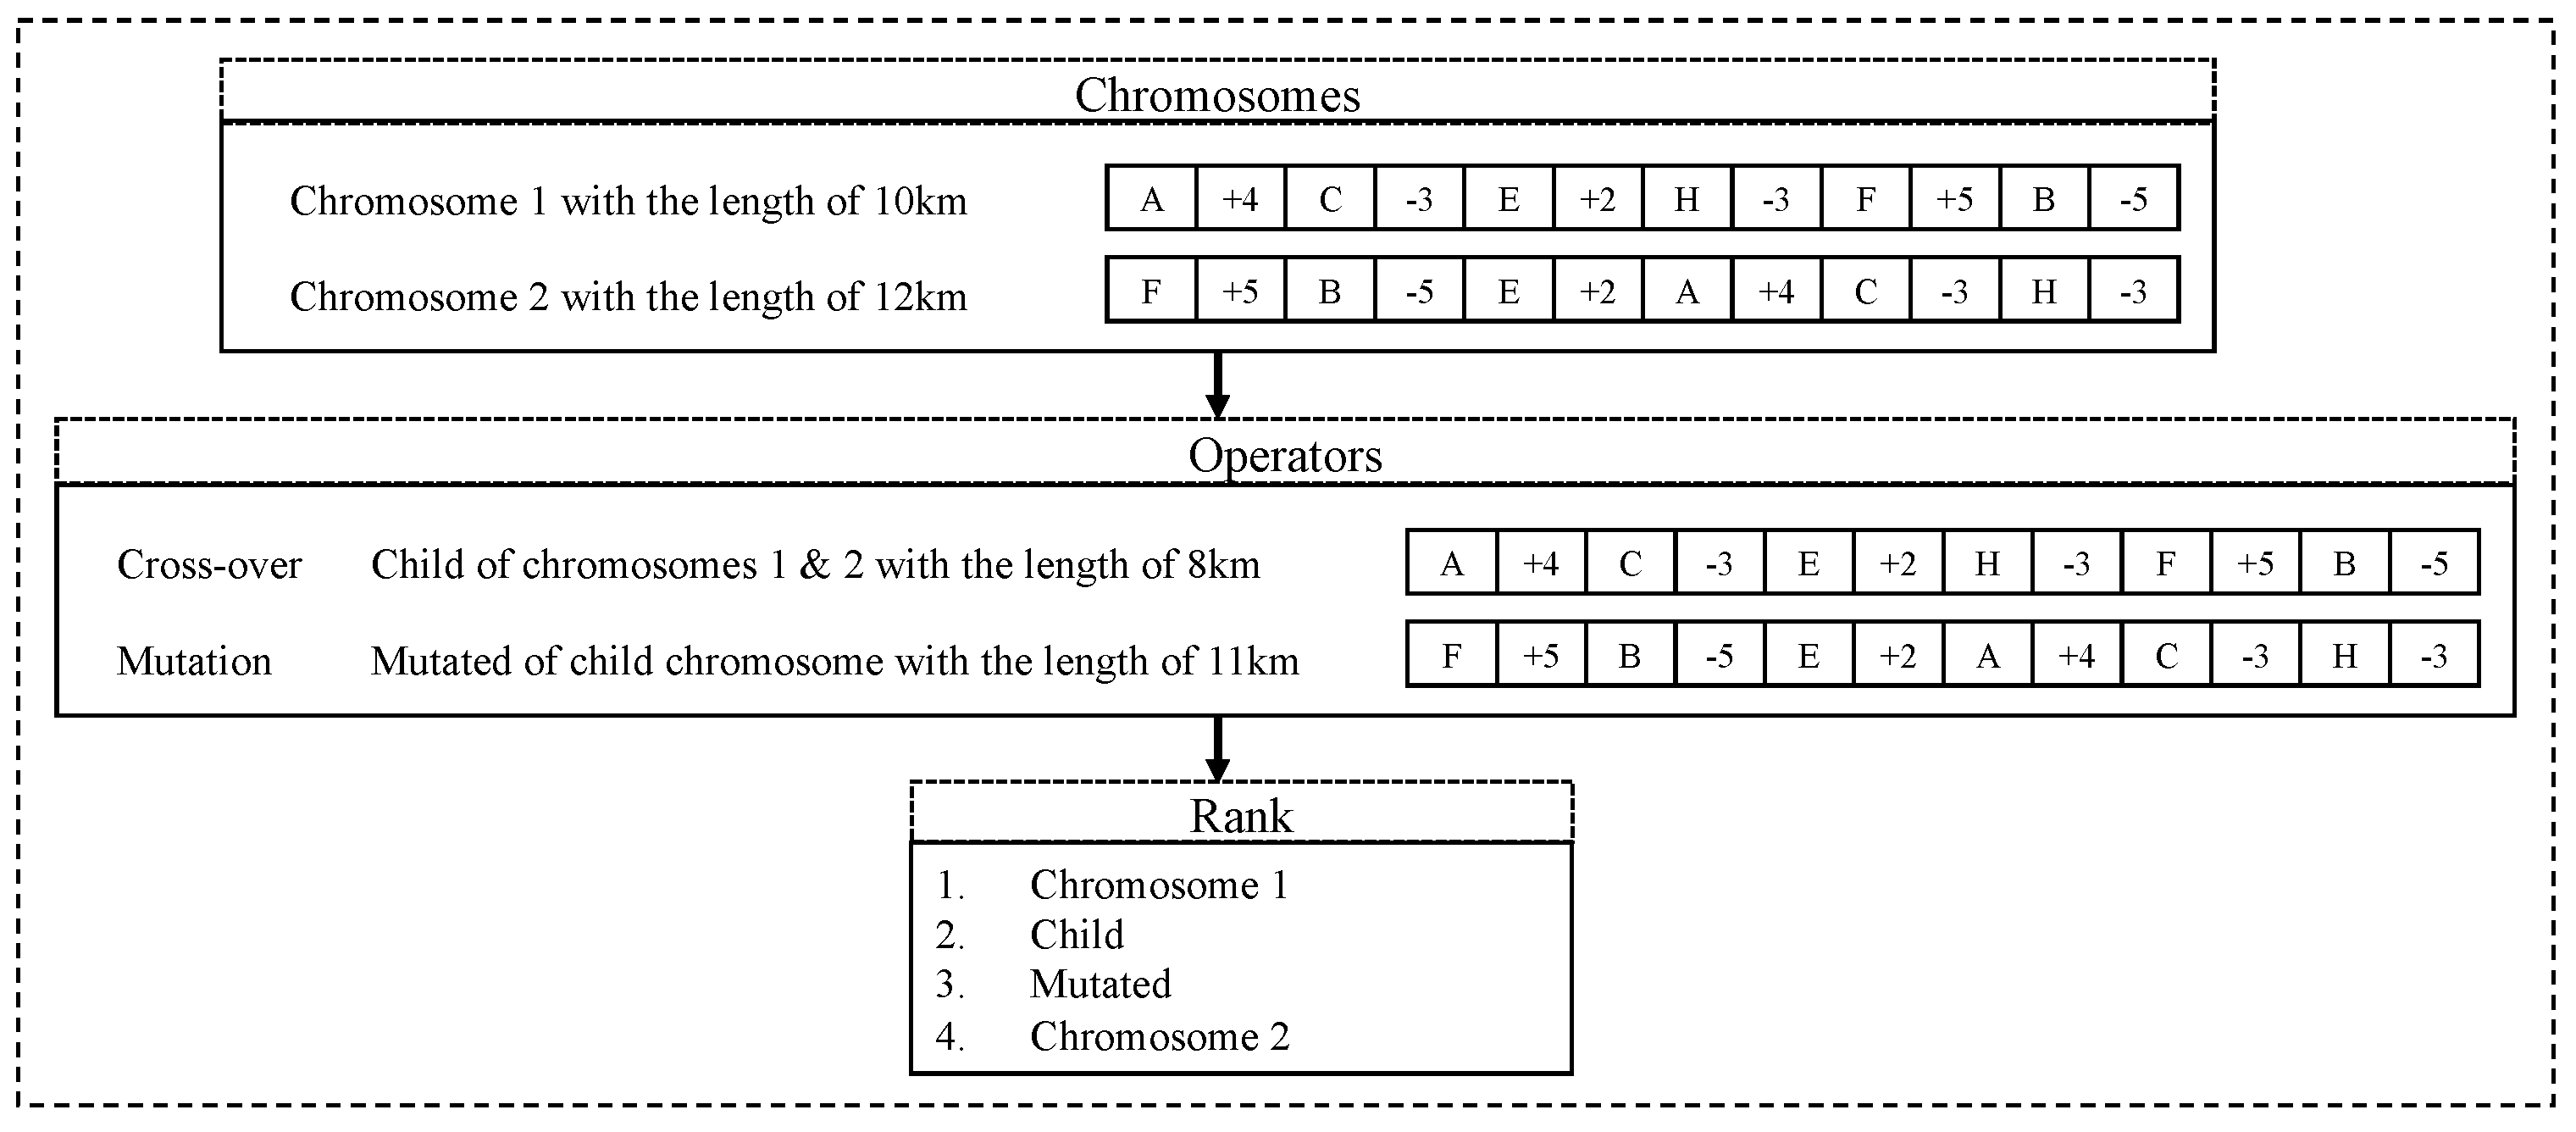
The genetic algorithm is an evolutionary heuristic optimization one that produces a solution set resembling chromosomes of a population generation in biologic terms. Every chromosome consists of independent units called genes, which are in fact the components of the solution. This algorithm starts with an initialization step, in which the initial population of solutions is generated based on the constraints in the problems. Also, population size, cross over and mutation rates need to be set in the initialization level [28]. The primary steps of the main loop of the genetic algorithm are presented in Figure 4.
Figure 5 shows a simple visualization for two chromosomes representing two possible tours with assumed length values (these values are for demonstration purposes only), cross-over and mutation operators between these two chromosomes. Each chromosome consists of separated cells, odd cells represent the ID of the stations, and even cells represent number of bikes for the rebalancing. The first two chromosomes are chosen for the cross-over and attached from station B. Also, the produced child from the cross-over is mutated into a new chromosome with a different tour length. Finally, ranking of these four chromosomes (regarding the tour length values) are presented that shows one of the parents (chromosome 2) is at the bottom of the ranking.
Algorithms 1–4 present the pseudo code for implementing the genetic algorithm in the static rebalancing problem.
| Algorithm 1: Genetic algorithm framework for the static rebalancing problem |
 |
| Algorithm 2: Initialize-Population function |
 |
| Algorithm 3: Cross-over function |
 |
| Algorithm 4: Mutation function |
 |
3.3. Data
In order to evaluate the proposed rebalancing model, the data set from the Chicago bike sharing network called Divvy is selected in this study. The reason is twofold; first, Divvy is one of the biggest station-based bike sharing systems in the world which operates approximately 5800 bikes over 582 stations in the City of Chicago, USA; second, the data set is available online which enables researchers to compare their methods with the current approach with the same data. The trips’ data set and stations’ characteristics are available since 2013. Each trip occurs between two unique stations or similar stations (circle trips) with specific start and end times. Each station is identified with a unique ID. Also, the capacity of stations and their commencing dates are mentioned in the data set.
The second quarter of 2017 is selected for the primary network analysis. This period is the warm season in Chicago and is expected to have more bike trips compare to other seasons. Also, the proposed model is implemented for the second week of May 2017, when no specific weather condition was reported.
4. Results
In this study, first, a bottom-up clustering model is developed to cluster the stations and then divides the problem into two different levels. In the end, by using a single objective genetic algorithm, the objective function is to minimize the rebalancing vehicle’ travel. In this section, after the primary analysis of the network, the temporal and spatial characteristics of the case study are studied. Then, the result of implementing the clustering method is discussed, followed by the rebalancing at two intra-cluster and inter-cluster levels. In the last part, the implemented method is validated by examining two different scenarios.
4.1. Primary Network Analysis
The distances between stations (density) in a bike sharing network, topographical and weather conditions affect the number of trips taken in the network. The primary analysis on the mentioned network data set demonstrates that first of all, the number of trips for Monday to Thursday is different from Friday to Sunday. Also, unexpected up and downs are seen in the diagram, which is examined with temperature and rainfall in Figure 6. A significant correlation exists between the overall average temperatures, and also a significant inverse relation between rainfall and number of trips is clear in the diagram.
4.2. Temporal and Spatial Analysis
Temporal dimension of the trips can be summarized into two elements: start-end time and duration of trips. Results imply that the weekday patterns are similar and also weekends follow a unique pattern. The first two columns of Figure 7 presents the density plots of start-end time and trip duration for the second week of May 2017. Start and end time are mostly overlapped in the charts which is because of short durations. For Monday to Friday, there are clearly two peaks for morning and evening. Saturday and Sunday have one flat peak diagram. This difference can be originated from working days and the morning and evening demand of the facility. Trip durations for all weekdays and weekends present a one peak pattern around a 20-min travel time. This can be related to users’ preferences and convenient biking duration which of course reinforce the result from Figure 8.
The frequency of trips over the network is studied. Results demonstrate that the most frequent origins and destinations of trips during the weekdays are different from weekends. On weekdays, the top five most frequent trips start from and end at central business district (CBD) while at weekends, trips mostly originate and destinate to coastal edges of Chicago. The Origin and Destination column of Figure 7 demonstrate the relative frequency trips on the map.
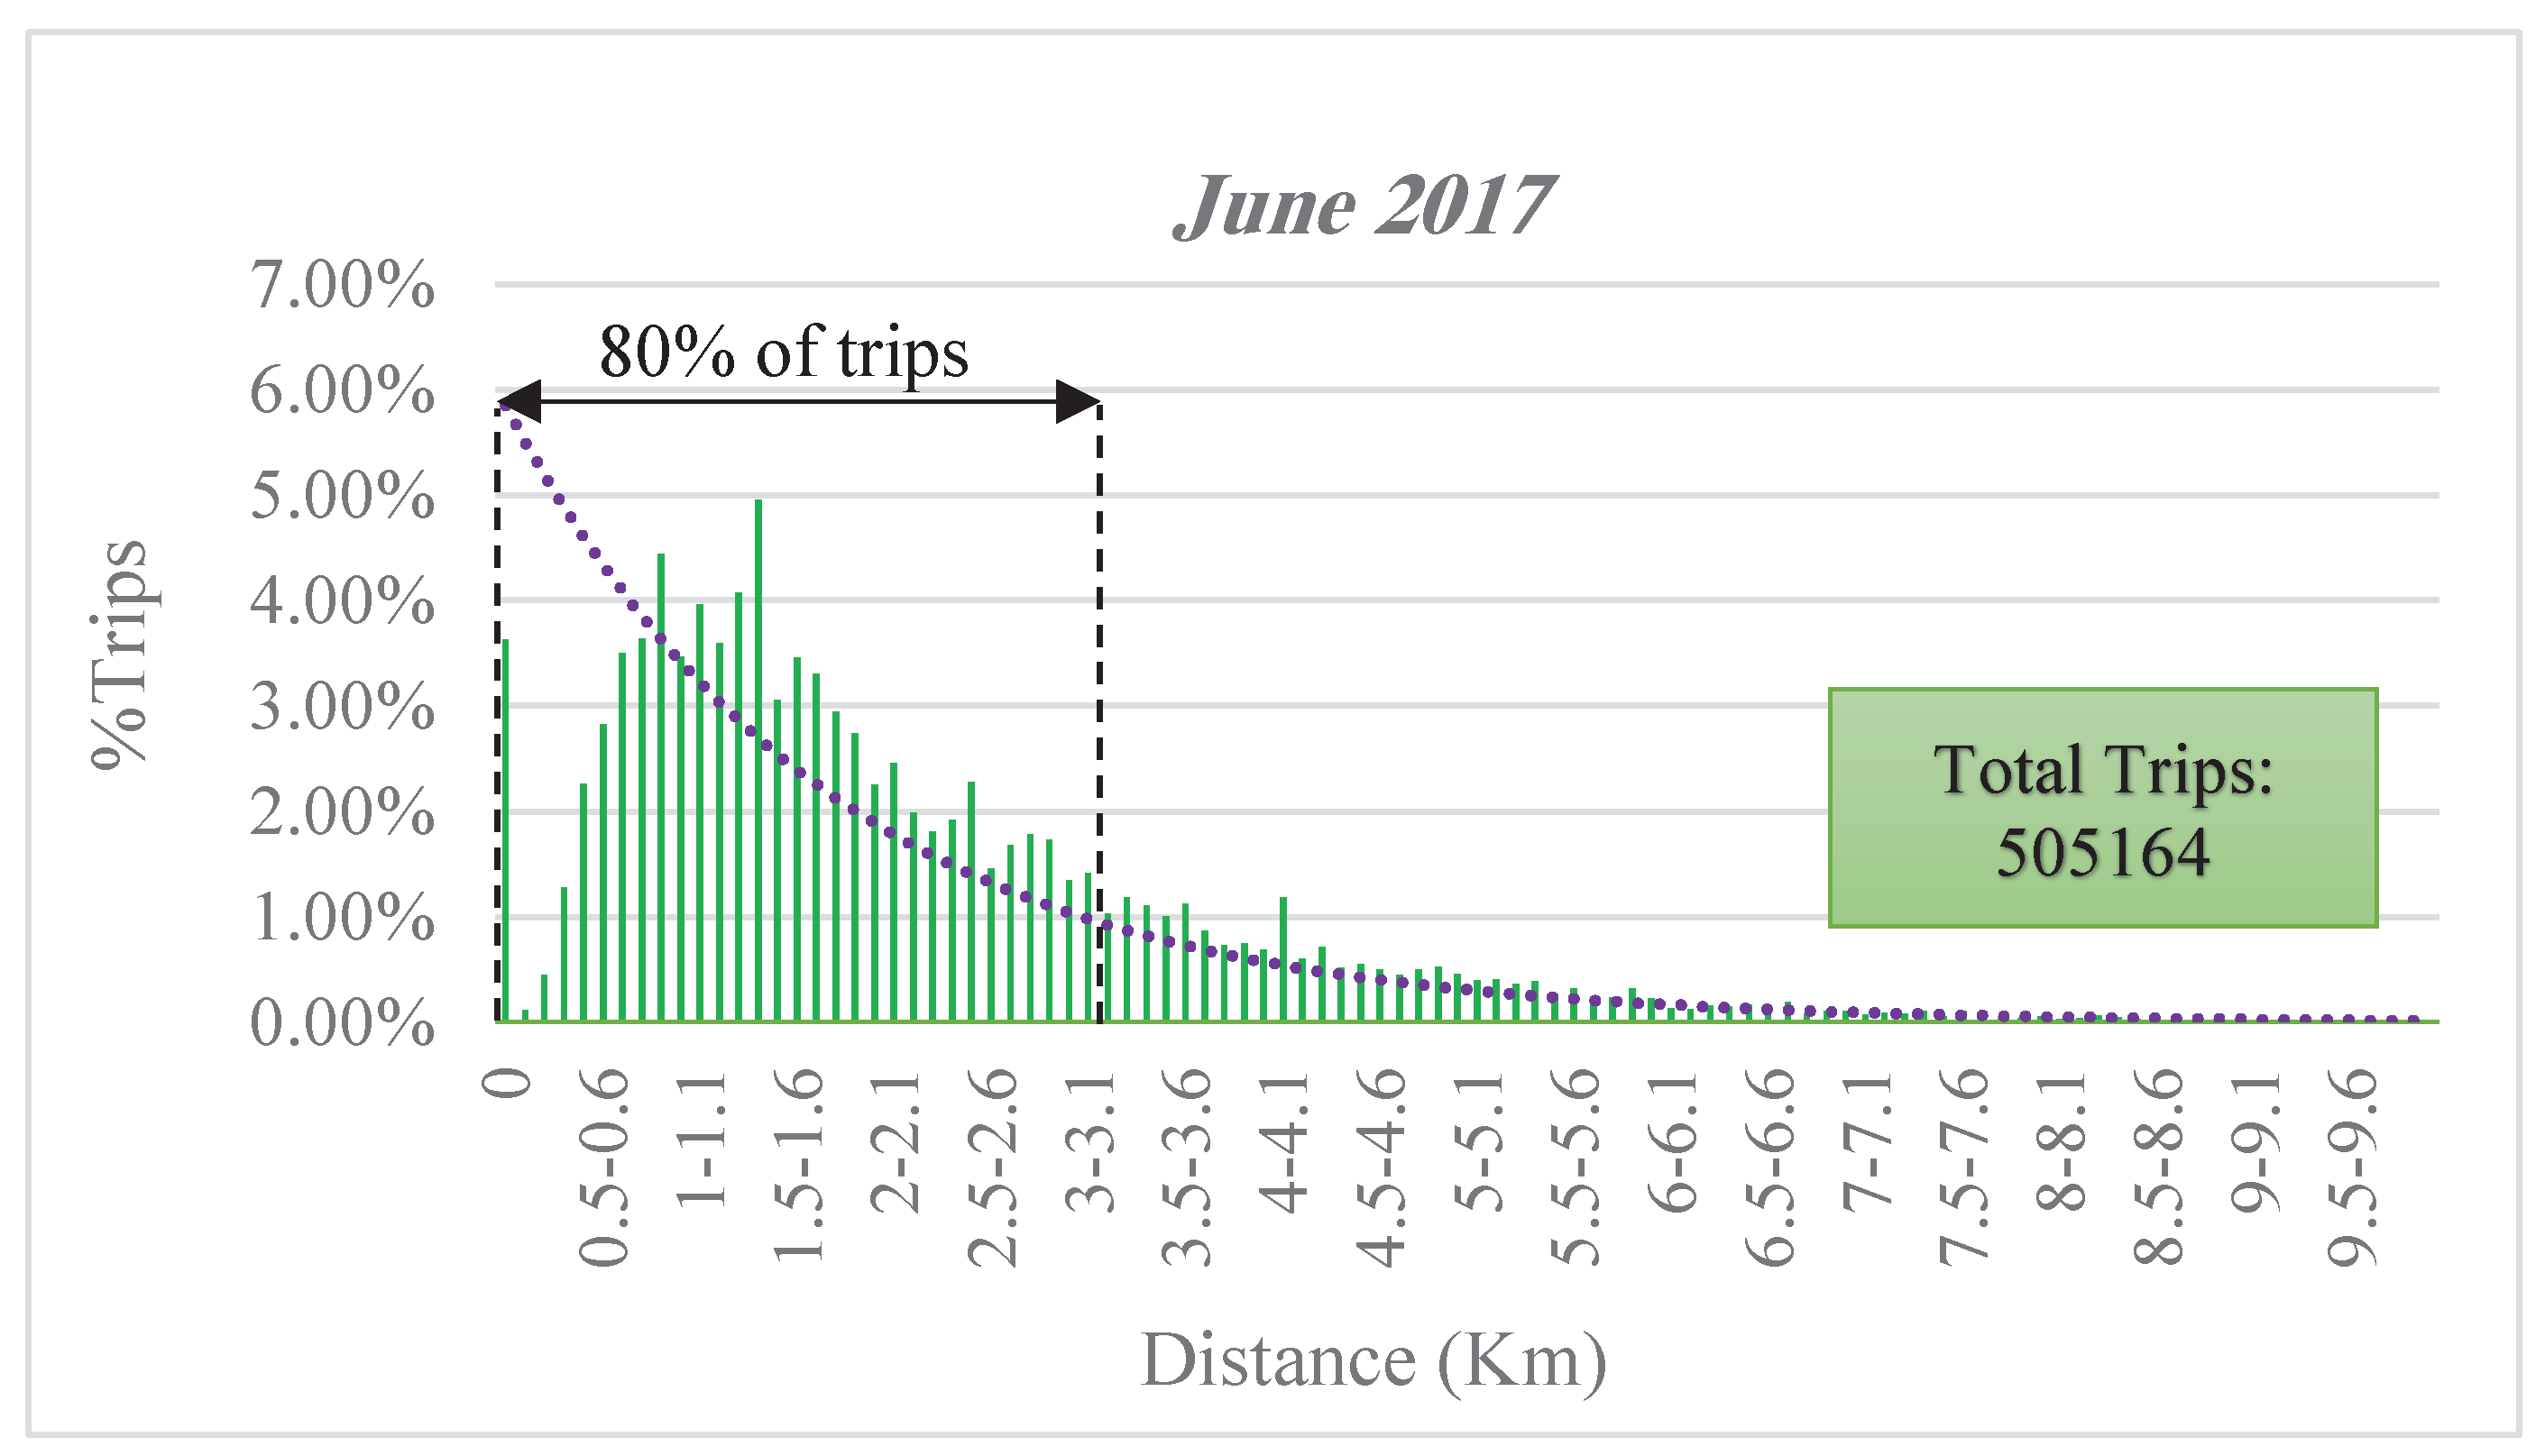
Another element of spatial analysis could be the length of trips occurring in the network. Results show that the density of trips’ length is similar for the three months. The length of each trip is calculated based on network distance between the associated origin and destination. The density of travel length for June, which has the most number of trips, is illustrated in Figure 8. The result implies that about 80% of trips biked less than 3.5 km. Furthermore, with the increase in distance, the number of trips decreases exponentially. It is due to the users’ preferences and convenient distance users are willing to bike. Also, no surprisingly, topological and topographical conditions and bike lane existence are important factors on number of trips and trips’ length since Chicago is relatively a flat city and currently has more than 200 miles (320 km) of on-street protected, buffered and shared bike lanes.
4.3. Clustering
By using the hierarchical agglomerative clustering method, the 582 stations in the Divvy bike sharing network are categorized into 13 clusters based on the OD matrix of the second week of May 2017. Although these clusters are different in size and distribution but mostly resemble each other and are scattered similarly through the network area. Clusters for each day are demonstrated in Figure 9. Cluster 2 (denoted as C2) is the largest cluster that has about 130 stations demonstrating a uniform distribution of trips among the center of Chicago. Also, there are 3 coastal clusters grouped in upper, middle and lower bounds of the coastal rim. Cluster 13 and Cluster 1 are showing two of Chicago’s suburbs. It can be deduced that these clusters indicate 13 different districts (zones) in terms of number of trips, reflecting the underlying topographical layer of the Chicago city.
4.4. Rebalancing
Two levels, namely intra-cluster and inter-cluster are defined for rebalancing the bike sharing network. This is a bottom-up process in which rebalancing strategy begins from the lowest level of the network, which is trips and stations (i.e., OD matrix) to more aggregates level including clusters. Different values for population (5, 10, 30, 50, 75 and 100), cross over rate (10%, 30%, 60%, 70% and 80%), mutation rate (5%, 10%, 20%, 40% and 60%) are examined by running the algorithm 10 times for each specifications. Results of the sensitivity analysis indicate that population size of 50, cross over rate of 70% and mutation rate of 10% gives the best value of the objective function at the fewest number of iterations. Also, the maximum number of iterations is set to 10,000 (while the sensitivity analyses show that the algorithm is converged around the 100th iteration) for decreasing the chance of early convergence due to potential redundant solutions among the population. The higher number of the maximum iterations besides mutation and cross-over at each iteration produce new solutions that could compete with the existing solutions. The rebalancing process is carried out for one week (8–14 May) which is discussed as follows:
4.4.1. Intra-Cluster
After clustering the network and dividing it into 13 groups, the next step is determining which stations need to be rebalanced at each cluster and to specify the number of bikes needing to be loaded/unloaded at each station. Then, these bike deficiencies and the distance between them lead to the rebalancing scheme (i.e., tour route) at the intra-cluster level. Table 2 demonstrates the average number of stations needing to be rebalanced in the mentioned week which are visited in a rebalancing tour and also the number of stations satisfying the morning demand without a rebalancing tour. This is due to the user activity and shows the user-based rebalancing occurred in the bike sharing network. Cluster 2 has the highest number of stations which are scattered widely in the network. Among 135 stations on average, only 23 stations (17 percent) need to be rebalanced. It reinforces the fact that clustering by OD trips reduces the average tour length in proportion to the number of stations.
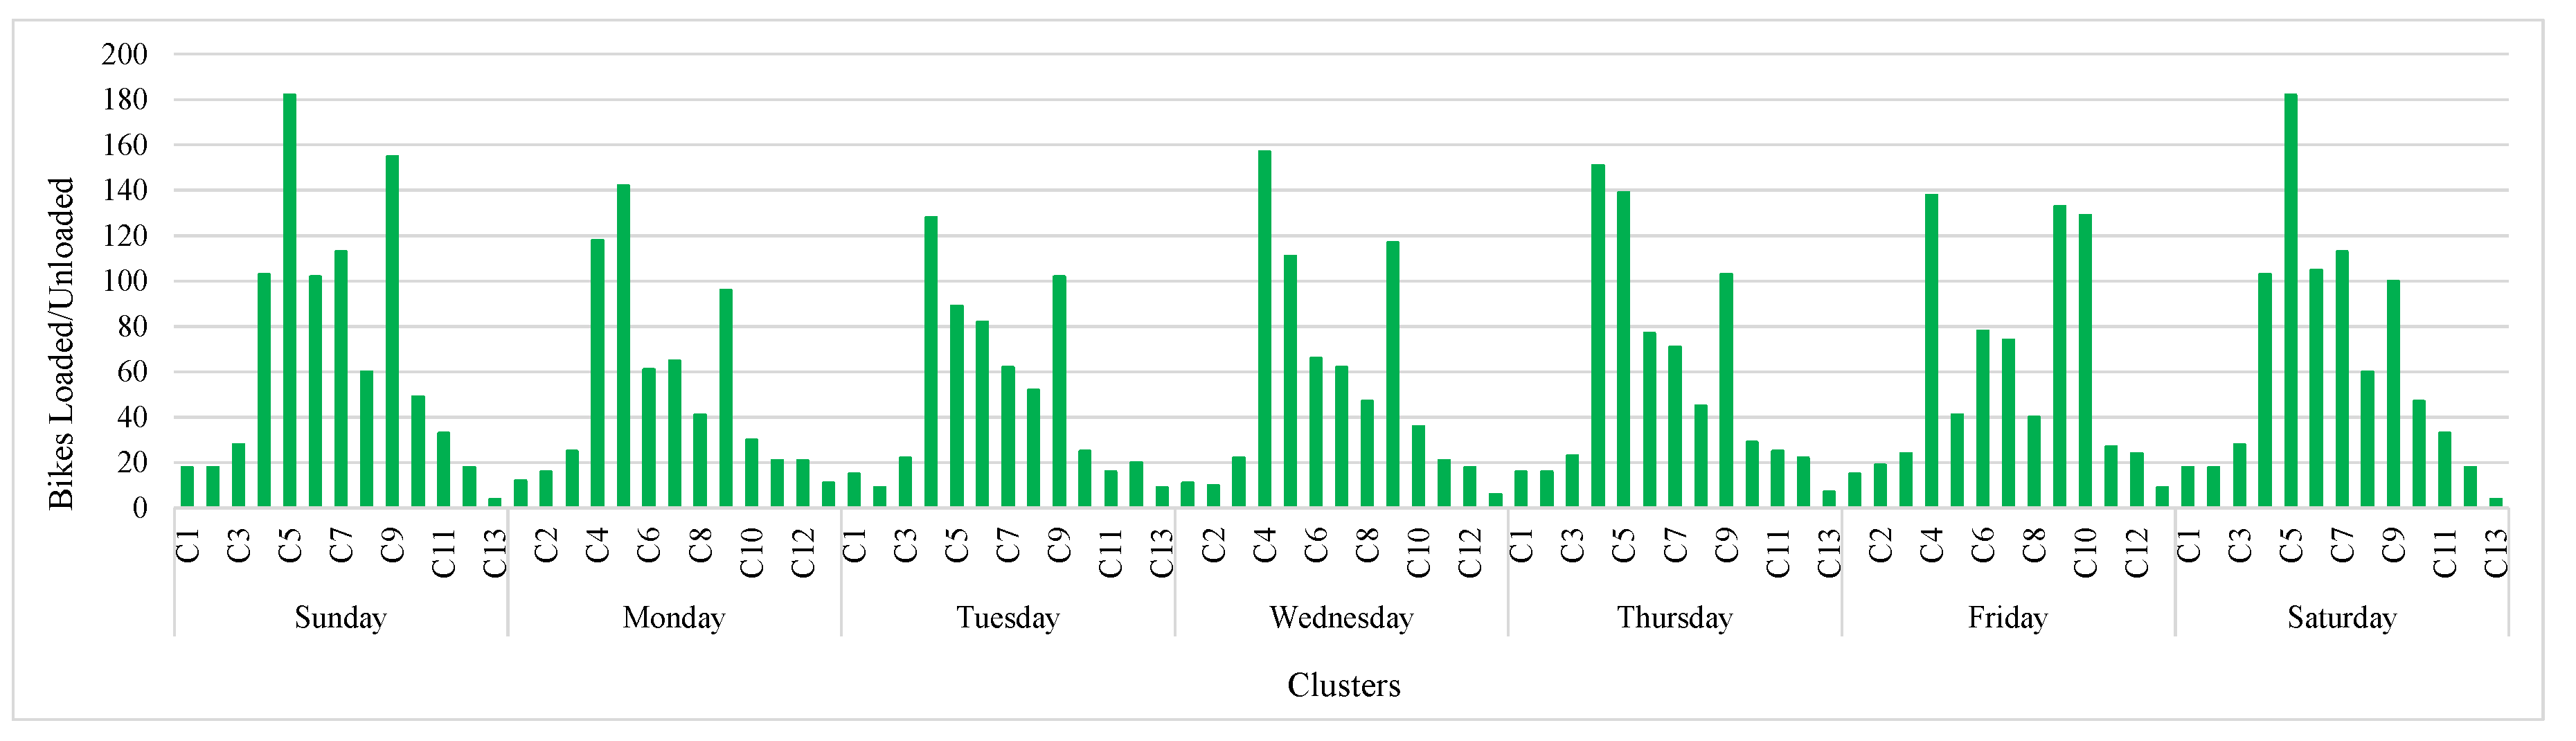
Figure 10 shows the number of bikes loaded or unloaded at stations of each cluster. Similar patterns are observable for each day. Clusters 4, 5 and 9, which are mid-size clusters in terms of the number of stations, have the highest bike relocating among other clusters.
Table 3 indicates the percent of stations visited, the number of bikes loaded/unloaded in a rebalancing tour and the tour length for each day. It can be realized that about 30 percent of stations do not have any bike deficiency. This is due to the user-based rebalancing that occurred in the network during the day. It can be concluded that the user-based portion of bike rebalancing in a bike sharing network is significant and has two important effects on the network rebalancing. First, it eliminates extra tours for rebalancing bikes over the bike sharing network. Second, it reduces the number of stations that need to be considered in a rebalancing process and consequently solving the problem becomes easier and much faster.
4.4.2. Inter-Cluster
Inter-cluster trips lead to an unbalanced distribution of bikes over clusters. Cluster bike deficiency means the number of bikes that need to be entered to or taken out of each cluster. After determining the bike deficiency for each cluster, which is derived from the intra-cluster rebalancing level, the rebalancing tour will be calculated between clusters. Table 4 demonstrates the bike deficiency for each cluster for a week. It can be concluded that the grand total (cumulative sum) of bike deficiency is equal to zero since the overall system is balanced (unless a bike is broken or stolen). The significant result is the number of clusters with the zero deficiency which implies that they do not need inter-cluster rebalancing (as result of the clustering). This reinforces the fact that inward and outward trips to those clusters are equal and not leading to unbalances. Therefore, these clusters are reducing the total rebalancing tour length significantly as they do not attend in inter-cluster rebalancing process.
Figure 11 depicts the bike unbalances among clusters for a week. It demonstrates the portion of clusters which need (or do not need) to be balanced. Among clusters needing to be balanced, there is a logical trend for setting up a rebalance tour as the extra bikes at a cluster could compensate the other cluster needs. As can be seen from Figure 11, cluster 9 can compensate cluster 5 deficiency (clusters 9 and 5 are geographically close to each other according to Figure 9) since only these two clusters have significant bike unbalances. Besides, it can be concluded that the trends for bike loading/unloading has a similar pattern which could be predicted for other weeks.
After determining bike unbalances at each cluster, the last step is to determine the routes between the clusters. Figure 12 demonstrates the rebalancing process for Monday. Clusters 4, 7, 8, 11, 12 and 13 have no deficiency at the inter-cluster level, therefore the rebalancing vehicle would not visit these clusters. It is worth mentioning that these clusters only need rebalancing at the intra-cluster level.
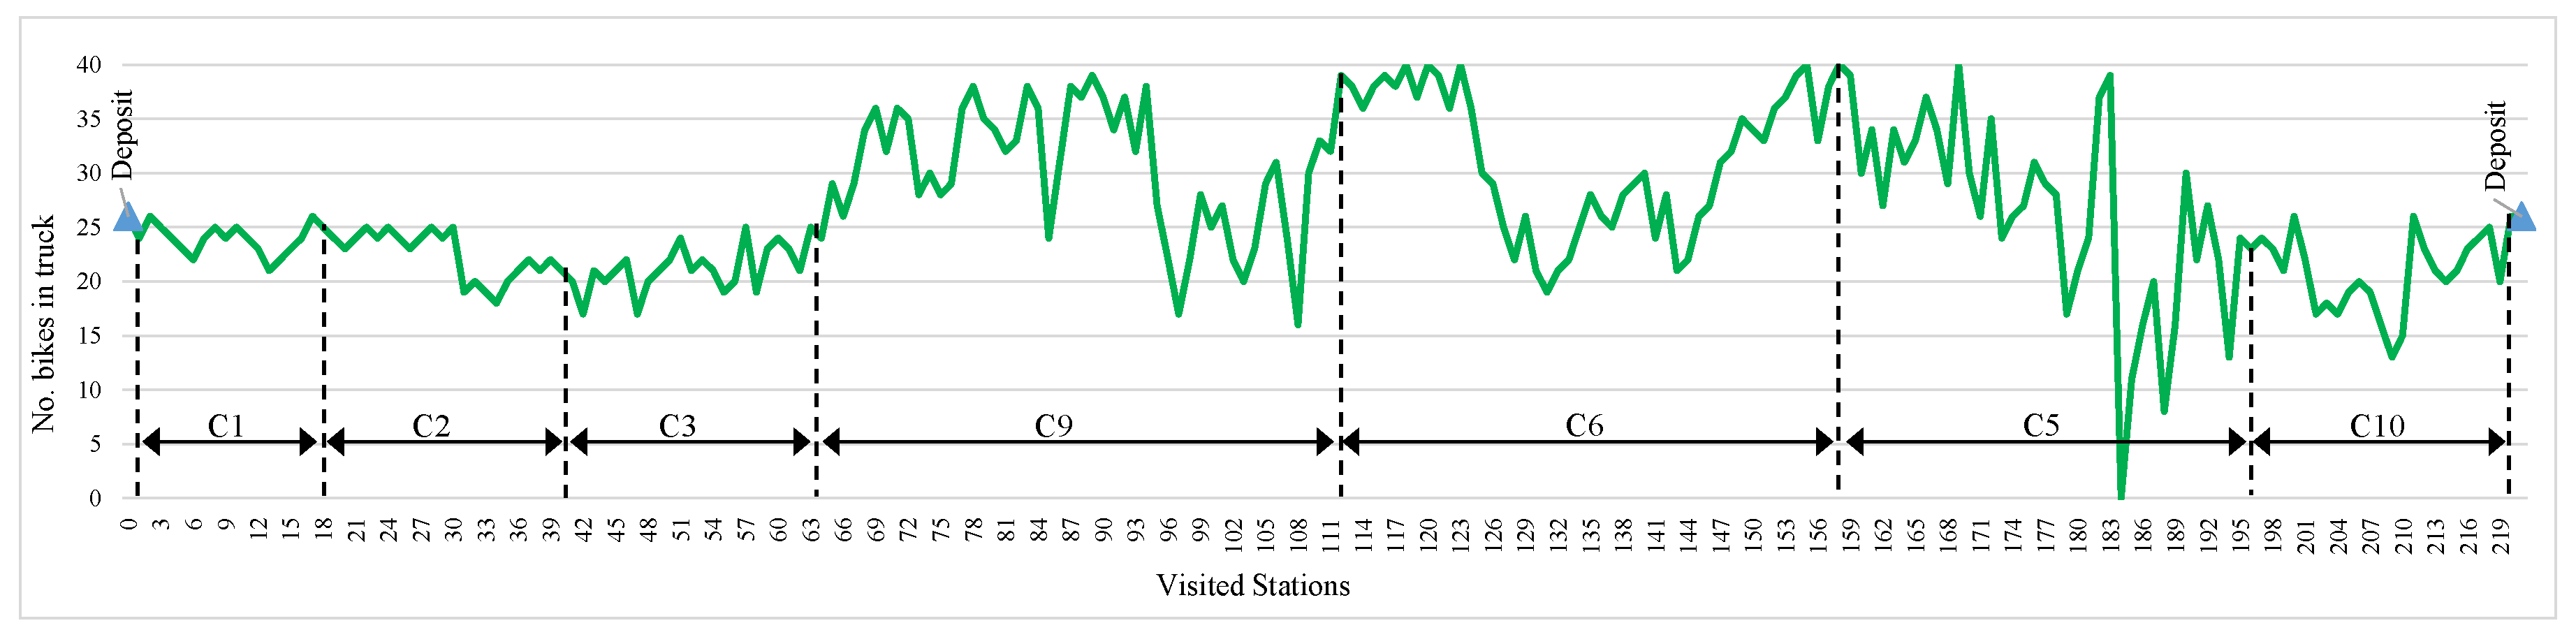
The rebalancing objective is to find a least-cost route that meets the demand of all stations and does not violate the minimum (zero) and maximum (vehicle capacity) load limits along the tour. Bikes loaded and unloaded at each stop determine the number of bikes at the beginning and end of each tour. Figure 13 plots the number of bikes on the vehicle for the inter-cluster rebalancing tour. It shows that the rebalancing vehicle sets off with 26 bikes from the deposit, visits 221 stations and finally goes back with the 26 bikes (the initial amount) to the deposit. As can be seen the number of bikes inside the truck are in the capacity range of the truck and does not violate the lower and upper bounds.
4.5. Validation
One of the main purposes of rebalancing is to supply users’ demand for bikes and vacant docks at each station. In order to evaluate the model efficiency, the model is run for two scenarios. Scenario I is independently implementing the model for Tuesday and conducting the rebalancing process based on the transactions for Tuesday in the data set. In Scenario , rebalancing the network for the day before, that is, Monday is carried out first and then with the gained results, the model is implemented for rebalancing Tuesday. Table 5 shows the tour lengths in kilometer for all clusters both for scenario I and scenario II. Length of tours for all clusters is decreased by switching to the second scenario. Results indicate the proposed model can reduce the length of the total rebalancing tour length by 30%.
5. Discussion and Conclusions
From the operational viewpoint of bike sharing systems, one of the challenges is to keep the balance of bikes which are scattered in an unbalanced way over the stations due to the users’ one-way daily trips. In order to keep providing service to users, operators try to rebalance bikes either once a day (i.e., static rebalancing) or many times a day (i.e., dynamic rebalancing). Finding a rebalancing strategy with the least possible cost (including operation, maintenance and environmental cost) is pivotal in the success of bike sharing systems.
In the literature, most of the studies deal with the static rebalancing problem [1,4,5,10,11,14,15,17]. The reason is three-fold. First, the dynamic rebalancing is expensive and as a result, most companies perform the static rebalancing in real cases. Second, the density of morning peak trips is usually more than the evening peak in most weekdays which reinforces the rationale to keep the network balance for the morning peak (static operations). Third, the dynamic rebalancing is the complex form of the static problem where the demand is varying and eventually can be converted into sub static problems for different time slots. For these reasons, it could be argued that static rebalancing still has its own currency both in literature and for operating companies.
Studies focusing on the static rebalancing problem, approach the optimization problem itself mathematically and consider it as a Pickup and Delivery Traveling Salesman problem [18] with different objective functions (from minimizing the general costs to maximizing the user satisfaction). Despite the rich optimization solutions in recent work, from a transportation point of view, there is less effort in considering the users’ behavior in the network and determining the user-based rebalancing itself. This could be effectively carried out today with the availability of data.
To overcome the state of the art, this paper proposes a bottom-up clustering model to solve the static rebalancing problem. The aim of clustering is turning the problem into small size sub-problems. This has two advantages. First, it is easier to perform rebalancing on a small scale rather than the whole network. Second, the computational cost of optimizing hundreds of stations (the case of Chicago with 582 stations for example) would be significantly large [11,17] and clustering lightens the computational process. In the first step, the spatial analysis is done by the hierarchical agglomerative clustering method and a similarity measure based on OD trips. Then, stations are divided into separated clusters. In the second step, two rebalancing levels namely inter-cluster and intra-cluster are defined, where trips and rebalancing take place inside and outside the clusters.
Our method is quite different from typical clustering approaches. Unlike geographically clustered stations in previous studies, by clustering stations based on the OD trips, each cluster contains high intra-cluster trips. This gives a holistic perspective of how trips are concentrated between stations in the network and enables a new approach of rebalancing scheme. It is worth mentioning that with this method, no correlation has been found between the clusters and city functions. The reason is that clusters are defined by all day transactions as the static rebalancing occurs at the end of the day. The spatio-temporal analysis may reveal the inter-correlation between trips, activities and land use. This type of analysis is useful for dynamic rebalancing problems [8].
Finally, the rebalancing problem is modeled into tour finding problems using a single objective genetic algorithm at two different levels (inter and intra-cluster). The primary aim of the operators is to satisfy the demand and minimize the rebalancing costs (in terms of vehicle traveled distance) which both are addressed in this paper by balancing the number of bikes at each station to a predefined target value (enough vacant docks and bikes for the next morning demand) and setting the objective function to minimize the total tour length.
The proposed model is implemented in the Chicago bike sharing network. It is possible to enhance the efficiency of rebalancing by means of a clustering method. This conclusion is supported by Table 5 where the rebalancing of the network for one day has positive effects on a subsequent day. Results show a decrease in the length of tours for almost all clusters and the total tour length drops approximately by 30%. This illustrates the capability of the model to eliminate the extra tours and to reduce the length of the rebalancing tours significantly, which is ultimately a direct cost to the operator and indirect cost to the sustainable bike sharing systems.
Furthermore, in a large scale system, the rebalancing operation is difficult, expensive and needs an appropriate strategy. It has been observed that only a portion of stations (ranges from 64 to 70% in Table 3) needs rebalancing and roughly 33% of stations do not attend in the rebalancing process (which shows the users’ role in rebalancing). In order to cope with the rebalancing problem in a large scale, using our proposed model would have two suggestions for the practitioners: (1) Inter-cluster rebalancing is not necessary due to the small number of deficiency outside the clusters. (2) Incentives could be arranged to encourage riders returning bikes to certain stations that would help with decreasing the intra-cluster rebalancing costs.
In the end, considering the network topology and available data of the case study, it would be possible to reduce the rebalancing tours, providing the operators with beneficial interventions on the system such as giving incentives or limiting the inter-cluster rebalancing. The future research may focus on optimization models with more details to solve the rebalancing problem in terms of one visit per station, the number of vehicles and rebalancing staff. Also, the effects of different clustering algorithms, considering both spatial and temporal dimensions [29], should be investigated on the outcome of the proposed model.
Author Contributions
Conceptualization, B.L. and H.F.; methodology, B.L.; software, H.F.; validation, A.S.-N.; formal analysis, H.F.; investigation, B.L. and H.F.; resources, A.S.-N.; data curation, B.L. and H.F.; writing–original draft preparation, B.L.; writing–review and editing, A.S.-N. and S.-M.C.; visualization, H.F.; supervision, A.S.-N.; project administration, S.-M.C.; funding acquisition, S.-M.C.
Funding
This research was supported by MSIT (Ministry of Science and ICT), Korea, under the ITRC (Information Technology Research Center) support program (IITP-2019-2016-0-00312) supervised by the IITP (Institute for Information & communications Technology Planning & Evaluation).
Conflicts of Interest
The authors declare no conflict of interest. The funders had no role in the design of the study; in the collection, analyses, or interpretation of data; in the writing of the manuscript, or in the decision to publish the results.
References
- Dell’Amico, M.; Hadjicostantinou, E.; Iori, M.; Novellani, S. The bike sharing rebalancing problem: Mathematical formulations and benchmark instances. Omega 2014, 45, 7–19. [Google Scholar] [CrossRef]
- Faroqi, H.; saadi Mesgari, M. Performance comparison between the multi-colony and multi-pheromone ACO algorithms for solving the multi-objective routing problem in a public transportation network. J. Navig. 2016, 69, 197–210. [Google Scholar] [CrossRef]
- Faroqi, H.; Sadeghi-Niaraki, A. GIS-based ride-sharing and DRT in Tehran city. Public Transp. 2016, 8, 243–260. [Google Scholar] [CrossRef]
- Li, Y.; Szeto, W.Y.; Long, J.; Shui, C.S. A multiple type bike repositioning problem. Transp. Res. Part B Methodol. 2016, 90, 263–278. [Google Scholar] [CrossRef] [Green Version]
- Pal, A.; Zhang, Y. Free-floating bike sharing: Solving real-life large-scale static rebalancing problems. Transp. Res. Part C Emerg. Technol. 2017, 80, 92–116. [Google Scholar] [CrossRef]
- Zhang, D.; Yu, C.; Desai, J.; Lau, H.Y.K.; Srivathsan, S. A time-space network flow approach to dynamic repositioning in bicycle sharing systems. Transp. Res. Part B Methodol. 2017, 103, 188–207. [Google Scholar] [CrossRef]
- Wang, X.; Lindsey, G.; Schoner, J.E.; Harrison, A. Modeling bike share station activity: Effects of nearby businesses and jobs on trips to and from stations. J. Urban Plan. Dev. 2015, 142, 4015001. [Google Scholar] [CrossRef]
- Caggiani, L.; Camporeale, R.; Ottomanelli, M.; Szeto, W.Y. A modeling framework for the dynamic management of free-floating bike-sharing systems. Transp. Res. Part C Emerg. Technol. 2018, 87, 159–182. [Google Scholar] [CrossRef]
- Shui, C.S.; Szeto, W.Y. Dynamic green bike repositioning problem—A hybrid rolling horizon artificial bee colony algorithm approach. Transp. Res. Part D Transp. Environ. 2018, 60, 119–136. [Google Scholar] [CrossRef]
- Forma, I.A.; Raviv, T.; Tzur, M. A 3-step math heuristic for the static repositioning problem in bike-sharing systems. Transp. Res. Part B Methodol. 2015, 71, 230–247. [Google Scholar] [CrossRef]
- Cruz, F.; Subramanian, A.; Bruck, B.P.; Iori, M. A heuristic algorithm for a single vehicle static bike sharing rebalancing problem. Comput. Oper. Res. 2017, 79, 19–33. [Google Scholar] [CrossRef]
- Alvarez-Valdes, R.; Belenguer, J.M.; Benavent, E.; Bermudez, J.D.; Muñoz, F.; Vercher, E.; Verdejo, F. Optimizing the level of service quality of a bike-sharing system. Omega 2016, 62, 163–175. [Google Scholar] [CrossRef]
- Dondo, R.; Cerdá, J. A cluster-based optimization approach for the multi-depot heterogeneous fleet vehicle routing problem with time windows. Eur. J. Oper. Res. 2007, 176, 1478–1507. [Google Scholar] [CrossRef]
- Chemla, D.; Meunier, F.; Calvo, R.W. Bike sharing systems: Solving the static rebalancing problem. Discr. Optim. 2013, 10, 120–146. [Google Scholar] [CrossRef]
- Liu, J.; Sun, L.; Chen, W.; Xiong, H. Rebalancing bike sharing systems: A multi-source data smart optimization. In Proceedings of the 22nd ACM SIGKDD International Conference on Knowledge Discovery and Data Mining, San Francisco, CA, USA, 13–17 August 2016; pp. 1005–1014. [Google Scholar]
- Schuijbroek, J.; Hampshire, R.; van Hoeve, W.J. Inventory rebalancing and vehicle routing in bike sharing systems. Eur. J. Oper. Res. 2017, 257, 992–1004. [Google Scholar] [CrossRef] [Green Version]
- Erdoğan, G.; Battarra, M.; Calvo, R.W. An exact algorithm for the static rebalancing problem arising in bicycle sharing systems. Eur. J. Oper. Res. 2015, 245, 667–679. [Google Scholar] [CrossRef] [Green Version]
- Erdoğan, G.; Laporte, G.; Calvo, R.W. The static bicycle relocation problem with demand intervals. Eur. J. Oper. Res. 2014, 238, 451–457. [Google Scholar] [CrossRef] [Green Version]
- Regue, R.; Recker, W. Proactive vehicle routing with inferred demand to solve the bikesharing rebalancing problem. Transp. Res. Part E Logist. Transp. Rev. 2014, 72, 192–209. [Google Scholar] [CrossRef]
- Waserhole, A.; Jost, V. Vehicle Sharing System Pricing Regulation: A Fluid Approximation. 2012. Available online: https://hal.archives-ouvertes.fr/hal-00727041v4/document (accessed on 8 June 2019).
- Contardo, C.; Morency, C.; Rousseau, L.M. Balancing a Dynamic Public Bike-Sharing System; Centre Interuniversitaire de Recherche sur les Réseaux d’Entreprise, la Logistique et le Transport (CIRRELT): Montreal, QC, Canada, 2012; Volume 4. [Google Scholar]
- Caggiani, L.; Camporeale, R.; Ottomanelli, M. A dynamic clustering method for relocation process in free-floating vehicle sharing systems. Transp. Res. Procedia 2017, 27, 278–285. [Google Scholar] [CrossRef]
- Feng, Y.; Affonso, R.C.; Zolghadri, M. Analysis of bike sharing system by clustering: the Vélib’case. IFAC-PapersOnLine 2017, 50, 12422–12427. [Google Scholar] [CrossRef]
- Ferreira, L.; Hitchcock, D.B. A comparison of hierarchical methods for clustering functional data. Commun. Stat.-Simul. Comput. 2009, 38, 1925–1949. [Google Scholar] [CrossRef]
- Zaki, M.J.; Meira, W., Jr.; Meira, W. Data Mining and Analysis: Fundamental Concepts and Algorithms; Cambridge University Press: New York, NY, USA, 2014. [Google Scholar]
- Rousseeuw, P.J. Silhouettes: A graphical aid to the interpretation and validation of cluster analysis. J. Comput. Appl. Math. 1987, 20, 53–65. [Google Scholar] [CrossRef] [Green Version]
- de Amorim, R.C. Feature relevance in ward’s hierarchical clustering using the L p norm. J. Classif. 2015, 32, 46–62. [Google Scholar] [CrossRef]
- Deb, K.; Pratap, A.; Agarwal, S.; Meyarivan, T. A fast and elitist multiobjective genetic algorithm: NSGA-II. IEEE Trans. Evol. Comput. 2002, 6, 182–197. [Google Scholar] [CrossRef] [Green Version]
- Faroqi, H.; Mesbah, M.; Kim, J. Comparing Sequential with Combined Spatiotemporal Clustering of Passenger Trips in the Public Transit Network Using Smart Card Data. Math. Probl. Eng. 2019, 2019, 5070794. [Google Scholar] [CrossRef]
Figure 1.
Rebalancing schematic scheme.

Figure 2.
Solution approach.

Figure 3.
An example for the bike sharing data set and origin-destination (OD) matrix.

Figure 4.
The genetic algorithm main steps.

Figure 5.
The genetic algorithm illustration.

Figure 6.
Weather condition vs. number of trips.

Figure 7.
Temporal and spatial analysis of one week.

Figure 8.
Density of traveled distance.

Figure 9.
Clusters.

Figure 10.
Bikes loaded/unloaded at each cluster.

Figure 11.
Clusters bike unbalances.

Figure 12.
Inter-cluster rebalancing.

Figure 13.
Number of bikes on the rebalancing vehicle.


Table 1.
Summary of the rebalancing literature.
| Reference | Type | Mathematical Approach | Objective |
|---|---|---|---|
| Dell’Amico et al. [1] | Static | mixed integer linear programming | Minimizing total traveling cost |
| Cruz et al. [11] | Static | iterated local search (ILS) | Minimizing total traveling cost |
| Chemla et al. [14] | Static | integer program | Minimizing total traveling cost |
| Forma et al. [10] | Static | mixed integer linear programming | Minimize unserved users and the total traveling distance |
| Liu et al. [15] | Static | mixed integer linear programming | Minimize the total traveling distance |
| Schuijbroek et al. [16] | Static | Constraint Programming | Optimal vehicle routes |
| Li et al. [4] | Static | mixed integer linear programming | Minimize the total cost |
| Alvarez-Valdes et al. [12] | Static | a heuristic algorithm | Minimizing the overall cost of unsatisfied demands |
| Pal and Zhang [5] | Static | mixed integer linear programming | Minimize the make-span of the fleet of rebalancing vehicles |
| Erdogan et al. [17] | Static | Exact method Greedy | Minimize rebalancing costs |
| Erdogan et al. [18] | Static | Exact method integer programming | Minimize travel and handling costs |
| Shui and Szeto [9] | Dynamic | artificial bee colony algorithm | Minimizes the total unmet demand and the fuel and CO emission cost |
| Zhang et al. [6] | Dynamic | mixed-integer problem | Minimizes the total unmet demand and route |
| Caggiani et al. [8] | Dynamic | Travelling Salesman Problem | Minimize cost and maximization of user satisfaction |
Table 2.
Clusters rebalancing result.
| Clusters | Visited Stations | Not-Visited Stations | Tour (km) |
|---|---|---|---|
| C1 | 19 | 11 | 33 |
| C2 | 23 | 112 | 113 |
| C3 | 23 | 3 | 24 |
| C4 | 41 | 5 | 49 |
| C5 | 37 | 4 | 47 |
| C6 | 45 | 10 | 93 |
| C7 | 45 | 8 | 82 |
| C8 | 29 | 6 | 35 |
| C9 | 52 | 6 | 82 |
| C10 | 25 | 6 | 38 |
| C11 | 25 | 7 | 46 |
| C12 | 19 | 7 | 29 |
| C13 | 9 | 5 | 8 |
Table 3.
Intra-Cluster rebalance tours.
| Day | % Visited | Total Bikes Loaded/Unloaded | Tour (Km) |
|---|---|---|---|
| Monday | 67 | 659 | 676 |
| Tuesday | 66 | 631 | 648 |
| Wednesday | 64 | 684 | 619 |
| Thursday | 70 | 724 | 720 |
| Friday | 68 | 751 | 727 |
| Saturday | 68 | 829 | 679 |
| Sunday | 68 | 883 | 689 |
Table 4.
Inter-cluster bike deficiency.
| Day | C1 | C2 | C3 | C4 | C5 | C6 | C7 | C8 | C9 | C10 | C11 | C12 | C13 | Tour (Km) |
|---|---|---|---|---|---|---|---|---|---|---|---|---|---|---|
| Sunday | 0 | 0 | 0 | 2 | 13 | 0 | 0 | 0 | −21 | 7 | 0 | −1 | 0 | 28 |
| Monday | 1 | 4 | −4 | 0 | 17 | −1 | 0 | 0 | −14 | −3 | 0 | 0 | 0 | 46 |
| Tuesday | 0 | 0 | −2 | 3 | 10 | 1 | 0 | −1 | −11 | 0 | 0 | 0 | 0 | 14 |
| Wednesday | 1 | 0 | −2 | 1 | 5 | −1 | 0 | 0 | −6 | 2 | 0 | 0 | 0 | 19 |
| Thursday | 0 | 0 | 0 | 1 | 4 | 1 | 0 | 0 | −6 | −5 | 0 | 5 | 0 | 32 |
| Friday | 0 | −1 | −4 | 5 | 25 | −1 | 0 | 0 | −25 | 4 | 0 | −3 | 0 | 40 |
| Saturday | 0 | −1 | 0 | 1 | 37 | 3 | 0 | −2 | −41 | 5 | 0 | −2 | 0 | 46 |
Table 5.
Tour length before/after validation.
| Cluster | Scenario I | Scenario II |
|---|---|---|
| C1 | 31 | 21 |
| C2 | 75 | 50 |
| C3 | 26 | 23 |
| C4 | 51 | 35 |
| C5 | 50 | 35 |
| C6 | 96 | 61 |
| C7 | 88 | 68 |
| C8 | 40 | 27 |
| C9 | 80 | 57 |
| C10 | 32 | 22 |
| C11 | 53 | 32 |
| C12 | 19 | 17 |
| C13 | 8 | 8 |
| Total (km) | 648 | 456 |
© 2019 by the authors. Licensee MDPI, Basel, Switzerland. This article is an open access article distributed under the terms and conditions of the Creative Commons Attribution (CC BY) license (http://creativecommons.org/licenses/by/4.0/).
Share and Cite
MDPI and ACS Style
Lahoorpoor, B.; Faroqi, H.; Sadeghi-Niaraki, A.; Choi, S.-M. Spatial Cluster-Based Model for Static Rebalancing Bike Sharing Problem. Sustainability 2019, 11, 3205. https://0-doi-org.brum.beds.ac.uk/10.3390/su11113205
AMA Style
Lahoorpoor B, Faroqi H, Sadeghi-Niaraki A, Choi S-M. Spatial Cluster-Based Model for Static Rebalancing Bike Sharing Problem. Sustainability. 2019; 11(11):3205. https://0-doi-org.brum.beds.ac.uk/10.3390/su11113205
Chicago/Turabian StyleLahoorpoor, Bahman, Hamed Faroqi, Abolghasem Sadeghi-Niaraki, and Soo-Mi Choi. 2019. "Spatial Cluster-Based Model for Static Rebalancing Bike Sharing Problem" Sustainability 11, no. 11: 3205. https://0-doi-org.brum.beds.ac.uk/10.3390/su11113205
Note that from the first issue of 2016, this journal uses article numbers instead of page numbers. See further details here.