A Managerial Analysis of Urban Parcel Delivery: A Lean Business Approach


1
INRIA Lille—Nord Europe, Parc scientifique de la Haute Borne 40, av. Halley-Bât A, 59650 Villeneuve d’Ascq, France
2
ICT for City Logistics and Enterprises Center, Politecnico di Torino, 10129 Turin, Italy
3
CARS@Polito, Politecnico di Torino, 10129 Turin, Italy
4
CIRRELT, Pavillon André-Aisenstadt, Montreal, QC H3T 1J4, Canada
*
Author to whom correspondence should be addressed.
Sustainability 2019, 11(12), 3439; https://0-doi-org.brum.beds.ac.uk/10.3390/su11123439
Submission received: 6 May 2019
/
Revised: 6 June 2019
/
Accepted: 7 June 2019
/
Published: 22 June 2019
Abstract
:The improper integration of traditional transportation modes with low emissions vehicles can generate a price war that reduces the service quality, undermining the efficiency and the profitability of parcel delivery operators. This paper aims to provide managerial insights to design a win-win strategy for the co-existence of traditional and green business models. In doing so, we adopt a multi-disciplinary approach that integrates a qualitative analysis through a Lean Business methodology, named GUEST, with a quantitative analysis based on simulation-optimisation techniques. This kind of holistic vision has received little attention in the literature. The first analysis investigates the parcel delivery industry with an emphasis on the main business models involved, their costs and revenues structures, while the quantitative part aims to simulate the system and extract sustainable policies. In particular, results highlight that in deploying mixed-fleet policies, the decision-makers have to focus both on the environmental sustainability that benefits from the adoption of low-emission vehicles, and on the operational feasibility and economic sustainability of the two services. In this direction, the paper suggests some managerial insights concerning the split of the customer demand between traditional and green operators, according to the classes of parcels and geographical areas of the city.
1. Introduction
Urban freight transportation and parcel delivery have been subjected to significant paradigm shifts over recent decades, caused by the urbanisation and development of megacities. First, economic development in the mid-1990s led the rise of faster-growing medium-large-sized companies that specialised in the delivery of small parcels, giving birth to the Global Courier, Express, and Parcel (CEP) market [1]. Since the 2000s, the advent of e-commerce and pervasive technologies changed the logistics and freight transportation dramatically, with an increase of the deliveries to the Business-to-Consumer segments in the urban areas and the competition of e-commerce giant platform to cope with the increasing requests for fast and cheap deliveries. Moreover, the awareness of the environmental impact of transportation activities as well as the significant congestion and environmental nuisances encourage the use of non-motorized transport to move people and goods (e.g., bikes and cargo bikes), self-service kiosks (i.e., lockers), and collaborative business models [2,3,4]. As [5,6] point out, the integration of different delivery alternatives is unfortunately not simple due to the relationships and disputes among actors, their business models and the technologies themselves.
To cope with the different issues of such a complex system, City Logistics and new domains, such as the Physical Internet, provide initiatives to optimise the flow of traffic and jointly address the economic, operative, social, and environmental sustainability of transportation and logistics, mitigating the inefficiencies and externalities that characterize the last-mile segment of the supply chain [7]. Despite the rich literature and state-of-the-art on City Logistics, not all solutions and proposals are successfully implemented. Indeed, as [8,9] point out some City Logistics initiatives failed due to the lack of support and commitment from the different actors (with diverse expertise) in the urban areas. This gap is the result of the absence of a managerial view in the deployment of policies for sustainable freight transportation and logistics. Indeed, usually implementation and proposal are too focused on the technological aspects as platforms, or optimization tools, missing a global vision and the lack between the business and operational models. To the best of our knowledge, a holistic vision of such a complex and hyper-connected system that integrates an actors’ behaviour analysis, economic and managerial considerations into simulation and optimisation tools, has little attention in the literature. In particular, works by [3,10] represent first attempts to overcome this lack. The authors in [10] developed a last-mile typology and an instrument to simulate the total last-mile costs.
Our contributions to the literature are the following:
- In terms of business models, cost and revenue schemes, and policies, we explore the implementation of green transportation modes, considering integrating them with traditional vehicles. This analysis is completely novel in the literature. Indeed, different contributions deal with the new delivery options and green vehicles, but without considering their impact on the efficiency and profitability of traditional models. In this direction, we recognize the different players in the transportation and parcel delivery system, considering several configurations of traditional vehicles (e.g., trucks and vans that use fossil fuel) and green modes (e.g., electric or hybrid vehicles, bikes, and cargo bikes). We analyze their business models and behaviors from a managerial perspective. In particular, this research adds to the literature on the issues related to incorporating the new business models (e.g., green delivery operated using cargo bikes) with traditional modes, an assessment conducted in the City of Turin (Italy).
- We derive an assessment for the computation of the cost-per-stop of a last-mile delivery operator, independently on the vehicle type in use.
- We highlight as qualitative business management tools (e.g., Business Model Canvas and SWOT analysis) provided by the Lean Business methodology named GUEST, can be useful to understand the context and, gather information and data for solving the optimisation problem and designing win-win strategies that avoid the risk of cannibalisation between models.
- We show how the mix of qualitative and quantitative models can be conjugate the results of the business models and economic analyses proposed in this paper, with quantitative approaches based on Monte Carlo-based simulation-optimisation.
The paper is organized as follows. Section 2 reviews the literature on the urban freight transportation, identifying the main research challenges. Section 3 presents the methodology adopted in this study, which is based on a Lean Business approach. Then, Section 4 describes the multi-actor system of urban parcel delivery, presenting the business models of the participating actors. The analysis of their cost structures in Section 5 brings depth of understanding to the operating costs connected to the different types of vehicles. The results are summarized in Section 6, providing relevant insights concerning the relationships between operators and defining mixed-fleet policies. Finally, some conclusions are discussed in Section 7.
2. Literature Review
In recent decades, the researchers and practitioners become more aware of the issues that affect the freight transportation and logistics in urban areas (e.g., traffic, pollution, increasing uncertainty, atomisation of parcel flow [11]). Moreover, the “zero-emissions” challenge imposed by the local authorities and European Commission fosters the researchers and practitioners to design and develop solutions to make this complex system more innovative and competitive, while reducing its inefficiencies and environmental impact. A consistent framework of the literature concerns the sustainability of urban freight transportation and parcel delivery. Different papers in this framework propose several measures grouped into four main categories [9,12,13]: material/infrastructural (e.g., infrastructure reserved for freight operations as urban consolidation centers, lay-by zones etc.), immaterial/technological (i.e., Intelligent Transportation Systems), governance/regulation (e.g., road pricing, access times, maximum parking times, heavy vehicle networks, restricted access zones, “low traffic zones” (LTZ), etc.) and collaborative systems (e.g., co-modality and multi-modality). This last category includes solutions at the planning level that regard how the freight moves within the city, fostering the collaboration among the different actors, transportation modes and integrating people and freight. Many experiences in different cities [6,14,15,16,17,18,19,20] address the potential of multi-modality and intermodality that integrate traditional vans with non-motorized vehicles as cargo bikes, for sustainable urban freight transport, encouraging their diffusion.
Other contributions (e.g., [21,22]) propose mathematical models to schedule and optimize the routing of heterogeneous fleet, considering costs and emissions.
As highlighted in the introduction, these contributions are focused on the technical aspects of the problem, disregarding the managerial point of view and, thus, lacking of a strategic holistic vision. Indeed, in our opinion, a gap in the literature is represented by a whole analysis of the business model of the main actors in parcel delivery systems and their business development considerations, including the discussion of costs schemes. In particular, the literature explores the implementation of green transportation modes without taking into account their impact on the overall system in terms of operations, costs and revenues, and policies when integrated with traditional modes. As above mentioned, the works by [3,10] represent first attempts to simulate the last-mile costs.
This study addresses the following two main research questions:
- Is is possible and valuable to integrate business and operational models in urban parcel delivery, through a multi-disciplinary approach?
- Which are the benefits and implications of the integration of traditional transportation modes and low-emissions vehicles in the urban context?
Our study is the first attempt to fill the above discussed gaps in the literature. The strength of the proposed analysis relies on a powerful mix of qualitative research from a business perspective of parcel delivery systems, and operations of such systems, including interactions between international couriers and third-party companies that manage the last-mile operations.
3. Methodology
As mentioned before, the literature on the parcel delivery systems is focused on operational facets, disregarding the managerial considerations and links among the main players. To overcome this gap in the literature, we adopt the GUEST methodology [23,24]. It is a Lean Business approach that arises from the works by [25] and other lean startup framework, adapted to cope with multi-actor complex systems (MACSs), such as urban freight transportation [4,26,27]. The GUEST methodology is used to analyze the actors and stakeholders requirements from the beginning of the solution design and considering them throughout the overall implementation. The result is a higher commitment from the different actors and market acceptance of the outputs, generating network effect vital for the new collaborative business models, overcoming the issues of current City Logistics measures, identified in the Section 1.
The acronym GUEST derives from the five phases of the methodology, which have been attuned to the urban parcel delivery context as follows:
- Go. In this phase, we analyse the operators in the last mile segment, investigating their company profile, their current behaviour and, internal and external forces that interact with them and affect their businesses. The aim is to collect data and information and provide a comprehensive overview of the stakeholders’ profiles regarding their requirements and cost structures.
- Uniform. The information gathered in the Go phase must be expressed in a standard form to achieve a shared vision of the MACS. In this phase, the governance mechanisms and business models are investigated using the Business Model Canvas [25]. It is a graphical tool coming from the lean startup movement and it shows how the proposed solution creates value in terms of benefits, products and services, for the different stakeholders. Its strengths rely on its simplicity of use and to highlight in an intuitive and understandable manner, how the integration of traditional transportation modes and green vehicles can deal with the different operators needs and how they can obtain benefits. Moreover, opportunities and threats of this integration are identified using a SWOT analysis. It is a strategic planning method useful to identify strengths, weaknesses, opportunities, and threats related to the different business models in urban freight transportation and parcel delivery.
- Evaluate. For each transportation option, we explicitly define the cost and revenue structures. Moreover, we conduct an in-depth assessment and comparison of business models, with focus on the relevant links between business and operational model.
- Solve. Solve. The outcomes from the managerial analyses conducted in the previous phases represented the inputs by means of the simulation-optimisation tool defined in [6]. The aim is to get a global view of the complex system as a whole.
- Test. In this phase, we test and analyze the outcomes provided by the Monte Carlo simulation, to design policies adequate for heterogeneous fleet.
As the authors in [3,28] point out, we can observe a lack of available realistic benchmark dataset for testing City Logistics solutions. Indeed, the instances in the literature do not come from real or realistic settings, but they are usually based on the generalisation of classical instances or artificial data often not generated for urban applications, making difficult the assessment of new models. The reason of such unavailability of real data relies on the poor commitment of the stakeholders and their availability to share information as well as the high effort in terms of time and expertise needed to gather these realistic data and to embed them in the decision-support systems. The data streams concerning the business models, the cost structures, and the operations used in this paper are realistic and they are provided by a worldwide parcel delivery company and by stakeholders respectively involved in the two research projects URBan Electronic LOGistics (URBeLOG) and Synchro-NET [27,29,30]. In particular, we conducted interviews with the CEO, COO and marketing directors of the companies operating parcel delivery in Italy, and an in-depth analysis of their financial statements, to obtain information concerning the business models and costs structures.
4. Managerial Analysis of the Urban Parcel Delivery
The urban freight transportation and parcel delivery system involves multiple actors with sometimes conflicting goals and objectives. We identify the following five main actors:
- International courier delivery services (hereinafter, International courier). It is the company that manages the long-haul shipments at global and national levels.
- Traditional subcontractor. Once the goods coming from the long-haul shipments arrive at the urban distribution centres located in the outskirt of the city, the traditional subcontractor manages their deliveries in the last-mile segment. In the European market, it is usually a small or medium-sized company, generally organised as a legal form of cooperatives with limited financial and fleet capacity, as stated by [6].
- Green subcontractor. This is a small company that has a business model similar to those of the traditional subcontractor. However, a strong component of its value proposition relies on the low environmental impact of the transportation activities, thanks to the adoption of green vehicles as the cargo bikes.
- Customer. This category refers to the final user of transportation services. We identify different customer segment: business-to-business (B2B), business-to-consumer (B2C), consumer-to-business (C2B), consumer-to-consumer (C2C), and intra-business.
- Authority. This actor refers to the local public administration that manages the city and designs policies for freight transportation in urban areas. It seeks to reduce the environmental pollution, traffic and congestion associated with the transportation activities, as well as their social costs, while improving the quality of live in the city.
In this section, we present the analysis of the main industry-driven operators, investigating their business profiles and interactions. In doing so, we adopt a business development approach, based on the Business Model Canvas, which has not received relevant interest in the literature. In particular, Section 4.1 discusses the business models of these operators, while Section 4.2 presents the SWOT analysis.
4.1. Business Models in Urban Freight Transportation
Section 4.1.1 and Section 4.1.2 discuss the business models of the international courier, traditional subcontractor and green subcontractor, respectively.
4.1.1. Business Model of International Couriers
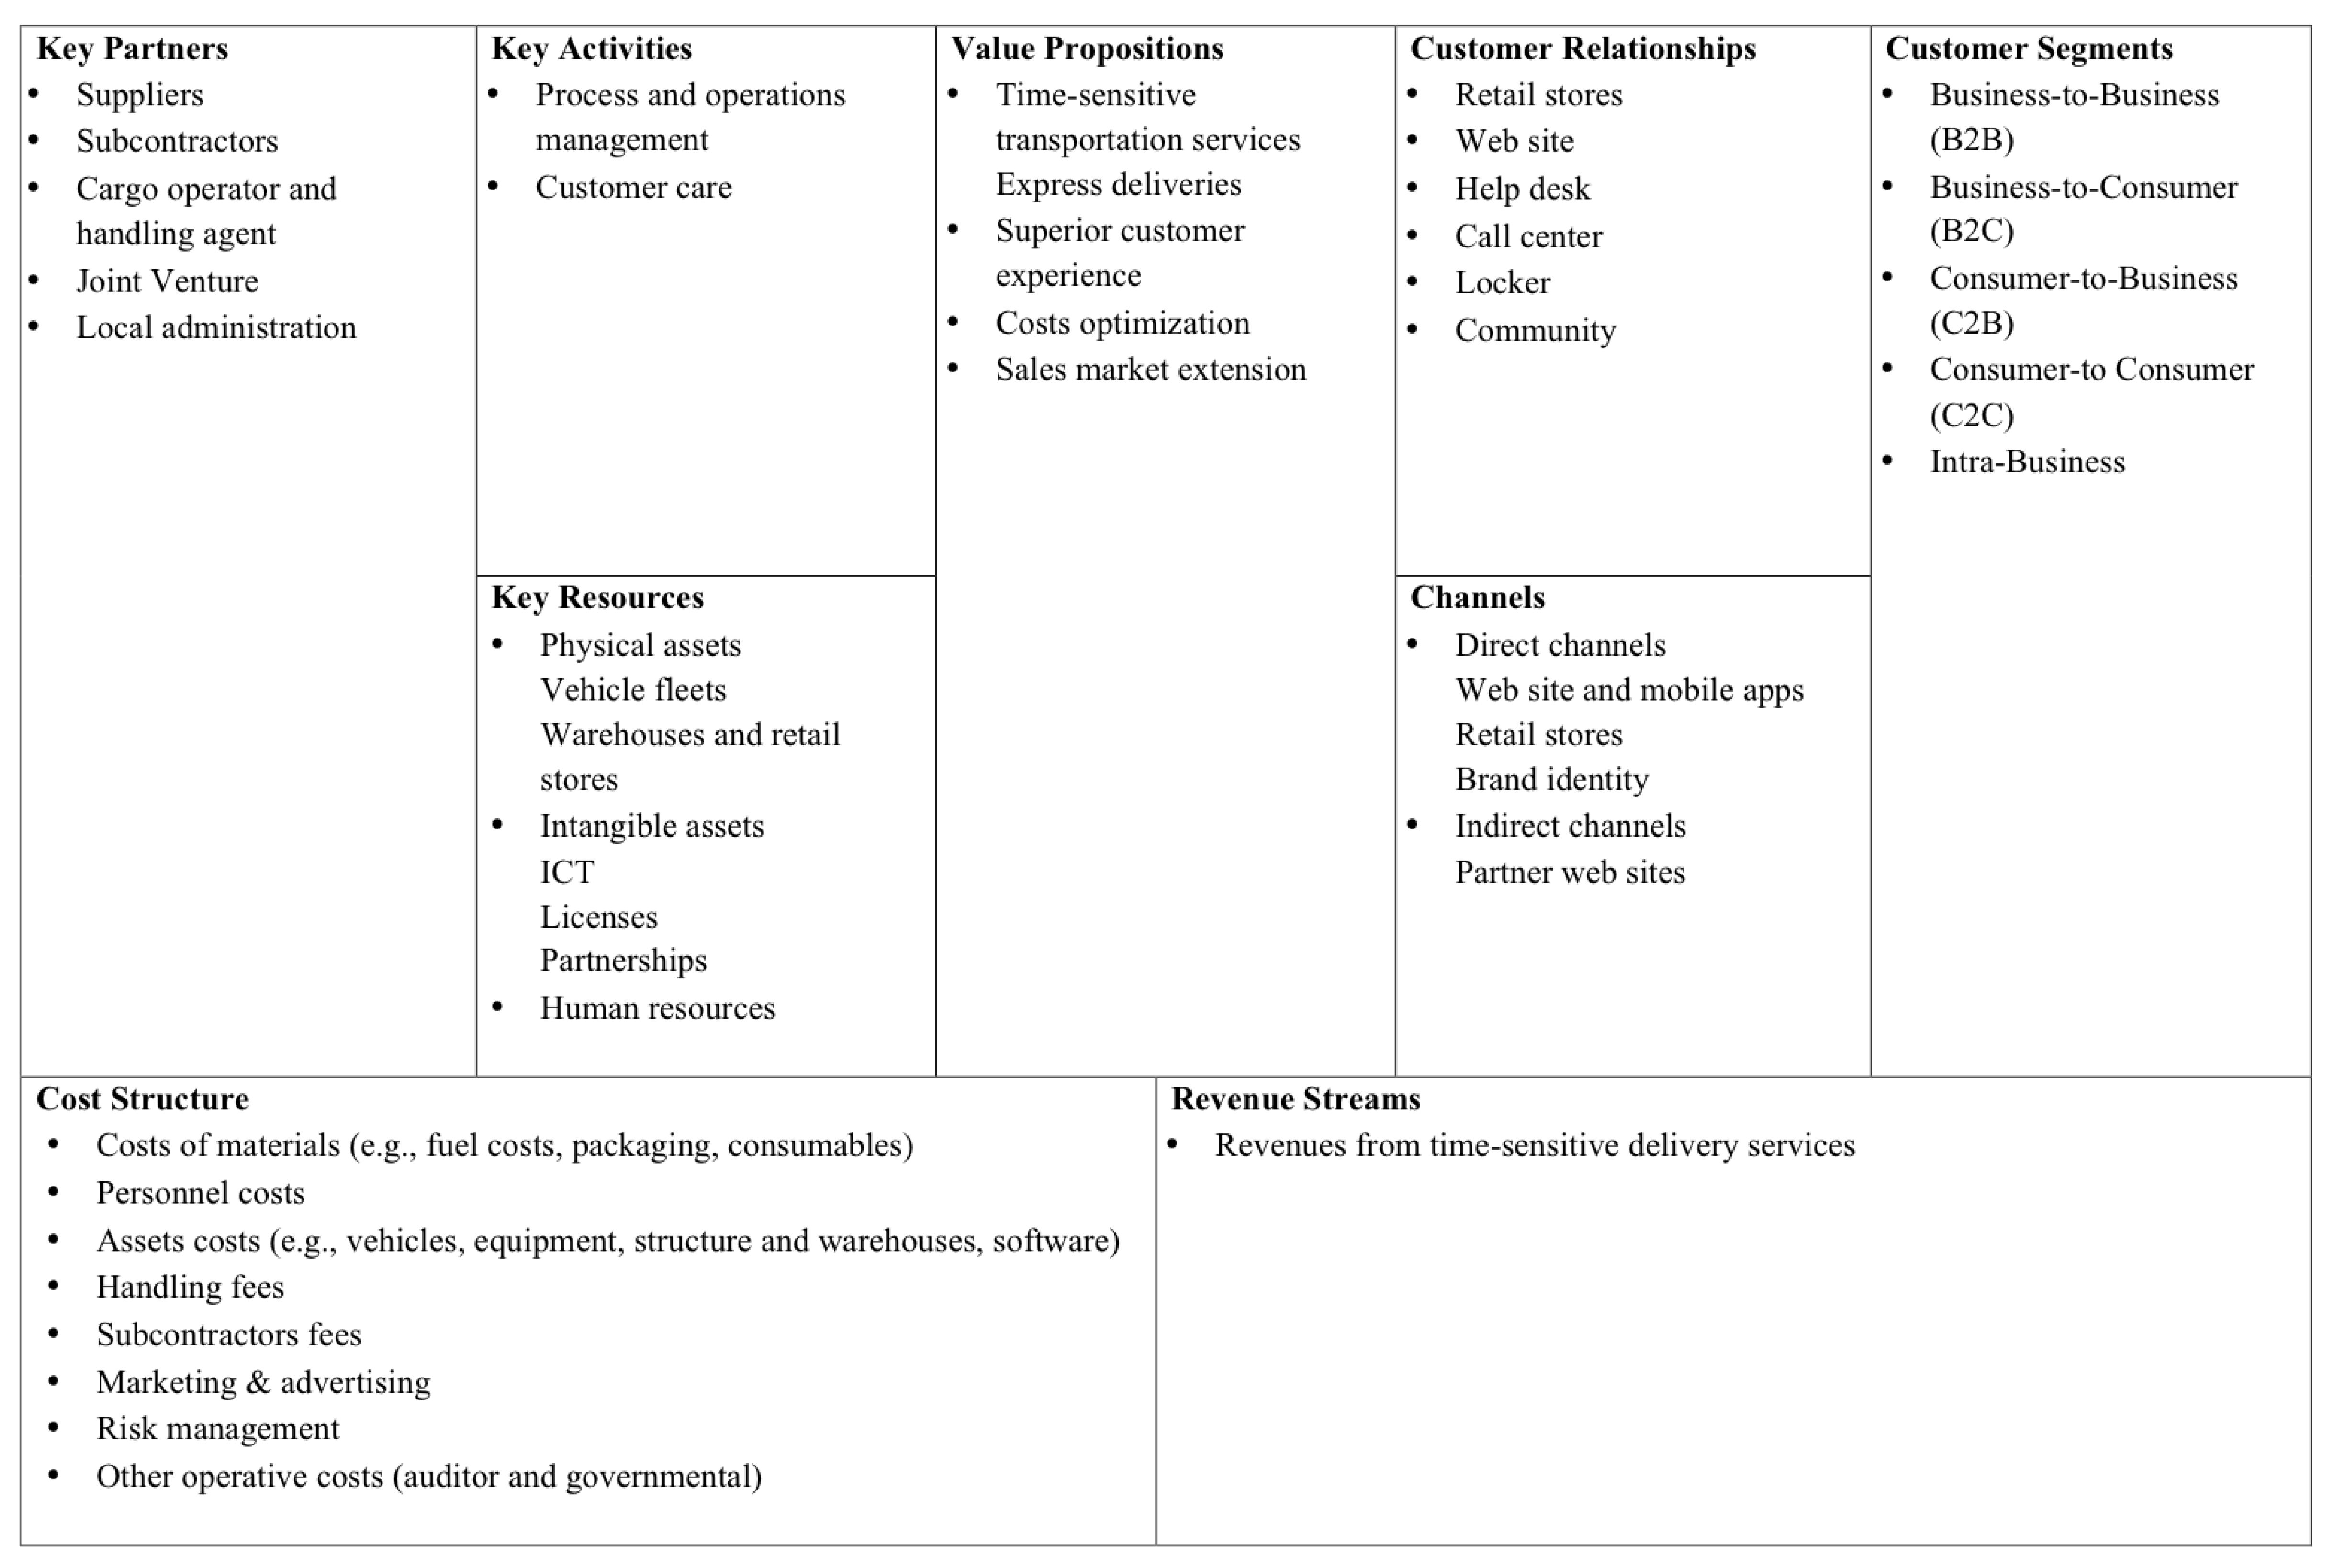
Figure 1 depicts the Business Model Canvas of the international courier. Its main customers can be grouped in the following segments:
- B2B. It is composed by the firms that by means of couriers, move raw material, semi-finished or finished products along their logistics chain towards other companies. This segment also includes the e-commerce flows between e-retailers and between e-retailers and suppliers.
- Intra-business. It consists of the companies that uses courier services to move raw materials, semi-finished or finished products among their different plants and warehouses.
- C2B. It is represented by the flows of goods coming from the reverse logistics (e.g., waste, processing scarps, recycling end-of-life products, customer rejections).
- B2C. It comprises of companies selling products straight to end customers, bypassing distribution chains.
- C2C. This segment is composed by all the orders from private people that require the transportation of goods for personal needs.
The value proposition that the international courier offers is mainly the “time sensitive” transportation of products, due to the critical role of timing (i.e., strict time windows), flexibility and reliability of the delivery to cope with the increasing requests of the modern economy. Another component of the value proposition is a superior customer experience thanks to the benefits derived from shipment efficiency, speed, reliability, security (e.g., through “tracking and tracing”) and customisation of the services received. International couriers usually manage the long-haul shipments, serving the maritime and land transport. As different authors point out [27,31,32], ports and surrounding maritime terminals act as integrated logistics centers vital for the sustainability of urban distribution of goods. However, maritime transport is affected by different challenges related to the growing fuel prices, congestion and traffic at port terminals, and environmental issues that increase the complexity of the last-mile activities. Researchers have an increasing focus on new solutions and models to reduce these issues, while improving the efficiency of operations in maritime terminals, such as the synchromodality and slow steaming [27,31,33,34], and the optimisation of berthing decisions [35]. Although maritime and land transport are strongly related, in this paper we focus on the urban freight transportation. The international courier offers to the small and medium-sized business customers, a cost optimisation service thanks to the express deliveries that allow reducing the inventory level in a Just-In-Time orientation, and the sales market extension.
These time-sensitive delivery services represent the main source of revenues for the international courier that can reach its customer segments through specific channels, as website, kiosks and retail stores.
The key resources required to make the business model work are similar to those of the other players and they are mainly tangible assets (e.g., vehicle fleets and point-of-sale systems), intangible assets (e.g., software, assignment and routing algorithms, licenses and partnerships) and the human resources represented by the drivers.
The study by [36] identifies the management of processes and operations (e.g., route planning, intermodal transportation, pickups and deliveries, monitoring) and the customer care (e.g., pre- and after-sales support, tracking and tracing of parcels, proof of delivery), as key activities for the international couriers.
The international courier establishes strong partnerships and alliances with the key partners (e.g., suppliers, subcontractors, handling agents) to improve the efficiency of its current business model, or developing new ones. Moreover, the international courier forms a close cooperation with governmental organizations and local administrations to make urban parcel delivery more sustainable and less pollutant (e.g., the URBeLOG project [29]).
The primary expenses incurred by the international courier in order to run the business model, are the costs of the key resources (e.g., fuel costs, packaging, personnel costs, acquisition and maintenance of vehicles, ICT systems), as well as the costs of marketing and advertising campaign, and the risk management consultancy.
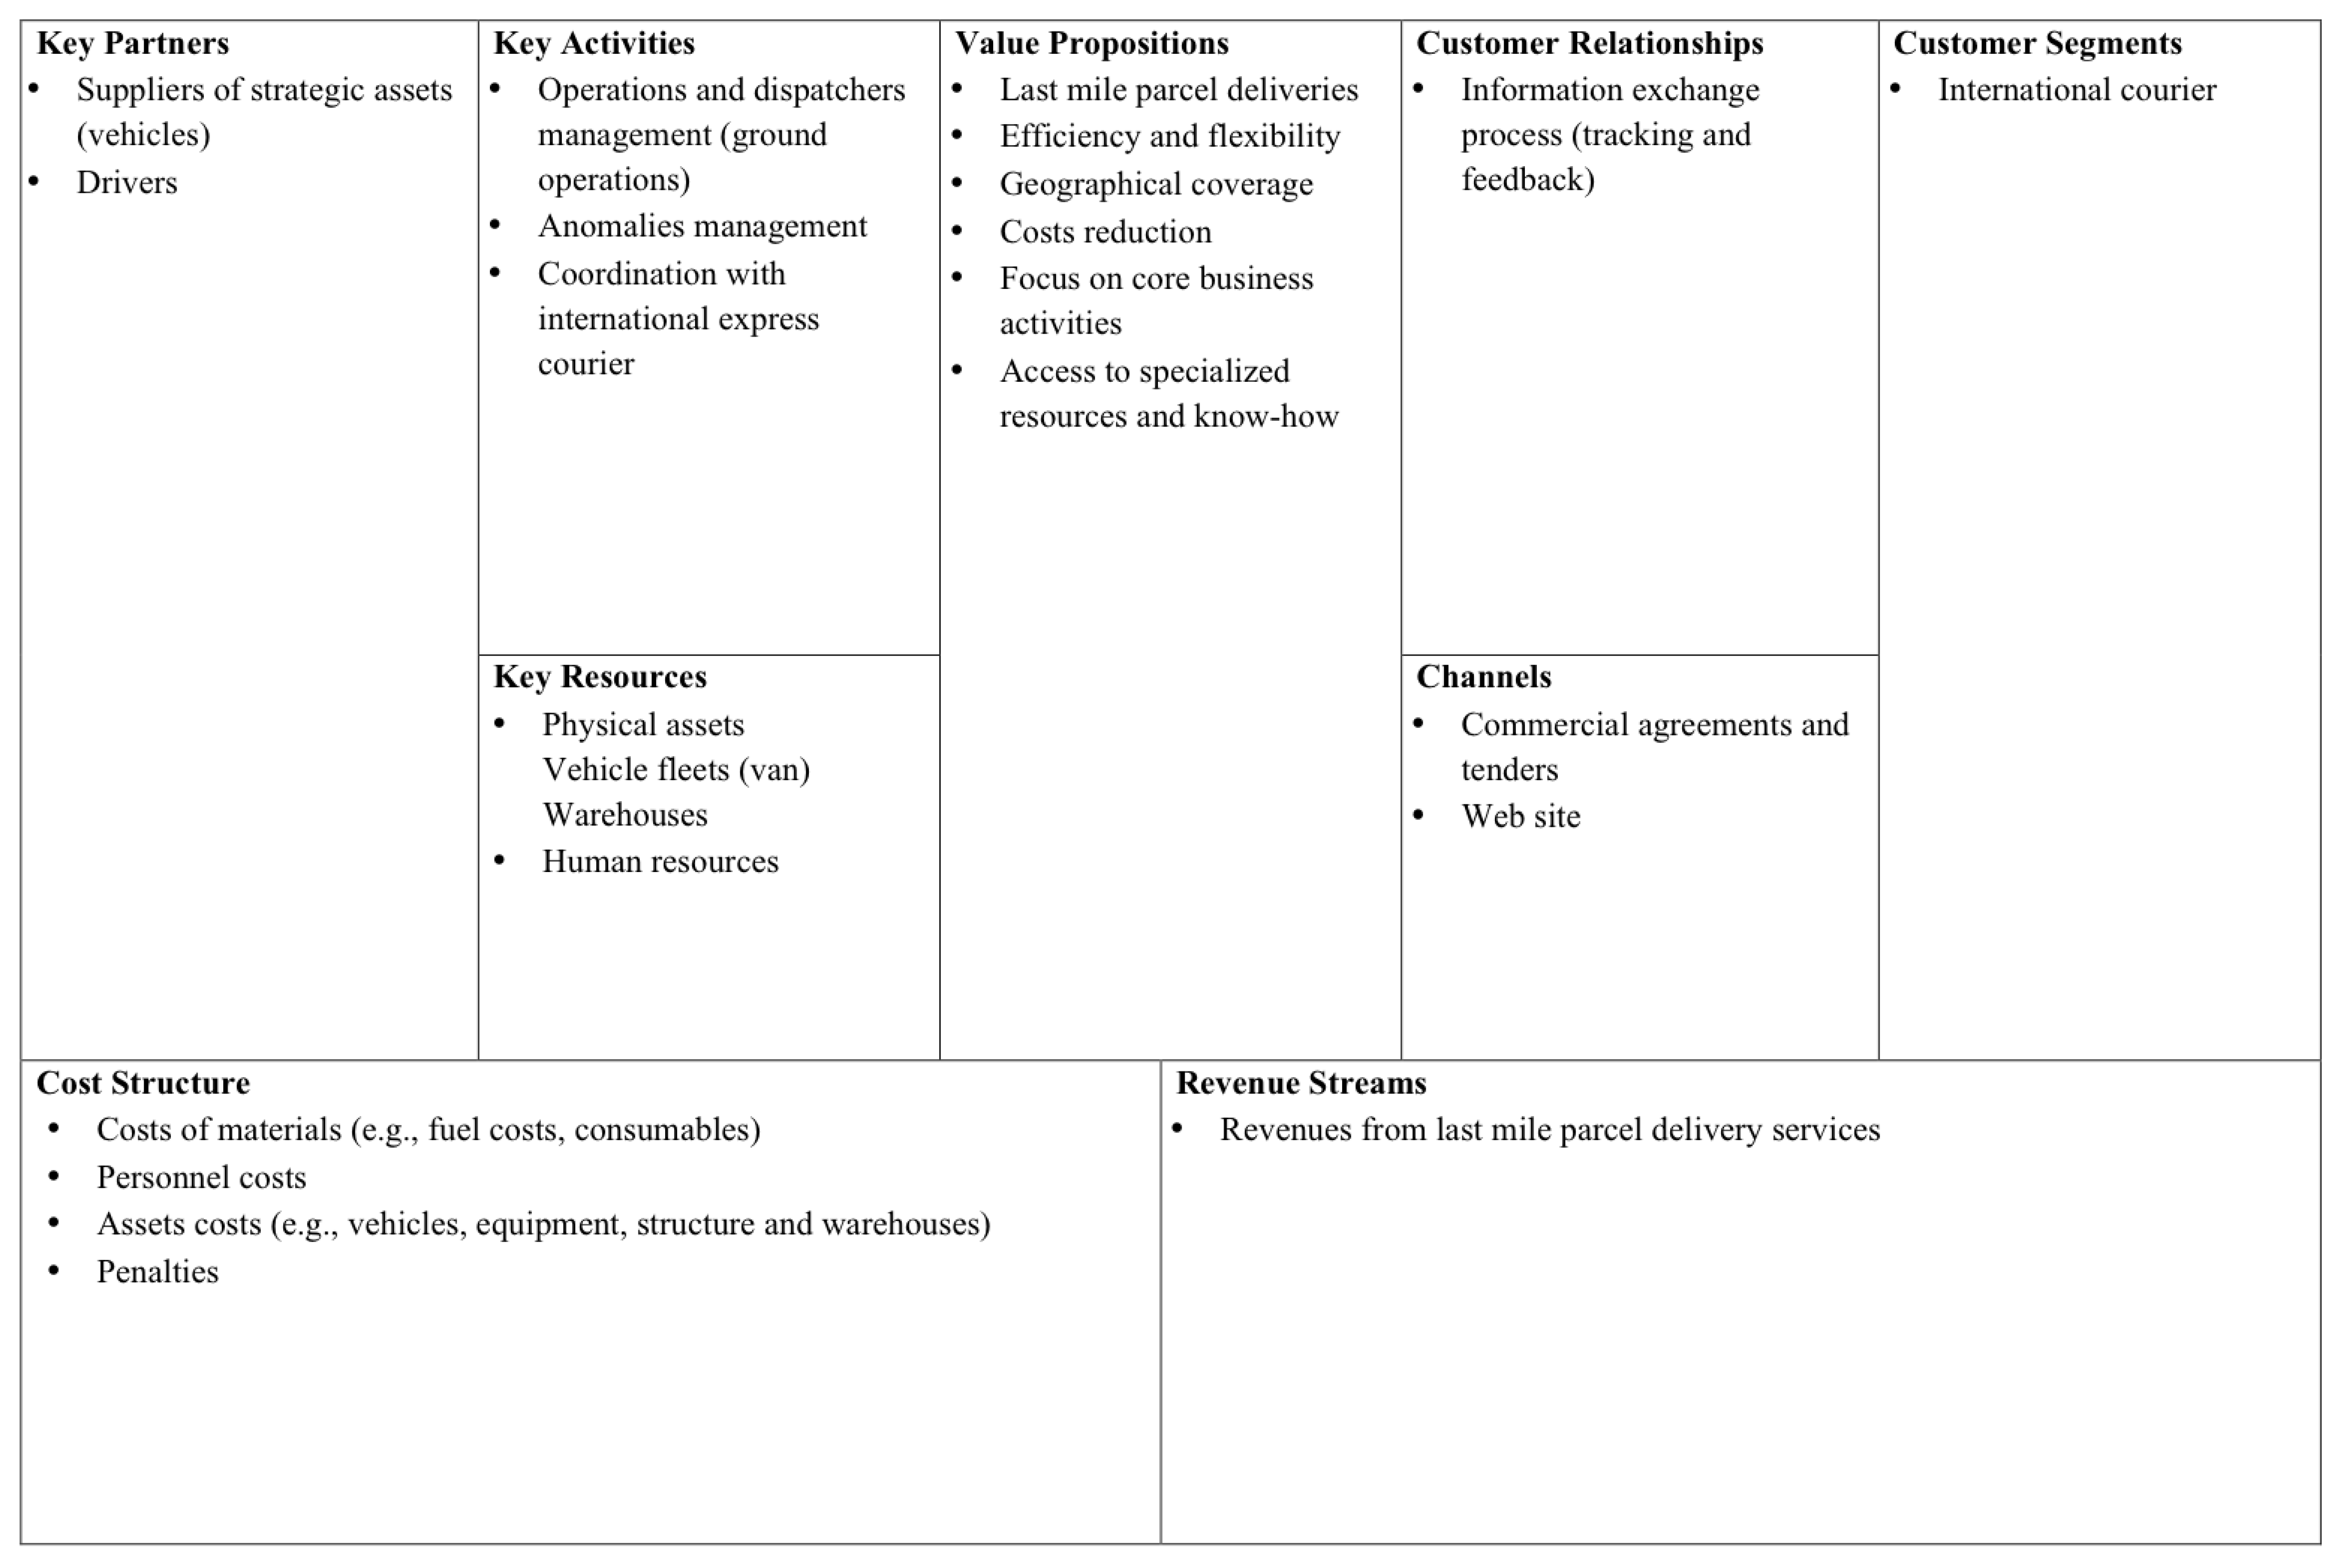
4.1.2. Business Model of Traditional Subcontractors
Figure 2 depicts the Business Model Canvas of traditional subcontractors. As discussed in Section 4, international couriers outsource pickups, deliveries, and transportation activities in the last-mile segment of the supply chain to subcontractor couriers, obtaining operational efficiency and customer proximity. Indeed, the international courier benefits from an efficient and flexible management of urban parcel delivery operations, particularly when peaks of demand and strictly temporal constraints typical of certain events and conditions (e.g., prime customers, disaster relief [37]) exist.
Usually, traditional subcontractor reaches and activates a business with the international couriers through long-term commercial agreements and tenders. Then, a constant negotiation and information exchange along all transportation activities (e.g., tracking services and feedback) ensures the relationship between these two actors, permitting the co-creation of value for the final user. Indeed, the coordination with international courier customers represents a key activity, fundamental for the success of multimodality and the well-functioning of the on-demand logistics, with the subsequent satisfaction of final users. Other key activities for the traditional subcontractors concern the operations management, as the optimal route planning and dispatching, to achieve high performance in the service quality levels (expressed in terms of parcel delivered), while coping with the challenges such as timeline constraints, the risk of delivery failure (approximately 12% of all deliveries) [38] and the last-mile split delivery problem [39].
4.1.3. Business Model of the Green Subcontractor
New business models are raising to guarantee the sustainability and efficiency of urban transportation, particularly of the parcel deliveries in the last-mile. Looking at the business model of these companies (Figure 3), here named green subcontractors, we observe many similarities with those of traditional subcontractors. However, a great part of its value relies on the adoption of green vehicles (i.e., bikes and cargo bikes) to ensure a low environmental impact of transportation activities.
Thus, the main customer segment of the green subcontractor is the international couriers that outsource last-mile operations. Other customers are represented by the B2B and B2C segments related to the intercity and intracity postal services.
The green subcontractor offers to its customer segments a value proposition consisting of cycle-logistics service, delivering small-sized parcels, with a weight between 0 to 3 kg, or up to 6 kg. The adoption of cargo bikes and bikes allows to overcome the complexities that affect the parcel delivery in the inner city (e.g., City Logistics regulation measures, low traffic zones, unavailability of loading/unloading zones, traffic and congestion), and as a result, the customers can benefit from a more flexible, fast, punctual and reliable service. Overcoming the complexity of the last mile segment increases the economic performance of the international courier, who incurs in a cost optimization, fundamental in this industry where margins are decreasing. Moreover, in line with the increasing interest of communities to the environmental protection, the customer segments of the green subcontractor obtain a green reputation and the consequent monetary gains, to achieve the goal of sustainable supply chains.
The main channels through which customers are reached by the green subcontractors are websites and green marketing campaigns that foster the awareness and knowledge of their services (e.g., interviews published in journals specialized in sustainable urban freight transportation). Once reached, the green subcontractor maintain the relationship with its customers through regular information flows and connected services (e.g., tracking services, feedbacks, computation of the CO savings).
The above mentioned value proposition provides the green subcontractor a revenue stream, which is increased by the additional incomes from the CO savings and the carbon credit trading, and fees and royalties from affiliates [6].
The business model of the green subcontractor requires a set of physical assets (i.e., bikes and cargo bikes, warehouses), human resources (i.e., bikers) and intangible assets (e.g., partnerships to protect the repeatability of the model by competitors, decision support systems and ICT tools to optimize activities) [4]. In this model, the service quality and functioning are strictly dependent on the performance of bikers, as well as fatigue and external factors (e.g., weather condition).
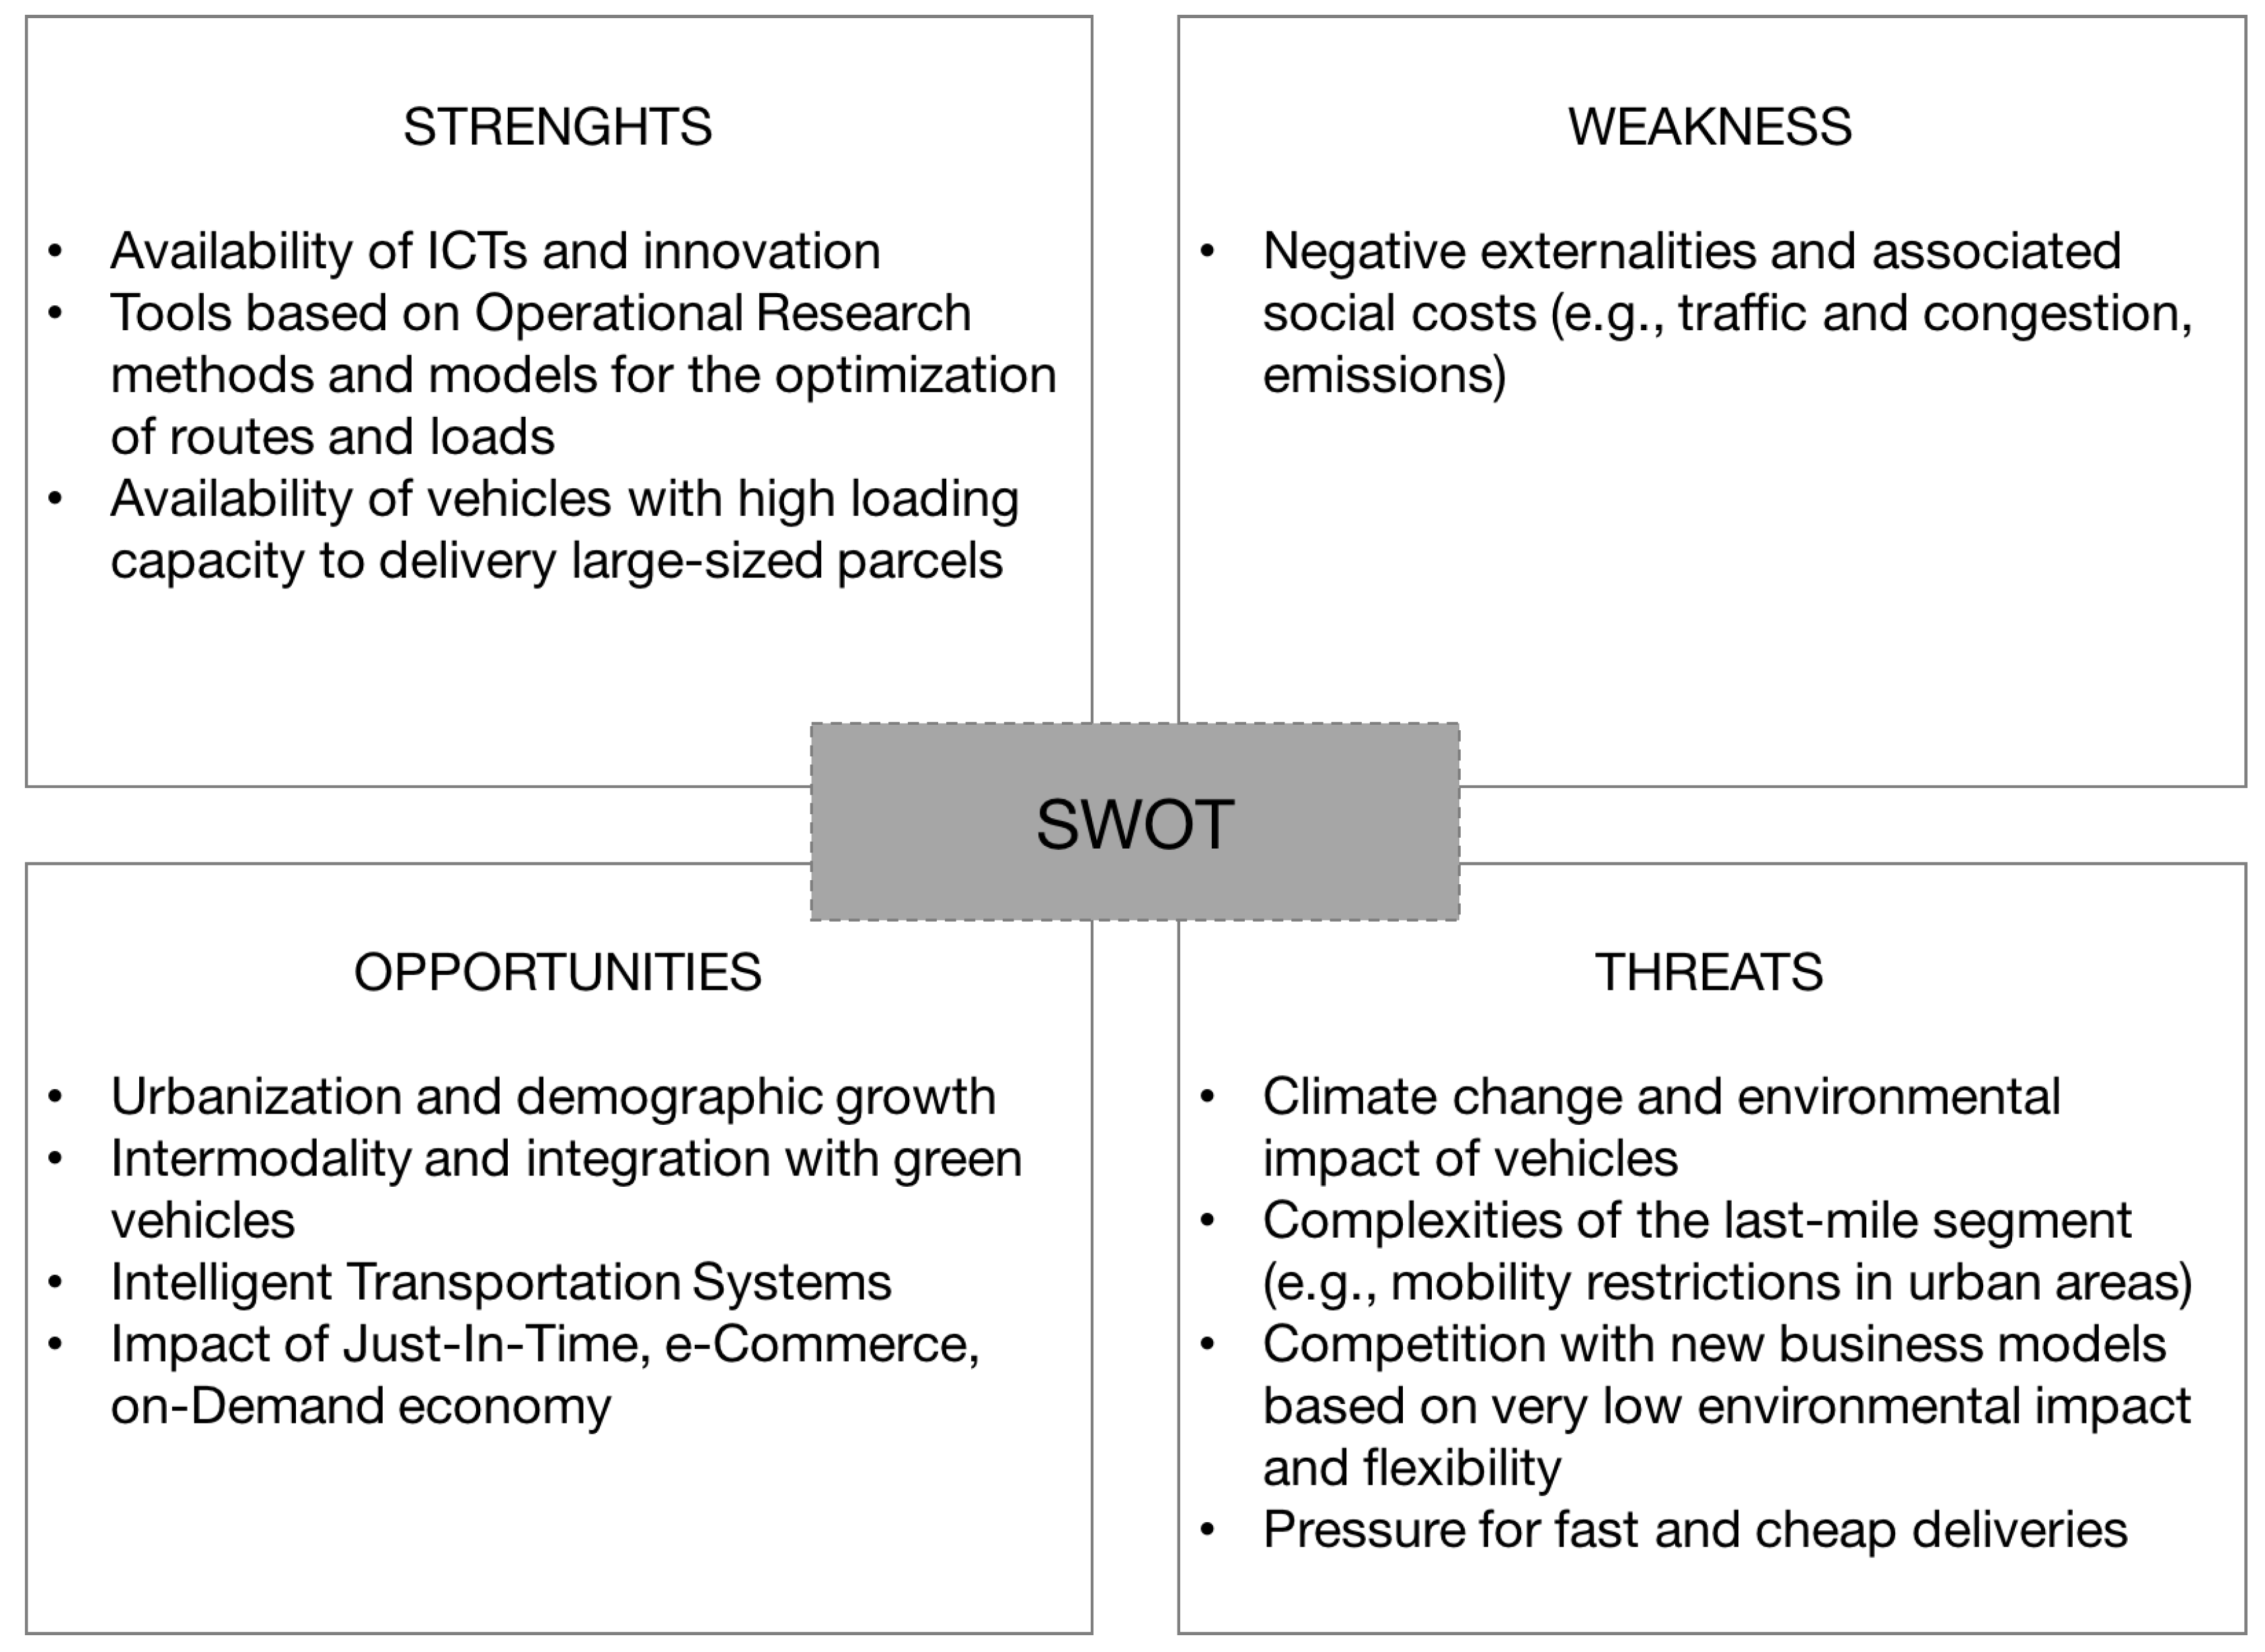
4.2. Swot Analysis
In this section, we present the SWOT analysis related to the traditional subcontractor (Figure 4 and the green subcontractor Figure 5). The SWOT analysis identifies and assesses the internal (i.e., inside the company) and external (i.e., in the eco-system) factors involved in the two business models. Thus, due to the strictly connection between this analysis and the Business Model Canvas, in this section we present a joint discussion of the results.
Although all business models propose a value proposition represented by time sensitive delivery, we observe the outsourcing of logistics activities to subcontractor carriers. Indeed, as [6] point out, the big international couriers companies internalize the long-haul transportation, while they entrust the last mile activities to traditional and green subcontractors carriers, achieving operational and economic efficiency, as well as the customer proximity.
The SWOT analysis (Figure 4 and Figure 5) and the Business Model Canvas show that, for traditional subcontractors, the main sources of weaknesses and threats are their impact on the environment and the critical issues affecting European regions, like traffic and congestion, Low Traffic zones (LTZ), and the unavailability of delivery bays.These factors compromise the delivery fulfillment, inducing disadvantageous conditions (e.g., lack of parking areas) for couriers with traditional vehicles. In contrast, these same points represent strengths for green subcontractors. The latter group uses green vehicles such as bikes, in last-mile parcel deliveries, allowing them to earn additional income from the emissions reduction and carbon credit trading, as shown in the revenue streams block of the Business Model Canvas (Figure 3). However, the operational model of green subcontractors is affected by capacity constraints of bikes, which bind the size of parcels that can be loaded, thus representing the major limitation of this model. This constraint is partially overcome using next-generation cargo bikes, which have a capacity of 100–150 kg per bike, according to estimates provided by [40] based on Europe. The SWOT analysis highlights a threat related to the competition between traditional and green subcontractors. This competition is also affected by the strategy of the international courier, who can guide subcontractors using a financial lever [6]. The competition based exclusively on costs between traditional and green subcontractors operating in the same geographical area originates a price war, which reduces their profitability or their differentiation in terms of service quality perceived by the final customer.
Moreover, according to [6], a comparable case could arise when the international courier internally owns the fleet. Indeed, the partial organisational autonomy of local depot fleet managers and their strategic cost-cutting goals might have comparable impacts to a price war between traditional and green subcontractors.
Looking at the financial structure of each business model, the costs related to the vehicles and the related social costs connected to the negative externalities have a huge relevance. For this reason, we decide to investigate these costs by means of a further quantitative analysis presented in the next Section 5.
5. Cost and Revenue Analysis of Vehicular and Cargo Bike Delivery
5.1. Operating Costs Analysis
The increasing awareness of the need for the environmental protection, and to increase the efficiency of delivery activities while marginal revenues are decreasing have led the operators and cities to experiment the green vehicles that use innovative propulsion systems (e.g., electric, hybrid or methane vans). In our study, we consider four main alternative vehicles: gasoline-fuelled, diesel-fuelled and totally electric vans, and cargo bikes.
This decision and the selection of the vehicles used for the benchmarking reflect the transition occurring in the industry and the common vehicles composing the fleets of the large portion of delivery couriers. For example, we consider the totally electric vehicle e-NV200 adopted in the “GoGreen” programme [41] arose from the partnership between the automobile manufacturer Nissan Motor Co. Ltd. and the international logistics company DHL Express.
In this section, we investigate the operating and environmental costs for each class of vehicles, given their different environmental and economic impacts (e.g., investment, fleet management and maintenance requirements, emissions). In particular, we estimate the Operating Costs per Kilometre (OCK) related to each type of vehicle and then, compared them in order to identify the most cost-efficient, considering the operative performance. For the purposes of this analysis, the OCK includes both variable costs (e.g., gasoline) and the total cost of ownership, according to [42], expressed in Euro per kilometres traveled in last mile segment [€/km], which the company incurs for the use of the vehicle in a year of its technical life cycle. This cost is composed of variable costs and fixed costs. The latter are not proportional to the distance and the courier incurs regardless of the vehicles usage degree. The OCK function is:
where:
- is the total annual fixed costs;
- is the total annual variable costs;
- is the total annual traveled kilometres.
The entity of each item has been estimated through primary data from market research on the commercial practices applied by the different stakeholders and has been supported by the formulation of specific assumptions on the use conditions of the vehicles benchmark. These assumptions are:
- total annual usage, in terms of traveled kilometres in the last mile segment, of about 25,000 km/year;
- a total annual usage, in terms of hours required to reach each destination and to do the delivery operations, of about 2000 h/year;
- the commercial speed of vehicles in urban areas is about 35 km/h;
- each driver must make about 80 deliveries per day, with an average time of 4.5 min per delivery, to perform all operations, from the parking of the vehicle to the collecting of the proof of delivery;
- each component of cost has charged in refers to the technical life cycle of the vehicle that has been estimated of 5 years.
The components of fixed and variable costs are briefly described as follows.
- Purchase cost of vehicle (v): is based on estimates realized by the fleet manager section of several car dealers, and is referred to a leasing agreement of 5 years, considering both the interest and principal payments on the loans. During this period, the company operating in the transportation and parcel delivery market on the last mile will provide a depreciation and amortisation schedule of this asset. In particular, we adopt a straight-line depreciation, which represents the simplest and most commonly used depreciation method in the market. It is based on time and thus, on the total number of years the vehicle is expected to be a useful asset for the parcel delivery company (i.e., the so-called “useful life”). In our case, we consider a life cycle of 5 years for both vehicles and batteries.
- Vehicle taxes (): are referred to the expenditures and taxes related to the vehicles, according to the current regulations, such as the ownership tax.
- Insurance (i): is the cost of the truck liability insurance based on the capacity of the vehicle and the third party cargo insurance, while it excludes the theft and fire insurances, included in the leasing agreement. Due to the liberalisation process that have interested in the 2014 the insurance industry in different country including the Italy, and that have imposed the right to determine independently the contract conditions and the tariffs, the amount of the policy considered refers to an average value of the prices offered by several insurance companies, as emerged by a secondary research conducted in this work.
- Personnel costs (p): is defined as the total remuneration payable by a driver, and also include taxes and employees’ social security contributions, according to the National Collective Labour Agreement prescribed for the category to which they belong.
- Vehicle fuelling (f): are referred to the costs related to the fuel supply, both fossil and diesel, and to the powertrain. Their values are estimated considering the consumption derived from the technical specifications provided by the manufacturer. For the petrol and diesel fuel, prices are measured by the average monthly domestic prices from the statistical data elaborated by the Italian Ministry of Economic Development for 2018. Otherwise, the electricity price is evaluated as an average cost from the prices charged by major suppliers operating in the energy industry, to a business customer.
- Tyres costs (t): are based on the list prices charged, by the leading manufacturers, discounted by a corrective factor of 15% for the purchase of high quantities for the whole fleet. It is also considered the average duration of a set of about 50,000 km/year referring to the capacity and the wear out of the vehicle.
- Maintenance and repair costs (): estimated from the data provided by the Automobile Club Italia (ACI) [43], they are related to the expenditures for the activities required to maintain the effectiveness of the vehicle performance, along his life cycle, known the travelled distance. These activities are classified in time or condition-based maintenance, which have the aim to prevent negative events and to maintain the normal conditions of use. Otherwise, breakdown maintenance or repair, which is conducted after a failure occurrence.
5.2. Environmental Costs Analysis
In compliance with the technical specification ISO/TS 14067:2013 “Greenhouse gases—Carbon footprint of product—Requirements and guidelines for quantification and communication”, we compute the carbon footprint of the last-mile deliveries, as the total direct (i.e., generated by fuel combustion process) and indirect (i.e., originated by the fossil fuel production and the energy consumed during the charging of batteries) greenhouses gas emitted by logistics activities. Concerning the source of electricity considered in our study, we refer to the current practice in Italy and Europe where the adoption of coal and crude oil is decreasing over the last 10 years, according to [44]. In particular, we consider that less than the 7% of the energy comes from the coal, 38% from natural gas, 20% from renewable sources and the remaining part is oil. As we concentrate on the last-mile operations, we omit emissions from long-haul transportation, vehicles manufacturing and their disposal. We also take into account all the pollutants generated by the transportation activities (e.g., nitrogen oxides, particulate) which are converted into CO, considering a conversion rate equals to 4.7 kg of CO per liter of fuel consumed [45].
Finally, in Table 4, we computed the social costs paid by the courier due to its environmental impact. In particular, by applying a Pigouvian tax, named carbon tax, which refers to the price paid for CO emissions in the atmosphere, we express the carbon footprint in monetary terms. This tax mechanism aims to push the transportation operators in switching to innovative technologies and tools that could make them more efficient and less pollutant, discouraging non-green behaviours.
As the carbon tax is not the same in all the countries, we consider two main levels of tariffs: 17 €/t and 150 €/t, according to the French [46] and Swedish [47] taxation systems, respectively [46].
Table 2 and Table 3 show that the traditional subcontractors using fossil fuel vehicles incurs in a higher cost than the green subcontractors. Electric vehicles enable reduced insurance tariffs and exemption from ownership tax, obtaining cost savings than traditional vans. However, few electric vehicles are still used in the market due to their high setup costs related to the purchasing cost of the van and battery rental fees. The reduced costs of bikes and personnel costs, given that the riders do not need any driving license and the working hours are limited, increase the economic efficiency of the bike couriers. Indeed, they incur in a operative costs equal to 1.50 €/km.
Moreover, the green subcontract benefits from the additional income by the selling of carbon credits. In fact, as shown by Table 5, when the carbon credit prices are 30% lower than the carbon tax tariffs, the engagement of green subcontractors generate an additional revenue equals to 0.02 € per stop, which becomes notably, considering high volumes of parcels that have as a destination the city.
6. Results
The findings emerged in the costs analysis have been used as input in a decision-support system developed for designing appropriate policies for heterogeneous fleet. The overall system is based on the simulation-optimisation approach integrating a Monte Carlo simulation, a last-mile optimisation meta-heuristic, and data aggregation and analytic module. The interested reader is referred to [6], for the complete description of the decision-support system and technical details of the simulator.
To conduct the computational experiments, we considered three instance settings I1, I2, and I3, with a number of parcels in the range [1000; 4000]. These instances are created from realistic analytics gathered during three weeks at the end of 2014 and the beginning of 2015 by a medium-sized courier.
As shown by Table 6, this data set is heterogeneous in terms of parcels composition as it considers three types of parcels, according to the classification proposed by the European Commission and [6]. Thus, we classify parcels as follows: “mailer,” (0–3 kg), “small parcels” (3–6 kg), and “large deliveries” (more than 6 kg). Mailers cover the largest portion of the parcels that have as destination the city, given the increasing impact of e-commerce. Moreover, these parcels are easy to handle for the green subcontractors and to moved by bikes. Thus, mailers are more profitable for both subcontractors, counting a great part of their critical mass to make their business models sustainable.
Combining the information related to the classes of parcels and the geographical area served by the green subcontractors, we define five operational scenarios:
- Scenario . The traditional subcontractor manages all deliveries in the considered area:
- Scenario . The green subcontractor delivers mailer parcels in the inner city, while the traditional subcontractor manages all remaining categories in both the central and semi-central areas.
- Scenario . Compared to the previous scenario, the green subcontractor delivers mailers also in the semi-central areas, while the traditional subcontractor manages the small parcels and large deliveries.
- Scenario . In this scenario, the mailers and small parcels in the central area are outsourced to the green subcontractor. The traditional subcontractor manages the large deliveries in the whole city and the small parcels in semi-central areas.
- Scenario . In this scenario, the green subcontractor deliver mailer and small parcels in both the central and semi-central area, while the traditional one delivers only large parcels.
To evaluate the integration of traditional vehicles and those with a low environmental impact, particularly the cargo bikes, we measured different key performance indicators (KPIs), that reflect the following perspectives:
- Economic Sustainability. As discussed above, the subcontracts incur in operating costs related to fleet management and maintenance, and personnel costs associated with drivers. To monitor this aspect, we compute the number of equivalent vehicles used by the subcontractors (Veh Eq) and we consider the OCK costs derived in Section 5. As in the study by [6], we express the VehEq measure related to bikes in terms of vans, according to the duration of a working day of a traditional subcontractor in the European countries, composed by six-and-a-half hours. This conversion makes possible the comparison between the performance of the traditional and of the green subcontractors.
- Environmental Sustainability. As highlighted by the managerial analysis, the value proposition of new business models based on cargo bikes is to reduce the environmental impact of transportation and parcel delivery activities. Thus, we compute the kilograms of CO (in compliance with the regulation ISO/TS 14067:2013) not emitted in the scenarios with cargo bikes, and we express this measure as the CO savings (CO Sav). Due to the negative impact of these emissions on society, we need to consider also the social costs paid by the traditional subcontractors for their externalities. Thus, we express these CO saving in monetary terms as social costs savings, applying the carbon tax used in Table 4.
- Operational Sustainability. Finally, to evaluate in what extents the introduction of green delivery vehicles impacts on the operative performance and the efficiency of the traditional courier, we compute the number of parcels delivered per hour (nD/h).
Table 7 presents the results obtained by the experiments. On the one hand, the delivery of mailers and small parcels using cargo bikes allows reducing the total emissions of about 14 tons per year, corresponding to an amount of CO2 savings equals to more than 40%. Notice that the value of the CO savings in each scenario is computed as the emissions in that scenario minus the emission in the scenario (), then expressed in terms of social costs savings. Another valuable outcome is that the area served by using bike has a huge role in that result. Indeed, the scenarios in which the green subcontractors access to both the central and semi-central areas (i.e., and ) have higher CO2 savings than scenarios and . The reason is that the traditional subcontractors no longer serve these areas, and thus the routes traveled by vans are reduced by 25%, with consequent benefits in terms of emissions and costs.
On the other hand, outsourcing mailers and small parcels to one or more green subcontracts that own their green fleets leads to a reduction of the traditional subcontractor performance, in terms of the operational efficiency and profitability. For example, in scenarios and the traditional subcontractor manages only large parcels, which usually require much time to be handled and delivered, with consequent reduction of the needed vehicles (e.g., in Set I1 the value of VehEq fall from 7.49 to less more than 2 or 3), increase of the total service time and reduction of the number of deliveries fulfilled in a day. This number is also undermined by the rapid saturation of vans capacity (due to the large sized of handled parcels) that imposes to the traditional subcontractors, frequent returns to the depots. Indeed, Table 7 highlights a reduction of up to five deliveries per hours moving from scenario to to the other scenarios using bikes. This reduction corresponds to a loss of efficiency of about 15% ad more than 30% when respectively mailers and, mailers and small parcels are handled by the green subcontractors.
To guarantee a well-functioning of the system, the inefficiency of the traditional subcontractor should be mitigated by an increase of the 130 deliveries per day managed by the green subcontractors, which represents an unfeasible target to achieve. Moreover, considering that the actual contractual schemes imply revenues based on the operational performance and penalties on the failed deliveries, the above-mentioned result may be compromising for the profitability of both operators.
These findings suggest some insights to the managers operating in the urban freight transportation and parcel delivery to derive sustainable policies and the balanced mix of traditional and green delivery modes. In particular, when the traditional subcontractor owns its fleet, it should outsource only the mailers in central and semi-central areas and small parcels in downtown, to avoid a large decrease of efficiency, while increasing the service quality perceived by customers. In this case, the green subcontractor will be able to deliver all the demand of assigned mailers and small parcels in the areas most affected by traffic and congestion, where its value proposition becomes strong, thus reaching the critical mass to sustain its model. In the case of the external fleet, the traditional subcontract should internalise the green fleet or outsource mailers in central and semi-central areas, while the outsourcing of small parcels requires the changing of the contractual scheme, to avoid the erosion of the margins. Moreover, the green subcontractor should balance the reduced revenues (due to fewer deliveries to manage, compared with the previous case), by the reselling of so-called “green credits”.
7. Conclusions
In this paper, we analysed from a managerial standpoint the co-existence of traditional (i.e., based on the adoption of vans) and new green (i.e., using low emissions vehicles as cargo bikes) business models to perform the freight transportation and parcel delivery within the city areas. The failure of several City Logistics initiatives was highlighted, as such integration is no small matter. Indeed, a proper balance between these models must be guaranteed by the decision-makers to avoid the cannibalisation of the two services and a damaging price war that erodes the margins and the profitability of the companies involved. In doing so, it is important to have a system view of this industry, considering the business profiles of the different stakeholders involved, as well as their costs and revenues structure. Unfortunately, this type of holistic vision does not receive too much attention in the literature.
We contributed to overcoming this gap first proposing a complete analysis of the business models of the major stakeholders playing a key role in the integration of traditional and green delivery systems. Moreover, we understood the features and competitiveness of the eco-system, identifying opportunities, threats and strategies’ potential profitability. Then, we investigate the costs and revenues structures of the companies (we referred to the traditional and green subcontractor couriers, respectively) that manage the urban parcel delivery. These analyses have been conducted by means of lean business tools and techniques. Finally, we presented some relevant results and managerial insights derived by applying simulation-optimisation tools to the outcomes of the previous analyses.
We can use these results to make some recommendations. First, the decision-makers have to design mixed-fleet policies, which do not aim only at the environmental sustainability that, however, would benefit from the adoption of low emission vehicles, but also look at the feasibility and, operational and economic sustainability of both traditional and green business models. Second, to deploy a winning strategy for all the actors involved in the system, a holistic vision is needed. This must integrate qualitative and quantitative approaches linked in a proper way to assess the co-existence of different transportation modes, which are not considered individually, but parts of a unique whole system. Third, the green business models based on the adoption of cargo bikes have beneficial effects on the environmental protection, but also on the operations. In fact, they emerge as the most flexible transportation modes to cope with the increasing uncertainty (e.g., related to demand and travel times) originated by the growing requests connected to the on-demand economy.
Despite the interesting results, this paper presents some limitations, which will be the subject of future research. First, the decision-support system developed do not cover all the operational issues (e.g., the crowdsourcing) and modes (e.g., automatic vehicles, drones and fully electric vehicles). Second, the related study in [6] proposes a sensitivity analysis on the composition of the demand, which is one of the most relevant parameters affected by uncertainty in the urban context. However, the current study lacks of further sensitivity analyses. In particular, to our vision, an interesting one considers the tariff schemes paid to the contractor. This analysis requires the development of a bi-level programming optimisation model, which is still not available in the literature, for the time being. Thus, it could be an interesting direction for future research.
Author Contributions
Authors contributed equally to design the research and writing the paper. All authors proofread and approved the final manuscript.
Funding
This research was funded by Politecnico di Torino under the interdepartmental Center for Automotive Research and Sustainable mobility (CARS) initiative.
Acknowledgments
While working on this paper, the second author was the Director of the ICT for City Logistics and Enterprises Lab and the the head of the Urban Mobility and Logistics Systems (UMLS) initiative of the interdepartmental Center for Automotive Research and Sustainable mobility (CARS) at Politecnico di Torino, Italy.
Conflicts of Interest
The authors declare no conflict of interest.
References
- Dablanc, L. City distribution, a key element of the urban economy: Guidelines for practitioners. In City Distribution and Urban Freight Transport: Multiple Perspectives; Edward Elgar Publishing: Cheltenham, UK, 2011; Volume 1, pp. 13–36. [Google Scholar]
- Taefi, T.T.; Kreutzfeldt, J.; Held, T.; Fink, A. Supporting the adoption of electric vehicles in urban road freight transport—A multi-criteria analysis of policy measures in Germany. Transp. Res. Part A 2016, 91, 61–79. [Google Scholar] [CrossRef]
- Perboli, G.; Rosano, M.; Saint-Guillain, M.; Rizzo, P. Simulation-optimization framework for City Logistics. An application on multimodal last-mile delivery. IET Intell. Transp. Syst. 2018, 12, 262–269. [Google Scholar] [CrossRef]
- Perboli, G.; Rosano, M. A Decision Support System for Optimizing the Last-Mile by Mixing Traditional and Green Logistics. In Information Systems, Logistics, and Supply Chain. ILS 2016. Lecture Notes in Business Information Processing; Temponi, C., Vandaele, N., Eds.; Springer: Cham, Switzerland, 2018; Volume 262, pp. 28–46. [Google Scholar]
- Tadei, R.; Fadda, E.; Gobbato, L.; Perboli, G.; Rosano, M. An ICT-Based Reference Model for E-grocery in Smart Cities. Lect. Notes Comput. Sci. 2016, 9704, 22–31. [Google Scholar]
- Perboli, G.; Rosano, M. Parcel delivery in urban areas: Opportunities and threats for the mix of traditional and green business models. Transp. Res. Part C 2019, 99, 19–36. [Google Scholar] [CrossRef]
- Perboli, G.; De Marco, A.; Perfetti, F.; Marone, M. A New Taxonomy of Smart City Projects. Transp. Res. Procedia 2014, 3, 470–478. [Google Scholar] [CrossRef] [Green Version]
- Marcucci, E.; Gatta, V.; Marciani, M.; Cossu, P. Measuring the effects of an urban freight policy package defined via a collaborative governance model. Res. Transp. Econ. 2017, 65, 3–9. [Google Scholar] [CrossRef]
- Russo, R.; Comi, A. A classification of city logistics measures and connected impacts. Procedia Soc. Behav. Sci. 2010, 2, 6355–6365. [Google Scholar] [CrossRef]
- Gevaersa, R.; Van de Voorde, E.; Vanelslera, T. Cost Modelling and Simulation of Last-mile Characteristics in an Innovative B2C Supply Chain Environment with Implications on Urban Areas and Cities. Procedia Soc. Behav. Sci. 2014, 125, 398–411. [Google Scholar] [CrossRef] [Green Version]
- Morganti, E.; Seidel, S.; Blanquart, C.; Dablanc, L.; Lenz, B. The Impact of E-commerce on Final Deliveries: Alternative Parcel Delivery Services in France and Germany. Transp. Res. Procedia 2014, 4, 178–190. [Google Scholar] [CrossRef] [Green Version]
- Taniguchi, E. Concepts of city logistics for sustainable and liveable cities. Procedia Soc. Behav. Sci. 2014, 151, 310–317. [Google Scholar] [CrossRef]
- De Marco, A.; Mangano, G.; Zenezini, G. Classification and benchmark of City Logistics measures: An empirical analysis. Int. J. Logist. Res. Appl. 2018, 21, 1–19. [Google Scholar] [CrossRef]
- Leonardi, J.; Browne, M.; Allen, J. Before-After Assessment of a Logistics Trial with Clean Urban Freight Vehicles: A Case Study in London. Procedia Soc. Behav. Sci. 2012, 39, 146–157. [Google Scholar] [CrossRef] [Green Version]
- Dablanc, L. City distribution, a key element of the urban economy: Guidelines for practitioners. City Distrib. Urban Freight Transp. 2011, 1, 13–36. [Google Scholar]
- Conway, A.; Fatisson, P.; Eickemeyer, P.; Cheng, J.; Peters, D. Urban micro-consolidation and last mile goods delivery by freight-tricycle in Manhattan: Opportunities and challenges. In Proceedings of the Conference proceedings. Transportation Research Board 91st Annual Meeting, Washington, DC, USA, 22–26 January 2012. [Google Scholar]
- Janjevic, M.; Ndiaye, A.B. Development and application of a transferability framework for micro-consolidation schemes in urban freight transport. Procedia Soc. Behav. Sci. 2014, 125, 284–296. [Google Scholar] [CrossRef]
- Schliwa, G.; Armitage, R.; Aziz, S.; Evans, J.; Rhoades, J. Sustainable city logistics. Making cargo cycles viable for urban freight transport. Res. Transp. Bus. Manag. 2015, 15, 50–57. [Google Scholar] [CrossRef]
- Lenz, B.; Riehle, E. Bikes for urban freight. Transp. Res. Rec. J. Transp. Res. Board 2013, 2379, 39–45. [Google Scholar] [CrossRef]
- Navarro, C.; Roca-Riu, M.; Furió, S.; Estrada, M. Designing new models for energy efficiency in urban freight transport for smart cities and its application to the Spanish case. Transp. Res. Procedia 2016, 12, 314–324. [Google Scholar] [CrossRef]
- Baldacci, R.; Battarra, M.; Vigo, D. Routing a Heterogeneous Fleet of Vehicles. In The Vehicle Routing Problem: Latest Advances and New Challenges; Springer: Boston, MA, USA, 2008; Volume 43, pp. 3–27. [Google Scholar]
- Molina, J.C.; Eguia, I.; Racero, J.; Guerrero, F. Multi-objective vehicle routing problem with cost and emission functions. Procedia Soc. Behav. Sci. 2014, 160, 254–263. [Google Scholar] [CrossRef]
- The GUEST Initiative. 2017. Available online: http://www.theguestmethod.com (accessed on 19 April 2019).
- Perboli, G. The GUEST Methodology. 2017. Available online: http://staff.polito.it/guido.perboli/GUEST-site/docs/GUEST_Metodology_ENG.pdf (accessed on 19 April 2019).
- Osterwalder, A.; Pigneur, Y. Business Model Generation. A Handbook for Visionaries, Game Changers, and Challengers; John Wiley and Sons, Inc.: Hoboken, NJ, USA, 2010. [Google Scholar]
- Perboli, G.; Ferrero, F.; Musso, S.; Vesco, A. Business models and tariff simulation in car-sharing services. Transp. Res. Part A Policy Pract. 2018, 115, 32–48. [Google Scholar]
- Perboli, G.; Musso, S.; Rosano, M.; Tadei, R.; Godel, M. Synchro-modality and slow steaming: New business perspectives in freight transportation. Sustainability 2017, 9, 1843. [Google Scholar] [CrossRef]
- Kim, G.; Ong, Y.S.; Heng, C.K.; Tan, P.S.; Zhang, N.A. City Vehicle Routing Problem (City VRP): A Review. IEEE Trans. Intell. Transp. Syst. 2015, 16, 1654–1666. [Google Scholar] [CrossRef]
- URBeLOG Project Web Site. Available online: http://www.urbelog.it/ (accessed on 11 April 2019).
- De Marco, A.; Mangano, G.; Zenezini, G.; Cagliano, A.C.; Perboli, G.; Rosano, M.; Musso, S. Business Modeling of a City Logistics ICT Platform. In Proceedings of the 2017 IEEE 41st Annual Computer Software and Applications Conference (COMPSAC), Turin, Italy, 4–8 July 2017. [Google Scholar]
- Giusti, R.; Iorfida, C.; Li, Y.; Manerba, D.; Musso, S.; Perboli, G.; Tadei, R.; Yuan, S. Sustainable and De-Stressed International Supply-Chains Through the SYNCHRO-NET Approach. Sustainability 2019, 11, 1083. [Google Scholar] [CrossRef]
- Montwiłł, A. The role of seaports as logistics centers in the modelling of the sustainable system for distribution of goods in urban area. Procedia Soc. Behav. Sci. 2014, 151, 257–265. [Google Scholar] [CrossRef]
- Bonney, J. Carriers Move Full Speed into Slow Steaming. JOC 2010. Available online: http://www.joc.com/maritime/carriers-move-full-speed-slow-steaming (accessed on 31 May 2019).
- Lee, C.Y.; Lee, H.; Zhang, J. The impact of slow ocean steaming on delivery reliability and fuel consumption. Transp. Res. Part E 2015, 76, 176–190. [Google Scholar] [CrossRef]
- Venturini, G.; Iris, Ç.; Kontovas, C.A.; Larsen, A. The multi-port berth allocation problem with speed optimization and emission consideration. Transp. Res. Part D 2017, 54, 142–159. [Google Scholar] [CrossRef]
- Caroli, M.G.; Monarca, U.; Simonelli, F.; Valentino, A. The Nusiness Model of International Express Couriers. From Value Chain to Policy Indications, LUISS Business School and AICAI. 2010. Available online: http://www.aicaionline.it/kdocs/48400/AICAI_SUMMARY_UK.pdf (accessed on 19 April 2019).
- Cook, R.A.; Lodree, E.J. Dispatching policies for last-mile distribution with stochastic supply and demand. Transp. Res. Part E 2017, 106, 353–371. [Google Scholar] [CrossRef]
- Visser, J.; Nemoto, T.; Browne, M. Home delivery and the impacts on urban freight transport: A review. Procedia Soc. Behav. Sci. 2014, 125, 15–27. [Google Scholar] [CrossRef]
- Zhang, Y.; Sun, L.; Hu, X.; Zhao, C. Order consolidation for the last-mile split delivery in online retailing. Transp. Res. Part E 2019, 122, 309–327. [Google Scholar] [CrossRef]
- Riehle, E.B. Cargo Bikes as Transportation Vehicles for Urban Freight Traffic. Study on European Business Examples to Estimate the Parameters and Potential for German Cities; Faculty of Spatial Planning, TU Dortmund University: Dortmund, Germany, 2012. [Google Scholar]
- NISSAN. Nissan and DHL Test e-NV200. Available online: http://www.nissan-global.com/EN/NEWS/2013/_STORY/130712-01-e.html (accessed on 5 December 2018).
- Canadian Automobile Association. Driving Cost Beyond the Price Tag: Understanding Your Vehicle’s Expenses; Canadian Automobile Association: Ontario, ON, Canada; Available online: https://www.caa.ca/wp-content/uploads/2016/09/CAA_Driving_Cost_English_2013_web.pdf (accessed on 11 June 2019).
- Automobile Club Italia. Available online: http://www.aci.it (accessed on 19 April 2019).
- International Energy Agency. World Energy Balances 2018 Edition; Data & Publications: Paris, France, 2018; Available online: https://webstore.iea.org/world-energy-balances-2018 (accessed on 11 June 2019).
- Knörr, W. EcoPassenger: Environmental Methodology and Data; Final Report; IFEU—Institut für Energie-und Umweltforschung Heidelberg GmbH: Heidelberg, Germany, 2008. [Google Scholar]
- Elbeze, J. The reform of energy taxation: An extension of carbon pricing in France. Policy Brief 2014, 6. [Google Scholar]
- Johansson, B. Economic Instruments in Practice 1: Carbon Tax in Sweden. Swedish Environmental Protection Agency. Available online: https://www.oecd.org/sti/inno/2108273.pdf (accessed on 3 January 2019).
Figure 1.
Business Model Canvas of an international courier.

Figure 2.
Business Model Canvas of a traditional subcontractor.

Figure 3.
Business Model Canvas of a green subcontractor.

Figure 4.
SWOT analysis referred to the traditional subcontractor.

Figure 5.
SWOT analysis referred to the green subcontractor.


Table 1.
Operating Costs per Kilometre related to the fossil fuelled vehicle.
| Cost Item | Benchmark Value | Technical Life Cycle | Annual Cost | Commercial Speed | Total km | OCK |
|---|---|---|---|---|---|---|
| [€] | [years] | [€] | [km/h] | [km] | [€/km] | |
| Purchasing cost of vehicle | ||||||
| Advance payment | 5000.00 | 5 | 1000.00 | 35 | 25,000 | 0.0400 |
| Lease fees and other insurance | 11,820.00 | 5 | 2364.00 | 35 | 25,000 | 0.0946 |
| Stamp duty | 16.00 | 5 | 3.20 | 35 | 25,000 | 0.0001 |
| VAT 22% | 3703.92 | 5 | 740.78 | 35 | 25,000 | 0.0296 |
| Total purchasing cost of vehicle | 20,539.92 | 4107.98 | 0.1643 | |||
| Vehicle taxes | ||||||
| IPT | 319.00 | 5 | 63.80 | 35 | 25,000 | 0.0026 |
| DMV costs and PRA | 100.00 | 5 | 20.00 | 35 | 25,000 | 0.0008 |
| Stamp duty | 208.98 | 208.98 | 35 | 25,000 | 0.0084 | |
| Total vehicle taxes | 627.98 | 292.78 | 0.0117 | |||
| Insurance | ||||||
| Average truck liability insurance costs | 2680.33 | 35 | 25,000 | 0.1072 | ||
| Total insurance cost | 0.1072 | |||||
| Maintenance and repair costs | ||||||
| Maintenance and repair costs | 0.0573 | |||||
| Total maintenance and repair costs | 0.0573 | |||||
| Tyres costs | ||||||
| Average tyres costs | 311.15 | 35 | 25,000 | 0.0124 | ||
| Average tyres costs | 0.0124 | |||||
| Personnel costs | ||||||
| Personnel costs | 56,000.00 | 35 | 25,000 | 2.2400 | ||
| Total personnel costs | 2.2400 | |||||
| Vehicle Fuelling | ||||||
| Price per Litre | Consumption | Commercial Speed | Total km | Cost per Kilometre | ||
| [€/l] | [€/100km] | [km/h] | [km] | [€/km] | ||
| Average manufacturing price | 0.5375 | 0.072 | 35 | 25,000 | 0.0387 | |
| Average production tax | 1.0069 | 0.072 | 35 | 25,000 | 0.0725 | |
| Total vehicle fuelling costs | 0.0112 | |||||
| TOTAL OCK | €/km | 2.7042 | ||||
Table 2.
Operating Costs per Kilometre related to the diesel fuelled vehicle.
| Cost Item | Benchmark Value | Technical Life Cycle | Annual Cost | Commercial Speed | Total km | OCK |
|---|---|---|---|---|---|---|
| [€] | [years] | [€] | [km/h] | [km] | [€/km] | |
| Purchasing cost of vehicle | ||||||
| Advance payment | 5000.00 | 5 | 1000.00 | 35 | 25,000 | 0.0400 |
| Lease fees and other insurance | 13,740.00 | 5 | 2748.00 | 35 | 25,000 | 0.1099 |
| Stamp duty | 16.00 | 5 | 3.20 | 35 | 25,000 | 0.0001 |
| VAT 22% | 4126.32 | 5 | 825.26 | 35 | 25,000 | 0.0330 |
| Total purchasing cost of vehicle | 22,882.32 | 4575.46 | 0.1831 | |||
| Vehicle taxes | ||||||
| IPT | 319.00 | 5 | 63.80 | 35 | 25,000 | 0.0026 |
| DMV costs and PRA | 100.00 | 5 | 20.00 | 35 | 25,000 | 0.0008 |
| Stamp duty | 170.28 | 170.28 | 35 | 25,000 | 0.0017 | |
| Total vehicle taxes | 627.98 | 292.78 | 0.0102 | |||
| Insurance | ||||||
| Average truck liability insurance costs | 2680.33 | 35 | 25,000 | 0.1072 | ||
| Total insurance cost | 0.1072 | |||||
| Maintenance and repair costs | ||||||
| Maintenance and repair costs | 0.0625 | |||||
| Total maintenance and repair costs | 0.0625 | |||||
| Tyres costs | ||||||
| Average tyres costs | 311.15 | 35 | 25,000 | 0.0124 | ||
| Average tyres costs | 0.0124 | |||||
| Personnel costs | ||||||
| Personnel costs | 56,000.00 | 35 | 25,000 | 2.2400 | ||
| Total personnel costs | 2.2400 | |||||
| Vehicle Fuelling | ||||||
| Price per Litre | Consumption | Commercial Speed | Total km | Cost per Kilometre | ||
| [€/l] | [€/100 km] | [km/h] | [km] | [€/km] | ||
| Average manufacturing price | 0.5593 | 0.048 | 35 | 25,000 | 0.0268 | |
| Average production tax | 0.8763 | 0.048 | 35 | 25,000 | 0.0421 | |
| Total vehicle fuelling costs | 0.0689 | |||||
| TOTAL OCK | €/km | 2.6843 | ||||
Table 3.
Operating Costs per Kilometre related to the electric vehicle.
| Cost Item | Benchmark Value | Technical Life Cycle | Annual Cost | Commercial Speed | Total km | OCK |
|---|---|---|---|---|---|---|
| [€] | [years] | [€] | [km/h] | [km] | [€/km] | |
| Purchasing cost of vehicle | ||||||
| Advance payment | 5000.00 | 5 | 1000.00 | 35 | 25,000 | 0.0400 |
| Lease fees and other insurance | 21,756.00 | 5 | 4351.20 | 35 | 25,000 | 0.1740 |
| Battery rental fee | 4320.00 | 5 | 864.00 | 35 | 25,000 | 0.0346 |
| Stamp duty | 16.00 | 5 | 3.20 | 35 | 25,000 | 0.0001 |
| VAT 22% | 6840.24 | 5 | 1368.05 | 35 | 25,000 | 0.0547 |
| Total purchasing cost of vehicle | 37,932.24 | 7586.45 | 0.3035 | |||
| Vehicle taxes | ||||||
| IPT | 319.00 | 5 | 63.80 | 35 | 25,000 | 0.0026 |
| DMV costs and PRA | 100.00 | 5 | 20.00 | 35 | 25,000 | 0.0008 |
| Stamp duty | - | - | - | |||
| Total vehicle taxes | 419.00 | 83.80 | 0.0034 | |||
| Insurance | ||||||
| Average truck liability insurance costs | 932.50 | 35 | 25,000 | 0.0373 | ||
| Total insurance cost | 0.0373 | |||||
| Maintenance and repair costs | ||||||
| Maintenance and repair costs | 0.0540 | |||||
| Total maintenance and repair costs | 0.0540 | |||||
| Tyres costs | ||||||
| Average tyres costs | 230.92 | 35 | 25,000 | 0.0092 | ||
| Average tyres costs | 0.0092 | |||||
| Personnel costs | ||||||
| Personnel costs | 56,000.00 | 35 | 25,000 | 2.2400 | ||
| Total personnel costs | 2.2400 | |||||
| Vehicle Fuelling | ||||||
| Average Price of Electricity | Consumption | Commercial Speed | Total km | Cost per Kilometre | ||
| [€/kWh] | [kWh/km] | [km/h] | [km] | [€/km] | ||
| Average price of electricity | 0.0672 | 0.1650 | 35 | 25,000 | 0.0111 | |
| Total vehicle fuelling costs | 0.0111 | |||||
| TOTAL OCK | €/km | 2.6584 | ||||
Table 4.
Cost analysis results.
| Costs | Tariffs Carbon Tax [€/tons] | Fossil Fuel Vehicle | Diesel Fuel Vehicle | Electric Vehicle | Bike |
|---|---|---|---|---|---|
| TCK [€/km] | |||||
| Annual kilometre cost | 2.70 | 2.68 | 2.66 | 1.50 | |
| Environmental costs [€] | |||||
| Direct CO Emissions [tons] | 4.15 | 3.38 | |||
| Indirect CO Emissions [tons] | 4.15 | 3.38 | |||
| Equivalent CO Emissions [tons] | 8.46 | 5.52 | |||
| Total Emissions [tons] | 16.76 | 12.28 | |||
| Carbon Tax [€] | 17.00 | 284.92 | 208.63 | ||
| 30.00 | 502.80 | 368.18 | |||
| 90.00 | 1508.40 | 1104.53 | |||
| 150.00 | 2514.00 | 1840.88 | |||
| Electric Battery Emissions [tons] | 3.08 | ||||
| Carbon Tax [€] | 17.00 | 52.31 | |||
| 30.00 | 92.31 | ||||
| 90.00 | 276.94 | ||||
| 150.00 | 461.56 | ||||
| Direct CO Emissions [tons] | 0.00 | ||||
Table 5.
Revenue streams from carbon credit trading.
| Buyer Emissions [tons] | Seller Emissions [tons] | Emissions [tons] | Carbon Credit Prices [€/tons] | Revenue [€] |
|---|---|---|---|---|
| Fossil Fuel Vehicle vs. Electric Vehicle | ||||
| 16.76 | 0.02 | 16.74 | 11.90 | 199.21 |
| 21.00 | 351.54 | |||
| 63.00 | 1054.62 | |||
| 105.00 | 1757.70 | |||
| Diesel Vehicle vs. Electric Vehicle | ||||
| 12.27 | 0.02 | 12.25 | 11.90 | 145.80 |
| 21.00 | 257.30 | |||
| 63.00 | 771.91 | |||
| 105.00 | 1286.51 | |||
| Fossil Fuel Vehicle vs. Bike | ||||
| 0.000421 | 0.00 | 0.000421 | 11.90 | 0.005 |
| 21.00 | 0.009 | |||
| 63.00 | 0.027 | |||
| 105.00 | 0.044 | |||
| Diesel Vehicle vs. Bike | ||||
| 0.000308 | 0.00 | 0.000308 | 11.90 | 0.004 |
| 21.00 | 0.006 | |||
| 63.00 | 0.019 | |||
| 105.00 | 0.032 | |||
Table 6.
Classes of parcels and delivery locations.
| Parcel Delivery Features | n. Delivery | % |
|---|---|---|
| In center | 3395 | 22.51 |
| Out of center | 11,688 | 77.49 |
| 0–3 kg | 8577 | 56.87 |
| 3–6 kg | 1915 | 12.70 |
| >6 kg | 4590 | 30.43 |
| Total deliveries | 15,083 | 100.00 |
Table 7.
KPIs values generated by the Monte Carlo simulation. Note that in the scenario , the KPIs referred to the green subcontractor have no values, as it is not involved in the parcel delivery.
Table 7.
KPIs values generated by the Monte Carlo simulation. Note that in the scenario , the KPIs referred to the green subcontractor have no values, as it is not involved in the parcel delivery.
| KPI | Instances | Traditional Subcontractor | Green Subcontractor | ||||||||
|---|---|---|---|---|---|---|---|---|---|---|---|
| S_0 | S_3_C | S_3_S | S_5_C | S_5_S | S_0 | S_3_C | S_3_S | S_5_C | S_5_S | ||
| I1 | 15.65 | 12.82 | 12.98 | 10.44 | 10.38 | NA | 11.94 | 11.24 | 12.47 | 11.94 | |
| nD/h | I2 | 16.18 | 13.79 | 13.77 | 10.92 | 10.73 | NA | 12.03 | 11.36 | 12.51 | 12.06 |
| I3 | 15.47 | 13.29 | 13.01 | 10.50 | 10.21 | NA | 11.82 | 11.16 | 12.56 | 12.04 | |
| I1 | 7.49 | 2.16 | 3.53 | 2.28 | 3.62 | NA | 3.70 | 6.55 | 3.88 | 6.88 | |
| VehEq | I2 | 9.89 | 3.03 | 4.86 | 3.07 | 4.98 | NA | 4.96 | 8.39 | 5.45 | 9.02 |
| I3 | 8.40 | 2.54 | 4.18 | 2.70 | 4.41 | NA | 3.85 | 6.89 | 4.12 | 7.14 | |
| I1 | NA | 22% | 34% | 27% | 45% | ||||||
| CO2Sav | I2 | NA | 16% | 34% | 26% | 44% | |||||
| I3 | NA | 16% | 41% | 20% | 48% | ||||||
© 2019 by the authors. Licensee MDPI, Basel, Switzerland. This article is an open access article distributed under the terms and conditions of the Creative Commons Attribution (CC BY) license (http://creativecommons.org/licenses/by/4.0/).
Share and Cite
MDPI and ACS Style
Brotcorne, L.; Perboli, G.; Rosano, M.; Wei, Q. A Managerial Analysis of Urban Parcel Delivery: A Lean Business Approach. Sustainability 2019, 11, 3439. https://0-doi-org.brum.beds.ac.uk/10.3390/su11123439
AMA Style
Brotcorne L, Perboli G, Rosano M, Wei Q. A Managerial Analysis of Urban Parcel Delivery: A Lean Business Approach. Sustainability. 2019; 11(12):3439. https://0-doi-org.brum.beds.ac.uk/10.3390/su11123439
Chicago/Turabian StyleBrotcorne, Luce, Guido Perboli, Mariangela Rosano, and Qu Wei. 2019. "A Managerial Analysis of Urban Parcel Delivery: A Lean Business Approach" Sustainability 11, no. 12: 3439. https://0-doi-org.brum.beds.ac.uk/10.3390/su11123439
Note that from the first issue of 2016, this journal uses article numbers instead of page numbers. See further details here.