Determinants of Banks’ Net Interest Margin: Evidence from the Euro Area during the Crisis and Post-Crisis Period

1
Department of Economics and Management, University of Ferrara, Via Voltapaletto, 11, 44121 Ferrara, Italy
2
Department of Economics, University of Perugia, Via Pascoli, 20, 06123 Perugia, Italy
*
Author to whom correspondence should be addressed.
Sustainability 2019, 11(14), 3785; https://0-doi-org.brum.beds.ac.uk/10.3390/su11143785
Submission received: 5 June 2019
/
Revised: 2 July 2019
/
Accepted: 5 July 2019
/
Published: 10 July 2019
(This article belongs to the Special Issue Application of Time Series Analyses in Business)
Abstract
:This paper analyses the determinants of net interest margin during the period 2008–2014 in the Euro Area. The starting point of the analysis is the premise that this variable is a gauge of financial institutions’ health and stability. In particular, since the outbreak of the global financial crisis, difficulties in achieving sustainable levels of profitability, mainly due to the vulnerable margins from the banks’ traditional activity, have significantly increased the fragility of the European banking system. Besides considering the main bank-level drivers affecting the net interest margin such as market power, capitalization, interest risk and the level of efficiency, we explicitly account for the effects of regulatory and institutional settings. The results show a persistence in the vulnerability of the banks’ sustainable profitability, even though this negative trend has been partly mitigated by the European Central Bank (ECB)’s recent monetary policies. The increase in non-traditional activities as well as the heterogeneous efficiency levels characterizing banking systems across the Euro Area, where operating costs remain generally high, have significantly contributed to the slowdown in bank margins from traditional activity. Finally, the regulatory environment is an important driver of the net interest margin, which remained lower in countries with higher capital requirements and greater supervisory power.
JEL Classification:
G21; L11; E43; E521. Introduction
The financial system has the function of favouring economic growth through an efficient intermediation between savings of depositors and investments of borrowers. Banks operate as a financial accelerator of primary importance for supporting firms’ investments [1,2]. Furthermore, the recent global financial crisis has shown that banks, depending on their health, can either mitigate or amplify the impact of financial shocks on the real economy [3].
A sustainable level of bank profitability underlies both financial stability and economic growth. On the one hand, financial stability is pursued by adequately capitalized financial intermediaries and retained earnings, which represent an important component of bank capital, depending on a bank’s ability to set aside profits. On the other, bank profitability has implications for the real economy, because a sustainably profitable banking sector is necessary to support access to credit for firms and households, stimulating economic activity in the long-term [4].
The net interest margin (NIM) measures bank health and efficiency in the traditional activity of storing deposits and making loans. Starting from the pioneering study by Ho and Saunders [5], a broad literature has analyzed the elements determining the net interest margin, which represents a bank’s ability to set the price of loans above interest expenses. With the deregulation of banking activities, recently intensified in the European system, banks have diversified their range of activities in search of sustainable levels of profitability: Riskier non-traditional businesses grew up, altering asset composition and transmission mechanisms. On the one hand, financial institutions became less dependent on net interest margins that were further contracted during the recent financial instability; on the other hand, the banks’ vulnerability increased in crisis times and their risk-taking behavior has important implications for financial and economic fragility [6]. The health of banking systems is a driver of economic growth and the recent vulnerable profitability characterizing the banks’ traditional activities cannot be neglected. This is where policy makers’ main concerns lie, given the crucial role of bank financing and the imperfect substitutability between bank lending and bonds in the Euro Area. The monetary policy measures adopted by the European Central Bank (ECB) have played a crucial role during the financial crisis period, providing abundant access to central bank liquidity and lowering the cost of debt with positive consequences for bank funding and borrower creditworthiness [7,8]. However, prolonged periods of low or even negative interest rates, by reducing net interest income, may have a negative effect on bank profitability especially for those banks that mainly rely on traditional activity [9,10,11]. This may raise concerns on the effectiveness of monetary policy easing on bank profitability, and hence on bank soundness and financial stability, during a period of very low monetary policy rates. In this respect, the International Monetary Fund (IMF) [12] and the ECB [13,14] emphasize that Euro Area banks should significantly change their business models because existing balance sheets and business practices may not be able to ensure sustainable returns, whether the low-rates environment will persist over time.
This study investigates the main determinants of net interest margin in the Euro Area during the period 2008–2014. Using an unbalanced panel dataset, containing information on the banks’ balance sheets, we identified the main drivers affecting the traditional activity of financial institutions, such as credit market instability, the expansion of non-traditional businesses and efficiency. A further determinant of banks’ profitability is market power: As shown in Cruz-García et al. [11], the recent trends of banking margins are significantly affected by changes in the degree of competition of the European financial systems. Thus, we explicitly investigated the impact of market power, measured by the Lerner index. Moreover, the low and vulnerable banking profitability as well as the greater market uncertainty triggered by the Global Financial Crisis caused an initial credit shock that was followed by a swinging and instable loan growth until the recent years. In this view, it is crucial to account for the effects of expansionary monetary policies that the ECB implemented to revitalize the provision of credit and profitability. Finally, the regulatory settings of financial systems in the Euro Area are properly accounted for, testing the impact of this heterogeneous institutional infrastructure on net interest margins.
Results from the analysis of the factors explaining net interest margins may be useful in the design of specific measures of economic policy. By way of preview, we found that money market interest rates and the yield curve slope had a positive influence on net interest margin with an inverted U-shaped effect. This evidence suggests that a normalization of monetary policy would lead to an increase in net interest margins: this increase in banks’ margins would be particularly evident, since the presence of a quadratic effect implies that a rise in money market rates has a stronger positive impact on NIMs when the starting level of interest rates is low. Moreover, more risk averse banks, displaying greater levels of capitalization, are more likely to charge higher interest rates on loans. Market power is an important factor determining the net interest margin. Evidence shows that the sharp increase of market power in the aftermath of the crisis has additionally contributed to shrink margins. The negative impact of the revenues from non-traditional banking activities suggests that bank cross-selling behavior aimed at obtaining higher service fees by underpricing loans and traditional products for attracting potential customers who are likely to be interested in other products and services. As regards the results of dynamic models, we provided evidence for the inertia in net interest margin. Praet [15] highlights that despite the general economic recovery of the Euro Area, the pre-crisis banking scenario is unlikely to return and profitability is going to remain vulnerable in the following years. Inertia emerging from this investigation, focused on European banks, keeps going that way. Finally, we provided evidence of significant impacts of institutional and regulatory infrastructures on the banks’ health in traditional activities. In particular, banks’ interest margins were higher in countries where capital regulations were more stringent registered; conversely, we found that banks operating in countries with a stronger official supervisory power presented a lower profitability.
The study is structured as follows. Section 2 presents the literature review. Section 3 describes the data and the variables used in the empirical analysis. Section 4 illustrates the econometric methods. Section 5 presents and discuss the empirical results. Finally, Section 6 provides some concluding remarks.
2. Literature Overview
Ho and Saunders [5] based their theoretical model on the assumption that a bank is an intermediary between lenders and borrowers and highlighted the relevance of transaction size, competition in banking systems, lenders’ risk aversion and market risk in determining the pure interest spread. Allen [16] considered various types of loans and the possibility of interdependence and cross-elasticities in the demand between different bank products. Angbazo [17] included credit risk, market interest rate, and underlined how the joint connection between these two types of risks affects net interest margins. Maudos and Fernández De Guevara [18] extended the analysis to explicitly taking into account operating costs. Another important determinant of bank interest margins is the capitalization level: Bank capital allows raising uninsured forms of debt traditionally used to measure the banks’ degree of risk aversion as a driver of the net interest margin [19]. The level of capital, acting as a signal about the intermediaries’ solidity, affects external ratings and investor perceptions.
A further element of novelty introduced in the extensions of the Ho and Saunders [5] model relates to the rapid growth of non-traditional activities. The recent disintermediation in European banking systems entailed changes in financial activities and cost-income structures. Financial deregulation and disintermediation resulted in a sharp decline in the profitability of traditional banking activities and induced a diversification of the sector in European financial systems. The consequence was a drastic increase in non-traditional activities, which were fed by underpricing loans and traditional products as a loss leader in order to win higher service fees [20]. Lepetit et al. [21] show more diversified lenders operate with lower bank loan spreads, in order to incentivize sales of other services and products. Furthermore, Maudos and Solís [22] strengthen the previous evidence on the relationship between low interest margins and cross-subsidization of banking activities but, although the relevance of non-interest income increased, the net interest margin did not decrease in the Mexican banking sectors due to the preponderance of the market structure and average operating costs.
Market competition is usually proxied by the Herfindahl-Hirschman index and by the Lerner index. The first variable is defined as the sum of the squares of firms’ market shares and it is a country-level measure based on the assumption that competition takes place on a national scale. Lerner index is an alternative indicator of the degree of competition, specifically used in the case of banking markets. This indicator measures firms’ ability to set prices above marginal costs [23] and, differently from the Herfindahl-Hirschman index, it is focused on individual bank’s market power. Among others, Carbó Valverde and Rodríguez Fernández [24] have used the Lerner index for analysing the implications of the expansion of non-traditional activities on bank market power. This measure allows maintaining a micro-level approach to the analysis on market competitive structure and it is widely used in empirical works on bank profitability and pricing policy. Literature shows a positive relationship between market power and the net interest margin, highlighting that banks tend to operate with higher margins when competition is lower [18].
In a recent contribution, Borio et al. [10] further extended the model to include the money market interest rate, the slope of the yield curve, as well as the interest rate risk as determinants of net interest margins. Empirical evidence suggests that expansionary monetary policy measures, introduced to address financial instability in the years after the onset of the Global Financial Crisis, have had a negative impact on bank interest margins. Alessandrini and Nelson [9] have found a strong impact of market rates, yield curve slope on net interest margin and profitability in the UK. Consistently with this extension, Cruz-García et al. [11] have shown the reduction in interest rates and the flattening of the yield curve have a negative and non-linear impact of the banks’ net interest margins. This result is likely due to the downward stickiness of deposits rates, which explains why a reduction in policy rates has a greater negative impact on interest margins when deposit rates are closer to the zero-percent floor.
Barth et al. [25] have documented the presence of significant cross-country heterogeneity in banking systems, even in relatively similar financial environments like the Euro Area, where a completely integrated structure across countries has not yet been achieved. Several empirical studies have analysed the role of capital regulation, banking supervision and the structure of financial institutions on bank lending behaviour and interest margins. In particular, more stringent regulatory capital requirements, by incentivising a more prudent lending behaviour, should reduce net interest margins. However, several studies [26] show that banks operating in systems with higher capital requirements attempt to lower the cost of holding relatively more equity by seeking higher interest margins. Similarly, Barth et al. [27] suggest that capital regulation does not have a clear impact on bank margins, although they point out that more stringent capital requirements reduces the level of non-performing loans. Another important factor which have been identified in the literature as relevant in affecting bank performance and profitability is supervisory power, that is the degree to which a country’s banking supervisory agency has the authority to take specific actions to prevent and correct problems in bank behaviour and activity. In this respect, Beck et al. [28] and Barth et al. [25] point out that a higher supervisory power leads to higher level of bank efficiency and hence it should lead to lower net interest margins. Furthermore, several studies have focused on the role of deposit insurance schemes in mitigating or amplifying moral hazard problems and on their impact on bank stability and profitability [29]. Empirical evidence on the impact of deposit insurance on bank risk taking behaviour is mixed. On the one hand, Gropp and Vesala [30] and González [31] show that deposit insurance is useful to limit moral hazard problems and significantly reduces banks’ risk taking, exerting a beneficial effect on bank stability. On the other hand, Laeven [32] has pointed out that deposit insurance schemes exacerbate moral hazard in bank lending and encourages bank risk taking; similarly, Demirgüç-Kunt and Detragiache [33] have found that deposit insurance has an adverse effect on bank stability and profitability, increasing the likelihood of banking crises especially where bank interest rates are deregulated and the institutional environment is weak.
3. Data and Variables
3.1. Data
Our main data source is composed of the annual balance sheet information of individual banks taken from the Bureau van Dijk Bankscope database for the years 2008–2014. Our dataset is an unbalanced panel of around 3000 cooperative, commercial and savings banks from the Euro Area. The sample definition is aimed at ensuring as much comparability as possible in accounting standards and, as in Drakos et al. [34] and Caglayan and Xu [35], we primarily used data from unconsolidated accounts whenever possible, relying on consolidated statements otherwise. In order to minimize the so-called “survivorship bias” (i.e., some banks may not exist over the entire sample period due to mergers and acquisitions or failures), like most of the literature [36,37] we did not restrict the sample to banks that have complete data for the entire period, but we used all the available bank-year observations. The estimation sample consisted of 15,822 bank-year observations, after excluding banks for which there was no information on any of the explanatory variables for net interest margin and dropping observations reporting extreme and implausible values for the dependent variable and for the main regressors. It is worth remarking that Bankscope data do not allow to properly capture mergers and acquisitions (M&As). First, when there are no changes in the name for the bank, the explicit identification of M&As is not straightforward. Second, with the exception of the year of establishment, there is no other historical information that completely allows excluding that a bank was not involved in any mergers or acquisitions. Since we do not have additional external data on M&As, following the approach suggested by Duprey and Lé [38], in our empirical model we controlled for the evolution of banks’ total assets over time. Additionally, in order to further mitigate the potential bias of unidentified M&As, we dropped the observations characterized by extreme values of the growth rate of total assets that could not have been driven by internal growth.
We integrated bank-level information using country-level data from different sources. In particular, using the dataset of Barth el al. [25] we controlled for differences in regulatory systems in the countries of our sample. The indices are constructed on the basis of information obtained in four points in time that correspond to the updates in the Barth el al. [25] database, assuming that regulatory policies remained unchanged in the years following the survey as in Fernández and González [39] and Pasiouras et al. [40]. Furthermore, we accounted for the role of interest rates and the slope of the yield curve and control for differences in macroeconomic conditions and in banking system characteristics across countries, by using data from Eurostat and the ECB.
Finally, it is worth remarking that the use of annual data may represent a limitation of our analysis in terms of appropriately identifying the impact of variables that are measured at higher frequencies. However, this study is primarily concerned with whether the changes occurred since the crisis in bank asset structure and financial markets contributed to contract net interest margins, and only secondarily with the impact of short-term responses of net interest margin (NIM) to monetary policy changes. A thoroughly analysis of the effects of variables measured at higher frequencies on bank interest margins will require the use of quarterly balance sheet data and can be the scope of future research.
3.2. Variables
3.2.1. Net Interest Margin
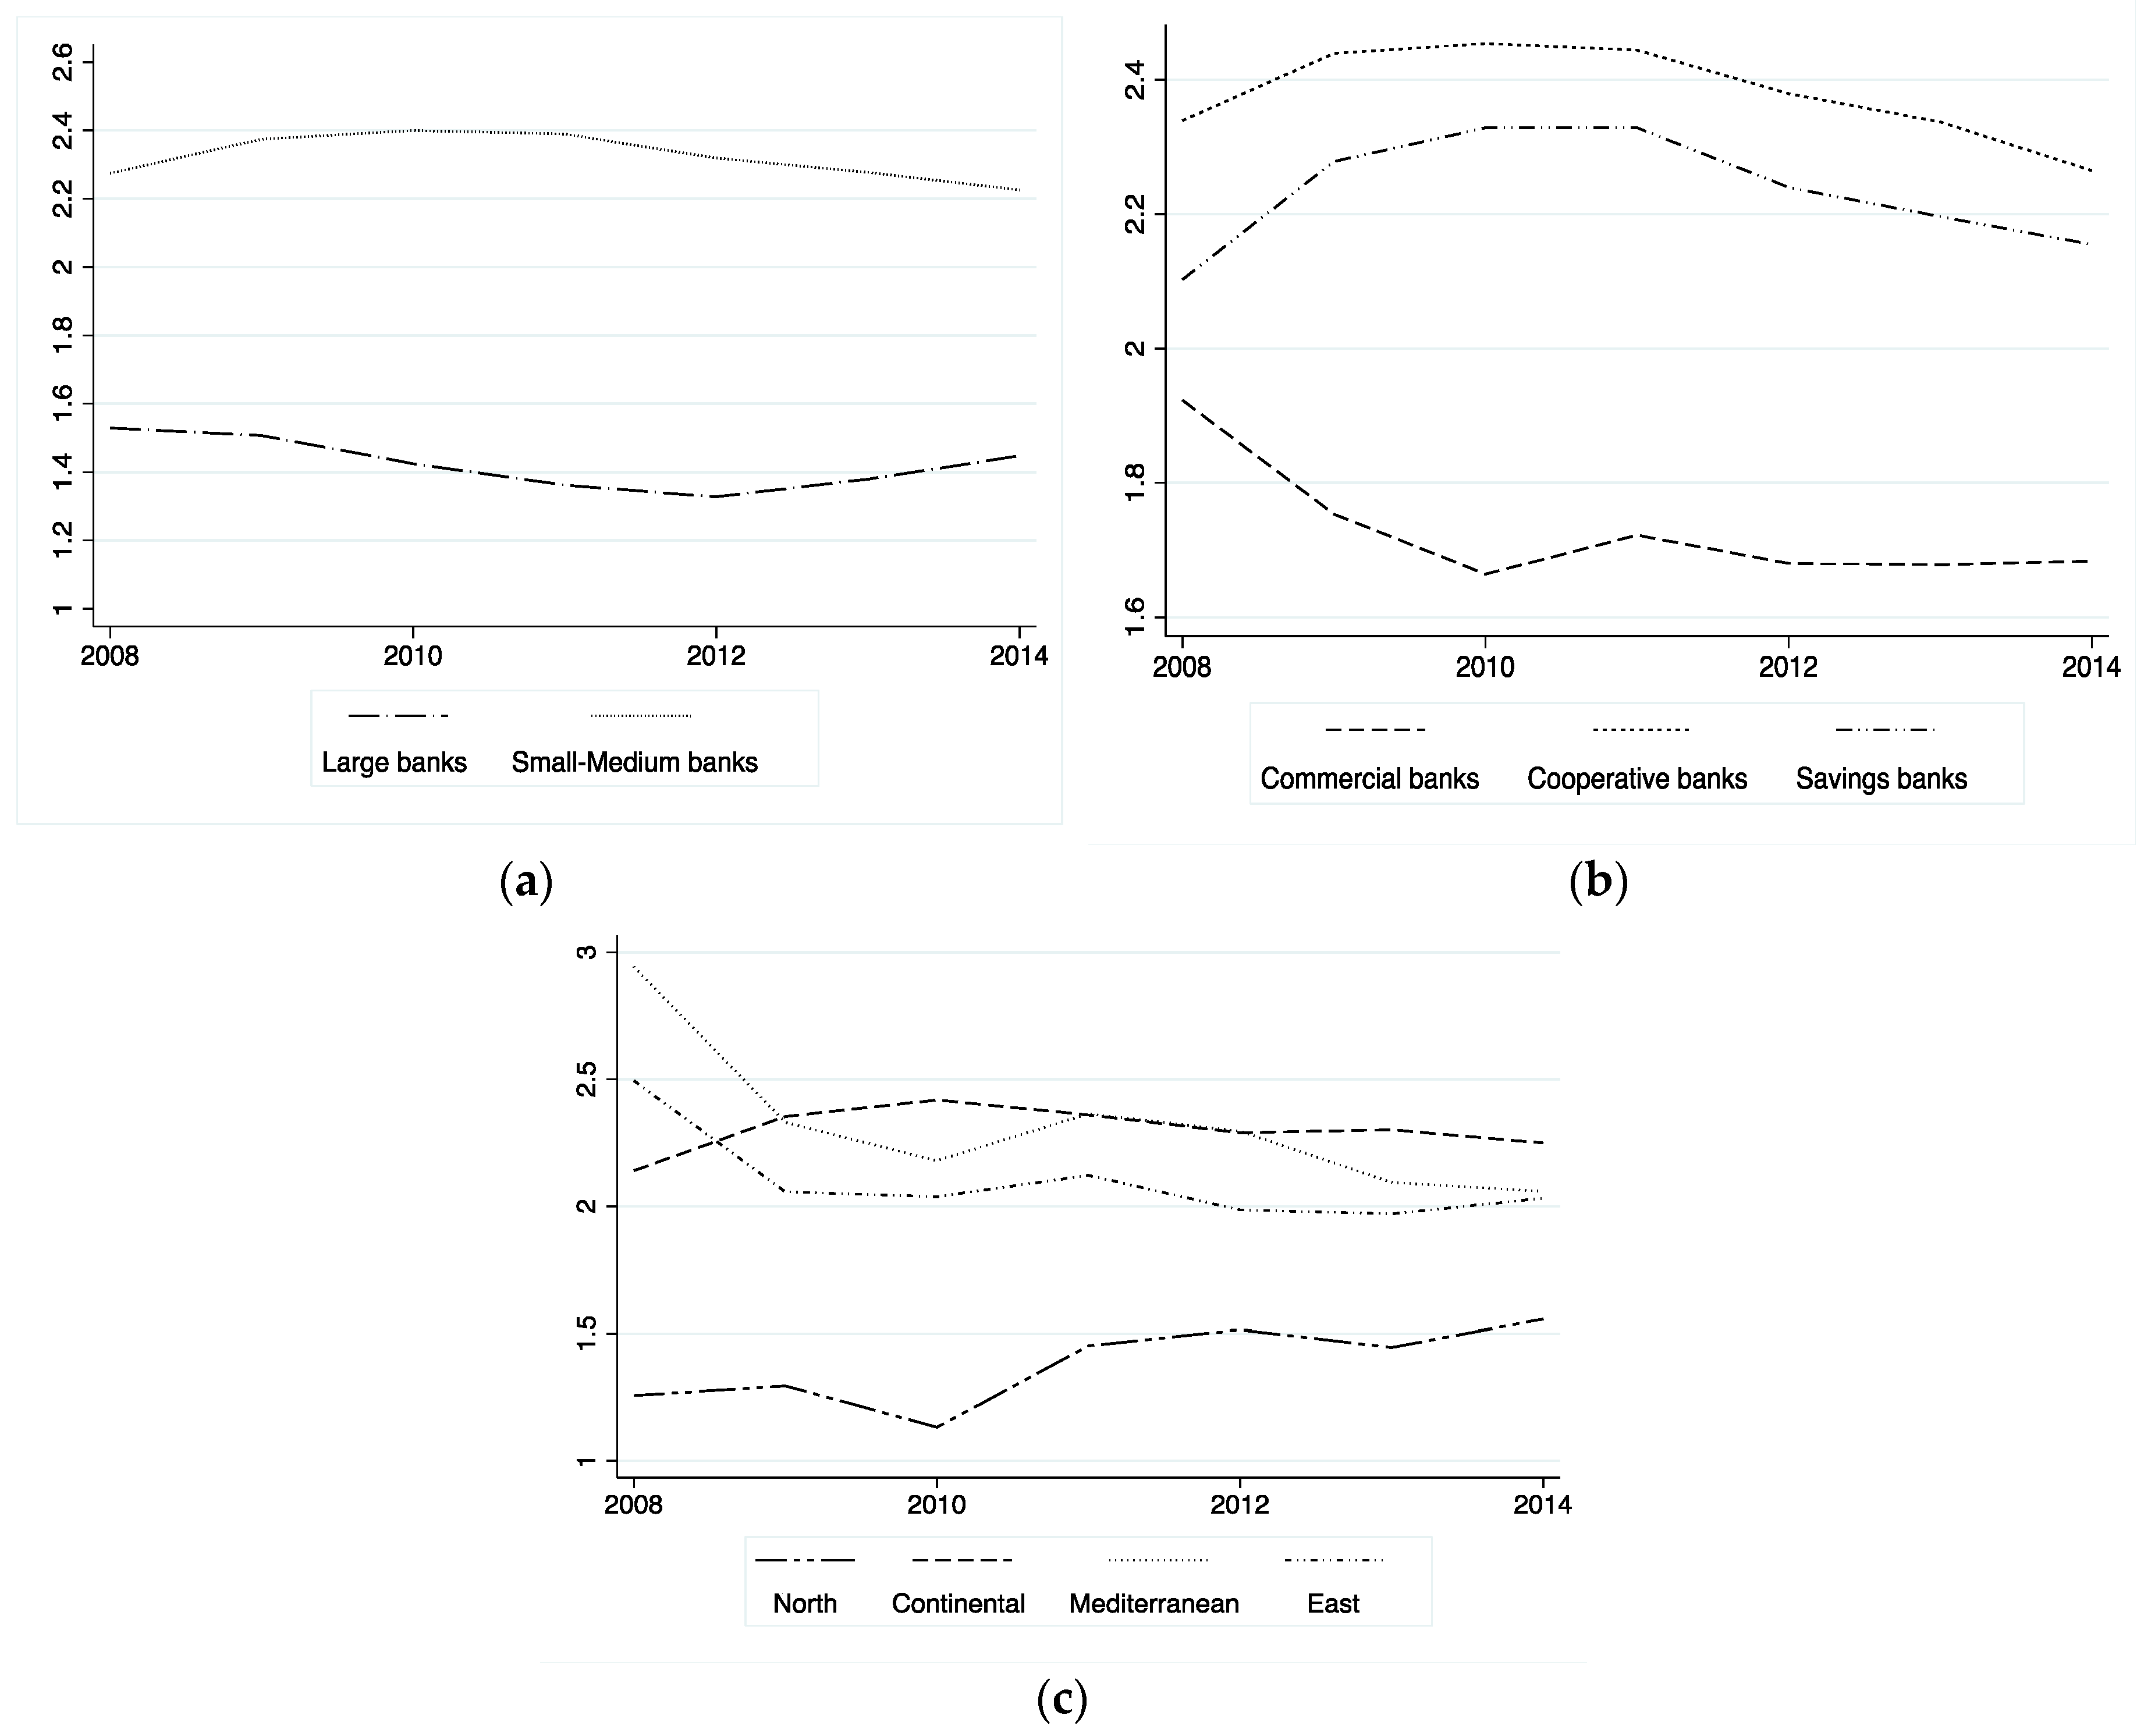
We explored the main determinants of NIM measuring the ability of a bank to operate with higher interest rates than interest expenses. This proxy, calculated as the ratio of financial income minus expenses to total assets, is largely used in literature [5,10,26,41]. As shown in Figure 1, from 2008 to 2014, there were significant differences in the level of net interest margins across bank size, specialization and countries over time. Large banks displayed the lowest interest margins, followed by commercial institutions. The highest values were observed for cooperative, savings and small-medium intermediaries. This may be due to the different business model characterizing cooperative and small banks with respect to large institutions. In particular, their specialization in local financing leads small and cooperative banks to be more focused on traditional activities, differently from large banks which may be more likely to adopt cross-selling strategies aimed at winning higher service fees by using loans and traditional products as a loss leader. Finally, banks in northern European countries showed the lowest margins even though the trend seemed to slowly increase and converge towards the median values of the other countries after 2010.
The following subsections describe the variables used in this study as proxies for the determinants of the net interest margin postulated by the theoretical and empirical models previously described [5,10]. Table 1 provides an overview of the explanatory variables included in the regression analysis and their expected impacts, while Table 2 reports average values of the regressors across countries. Complete variable definitions and data sources are presented in Table A1 in the Appendix A. In the Supplementary Online Appendix, Table S1 reports pairwise correlation coefficients among all the explanatory variables, while Figures S1 and S2 present the time patterns of some bank-level explanatory variables (disaggregated by macro-region) and of the three-month interbank rate (Euribor).
3.2.2. Bank-Level Determinants of the Net Interest Margin
A relevant factor influencing net interest margin is the average size of transactions. On the one hand, the potential losses are directly linked to the loan volume and, therefore, the risk premium may increase in transaction size. On the other hand, scale economies by reducing average operating costs could exert an opposite impact.
Credit risk unavoidably affects banks’ choice of granting credit [17]. Banks with higher uncertainty in expected returns of granted loans will be forced to charge higher rates in order to offset the risk of default. At the same time, fluctuations in money market interest rates increasing market risk and accentuating the general uncertainty in the banking system exert a relevant impact on banks that will be forced to operate with premium margins due to the higher systemic risk [26]. Additionally, the interaction between credit risk and interest rate volatility is included in order to account for the composite impact on net interest margin of market instability jointly with the bank-level default risk profile. In case of temporal asymmetries between offer of deposits and demand of loans, intermediaries may be forced to operate with higher intermediation margins.
Besides paying interests on deposits, banks may offer also additional services associated with them which involve implicit interest payments. These payments are expected to affect positively the interest margin, as banks might be forced to set higher prices to cover additional services costs [5].
Holding reserves remunerated at an interest rate below that of the market represent an opportunity cost for the bank, which may be passed to the customers either via a reduction of interest rates paid on deposits or via an increase of interest rates charged on loans. Thus, the expected impact is positive: Banks with larger reserves need higher net interest margins to compensate higher opportunity costs.
The degree of risk aversion affects banks’ margins. McShane and Sharpe [19] have used the level of capitalization as a proxy of risk aversion and have showed that more risk averse banks set higher interest margins. Similarly, we expected risk adverse intermediaries to invest more in traditional activities. Even though the profitability of traditional banking businesses decreased during last years, it remained safer with respect to other more remunerative and non-traditional operations.
Maudos and Fernández de Guevara [18] have shown the relevance of operating costs in shaping the net interest margin. Banks facing relevant operating costs are forced to operate with higher margins in order to cover their higher costs. Moreover, an efficient banking management aims at minimizing the levels of operating costs per unit of gross income: A high cost to income ratio may reflect inefficiency in containing input prices caused by the selection of less profitable assets and high-cost liabilities. Thus, such banks are forced either to set higher margins or to reduce the volume of loans in order to offset and compress the higher operating costs per unit of gross revenue. The descriptive evidence presented in Table 2 suggests that banks from Cyprus, Greece and Portugal operate with the highest costs and tend to set the highest margins, whereas in countries where efficiency is higher, such as Ireland, Luxembourg and Finland, the average net interest margin is lower.
Recent changes in banking policies towards non-traditional businesses have considerably enlarged the range of activities. The increase in non-interest income has modified the weight of traditional products. On the other hand, the provision of a larger set of products increases incentives for cross-subsidization and loan pricing strategies: Banks may in fact attempt to obtain high service fees by underpricing their credit facilities as a loss leader to their clients [20]. Carbó Valverde and Rodríguez Fernández [24] and Lepetit et al. [21] have shown a negative impact of non-traditional activities on the net interest margin. We thus expect that banks with more diversified activities tend to operate with lower margins to attract and stimulate customers to acquire more profitable non-traditional services.
The market structure, by determining competitive pressure or monopolistic power on financial actors, may deeply affect net interest margins. A widely used proxy of bank market power is the Lerner index, defined as the difference between price and marginal cost rescaled by the price. It measures the capacity to set prices above the marginal costs. Theoretically, it ranges from 0 (perfect competition) to 1 (monopoly). The empirical estimation of this index is based on Pulley and Braunstein’s translog composite cost function [42], used to derive the bank’s marginal cost. Among others, Fernández de Guevara et al. [43] and Maudos and Pérez [44] have implemented this procedure using the ratio of total revenue to total assets as a proxy for the average price of banks’ production. A positive relationship between the Lerner index and the net interest margin is expected, reflecting the fact that banks with greater market power are able to set a higher spread.
3.2.3. Financial Market Characteristics and Interest Rates
The money market interest rate is a relevant driver of net interest margins. The impacts of monetary policy measures are particularly evident on the banks’ traditional business. Despite the existence of a “risk-taking channel”, with low levels of policy rates reducing risk perception and encouraging banks to take higher risks (and increase leverage), the impact of monetary policy on bank lending still remains important. The empirical literature has recently focused on the effect of the flattening yield curve slope on net interest margins [10,45]. This variable is calculated as the difference between long term market interest rates (lending rates) and short-term market interest rates (borrowing rates). In particular, we computed the gap between the yields of country-level ten-year bonds and three-month interbank rates (Euribor) as a proxy for the slope of the yield curve. Consistently with Cruz-Garcia et al. [11], its impact on net interest margin should be positive and a reversed U-shaped trend is largely expected. A first point is the constraint of a zero-percent interest rate floor for deposits which may partly explain this non-linear trend of the yield curve: When rates are closer to zero, a cut in the monetary policy rate shrinks the margin more. A second issue is related to the possibility of a rapid reassessment of assets and liabilities. A shorter assets maturity structure entails a bigger effect of a drop in the rate on the interest margin. When the yield curve slope is greater, interest rates on loans tend to be markedly higher than that on deposits, implying a larger margin.
3.2.4. Regulatory Structure, Macroeconomic Factors and Banking System Characteristics
Bank behavior is also driven by regulatory, macroeconomic and structural conditions [46,47,48]. To control for these factors, we considered three country-level indicators derived from the dataset of Barth et al. [25]. Firstly, we included an overall indicator of capital stringency in order to control for the strictness of minimum capital requirements reflecting certain risk elements. This index does not measure statutory capital requirements, but it measures the rules and policies used to assess and verify the degree of capital at risk in a bank. Stricter requirements may induce a greater risk aversion which leads banks to increase the level of capitalization and, thus, to operate with higher margins in order to cover the higher costs of equity financing. Secondly, we used a measure of official supervisory power, which measures the power authorities have to take specific actions for preventing and correcting problems. On the one hand, strong official supervision may reduce excessive risk-taking behaviour and increase bank performance and stability; on the other hand, a strong supervision may hinder bank operations. Thirdly, we included an indicator accounting for the effort on mitigating moral hazard. A more extensive coverage offered to depositors may have an adverse impact on bank stability [27] and thus reduce margins.
Furthermore, we controlled for macro-economic conditions using country-level GDP growth, unemployment and inflation rates. During more favourable economic conditions, banks are more prone to raise their lending and to improve price terms in order to expand their market share. The increase of general business opportunities makes firms’ default risk lower. Similarly, we expected countries characterized by higher unemployment rates to display more problematic credit access conditions deriving from the uncertainty of the labour market. Inflation rates may, additionally, affect lending and loan pricing if borrowers’ real incomes are sticky. If incomes do not grow in line with inflation, a rise in inflation increases costs (for both households and firms) and lowers the amount of available funds for debt repayment [49,50,51,52]. This deterioration in borrowers’ net worth and creditworthiness would then cause restrictions in bank lending and loan pricing policies.
The inclusion of these macro-economic indicators, together with the country fixed effects, allows to control for country-level heterogeneity in banks’ interest margins over the period of analysis. However, it would be interesting to investigate the particular behaviour of bank NIM in specific country groups (e.g., PIGS countries) during the sovereign debt period. This sub-sample analysis could be the object of future research.
4. Econometric Methods
4.1. A Dynamic Model of Net Interest Margins
In order to analyze the main determinants of net interest margin, we used a dynamic panel data model, which allowed us to take into account bank-specific individual heterogeneity and to capture the persistence over time of the dependent variable. In this latter respect, the current values of the NIM may be determined by their previous values, since banks need to match the random deposit supply function and the random demand of lending across periods [22]. By including the lagged dependent variable as an additional regressor, we are therefore able to properly model the inertia in the trend of the net interest margin. Formally, we defined the following dynamic model:
where denotes the net interest margin for bank , in country , in period . denotes bank-specific variables, represents country-specific macroeconomic and regulatory controls, and are time fixed effects. is an independently and identically distributed error term, whereas is an unobserved time-invariant bank-specific effect. Moreover, country-level variables are included in order to account for economic, regulatory and institutional changes characterizing the economic and banking systems of Euro area countries over time. With respect to the parameter of the lagged net interest margin, a value of which is not statistically different from 0 implies that bank margins are characterized by a high speed of adjustment (i.e., no persistence), whereas a value statistically equal to 1 means that the adjustment is very slow (i.e., high persistence). Values ranging between 0 and 1 suggest the presence of persistence, with banks’ margins converging to their equilibrium values, whereas values above 1 imply an unstable dynamic, with accelerating divergence away from equilibrium. Negative values of imply that convergence to equilibrium cannot be achieved. It is worth remarking that implausible negative values may be indicative of problems with the small T dimension of the panel dataset.
Given the unavailability of a long time series, we did not adopt the two-stage estimation approach proposed by Ho and Saunders [5] and Saunders and Schumacher [26] for modelling the net interest margin. Following McShane and Sharpe [19], Angbazo [17] and Maudos and Fernández De Guevara [18], we used instead a single-stage estimation approach which allowed us to directly estimate the parameters of the net interest margin model in Equation (1).
In order to deal with endogeneity concerns arising from the correlation between unobservable effects and the lagged dependent variable, as well as the potential endogeneity of some right-hand side variables, we used the system GMM estimator developed by Arellano and Bover [53] and Blundell and Bond [54]. The system GMM estimator combines the original equation in levels and a transformed one with suitably lagged levels as instruments. Following Roodman [55], we applied the forward orthogonal deviations transformation of the original equation, instead of first-differencing, in order to maximize sample size in panels with gaps. The two-step GMM approach was used with asymptotic standard errors robust to heteroskedasticity, applying the Windmeijer [56] finite sample correction to the covariance matrix.
To ensure the consistency of the GMM estimator, we checked the exogeneity of the instruments by using the Hansen over-identifying test and tested the absence of second-order serial correlation in first-differenced error terms.
4.2. Endogeneity Issues
In the estimation of model 1, we explicitly considered the possibility that some explanatory variables are not strictly exogenous. Endogeneity can arise, for instance, when causality is reversed (i.e., the variables we used to model banks’ decisions of setting loan prices are themselves affected by the net interest margin). Because of the endogeneity of the cost and price variables, Lerner index is not exogenous. Market power allows banks to set higher interest prices and at the same time banks can use the proceeds from these earnings to increase market shares. Income from non-traditional activities may also involve endogeneity issues [22,57]. If a bank charges low interest rates on loans, it is possible that it tries to compensate for this low traditional profitability by an increase in non-traditional activities. Furthermore, in order to stimulate the cross-selling of fee-generating businesses, banks may be willing to grant more favourable interest conditions.
Econometrically, endogeneity implies that these variables are correlated with the composite error term and earlier shocks, but uncorrelated with and subsequent shocks. In the estimation of model (1), these variables are thus treated symmetrically with the dependent variable. The set of potential instruments is therefore given by and , where is the vector of endogenous explanatory variables. Specifically, when we estimated the dynamic model of the net interest margin, we used and collapsed the second, third and fourth lags in levels as an instrument of the lagged dependent variable. Similarly, we instrumented the Lerner index with its second, third and fourth first-differenced lags and, following Cruz-García et al. [11], we also used the country-level Herfindahl-Hirschman index of bank loan concentration as an additional instrument. Finally, we recurred to the fourth and fifth first-differenced lags for instrumenting the proxy of non-traditional activity.
5. Results
5.1. Bank-Level Characteristics
Estimation results are presented in Table 3. We considered two sets of empirical specifications. Firstly, we assumed a linear relationship between net interest margin, short-term interest rate and yield curve slope (Models (a) and (b)). Secondly, we controlled for the existence of non-linearities with the inclusion of squared terms (Models (c) and (d)). Furthermore, as in Maudos and Solis [22], we included in Models (b) and (d) an additional interaction term between credit risk and interest rate risk. It is, first of all, worth noticing that the results were consistent and robust across the specifications. Moreover, we also considered static pooled and fixed effects models of the net interest margin, estimated by an instrumental variables approach. Estimation results are reported in Tables S2 and S3 of the Supplementary Online Appendix. Differences in estimation results between dynamic and static models provided further support to the necessity of appropriately controlling for both individual heterogeneity and persistence over time in bank net interest margins.
Autocorrelation tests highlight the presence of first-order serial correlation in the first differences of the error terms, but no significant second-order serial correlation. Furthermore, the Hansen test of overidentifying restrictions provided support to instruments exogeneity and overfitting of endogenous variables. Results of autocorrelation and overidentification tests thus confirm that the GMM estimation of the dynamic model was implemented appropriately.
As expected, we found evidence of persistence in the net interest margin. The lagged dependent variable was statistically significant at the 1% level in all the models, suggesting that a complete specification of the interest margin should include the inertia term. Our empirical findings clearly pointed out that the banks’ ability to operate with a certain margin tends to persist over time, coherently with results of Maudos and Solís [22] and Cruz-García et al. [11]. In particular, an important implication of this evidence is that, in a protracted low interest rate environment, inertia in the trend of NIM may be indicative of a difficult sustainability of traditional activities, as a consequence of the long-term negative impact on bank profitability of reduced net interest income.
The new structural and technological challenges, faced by banks in terms of raising operational efficiency, have been the result of the low profitability scenario that emerged after the recent financial crisis, feeding the perspective of a long-run downturn in net interest margins. Despite attempts to even out the level of efficiency of the European banking system, operating costs remained heterogeneous across countries where some regions, such as Italy, still present a relevant vulnerability draining the potential recovery.
Implicit interest payments present the expected positive effect. Banks lowering the remuneration of liabilities and charging more implicitly for their services are more likely to set higher net interest margins. As regards the opportunity costs of reserves, the results were not statistically significant. However, the direction of the impact seems to suggest that banks have not been able to offset the major costs of holding stable liquid reserves, imposed by the great instability of the banking system in the aftermath of the financial crisis, through a corresponding increase in their profitability.
The statistically significant coefficient of operating costs shows that banks that operate with higher costs need to increase net interest margins to cover expenses, confirming the findings of previous studies [18,22,58]. Furthermore, we found that better managed banks are characterized by higher net interest margins, as shown by the positive and statistically significant impact of the efficiency variable.
Capitalization significantly and positively affects the net interest margin. Risk aversion depends on personal attitude and it may be more accentuated in uncertain periods such as the years of the global financial crisis. More capitalized banks, displaying in their financing structure a greater degree of risk aversion, are more likely to charge higher interest rates in order to obtain higher margins. The quality of management has also a positive impact on the intermediation margin.
When endogeneity is properly addressed, the Lerner index exerts a positive and significant effect on the net interest margin. This evidence suggests that the increase in market power over the period of analysis (see Figure S3 in the Supplementary Online Appendix) has contributed to partially counteract the direct negative effect of the Global Financial Crisis on the supply of loans and it has allowed banks not to further reduce profitability. Banks in a position of greater market power are able to set higher interest rates and, thus, to obtain higher margins.
Finally, we provided empirical evidence on the negative effect of revenues from non-traditional banking activities on net interest margins. In this respect, the expansion of non-traditional activities contributes to explain the coexistence of low net interest margins and increasing market power [24]. Furthermore, banks may be willing to use loans as a loss leader and reduce interest rates charged in view of cross-selling strategies [20,21]. This behavior was induced by the low profitability characterizing traditional activities, which has led banks to engage in riskier assets. This may contribute to sustain bank profitability in a low interest rates environment, compensating for reduced interest income, but it may also lead to greater uncertainty due to the higher volatility of non-interest income sources [59].
5.2. Financial Market Characteristics and Interest Rates
Our empirical evidence points out a negative effect of a prolonged period of expansionary monetary policy on net interest margin. Low interest rates and a progressive flattening of the yield curve contributed to erode profitability and the net interest margin [9,10,11,57]. Accordingly, we found that the yield curve slope as well as money market interest rates positively affected the net interest margin. In the case of the Euro Area, these results showed that a sustainable profitability may be reached in the future through a reversion of interest rates trends. Initial rates cuts supported financial stability and contributed to foster the supply of credit during the first years after the onset of the crisis, but a long-run low interest rates policy may turn into a low bank profitability environment [12].
When the squared terms of these two explanatory variables were included (Models (b) and (d)), we found inverted U-shaped relationships with bank NIM, coherently with Cruz-García et al. [11]. This empirical evidence suggests that changes in money market rates and in the slope of the yield curve have more pronounced impacts on the net interest margin when the levels of the two explanatory variables are low.
Furthermore, we found that volatility in the money market rate leads banks to increase net interest margins due to the higher market risk, coherently with previous studies [26,57]. Our empirical evidence also showed that banks with a larger loan loss reserves to total assets ratio are characterized by higher interest margins, due to the greater credit risks. Furthermore, when we extended the empirical model to include the interaction between credit risk and interest rate risk (Models (b) and (d)), the coefficient of the interaction term was significant and negative: The higher the volatility in market rates and the greater the exposure to credit default, the lower the effect on net interest margin. As discussed in Brock and Rojas [57] and in Maudos and Solis [22], this evidence can be explained by inadequate provisioning for loan losses by banks in periods of higher interest rates volatility, which leads them to lower spreads and narrow down profitability.
5.3. Regulatory Structure, Macroeconomic Factors and Banking System Characteristics
Our study provides a significant contribution to the empirical analysis of the role of regulatory structures and macroeconomic conditions on banks’ net interest margins. Specifically, we found that banks in countries with more stringent capital requirements operate with higher interest margins. This result points out that stringent capital requirements, while incentivising more prudent lending behaviour, lead banks to attempt to cover the increased cost of holding equity capital by imposing a higher spread on net interest margin. A stronger official supervisory power has a negative effect on profitability, confirming the harmful effects of excessively powerful supervision on bank businesses [27]. Furthermore, we showed that banks operating in regulatory systems making increased efforts to mitigate moral hazard present a lower profitability. This evidence is in line with the findings of Demirgüç-Kunt and Detragiache [33], who have pointed out the negative impact of explicit actions against moral hazard on bank stability, when a strong banking regulation is absent.
Turning to the role of country-level macroeconomic factors, we found a negative impact of the unemployment rate, which is largely expected, as economic instability and uncertainty erode bank income due to the lack of new business opportunities. Moreover, we found that the inflation rate contributes to reduced bank margins: This result can be explained by the fact that interest rates on liabilities adjust to inflation more quickly than those on assets, leading to a negative relationship between inflation and the net interest margin [22]. Conversely, after controlling for the unemployment rate and inflation, GDP growth has a significantly negative effect, which can be explained by the greater competition on the loan markets during economic upswings driven by lower credit standards [58]. Finally, we pointed out that banks operating in countries where the level of financial development (as proxied by branch density) is higher, are more likely to have higher interest margins.
6. Conclusions
Bank profitability is a key concern for the financial stability across the Euro Area. The ECB’s monetary policies were implemented to boost economic recovery after the Global Financial Crisis, but bank profitability remained weak, especially in terms of net interest income.
This study focused on the main drivers of the banks’ net interest margins, whose higher vulnerability has been in the spotlight since the crisis. We analysed a broad sample of banks from the Euro Area for the period 2008–2014 and controlled for the influence of common determinants depicted in literature such as market power, credit and interest rate risk, risk aversion, non-traditional activity and recent monetary policy measures. Furthermore, country institutional settings were properly accounted for by measuring how heterogeneity of regulations and supervision around the Euro Area affected net interest margins in the aftermath of the crisis.
We contributed to the existing literature in various directions. Firstly, the investigation highlights the relationship between low bank margins and the financial vulnerability characterising the years after the onset of the crisis. Secondly, using the Lerner Index for measuring the effect of competition on net interest margin and we found that the sharp increase of market power in the period 2008–2010 partly counteracted the direct negative effect of the financial turmoil, contracting loan growth rates, on traditional profitability, even though the health of the banking system remained weak. Thirdly, the heterogeneity of regulatory settings, resulting from different country-level regulations across apparently similar banking systems, is still substantial. The possibility to control for the effects of a plethora of laws and practices discloses important issues to address investigations on banking activities and to assess which policies work best to promote well-functioning banking systems [25]. In our empirical investigation, we thus explicitly considered measures of bank regulation and supervision in order to analyse the impact of the heterogeneous institutional and regulatory structures on net interest margins, pointing out the necessity of taking into account the effects of different European country-level regulations. Furthermore, we accounted for the issue of temporal persistence in net interest margins. A significant inertia in the banks’ financial income and costs structure was displayed, which turned into the current low profitability scenario, whose stickiness to the ECB’s interventions suggests similar future perspectives for some years to come. Finally, we focused our analysis specifically on the Euro Area, an extremely bank-oriented system, during a period of significant standard and non-standard monetary policy measures, specifically aimed at accelerating the economic recovery after the Global Financial Crisis.
ECB’s measures to address the financial crisis have significantly contracted interbank market rates, causing a negative effect on net interest margins, which may hamper sustainable profitability in the long term [10,11,45]. Our empirical results confirmed that the extended period of low interest rates and the flattening of the yield curve have significantly eroded the banks’ net interest margins. In this respect, a normalization in monetary policy measures would exert beneficial impacts on net interest income, thus improving the sustainability of bank profitability and hence financial stability. On the other hand, the strong increase in market power laid the foundations for a turnaround in the trends of net interest margins, which is however hampered by the recent changes in the income structure of European banks entailing a greater weight of fee-based income that has contributed to further lower the profitability of traditional activities. Non-traditional activities seem to incentivise bank lending behaviour with a view to cross-selling, but at the same time these practices compress net interest margins, as banks tend to use loans as a loss leader and reduce interest rates charged [21].
Despite accommodative monetary policies that have contributed to the economic recovery and have positively affected some of the main components of bank profitability (i.e., loan loss provisions and non-interest income) [8], the dominant role of net interest income in bank earnings raises significant concerns on the sustainability of bank profitability for some years to come [15]. This is clearly a challenging situation for banks, which have to face structural and technological changes to improve operational-efficiency and achieve a higher degree of income diversification [12,13]. These efforts may require adjustments to the existing business models and management strategies, especially in a context of increasing competitive pressures from non-bank financial intermediaries, and are crucial to reach more sustainable levels of profitability in the future.
Supplementary Materials
The following are available online at https://0-www-mdpi-com.brum.beds.ac.uk/2071-1050/11/14/3785/s1, Table S1: Pairwise correlation matrix, Table S2: Determinants of the net interest margin (IV regressions), Table S3: Determinants of the net interest margin (static model), Figure S1: Trends of non-traditional activities, operating costs and efficiency levels, Figure S2: Three month short-term interbank market rate (Euribor), Figure S3: Evolution of competition – Lerner index.
Author Contributions
The authors equally contributed to the development of this research.
Funding
This research received no external funding.
Acknowledgments
This research was supported by the University of Perugia (Ricerca di Base 2017, 2018).
Conflicts of Interest
The authors declare no conflict of interest.
Appendix A

Table A1.
Definitions of variables.
| Variable | Description | Source |
|---|---|---|
| Dependent variable | ||
| Net interest margin | The ratio of net interest income to total assets | BankScope |
| Bank-level characteristics | ||
| Size | The natural logarithm of total assets or, alternatively, the natural logarithm of gross loans | BankScope |
| Operating costs | The ratio of operating expenses to total assets | BankScope |
| Efficiency | The ratio of gross income to operating costs | BankScope |
| Non-traditional activity | The ratio of net non-interest income to net operating income | BankScope |
| Capitalization | The ratio of total equity to total assets | BankScope |
| Reserves | The ratio of cash and due from banks to total assets | BankScope |
| Loan loss reserves | The ratio of loan loss reserves to total assets | BankScope |
| Implicit interest payments | The difference between non-interest expenses and other operating income divided by total assets | BankScope |
| Lerner index | The difference between the price and the total marginal cost as a proportion of the price | BankScope |
| Financial markets characteristics and interest rates | ||
| Money market interest rate | The annual mean of monthly 3-month interbank offered rate (Euribor) | ECB |
| Interest rate risk | The annual standard deviation of monthly 3-month Euribor | ECB |
| Yield curve slope | The difference between the interest rate on a ten-year bond and the three-month interbank market interest rate | ECB |
| Regulatory structure | ||
| Capital stringency | Index of regulatory oversight of bank capital. It ranges between 0 and 8 with higher values indicating more stringent requirements | Barth et al. (2013) |
| Supervisory power | Index of supervisory authorities’ power to take specific actions to prevent and correct problems. It ranges between 0 and 14 with higher values indicating authorities’ greater supervisory power | Barth et al. (2013) |
| Moral hazard | Measure of the degree to which actions are taken to mitigate moral hazard. It ranges between 0 and 3 with higher values indicating greater mitigation of banks’ hazardous behaviour | Barth et al. (2013) |
| Country-level macroeconomic factors and banking system characteristics | ||
| GDP growth | The annual gross domestic product growth rate | Eurostat |
| Unemployment | The annual rate of unemployment | Eurostat |
| Inflation | The annual percent change in the consumer price | Eurostat |
| HHI | Herfindhal-Hirschman concentration index of bank loans | ECB |
| Branches | Number of bank branches per 1000 inhabitants | ECB |
References
- Bernanke, B.S.; Gertler, M. Inside the black-box: The credit channel of monetary policy transmission. J. Econ. Perspect. 1995, 9, 27–48. [Google Scholar] [CrossRef]
- Bernanke, B.S. The financial accelerator and the credit channel. In Proceedings of the Remarks at the Conference on Credit Channel of Monetary Policy in the Twenty First Century, Atlanta, GA, USA, 15 June 2007. [Google Scholar]
- Disyatat, P. The bank lending channel revisited. J. Money Credit Bank. 2011, 43, 711–734. [Google Scholar] [CrossRef]
- Nevin, C. Irish retail bank profitability 2003–2018. Central Bank of Ireland. Financ. Stab. Notes 2018, 2018, 1–12. [Google Scholar]
- Ho, T.; Saunders, A. The determinants of banks interest margins: Theory and empirical evidence. J. Financ. Quant. Anal. 1981, 16, 581–600. [Google Scholar] [CrossRef]
- Bernanke, B.S. Non-Monetary Effects of the Financial Crisis in the Propagation of the Great Depression; National Bureau of Economic Research: Cambridge, MA, USA, 1983. [Google Scholar]
- Freixas, X.; Laeven, L.; Peydró, J.L. Systemic Risk, Crises, and Macroprudential Regulation; MIT Press: Cambridge, MA, USA, 2015. [Google Scholar]
- Altavilla, C.; Boucinha, M.; Peydró, J.L. Monetary policy and bank profitability in a low interest rate environment. Econ. Policy 2018, 33, 531–586. [Google Scholar] [CrossRef]
- Alessandri, P.; Nelson, B. Simple banking: Profitability and the yield curve. J. Money Credit Bank. 2015, 47, 143–175. [Google Scholar] [CrossRef]
- Borio, C.E.; Gambacorta, L.; Hofmann, B. The Influence of Monetary Policy on Bank Profitability. BIS WP No. 514. Available online: https://ssrn.com/abstract=2668188 (accessed on 5 June 2019).
- Cruz-García, P.; Fernández De Guevara, J.; Maudos, J. Determinants of bank’s interest margin in the aftermath of the crisis: The effect of interest rates and the yield curve slope. Empir. Econ. 2019, 56, 341–365. [Google Scholar] [CrossRef]
- International Monetary Fund. Global Financial Stability Report - Potent Policies For A Successful Normalization; International Monetary Fund: Washington DC, USA, 2016. [Google Scholar]
- European Central Bank. Financial Stability Review; European Central Bank: Frankfurt am Main, Germany, 2018. [Google Scholar]
- European Central Bank. Financial Stability Review; European Central Bank: Frankfurt am Main, Germany, 2019. [Google Scholar]
- Praet, P. The ECB’s Monetary Policy: Past and Present. In Proceedings of the Speech at the Febelfin Connect event, Brussels/Londerzeel, Belgium, 16 March 2017; Available online: https://www.ecb.europa.eu/press/key/date/2017/html/sp170316.en.html (accessed on 5 June 2019).
- Allen, L. The determinants of bank interest margins: A note. J. Financ. Quant. Anal. 1988, 23, 231–235. [Google Scholar] [CrossRef]
- Angbazo, L. Commercial bank net interest margins, default risk, interest-rate risk and off-balance sheet banking. J. Bank. Financ. 1997, 21, 55–87. [Google Scholar] [CrossRef]
- Maudos, J.; De Guevara, J.F. Factors explaining the interest margin in the banking sectors of the European Union. J. Bank. Financ. 2004, 28, 2259–2281. [Google Scholar] [CrossRef] [Green Version]
- McShane, R.W.; Sharpe, I.G. A time series/cross section analysis of the determinants of Australian trading bank/loan deposits interest margin: 1962–1981. J. Bank. Financ. 1985, 9, 115–136. [Google Scholar] [CrossRef]
- Dingell, J. Letter to FRB and OCC Re: “Pay to Play” Practices. Available online: www.house.gov/commerce_democrats/press (accessed on 5 June 2019).
- Lepetit, L.; Nys, E.; Rous, P.; Tarazi, A. The expansion of services in European banking: Implications for loan pricing and interest margins. J. Bank. Financ. 2008, 32, 2325–2335. [Google Scholar] [CrossRef] [Green Version]
- Maudos, J.; Solís, L. The determinants of net interest income in the Mexican banking system: An integrated model. J. Bank. Financ. 2009, 33, 1920–1931. [Google Scholar] [CrossRef] [Green Version]
- Freixas, X.; Rochet, J.C. Microeconomics of Banking; Cambridge Massachusetts Institute of Technology: Cambridge, MA, USA, 2008. [Google Scholar]
- Carbó-Valverde, S.; Rodríguez-Fernández, F. The determinants of bank margins in European banking. J. Bank. Financ. 2007, 31, 2043–2063. [Google Scholar] [CrossRef]
- Barth, J.R.; Caprio, G.; Levine, R. Bank regulation and supervision in 180 countries from 1999 to 2011. J. Financ. Econ. Policy 2013, 5, 111–219. [Google Scholar] [CrossRef] [Green Version]
- Saunders, A.; Schumacher, L. The determinants of bank interest rate margins: An international study. J. Int. Money Financ. 2000, 19, 813–832. [Google Scholar] [CrossRef]
- Barth, J.R.; Caprio, G.; Levine, R. Bank regulation and supervision: What works best? J. Financ. Intermed. 2004, 13, 205–248. [Google Scholar] [CrossRef]
- Beck, T.; Demirgüç-Kunt, A.; Levine, R. Bank supervision and corruption in lending. J. Monet. Econ. 2006, 53, 2131–2163. [Google Scholar] [CrossRef] [Green Version]
- Carapella, F.; Di Giorgio, G. Deposit Insurance, Institutions, and Bank Interest Rates. Transit. Stud. Rev. 2004, 11, 77–92. [Google Scholar] [CrossRef] [Green Version]
- Gropp, R.; Vesala, J. Deposit Insurance and Moral Hazard: Does the Counterfactual Matter? ECB WP No. 47. Available online: https://ssrn.com/abstract=277949 (accessed on 5 June 2019).
- González, F. Bank regulation and risk-taking incentives: An international comparison of bank risk. J. Bank. Financ. 2005, 29, 1153–1184. [Google Scholar] [CrossRef]
- Laeven, L. Pricing Deposit Insurance. World Bank Policy Res. WP No. 2871. Available online: https://ssrn.com/abstract=636235 (accessed on 5 June 2019).
- Demirgüç-Kunt, A.; Detragiache, E. Does deposit insurance increase banking system stability? An empirical investigation. J. Monet. Econ. 2002, 49, 1373–1406. [Google Scholar] [CrossRef] [Green Version]
- Drakos, A.A.; Kouretas, G.; Tsoumas, C. Ownership, interest rates, and bank-risk taking in Central and Eastern European countries. Int. Rev. Financ. Anal. 2016, 45, 308–319. [Google Scholar] [CrossRef]
- Caglayan, M.; Xu, B. Sentiment volatility and bank lending behavior. Int. Rev. Financ. Anal. 2016, 45, 107–120. [Google Scholar] [CrossRef] [Green Version]
- Demirgüç-Kunt, A.; Detragiache, E.; Gupta, P. Inside the crisis: An empirical analysis of banking systems in distress. J. Int. Money Financ. 2006, 25, 702–718. [Google Scholar] [CrossRef] [Green Version]
- Kouretas, G.P.; Delis, M. Interest rates and bank risk-taking. J. Bank. Financ. 2011, 35, 840–855. [Google Scholar] [Green Version]
- Duprey, T.; Lé, M. Bankscope Dataset: Getting Started. Available online: https://ssrn.com/abstract=2191449 (accessed on 5 June 2019).
- Fernández, A.I.; González, F. How accounting and auditing systems can counteract risk-shifting of safety nets in banking: Some international evidence. J. Financ. Stab. 2005, 1, 466–500. [Google Scholar] [CrossRef]
- Pasiouras, F.; Gaganis, C.; Zopounidis, C. The impact of bank regulations, supervision, market structure, and bank characteristics on individual bank ratings: A cross-country analysis. Rev. Quant. Financ. Account. 2006, 27, 403–438. [Google Scholar] [CrossRef]
- Zarruk, E.R. Bank spread with uncertain deposit level and risk aversion. J. Bank. Financ. 1989, 13, 797–810. [Google Scholar] [CrossRef]
- Pulley, L.B.; Braunstein, Y.M. A composite cost function for multiproduct firms with an application to economies of scope in banking. Rev. Econ. Stat. 1992, 74, 221–230. [Google Scholar] [CrossRef]
- De Guevara, J.F.; Maudos, J.; Pérez, F. Market power in European banking sectors. J. Financ. Serv. Res. 2005, 27, 109–137. [Google Scholar] [CrossRef]
- Maudos, J.; Pérez, F. Competencia versus poder de mercado en la banca espanola. Moneda y Crédito 2003, 217, 139–166. [Google Scholar]
- Claessens, S.; Coleman, N.; Donnelly, M. Low-for-long interest rates and banks’ interest margins and profitability: Cross-country evidence. Int. Financ. Discuss. Pap. 2017, 2107, 1–39. [Google Scholar] [CrossRef]
- Laeven, L.; Levine, R. Bank governance, regulation and risk taking. J. Financ. Econ. 2009, 93, 259–275. [Google Scholar] [CrossRef] [Green Version]
- Barrell, R.; Davis, E.P.; Karim, D.; Liadze, I. Bank regulation, property prices and early warning systems for banking crises in OECD countries. J. Bank. Financ. 2010, 34, 2255–2264. [Google Scholar] [CrossRef] [Green Version]
- Zhang, X.; Li, F.; Li, Z.; Xu, Y. Macroprudential Policy, Credit Cycle, and Bank Risk-Taking. Sustainability 2019, 10, 3620. [Google Scholar] [CrossRef]
- Ghosh, A. Banking industry specific and regional economic determinants of non-performing loans: Evidence from US states. J. Financ. Stab. 2015, 20, 93–104. [Google Scholar] [CrossRef]
- Louizis, D.; Vouldis, A.; Metaxas, V. Macroeconomic and bank-specific determinants on non-performing loans in Greece: A comparative study of mortgage, business and consumer loan portfolios. J. Bank. Financ. 2012, 36, 1012–1027. [Google Scholar] [CrossRef]
- Nkusu, M. Nonperforming Loans and Macrofinancial Vulnerabilities in Advanced Economies; IMF WP: Washington DC, USA, 2011. [Google Scholar]
- Skarica, B. Determinants of non-performing loans in Central and Eastern European countries. Financ. Theory Pract. 2014, 38, 37–59. [Google Scholar] [CrossRef]
- Arellano, M.; Bover, O. Another look at the instrumental-variable estimation of error-components models. J. Econ. 1995, 68, 29–52. [Google Scholar] [CrossRef]
- Blundell, R.W.; Bond, S.R. Initial conditions and moment restrictions in dynamic panel data models. J. Econ. 1998, 87, 115–143. [Google Scholar] [CrossRef] [Green Version]
- Roodman, D. A note on the theme of too many instruments. Oxf. Bull. Econ. Stat. 2009, 71, 135–158. [Google Scholar] [CrossRef]
- Windmeijer, F. A finite sample correction for the variance of linear efficient two-step GMM estimators. J. Econ. 2005, 126, 25–51. [Google Scholar] [CrossRef]
- Brock, P.; Rojas, L. Understanding the behavior of bank spreads in Latin America. J. Dev. Econ. 2000, 63, 113–124. [Google Scholar] [CrossRef]
- Entrop, O.; Memmel, C.; Ruprecht, B.; Wilkens, M. Determinants of bank interest margin: Impact of maturity transformation. J. Bank. Financ. 2015, 54, 1–19. [Google Scholar] [CrossRef]
- Stiroh, K.J. Diversification and Banking: Is Noninterest Income the Answer? J. Money Credit Bank. 2004, 36, 853–882. [Google Scholar] [CrossRef]
Figure 1.
Evolution of net interest margin (Notes: The figure displays the trends of median values of net interest margins, disaggregated by bank size (panel (a)), specialization (panel (b)) and country (panel (c)) over the period 2008–2014). Banks with total assets over 10 billion Euros were considered as large banks. Geographical areas are grouped as follows: North includes Finland, the Netherlands and Ireland; East comprises Estonia, Latvia, Lithuania, Slovakia and Slovenia; Continental groups Austria, Belgium, France, Germany and Luxembourg; Mediterranean includes Italy, Spain, Portugal, Greece, Malta and Cyprus. Sources: Authors’ elaboration on BankScope data).

Table 1.
Expected signs in the regressions of net interest margin and loan growth.
| Variable Name | Basic Argument | Expected Impact |
|---|---|---|
| Bank-Level Characteristics | ||
| Lerner index | Banks with higher market power may set a wider spread | + |
| Capitalization | Well-capitalized might be more risk averse and charge higher prices | + |
| Operating costs | Banks operating with higher costs have to charge higher interest rates | + |
| Efficiency | Efficient management translates into a profitable composition of assets and a low-cost composition of liabilities which leads to higher margins | + |
| Non-traditional activity | Operating with low margins might represent cross-subsidized strategies for raising fee-based services | − |
| Size (ln of gross loans) | The risk premium applicable to the margin is proportional to the loan volume (+). Scale economies may reduce average costs and exert an opposite effect (−) | +/− |
| Loan loss reserves | The risk of non-payment or default on loan obliges banks to demand an implicit risk premium in the interest rates they charge | + |
| Loan loss reserves × σi | When credit risk and market risk are high, banks have to increase interest rate to compensate the high uncertainty. However, inadequate provisioning for loan losses by banks in periods of higher interest rates volatility may lead them to lower spreads and narrow down profitability. | +/− |
| Implicit interest payments | In order to cover additional services costs, banks might be forced to set higher prices | + |
| Reserves | Maintaining liquid reserves forces banks to sustain opportunity costs (+). Anyway, reserves represent a source of balance sheet stability (−) | +/− |
| Financial markets characteristics and interest rates | ||
| Money market interest rate | Increases in market rates might lead to a decline in lending and credit conditions. On the other hand, the higher deposits rates, the larger the margin needed to offset it | + |
| Interest rate risk σi | An increased volatility implies higher market risk, and therefore, a bigger interest margin to offset that risk | + |
| Yield curve slope | An increase in the yield curve slope implies a bigger difference between the interest rate on loans and that on deposits | + |
| Regulatory structure | ||
| Capital stringency | Stringent measures on regulatory capital may lead to a more prudent lending behavior, however banks may attempt to lower the cost of holding relatively more equity by demanding higher interest margins | +/− |
| Supervisory power | A greater supervisory power on banks’ activity reduces investments in risk assets and mitigates the risk of the overall banking system | + |
| Moral hazard | Schemes based on deposit insurance aimed at mitigating moral hazard issues may have a positive or negative effect on bank stability and profitability, depending on their impact on bank risk-taking | +/− |
| Country-level macroeconomic factors and banking system characteristics | ||
| GDP growth | In upturns, banks tend to expand their market share and increase business opportunities by decreasing interest rates | − |
| Unemployment | The uncertainty of the labour market leads to greater credit risk which translates into higher prices | + |
| Inflation | Inflation rates may affect roughly lending and loan pricing if borrowers’ real incomes are sticky | + |
| HHI | Herfindahl-Hirschman concentration index. (The same arguments of Lerner index are valid) | + |
| Branches | A high branch density indicates a higher level of financial development, but it may also capture spatial competition in the credit markets | +/− |
Notes: the symbols +, −, +/− represent respectively an expected positive, negative or a priori unclear impact on the dependent variables.
Table 2.
Average features by country.
| Country | Net Interest Margin (%) | Lerner Index | Short Term Interest Rate (%) | Yield Curve Slope (%) | Interest Rate Risk (%) | Capitalization (%) | Average Costs (%) | Efficiency (%) | Non-Traditional Activity | Size (ln Gross Loans) |
| Austria | 1.87 | 0.17 | 0.75 | 1.99 | 0.32 | 8.34 | 3.31 | 127.04 | 0.70 | 12.64 |
| Belgium | 1.66 | 0.19 | 0.74 | 2.39 | 0.32 | 7.84 | 3.18 | 134.30 | 1.05 | 14.15 |
| Cyprus | 2.71 | 0.20 | 0.72 | 5.01 | 0.31 | 7.85 | 8.62 | 132.49 | 0.22 | 14.10 |
| Estonia | 1.56 | 0.26 | 0.66 | 2.70 | 0.33 | 11.85 | 2.75 | 140.03 | 0.74 | 12.88 |
| Finland | 1.44 | 0.22 | 0.55 | 1.59 | 0.33 | 8.17 | 2.78 | 132.74 | 0.75 | 13.80 |
| France | 1.89 | 0.20 | 0.73 | 2.00 | 0.32 | 9.10 | 3.86 | 131.49 | 0.70 | 15.11 |
| Germany | 2.38 | 0.20 | 0.73 | 1.38 | 0.32 | 7.97 | 3.68 | 129.34 | 0.38 | 12.65 |
| Greece | 2.34 | 0.10 | 0.75 | 10.88 | 0.31 | 8.93 | 4.55 | 118.95 | 0.18 | 15.79 |
| Ireland | 1.32 | 0.41 | 0.60 | 4.48 | 0.32 | 17.61 | 2.51 | 190.06 | 1.32 | 15.97 |
| Italy | 2.29 | 0.22 | 0.74 | 3.69 | 0.32 | 10.73 | 3.40 | 135.26 | 0.37 | 12.79 |
| Latvia | 1.64 | 0.28 | 0.73 | 5.85 | 0.33 | 9.86 | 3.73 | 148.88 | 1.10 | 12.40 |
| Lithuania | 1.88 | 0.15 | 0.74 | 5.28 | 0.32 | 9.27 | 4.81 | 128.33 | 0.52 | 13.45 |
| Luxembourg | 0.94 | 0.27 | 0.72 | 1.80 | 0.32 | 8.14 | 2.82 | 138.47 | 2.44 | 13.26 |
| Malta | 1.99 | 0.09 | 0.71 | 3.15 | 0.32 | 12.38 | 2.81 | 151.90 | 0.44 | 12.62 |
| Netherlands | 1.36 | 0.04 | 0.75 | 1.76 | 0.32 | 10.33 | 3.49 | 127.14 | 0.03 | 14.37 |
| Portugal | 2.26 | 0.15 | 0.47 | 6.28 | 0.36 | 10.96 | 4.09 | 124.88 | 0.45 | 11.99 |
| Slovakia | 2.97 | 0.26 | 0.76 | 3.07 | 0.32 | 9.06 | 3.74 | 143.90 | 0.29 | 14.23 |
| Slovenia | 2.12 | 0.20 | 0.72 | 3.98 | 0.32 | 8.33 | 3.91 | 136.19 | 0.36 | 14.06 |
| Spain | 1.85 | 0.20 | 0.73 | 3.71 | 0.32 | 8.89 | 3.02 | 134.76 | 0.31 | 13.41 |
| Total | 2.23 | 0.20 | 0.73 | 2.19 | 0.32 | 8.71 | 3.60 | 130.98 | 0.47 | 12.91 |
| Country | Loan Loss Reserves (%) | Implicit Interest Payments (%) | Reserves (%) | Capital Stringency | Supervisory Power | Moral Hazard | GDP Growth | Unemployment | Inflation | Branches |
| Austria | 0.12 | 1.07 | 1.63 | 4.33 | 11.34 | 0.33 | 0.46 | 5.09 | 1.97 | 4307 |
| Belgium | 0.04 | 0.68 | 1.28 | 6.38 | 11.00 | 1.32 | 0.68 | 7.97 | 1.70 | 3870 |
| Cyprus | 6.03 | 1.22 | 6.29 | 8.66 | 11.34 | 1.00 | −1.76 | 10.74 | 1.03 | 808 |
| Estonia | 1.36 | 0.73 | 9.72 | 7.20 | 12.27 | 0.53 | 1.18 | 10.87 | 2.36 | 164 |
| Finland | 0.28 | 0.67 | 2.82 | 5.64 | 5.72 | 2.00 | −0.67 | 8.25 | 1.63 | 1335 |
| France | 1.88 | 0.79 | 1.97 | 8.00 | 9.52 | 2.00 | 0.47 | 9.68 | 1.17 | 38,217 |
| Germany | 0.39 | 1.36 | 1.98 | 7.68 | 10.04 | 2.00 | 0.89 | 5.97 | 1.33 | 37030 |
| Greece | 9.11 | 1.66 | 3.29 | 5.94 | 8.71 | 1.65 | −4.92 | 19.50 | 1.55 | 3587 |
| Ireland | 2.24 | −0.90 | 10.69 | 7.17 | 7.00 | 2.00 | 2.76 | 13.84 | 0.43 | 1064 |
| Italy | 2.71 | 1.16 | 0.91 | 5.48 | 11.05 | 2.00 | −1.27 | 10.02 | 1.60 | 32,752 |
| Latvia | 3.71 | 0.21 | 9.94 | 7.95 | 11.30 | 1.95 | −1.00 | 15.09 | 1.59 | 470 |
| Lithuania | 4.75 | 0.87 | 9.68 | 5.61 | 12.21 | 1.35 | 0.64 | 13.90 | 2.34 | 763 |
| Luxembourg | 0.08 | 0.13 | 3.95 | 7.00 | 12.03 | 1.00 | 2.06 | 5.26 | 1.85 | 224 |
| Malta | 0.98 | 0.86 | 3.34 | 6.71 | 12.57 | 1.14 | 3.12 | 6.42 | 1.74 | 110 |
| Netherlands | 0.86 | 0.61 | 8.67 | 7.33 | 10.73 | 0.33 | −0.05 | 5.79 | 1.80 | 2530 |
| Portugal | 4.65 | 1.36 | 1.26 | 4.59 | 12.23 | 2.12 | −1.28 | 14.79 | 0.98 | 6143 |
| Slovakia | 3.15 | 1.44 | 4.17 | 5.32 | 11.65 | 1.34 | 1.31 | 13.60 | 1.93 | 1179 |
| Slovenia | 8.61 | 0.78 | 5.00 | 6.68 | 14.00 | 0.32 | −1.09 | 8.41 | 1.51 | 666 |
| Spain | 1.43 | 0.93 | 1.09 | 8.34 | 10.20 | 1.00 | −1.29 | 22.43 | 1.37 | 38,581 |
| Total | 1.15 | 1.20 | 1.92 | 6.97 | 10.40 | 1.80 | 0.30 | 7.84 | 1.43 | 31,033 |
Notes: Averages across macro-regions. We report the descriptive statistics calculated on the estimation sample. Net interest margin, Loan loss reserves, Capitalization, Average costs, Implicit interest payments, Reserves are rescaled by total assets and expressed in percentage points. The Lerner index is a bank level measure of market power given by the difference between prices and marginal costs and it is rescaled by total assets. Interest rate risk is the standard deviation of three months interbank offered interest rate. Size is the natural logarithm of gross loans. Efficiency and Non-traditional activity are expressed in percentage points. Capital regulation, Supervisory power and Moral Hazard are categorical variables. GDP growth is the annual growth of gross domestic product. Inflation and Unemployment are expressed in percentage points. Branches is the total number of banks’ branches in a country. Sources: BankScope, Barth et al. [25], Eurostat and ECB.
Table 3.
Determinants of the net interest margin (dynamic models).
| Model (a) | Model (b) | Model (c) | Model (d) | |
|---|---|---|---|---|
| Net interest margint−1 | 0.4452 *** | 0.4250 *** | 0.4170 *** | 0.4089 *** |
| (0.0620) | (0.0767) | (0.0824) | (0.0983) | |
| Lerner index | 0.6199 *** | 0.5044 * | 0.6680 *** | 0.6445 *** |
| (0.2054) | (0.2588) | (0.2157) | (0.2476) | |
| Short term interest rate | 0.1917 *** | 0.1611 *** | 0.4433 *** | 0.3396 *** |
| (0.0302) | (0.0327) | (0.1383) | (0.1317) | |
| Short term interest rate2 | −0.1515 * | −0.1356 * | ||
| (0.0827) | (0.0764) | |||
| Yield curve slope | 0.0432 *** | 0.0689 *** | 0.1561 *** | 0.1699 *** |
| (0.0152) | (0.0191) | (0.0217) | (0.0334) | |
| Yield curve slope2 | −0.0070 *** | −0.0066 *** | ||
| (0.0011) | (0.0018) | |||
| Interest rate risk | −0.0187 | 0.2109 ** | 0.0114 | 0.2042 ** |
| (0.0141) | (0.0993) | (0.0302) | (0.0948) | |
| Capitalization | 0.0067 ** | 0.0067 ** | 0.0041 | 0.0057 * |
| (0.0028) | (0.0027) | (0.0031) | (0.0031) | |
| Average costs | 0.0517 ** | 0.0590 *** | 0.0581 *** | 0.0552 *** |
| (0.0244) | (0.0205) | (0.0204) | (0.0188) | |
| Efficiency | 0.0110 *** | 0.0127 *** | 0.0115 *** | 0.0120 *** |
| (0.0011) | (0.0012) | (0.0011) | (0.0010) | |
| Non-traditional activity | −0.0265 ** | −0.0352 ** | −0.0198 ** | −0.0240 *** |
| (0.0119) | (0.0151) | (0.0100) | (0.0089) | |
| Size | −0.0089 | −0.0063 | −0.0031 | −0.0054 |
| (0.0078) | (0.0056) | (0.0064) | (0.0058) | |
| Loan loss reserves | 0.0547 | 0.0690 ** | 0.0020 | 0.0393 ** |
| (0.0387) | (0.0292) | (0.0063) | (0.0160) | |
| Loan loss reserves × interest rate risk | −0.1461 ** | −0.1149 ** | ||
| (0.0629) | (0.0535) | |||
| Implicit interest payments | 0.4209 *** | 0.4116 *** | 0.4656 *** | 0.4582 *** |
| (0.0610) | (0.0634) | (0.0597) | (0.0780) | |
| Reserves | −0.0022 | −0.0016 | −0.0029 | −0.0024 |
| (0.0021) | (0.0021) | (0.0024) | (0.0022) | |
| Cooperative banks | 0.0826 *** | 0.0807 *** | 0.0580 ** | 0.0622 ** |
| (0.0262) | (0.0267) | (0.0263) | (0.0275) | |
| Savings banks | 0.0932 *** | 0.0862 *** | 0.0662 ** | 0.0723 ** |
| (0.0314) | (0.0275) | (0.0273) | (0.0282) | |
| Capital stringency | 0.0577 *** | 0.0499 *** | 0.0563 *** | 0.0662 *** |
| (0.0165) | (0.0103) | (0.0082) | (0.0125) | |
| Supervisory power | −0.0155 | −0.0106 * | −0.0180 *** | −0.0198 *** |
| (0.0121) | (0.0061) | (0.0046) | (0.0064) | |
| Moral hazard | −0.0963 ** | −0.0926 *** | −0.0836 *** | −0.0987 *** |
| (0.0439) | (0.0289) | (0.0181) | (0.0247) | |
| GDP growth | −0.0296 *** | −0.0173 * | −0.0226 *** | −0.0152 * |
| (0.0066) | (0.0091) | (0.0074) | (0.0091) | |
| Unemployment | −0.0293 *** | −0.0276 *** | −0.0331 *** | −0.0347 *** |
| (0.0094) | (0.0057) | (0.0043) | (0.0058) | |
| Inflation | −0.0565 *** | −0.0530 *** | −0.1128 *** | −0.0990 *** |
| (0.0168) | (0.0199) | (0.0244) | (0.0273) | |
| Branches | 0.0040 *** | 0.0053 *** | 0.0035 *** | 0.0044 *** |
| (0.0013) | (0.0014) | (0.0011) | (0.0013) | |
| Intercept | −1.2201 *** | −1.5780 *** | −1.3591 *** | −1.5132 *** |
| (0.2962) | (0.2173) | (0.2108) | (0.1776) | |
| Time fixed effects | Yes [0.000] | Yes [0.001] | Yes [0.000] | Yes [0.003] |
| Arellano-Bond test for AR(1) in first differences (p-value) | 0.0846 | 0.0598 | 0.0948 | 0.0745 |
| Arellano-Bond test for AR(2) in first differences (p-value) | 0.3121 | 0.2771 | 0.3156 | 0.2878 |
| Hansen test of overid. Restrictions (p-value) | 0.2204 | 0.6360 | 0.3659 | 0.4073 |
| Number of observations | 15822 | 15822 | 15822 | 15822 |
Notes: The dependent variable is the ratio of net interest income to total assets. System GMM two-step estimates are presented together with the corresponding robust standard errors (in parentheses). The p-values of time fixed effects are reported in square brackets. The p-values of the Arellano-Bond tests for first and second order serial correlation and of the Hansen test for overidentifying restrictions are reported at the bottom of the table. *, **, *** denote significance at 1, 5, 10%, respectively.
© 2019 by the authors. Licensee MDPI, Basel, Switzerland. This article is an open access article distributed under the terms and conditions of the Creative Commons Attribution (CC BY) license (http://creativecommons.org/licenses/by/4.0/).
Share and Cite
MDPI and ACS Style
Angori, G.; Aristei, D.; Gallo, M. Determinants of Banks’ Net Interest Margin: Evidence from the Euro Area during the Crisis and Post-Crisis Period. Sustainability 2019, 11, 3785. https://0-doi-org.brum.beds.ac.uk/10.3390/su11143785
AMA Style
Angori G, Aristei D, Gallo M. Determinants of Banks’ Net Interest Margin: Evidence from the Euro Area during the Crisis and Post-Crisis Period. Sustainability. 2019; 11(14):3785. https://0-doi-org.brum.beds.ac.uk/10.3390/su11143785
Chicago/Turabian StyleAngori, Gabriele, David Aristei, and Manuela Gallo. 2019. "Determinants of Banks’ Net Interest Margin: Evidence from the Euro Area during the Crisis and Post-Crisis Period" Sustainability 11, no. 14: 3785. https://0-doi-org.brum.beds.ac.uk/10.3390/su11143785
Note that from the first issue of 2016, this journal uses article numbers instead of page numbers. See further details here.