Environmental vs. Social Responsibility in the Firm. Evidence from Italy


1
Department of Law, Economics, Policy and Modern Languages, LUMSA University, Via Pompeo Magno 22, 00192 Rome, Italy
2
Unioncamere, Italian Union of the Chambers of Commerce, Via Nerva 1, 00187 Rome, Italy
*
Author to whom correspondence should be addressed.
Sustainability 2019, 11(16), 4277; https://0-doi-org.brum.beds.ac.uk/10.3390/su11164277
Submission received: 30 June 2019
/
Revised: 28 July 2019
/
Accepted: 5 August 2019
/
Published: 7 August 2019
(This article belongs to the Special Issue Entrepreneurship, Finance and Sustainability)
Abstract
:Sustainable behavior should necessarily benefit both the environment and society. However, we cannot take for granted that socially responsible firms are also environmentally responsible—e.g., a firm might benefit its stakeholders while degrading the environment—and the reverse applies too—e.g., an environmentally responsible firm might disrespect its employees. Consequently, our purpose is checking whether social responsibility and green investments—proxying for a firm’s environmental responsibility—are complements, substitutes, or unrelated choices. Using a representative sample of Italian manufacturing firms, our econometric estimates uncover the empirical relationship between social responsibility and green investments at firm level. We find evidence of complementarity, since socially responsible firms: (i) Are systematically more likely to make green investments; (ii) identify green investments as a voluntary choice promoting business competitiveness much more than other firms. Finding complementarity between social and environmental responsibility has important implications. Policies favoring the transition to sustainable development should adopt a systemic approach considering the positive spillovers of Corporate Social Responsibility (CSR) on environmental responsibility. Our evidence also suggests that firms indeed tend to behave in ways consistent with the holistic approach of the 2030 UN Agenda for sustainable development. Additional research should study how governance affects the CSR–environmental responsibility nexus.
1. Introduction
A major innovation changed the landscape for sustainable development in 2015. The method of the Millennium Development Goals (MDGs) was updated by the 17 Sustainable Development Goals of the 2030 UN Agenda enshrining a more holistic and measurable approach. That innovation enhanced the sustainability discourse throughout society, and this may be affecting firms as well, involving the concept of Sustainable Entrepreneurship [1]. However, do firms have the right incentives to engage in the holistic approach? Namely, the spontaneous question is whether the two dimensions of environmental and social sustainability are friends or foes inside a firm.
We have adopted the definition of Corporate Social Responsibility (CSR) distinguished from Corporate Environmental Responsibility (CER), as proposed by World Business Council for Sustainable Development (WBCSD) [2,3]. Separating CSR from CER is consistent also with the extensive contents analysis of the most widely used definitions of CSR conducted by Dahlsrud [4]. Considering the five potential dimensions of CSR—Economic, Environmental, Social, Stakeholder, Voluntariness—Dahlsrud found that while the Social and Stakeholder dimensions dominate (88% in the weighted dimension ratio), almost matched by the Economic dimension (86%) and followed closely by Voluntariness (80%), the Environmental dimension is far detached (only 59%). Thus, CSR and CER overlap only partly, suggesting that it makes sense to study the relationship between social responsibility and environmental responsibility.
Indeed, the relationship between CSR and environmental responsibility remains unclear. Most authors focus on large firms where environmental responsibility may be due to regulations and CSR compliance may also be required by formal reporting. Instead, small firms might pursue socially and environmentally responsible behavior in informal ways, which go unreported [5,6,7,8]. Moreover, CSR is often measured through a binary variable (e.g., Cuerva et al. [9], Kesidou and Demirel [10]), disregarding how a firm’s CSR intensity may affect its environmental policy too. Finally, studies on the relationship between environmental responsibility and CSR seem to be entirely missing for Italy.
Thus, it is important to establish whether the two dimensions of CSR and environmental responsibility are unrelated, move together (complements), or counter each other (substitutes). Both academic works and professional reports suggest that the issue is non-trivial. Among the former, Qiu et al. [11] found that social disclosures raise a company’s market value, while there is no relation between environmental disclosures and profitability. In turn, Cormier et al. [12] suggested that social disclosure and environmental disclosure substitute each other in reducing stock market asymmetry, as proxied by share price volatility. On their part, Michelon et al. [13] showed that corporate performance responds to various social responsibility variables—e.g., diversity, employee relations, and human rights—while it does not respond to environmental responsibility (Lys et al. [14] reached analogous results). Additionally, some professional reports found social and environmental responsibility to be rather asymmetric at times. For instance, Lubin and Berlinger [15] broke down the ESG (Environmental, Social, Governance) rating into its three components’ scores at 13 large U.S. companies and showed nine cases with low social score but high environmental score (Altria Group of Richmond, VA; News Corp of New York, NY; Oracle of Redwood City, CA; Pfizer of New York, NY; Reynolds American Inc. of Winston-Salem, NC; Skechers USA Inc. of Manhattan Beach, CA; The Bank of New York Mellon Corporation of New York, NY; Walmart of Bentonville, AR; Wells Fargo & Co. of San Francisco, CA) and one case with high social score but low environmental score (Chesapeake Energy Corporation of Oklahoma City, OK). Nevertheless, it is unclear how far this evidence may be generalized.
A better understanding of the relationship between social responsibility and environmental responsibility is desirable on at least two grounds. First, sustainability aware consumers and investors care that both dimensions—environmental and social—of sustainable corporate behavior are complied with. However, if the two dimensions are unrelated that increases the extent of asymmetric information against a company’s attempts at green-washing or social-washing, potentially damaging consumers’ trust in the company [16]. Asymmetric information drops instead if consumers know that the two dimensions are related. If they are complements (substitutes)—social and environmental responsibility rise (fall) together (a rise/fall in the former is associated with a fall/rise in the latter)—by observing that one of the two is improving, consumers can expect that the other is also improving (is instead deteriorating). Consumers and investors may then respond through their own activism. Second, pro-social and pro-environmental policies should be calibrated differently depending on whether social and environmental responsibility are complements, substitutes, or unrelated.
Accordingly, the chief aim of this paper is to shed light on the relationship between the two key dimensions—social and environmental responsibility—of corporate sustainability to help fill the gap in the literature. Namely, using data from a 2018 representative survey of Italian manufacturing firms, our econometric specifications checked whether firms with a high social responsibility score were also more likely to make green investments, thereby being environmentally responsible too. Our findings strongly support that hypothesis. Moreover, the view of social and environmental responsibility being complements was further corroborated by our robustness checks. First, we show that the positive relationship between the two dimensions of corporate sustainability survives when we tackle the potential endogeneity between the two by means of appropriate instrumental variables. Second, we reveal that socially responsible firms identify green investments as a voluntary choice promoting business competitiveness much more than other firms.
The rest of the paper is structured as follows. Section 2 covers the review of the literature and states our research hypotheses. Section 3 describes the data employed in our empirical analysis and our econometric methodology. Section 4 reports our main results, verifies whether they survive some robustness checks, and identifies the channels through which CSR intensity feeds green investments. Section 5 discusses the results obtained and their policy implications. Finally, Section 6 concludes suggesting new avenues for future research.
2. Literature Review and Research Hypotheses
Given our aim of investigating how CSR intensity relates to green investments, we start by reviewing the literature on the multiple determinants of green investments. Next, we focus on the contributions that are closer to our research question. Finally, the literature review ends by stating our research hypotheses.
Many scholars have studied the determinants of green investments (for a review see de Jesus Pacheco et al. [17]), identifying the main factors affecting green investments in: (i) Technology push, (ii) market pull, and push–pull effects by either consumers, or (iii) regulation [9,10,18,19,20,21,22]. Furthermore, the issue of incomplete information is evident across the literature as well.
Regarding the technology push, knowledge resources, capabilities, and human skills are seen as important drivers of green investments [9,20,23]. In particular, the “availability of greater technical knowledge within a firm moderates its vulnerability in the face of the demand of new environmental regulations” (Canon de Francia et al. [24], p. 307), while improving technological capabilities via R&D boosts green investments [9,18,21,22,25,26]. Nevertheless, some scholars have found negative effects produced by technology push factors [27,28,29]. In turn, organizational capabilities can also drive green investments [30,31,32] by increasing the resources dedicated to green investment activities [10,33]. For example, a firm endowed with an Environmental Management System (EMS) bolsters its organizational capabilities [25,34]. EMS implementation is found to augment green investments [22,26,35,36,37,38,39]. In particular, EMS contributes to overcoming incomplete information, organization, and coordination problems by enabling firms to appreciate the potential of green investments [18]. Nevertheless, a firm’s green certification per se does not appear to drive green investments [40,41,42,43]. This suggests that moving from a marketing-oriented “green washing” to true green investments demands profound adherence within a firm.
Market pull factors link consumers’ and firms’ behavior. Firms increasingly face market shifts as consumers grow sensitive to the environmental impact of production [44]. Customers’ demand of environmentally friendly products promotes a firm’s green investments [10,18,25,34,45,46,47], through which the firm shows commitment to “green values” [10,46,48], improving its reputation [19,49,50]. Indeed, consumers prefer goods produced in a responsible manner [9].
Green investments also relate to incomplete information and regulation. Namely, following Porter’s hypothesis [51], since a firm may fail to recognize all the potential of green investments, environmental regulation can “force” it to invest in the green area [25]. This is supported by the positive relationship between environmental regulation and green investments [25,37,45,52,53,54]. However, some scholars have found a negative nexus, arguing that the opportunity cost of environmental regulations outweighs the respective benefits [55,56]. Specifically, some studies distinguish between the “carrot” and the “stick”, whereby the effectiveness of environmental regulation varies depending on whether it takes the form of positive incentives or of negative sanctions [57,58,59].
All these aspects seem strictly related to the CSR literature showing that, to maximize the legitimacy of their business, firms tend to align their practices with society’s expectations [60,61], by strengthening also the “green image” of the firm [46,48].
However, the relationship between CSR and green investments is still unclear because several other elements (e.g., labor relations, fair trade, and human rights) contribute to shaping the corporate image. In this respect, the demand for environmentally sustainable production may stimulate only minimum activity of green investments to show the commitment with a green strategy, without increasing the overall level of investment [46,48,62]. For UK firms, see Kesidou and Demirel [10]. Moreover, Cuerva et al. [9] found that CSR boosts conventional innovation but not green investments at Spanish firms. Finally, for Wagner [63], CSR augments green investment at large firms, but this does not extend to small firms.
Indeed, CSR is a broad concept along Bowen’s seminal idea that entrepreneurs should “pursue those policies, to make those decisions, or to follow those lines of action which are desirable in terms of the objectives and values of our society” (Bowen [64], p. 6). Among others (for a review see Garriga and Melé [65]), the stakeholder theory [66] is one of the dominant paradigms of CSR [67] (p. 118): Managers “bear a fiduciary relationship to stakeholder” (Freeman [68], p. 39) instead of only maximizing shareholders’ wealth, since meeting shareholders’ needs is only one element in a value-adding process [66,69].
As mentioned previously, our preferred definition of CSR is that proposed by WBCSD [2,3], which includes four dimensions: Stakeholder, Social, Voluntariness, and Economic. In line with the role of Stakeholder, Social, and Voluntariness, relationality is key behind social capital in Italy [70,71,72]. Moreover, relational capital also links to the concept of territorial capital along the milieux innovateur theory [73,74,75,76]. This also matters for CSR, because an element of the milieux innovateur is proximity based on social and moral shared behavioral models, trust etc. [77]. Indeed, in identifying the assets behind territorial capital, OECD [78] also includes social aspects such as solidarity and mutual assistance. Accordingly, a strong link emerges between relationships within the local community and dissemination of CSR behaviors [79]. Some scholars analyze the role of stakeholders in green investments activities [38,39,80,81], while Wagner [34] highlights that the relationship with environmentally concerned stakeholders expands a firm’s product green investments.
In all, the literature has not reached a clear-cut decision on whether CSR and green investments are complements, substitutes, or simply unrelated. Shedding light on that issue is the main task of this paper. Specifically, we can formulate two research hypotheses:
H.1.
More intense CSR makes green investment more likely at firm level.
H.2.
The positive nexus between CSR intensity and green investment is not driven by endogeneity.
3. Materials and Methods
Our data comes from a survey carried out by Unioncamere (Italian Union of Chambers of Commerce) in early 2018 on a sample of 3000 Italian manufacturing firms with at least five employees. The survey was administered through the CATI (Computer-Assisted Telephone Interviewing) method by a professional contractor with the aim of gathering both qualitative and quantitative information on the firm. The sample corresponded to around 2% of the total population. Specifically, sampling was based on proper stratification to ensure the representativeness of the collected data both ex-ante and ex-post. The stratification considered three dimensions of the firm: (i) Industry (24 divisions of the section C manufacturing sector of the Nace rev.2 classification); (ii) size class in terms of employees (6–9, 10–19, 20–49, 50 and above); (iii) geographical location (North-West, North-East; Center; South). The maximum sampling error was ±1.8%, the confidence interval was 95%.
The data reported information on a firm’s innovation, green investments and other specific issues (environmental management system, etc.), internationalization, economic performance, expectations, and workforce characteristics. A specific section addressed a firm’s relationship with stakeholders and its link with the territorial community.
Table 1 describes the variables used in our analysis. Several indicators help guarantee a firm’s green commitment (for a review see Horbach [25]) along the various definitions of green investments. However, many scholars have focused on product and process green investments (e.g., Cuerva et al. [9]) along one of the most popular definitions of green investments: “Develop new ideas, behavior, products and processes, apply or introduce them and which contribute to a reduction of environmental burdens or to ecologically specified sustainability targets” (Rennings [19], p. 322, see also Beise and Rennings [82]). Thus, our variable (green) took the value of 1 if a firm invested in environmentally responsible products or processes (energy efficiency; emissions, raw materials, and waste reduction; recycling).
Consistent with the definition of CSR in WBCSD [2,3] and focusing on the stakeholder theory (see Freeman [66]), managers are driven by the relationship with all stakeholders: Both internal, e.g., employees [83], and external [84], like suppliers, customers, etc., involving also civil and social businesses. Therefore, we measured a firm’s CSR intensity across its relationship with internal and external stakeholders. Specifically, we considered six actors with which the firm can relate: (i) Employees; (ii) Other firms, universities and research centers; (iii) Institutions; (iv) Banks and trade associations; (v) NGOs; (vi) Consumers. Thus, we had at firm level a dummy variable for each of these types of relationships. Finally, firm level CSR intensity was valued as the average of the six dummies, hence obtaining an index (CSR) ranging from 0 to 1.
CSR strictly links with a firm’s relationships within its local community [79]—indeed, the concept of sustainable entrepreneurship also includes the community factor [1]. Therefore, we included another dummy variable (Territory), valued 1 if the firm declared having strong links with the actors present in the community where it operates.
Concerning the other independent variables, with regard to technology push factors, R&D is the indicator most widely used (more recently, e.g., Saez-Martinez [21]). Hence, we included a dummy variable (R&D) valued 1 if the firm invested in R&D. Since human capital is key for green investments [9,23], being also able to generate absorptive capacity beside R&D efforts [25,44,85], we included two variables: The share of employees with a university degree (HC) and a dummy variable valued 1 if the firm carried out training courses (Training). We identified the firms having an Environmental Management System (EMS) as those endowed with certifications ISO 14001, EMAS (in line with other studies: Rehfeld et al. [26], Muscio [22]), and/or ISO 50001, where the latter “enhance the adoption of green innovation regarding the true barriers to the practices involved in the certification and implementation of an EMS and related systems” (Cuerva et al. [9], p. 106).
According to Porter and van der Linde [51], organizational problems may limit green investments, also because they require management commitment, team-work, and process mapping [37]. We controlled for this with a dummy variable (Organizational innov), valued 1 for any firm which has introduced organizational innovations. We also included a dummy variable (Product innov) valued 1 if the firm introduced product innovations, since firms with high innovation propensity are more likely to invest in the green field too [18,25,44]. To capture the impact of the opening of new markets on green investments [9], we created a dummy variable (Marketing activities) valued 1 for firms investing in marketing, including foreign commercial investments. Access to finance is also important for green investments [23] because of the risk from the uncertainty of customer demand response [86]. In the case of for-profit social firms, they tend to have lower leverage [87]. Therefore, we created a dummy variable (Credit) equal to 1 if the firm stated having problems of credit access.
We also accounted for a firm’s performance considering the relationship between innovation and business cycles [86,87,88,89,90]. Regarding green innovation, Horbach [25] analyzed both past performances and expected trends. Thus, we included two dummy variables valued 1 if the firm reported a good economic situation for its business (Business situation) and if the firm expected a good economic situation in the next three years (Business expectations), respectively. To account for the fact that labels of origin are connected to the environmental sustainability issue too [91,92], we included a variable (Local production) taking the value 1 if the firm produced goods strongly linked to local production.
Finally, we controlled for several firms’ structural characteristics: Age—years since inception; Size—number of employees; Sector—following Eurostat’s classification of technology intensive sectors, we distinguished the firms with high or medium-high technology intensity in line with previous studies [20]; and Geographical location—three area-fixed effects (North-East, Center, and South). Summary statistics are reported in Appendix A (Table A1).
Concerning the method, our dependent variable took the value 1 if the firm made green investments. Since it is binary, taking only values 1 and 0, we used probit models overcoming the disadvantages of the linear probability models for this case [93,94]. Analytically:
where Yi represents the probability that firm i carried out green investments. The independent variables are CSRi, indicating a firm’s CSR degree ranging from 0 to 1, and Si, which is a vector including the other independent variables. All variables are binary except CSR, HC, Age, and Size. Φ is a standard normal cumulative distribution function, taking only values strictly between zero and one for all values of the parameters and the independent variables. Thus, this ensures that the estimated response probabilities are between zero and one 0 < Φ(z) < 1. Finally, εi is the normally distributed random error with zero mean and constant variance N(0, σ2) that captures any other unknown factor.
P(Yi = 1|CSRi, Si) = P(β0 + β1CSRi + β2Si + εi > 0) = Φ (β0 + β1CSRi + β2Si + εi),
To quantify the effects on the probability success P(Y = 1), we also calculated the marginal effects; they indicated “the effect on conditional mean of Y of a change in one regressor, say, xj” (Cameron and Trivedi [95], p. 343). Stata version 15 was used for all the estimates.
As a further analysis, we checked for the presence of potential endogeneity problems between the dependent variable and CSR intensity, the key independent variable of our analysis. Following the literature, we applied the method of instrumental variables (IV). Specifically, in the presence of a continuous endogenous variable, we estimated a Linear Probability Model by 2SLS [93]. We analyzed the potential endogeneity of a firm’s CSR intensity by finding a set of instrumental variables affecting CSR without influencing the choice to invest in environmental sustainability, so that the instrumental variables were uncorrelated with the residuals of our equation.
We considered four instruments. The first concerned family ownership (Family), where family firms are more likely to pursue CSR behavior relating to stakeholders [96,97,98], also to protect and enhance their image and reputation. The latter represented a sort of “positive moral capital” (a reserve of “goodwill”) which acts as social insurance safeguarding the firm’s assets (relational wealth and earnings streams) during a period of crisis [99]. This is particularly true for family firms, where the firm’s wealth and reputation and those of the family greatly overlap. The other instruments concerned social capital. Our idea was that a set-up with a high level of social capital may boost the propensity of a firm to pursue CSR behavior. Following Guiso et al. [100], we used, as measures of social capital, the electoral participation in referenda (Social capital 1) and voluntary blood donations considering the blood donors per 1000 inhabitants (Social capital 2). Finally, the fourth instrument was the number of Banche di Credito Cooperativo (BCCs) in 1936 taken as a ratio of the contemporary province population (Cooperative banks in 1936). BCCs, which were then mostly called Casse Rurali ed Artigiane (Rural and Artisan Banks), were banks which were introduced to Italy to adapt to the Raiffeisen banking principles of self-help in the rurality and in the small villages. Given their cooperative nature and the fact that in many cases they were established as unlimited liability cooperative banks, we expected that their more widespread presence would reveal higher social capital in the province as well (see, e.g., Galassi [101], Catturani et al. [102]).
Using the Two Stage Least Squares (2SLS) estimator, the IV approach is modeled as follows. Starting from the structural equation,
Yi = β0 + β1CSRi + β2Si + ui.
We considered a set of instrumental variables Zi correlated with the potentially endogenous explanatory variable (CSR), but uncorrelated with the stochastic error u in the regression (Equation (2)). The effects of the instruments on the endogenous variable are measured by the vector of parameters β21 in the auxiliary regression (first-stage):
where CSR is the potentially endogenous explanatory variable in Equation (2), Zi is the vector of instrumental variables, and v is the residual.
CSRi = β0 + β21Zi + β22Si + vi,
After estimating the first-stage regression (Equation (2)), in the second-stage equation, CSR is replaced by its estimated value in Equation (3). To test if CSR is endogenous, we used the Wu–Hausman test: If it is significant, we reject the null hypothesis that the variable is exogenous. Concerning the validity of the instruments, we checked: (i) If they are correlated with the endogenous variable (instruments relevance); (ii) if they are exogenous, namely uncorrelated with the structural error term u in the regression (Equation (2)) (instruments’ exogeneity). Regarding the instruments’ relevance, we used an F-test for the joint significance of the instruments’ coefficients: A value above 10 means that the instruments are not weak [103]. Regarding instruments’ exogeneity, we performed an overidentification restriction check applying the Sargan test: An insignificant value means that we do not reject the null hypothesis that the instruments are exogenous.
We also applied an IV-probit based on maximum likelihood estimation since it has various advantages over the two-step procedures (see Wooldridge [93], p. 591), besides considering the limits of the linear probability model since it does not take into account that the dependent variable is binary.
4. Results
4.1. Baseline Results
Table 2 displays the baseline results relating to our hypothesis H.1. We found that CSR positively affects the likelihood of investing in environmental sustainability (p < 0.01; Model 1). This finding is in line with Kesidou and Demirel [10] but in contrast to Cuerva et al. [9], who found no significant effect. The positive influence of CSR was also confirmed in Model 2 when we introduced the variable regarding the relationship with the local community (Territory): The coefficient of CSR remains significant at the 1% level. Concerning Territory, we found that firms having a strong relationship with the community are 4.2% more likely to make Green investments (p < 0.1). Although CSR influences Green investments regardless of the degree of relationship with the local community, we found also an almost significant positive effect at 10% (p = 0.109, Model 3) of CSR interacted with Territory (CSR*Territory). Therefore, our findings confirm, in part, the insights about the close link between social themes and the relationship with the local community [79].
Concerning technology push factors, in contrast to various authors (recently, e.g., Muscio et al. [22]), we found no effect from R&D. This may be due to two facts: Since our variable is binary, it did not capture the intensity of the phenomenon; it did not specify the typology of R&D investments (for green vs other purposes). Human capital proved to be a driver of green investments in line with Cuerva et al. [9] and Horbach [25]: The marginal effects of the share of graduated employees (HC) were positive and statistically significant at the 1% level. Furthermore, skills improvement (Training) raised the probability of making green investments (p < 0.05).
Furthermore, organizational innovation increased the probability of Green investments (p < 0.01), which may be explained by the fact that human capital upgrading may also require new business organization for green investing. Indeed, we also found that the introduction of an Environmental Management System (EMS) had a positive and significant (p < 0.01) impact on Green investments. As for finance, the problem of access to credit limited the choice of green investing confirming the findings obtained by Cuerva et al. [9]. However, for the more socially responsible firms, financial resources may also be supplied by crowdfunding activities due to the existence of a positive relationship between a firm’s sustainable orientation and funding success of crowdfunding projects [104].
Moreover, marketing activities and product innovation raised the probability of Green investments by about 10 and 14%, respectively (Model 1). This suggests that Green investments and enhancing market competitiveness are strictly related since customers pay special attention to sustainability issues. Contrary to Cuerva et al. [9], we found that the geographical indication (Local production) positively affects the probability of green investing, albeit with a weak level of significance (p < 0.10).
Regarding the business cycle, firms declaring a good economic situation were more likely to invest in environmental sustainability: The effect of Business situation was positive and significant at the 1% level. Instead, contrary to Horbach [25], Business expectations ed out to be insignificant, possibly because investments require financial resources, whose availability is more affected by the current and past situation than by the expected one.
Among the control variables related to a firm’s characteristics, there were two significant results. First, older firms were more likely to make Green investments: The coefficient of Age was positive and significant at the 1% level. Second, firms located in the Center were more likely to make green investments than the ones located in the North-West (reference category). A firm’s Size did not seem to impact Green investments, in contrast to the results yielded by Cuerva et al. [9], Horbach [18], and Kesidou and Demirel [10] but in line with those of Sàez-Martinez et al. [21].
4.2. Robustness Checks
We conducted three different analyses to verify the validity of our results and address our second hypothesis H.2. First, we needed to deal with the potential endogeneity of the relationship between CSR and Green Investments. In practice, that relationship might be spurious, if a third omitted variable were, in reality, to determine both CSR and Green Investments. The preferred way to address that issue is by using the instrumental variables approach. Accounting for the endogeneity problem, the effect of CSR on Green investments always remained positive and significant at the 1% level (Table 3, Model 2).
The exogeneity Wald test on IV-probit as well as the Wu–Hausmann test on IV-2SLS were both significant at the 1% level, indicating that CSR is an endogenous variable. Concerning the validity of the instruments, since the F statistic for the instruments’ relevance was over 10, the instruments are not weak. More specifically, based on Stock and Yogo’s [105] tabulation of the critical values for the weak instruments test, we rejected the null of a relative bias greater than 5%. The Sargan test was not significant, so we can consider the instruments to be exogenous.
The other variables that confirmed significance (at least at the 5% level) in the IV estimates were Credit, EMS, Product innovation, Business situation and Age.
For the second robustness check, we used the Bootstrap method (500 replications) which provides more precise standard errors. We applied this check on the Ordinary Least Squares (OLS) estimate (Table 3, Model 4). The results confirmed the positive relationship between CSR and Green investments, as well as all significant effects which referred to other explanatory variables. The standard errors changed very little.
Finally, we explored whether the motivations for making Green investments differ for low- vs high-CSR intensity firms. The opportunity was given by the fact that the survey questionnaire asked responding firms to report the main motivations for their Green investments. At one extreme, firms could report that Green investments had to be made because they were imposed by regulations (Green rules), like a forced action. At the opposite extreme, firms could instead report that they were making Green investments because this is a source promoting their competitiveness (Green competitiveness), a voluntary action. Specifically, Green rules refers to firms that carried out Green investments in response to National and European regulations (see Question E2 in Appendix B, answer 1), while Green competitiveness includes all the firms that carried out Green investments to enhance their competitive edge, their image, or their reputation, or because they were aware of the problem of environmental pollution as a risk for the firm and the whole society (see Question E2 in Appendix B, answer 2).
Interestingly, when we estimated the two probit models where the dependent variables were, respectively, Green rules and Green competitiveness, it turned out that CSR leaned disproportionately towards Green competitiveness (Table 4). Specifically, the same increase of CSR raised the likelihood that a firm would opt for Green competitiveness almost ten times as much as it raised the probability that a firm would choose Green rules (we also found this difference instrumenting CSR using the IV-probit). We interpreted this as an additional suggestion that the positive relationship between CSR and Green investments is germane and not spurious.
5. Discussion
Our main results provided support to the two hypotheses formulated at the end of Section 2. Namely, the probability of a firm making green investments increases in the CSR intensity of that firm and such a relationship does not seem to be spurious. The first result emerged from both OLS and probit regressions. The second result was obtained by various alternative estimates performing robustness checks.
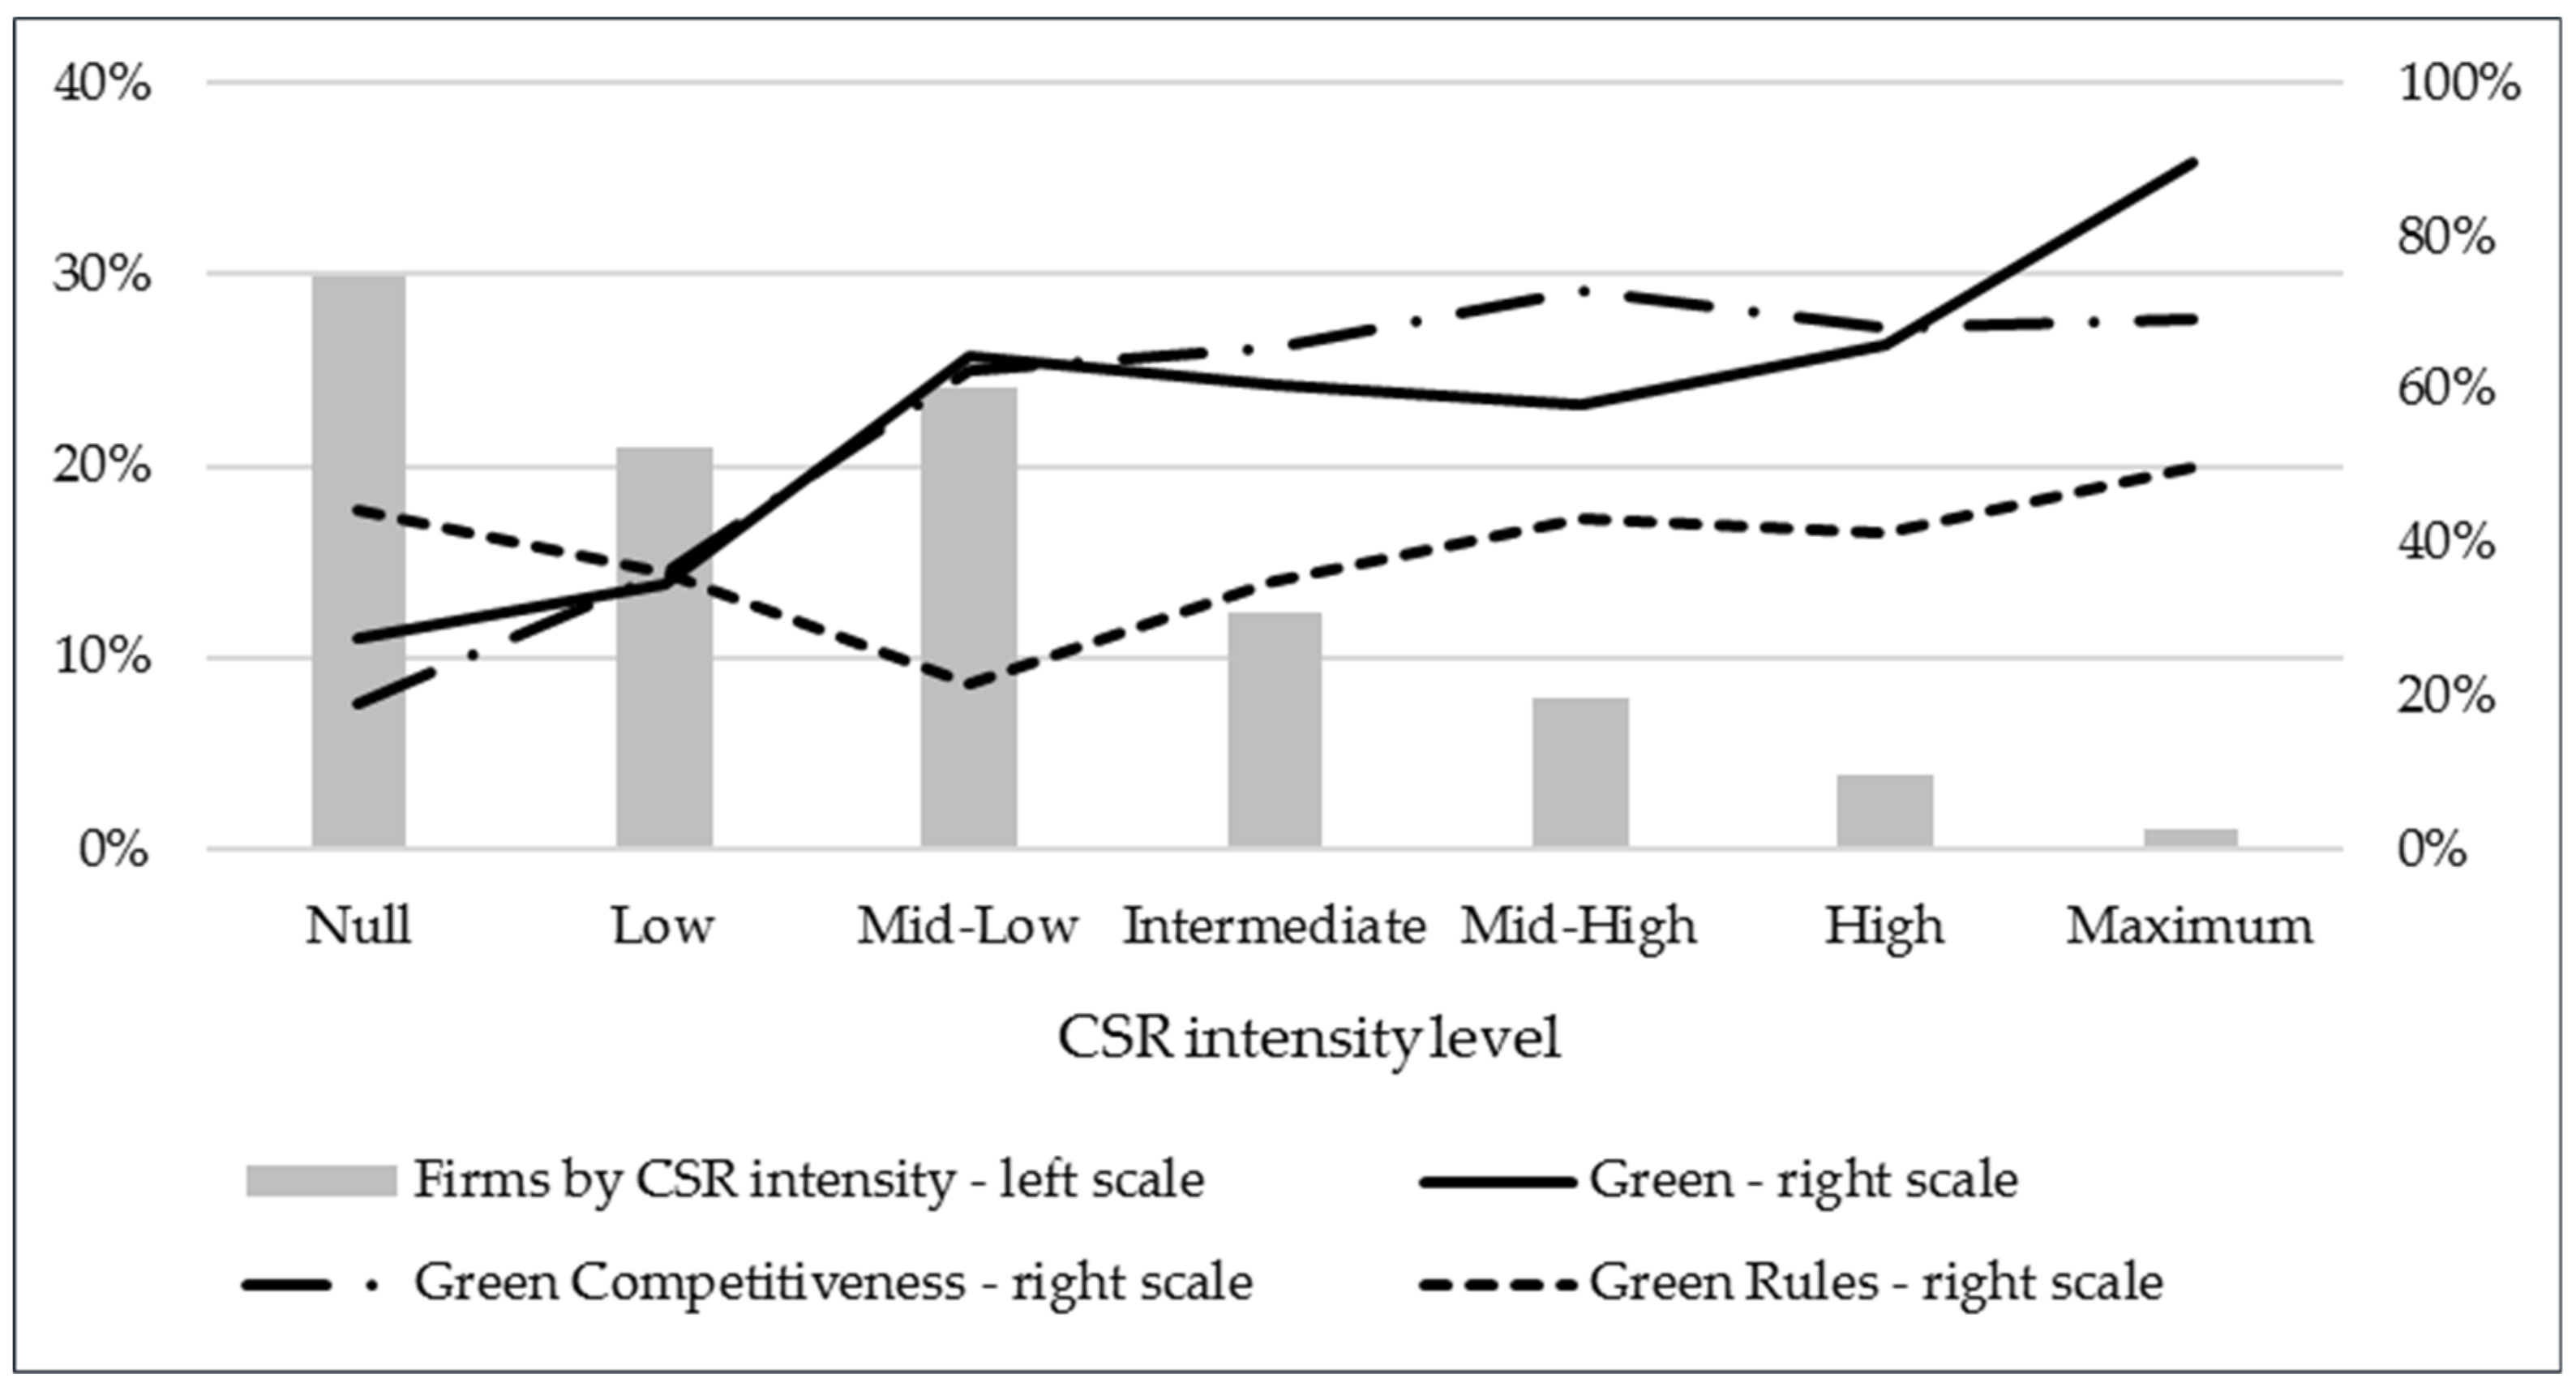
Having demonstrated our results through rigorous econometric means, we can now indulge in using a simple graph to summarize our findings. Figure 1 reports the four crucial distributions of the firms in our sample relating to our research question. First, it shows the distribution of sample firms in terms of CSR intensity (histograms measured on the left-hand scale). It is shown that the modal class contains about 30% of the firms which are totally insensitive to their stakeholders (CSR = 0), 21% which have low CSR (CSR = 0.17), 24% which have mid-low CSR (0.33), 12% which have intermediate CSR (0.50), 8% which have mid-high CSR (0.67), 4% which have high CSR (0.83), and only 1% which have maximum CSR (1.00). Second, the continuous line (right-hand scale) giving the percentage of firms making Green investments is indeed upward sloping as we move from lower to higher CSR classes. Namely, only 27% of the firms that are wholly insensitive to stakeholders (CSR = 0) engage in Green investments, while the share increases to 35% for low-CSR firms and to 65% for mid-low-CSR firms, and it stabilizes at 61 and 58% for intermediate-CSR and mid-high-CSR firms, respectively. It then resumes a positive trend reaching 66% for high-CSR firms and 90% for maximum-CSR firms. Third, the dashed and pointed line (right-hand scale) representing the share of firms reporting Green competitiveness—i.e., Green investments are motivated by trying to improve the competitive hedge etc.—is upward sloping escalating from 19% when CSR = 0 to about 60% when CSR is mid-low and approaching 70% when we move to higher CSR classes. Fourth, and conversely, the dashed line (right-hand scale) showing the share of firms reporting Green rules—i.e., Green investments are motivated only by abiding to regulation—does not show a clear trend as a function of increasing CSR. Specifically, while Green rules exceeds Green competitiveness when CSR = 0—and the two exactly match for low-CSR firms—the opposite happens for any higher-CSR class starting with mid-low-CSR.
Hence, the positive relationship between CSR and Green investments, which is in line with some previous works—e.g., Kesidou and Demirel [10], even if we do not account for the intensity of green investments—seems to be germane. Thus, the two main dimensions of sustainable behavior—environmental responsibility and social responsibility—are indeed complements. Additionally, we tried to enrich the existing literature by showing that this relationship is stronger when Green investments are driven by a firm’s awareness that environmental sustainability promotes competitiveness rather than by regulatory constraints.
Overall, the fact that we found CSR intensity and Green investments to be complements—with CSR boosting Green investments—offers a new contribution to the debate on sustainable development. In particular, the complementarity between social responsibility and environmental responsibility has important policy implications. Given the growing centrality of the task of favoring the transition to sustainable development, policies should adopt a systemic approach. Promoting CSR will, in fact, engender positive spillover effects also in terms of environmental responsibility. In other words, policies should consider the two main dimensions of sustainability as moving together. Ignoring such co-movement would be inefficient and could lead to underestimating the impact of pro-social policies in terms of environmental achievement. Furthermore, policy makers focusing solely on environmental targets, if they were to disregard improving CSR, would be choosing suboptimal policies. Indeed, policies that boost a firm’s CSR could indirectly favor upgrading that firm’s environmental responsibility. Finally, addressing social and environmental issues simultaneously could reinforce the role of innovation in promoting sustainability (e.g., Kesidou and Demirel [10]).
All in all, the strong interlink we have outlined between social responsibility and environmental responsibility suggests that firms indeed tend to behave in ways consistent with the holistic approach enshrined by the UN 2030 Agenda for sustainable development.
6. Conclusions
We started observing that sustainable behavior is necessarily twofold, implying a joint move towards environmental sustainability and social sustainability. This is implied by the holistic approach to sustainable development of the 2030 Agenda of the United Nations. We may add that this joint move comes close as well to the concept of “integral ecology” proposed by Pope Francis in his “dialogue with all people about our common home.” ([106], p. 4). His Encyclical letter Laudato si’ states: “We are faced not with two separate crises, one environmental and the other social, but rather with one complex crisis which is both social and environmental. Strategies for a solution demand an integrated approach to combating poverty, restoring dignity to the excluded, and at the same time protecting nature.” ([106], p. 104).
Nevertheless, problems might emerge if firms face incentives not fully aligned with that joint move. While some firms may be non-compliant with both the environmental and social dimension of sustainability, other firms might comply with only one of the two dimensions. For instance, socially responsible firms could be non-compliant on the environmental dimension and environmentally responsible firms might be non-compliant on the social dimension. This would prove particularly challenging in the current phase, in which the task of promoting sustainable development seems to rely more and more on the private sector.
Against this background, we ventured to investigate empirically whether social responsibility and green investments are complements, substitutes, or unrelated. Our analysis was based on a representative sample of Italian manufacturing firms. The main results detected complementarity between CSR intensity and green investments. Specifically, we found that socially responsible firms: (1) Are systematically more likely to make green investments; (2) identify green investments as a voluntary choice promoting business competitiveness much more than other firms.
Although our results appear comforting—in the sense that CSR seems to unequivocally boost environmentally responsible behavior too—two caveats are in order. First, while we measured CSR intensity, we employed a 0–1 variable to evaluate environmental responsibility, assigning 1 to firms which had made green investments. However, the fact that a firm is making green investments does not ensure that it is fully compliant in terms of environmental responsibility. Second, what we found for Italian manufacturing firms might not translate to firms in other sectors and, even more so, in other countries—where a divide might exist between rich vs emerging and developing countries.
Regarding future research, we would like to point out three issues. First, the link we detected between CSR and environmental responsibility could be further studied also in the reverse way—between environmental responsibility and CSR. Second, noting that standard sustainability ratings refer to the ESG approach—Environmental, Social and Governance—additional research effort is needed to figure out how the Governance set-up affects the CSR–environmental responsibility nexus. Third, it would be interesting to investigate whether and how the extent to which a firm makes progress towards both socially and environmentally sustainable behavior is affected by the firm’s organizational structure. In particular, the centrality—in terms of its nearness to the firm’s CEO—of the sustainability function within its organizational structure might empower swifter and more comprehensive transition of the firm towards sustainable behavior.
Author Contributions
Individual contributions are as follows: Conceptualization, G.F.; methodology, M.P.; software, M.P.; validation, G.F. and M.P.; formal analysis, M.P.; investigation, G.F.; resources, M.P.; data curation, M.P.; writing—original draft preparation, M.P.; writing—review and editing, G.F.; visualization, M.P.; supervision, G.F.
Funding
This research received no external funding.
Acknowledgments
We are indebted to Alessandro Rinaldi for constant encouragement and to Zeno Rotondi for key insights.
Conflicts of Interest
The authors declare no conflict of interest.
Appendix A

Table A1.
Summary statistics.
| Variable | Mean | Std. Dev | Min | Max |
|---|---|---|---|---|
| Green investments | 0.464 | 0.499 | 0 | 1 |
| CSR | 0.270 | 0.247 | 0 | 1 |
| Territory | 0.683 | 0.465 | 0 | 1 |
| R&D | 0.368 | 0.482 | 0 | 1 |
| HC | 6.088 | 12.561 | 0 | 90 |
| Training | 0.176 | 0.381 | 0 | 1 |
| Credit | 0.288 | 0.453 | 0 | 1 |
| Organizational innov | 0.496 | 0.500 | 0 | 1 |
| EMS | 0.257 | 0.437 | 0 | 1 |
| Local production | 0.135 | 0.342 | 0 | 1 |
| Product innov | 0.525 | 0.499 | 0 | 1 |
| Marketing activities | 0.336 | 0.472 | 0 | 1 |
| Business situation | 0.198 | 0.398 | 0 | 1 |
| Business expectations | 0.370 | 0.483 | 0 | 1 |
| Age | 35.401 | 12.851 | 3 | 118 |
| Size | 37.306 | 81.019 | 4.520 | 2372.18 |
| HT | 0.188 | 0.390 | 0 | 1 |
| North-West | 0.335 | 0.472 | 0 | 1 |
| North-East | 0.322 | 0.467 | 0 | 1 |
| Center | 0.196 | 0.397 | 0 | 1 |
| South | 0.147 | 0.354 | 0 | 1 |
| Green rules | 0.156 | 0.363 | 0 | 1 |
| Green competitiveness | 0.244 | 0.430 | 0 | 1 |
| Family | 0.708 | 0.455 | 0 | 1 |
| Social capital 1 | 0.581 | 0.066 | 0.273 | 0.678 |
| Social capital 2 | 31.3 | 4.515 | 19.900 | 40.200 |
| Cooperative banks in 1936 | 1.225 | 3.072 | 0 | 24.264 |
Appendix B
Appendix B.1. Question E1
In the three years 2015–2017, did your firm invest in energy/raw materials saving and/or lower its environmental impact?
- Yes, in processes (energy efficiency; emissions, raw materials, and waste reduction; recycling) and/or in products (environmental sustainability improvement, adopting a circular economy approach, etc.)
- No.
Appendix B.2. Question E2
Why did your firm invest in the three years 2015–2017 in energy/raw materials saving and/or lower its environmental impact?
- In response to National and European regulations
- For economic opportunity and competitive edge; improving the firm’s image and reputation; because of awareness that pollution and climate change represent a risk for my company as well as for the whole society.
References
- Shepherd, D.A.; Patzelt, H. The New Field of Sustainable Entrepreneurship: Studying Entrepreneurial Action Linking “What Is to Be Sustained” with “What Is to Be Developed”. Entrep. Theory Prat. 2011, 35, 137–163. [Google Scholar] [CrossRef]
- WBCSD—World Business Council for Sustainable Development. Corporate Social Responsibility: Meeting Changing Expectations; World Business Council for Sustainable Development: Geneva, Switzerland, 1999; ISBN 2-94-0240-03-5. [Google Scholar]
- WBCSD—World Business Council for Sustainable Development. Corporate Social Responsibility: Making Good Business Sense; World Business Council for Sustainable Development: Geneva, Switzerland, 2000; ISBN 2-940240-078. [Google Scholar]
- Dahlsrud, A. How corporate social responsibility is defined: An analysis of 37 definitions. Corp. Soc. Responsib. Environ. Manag. 2008, 15, 1–13. [Google Scholar] [CrossRef]
- Murillo, D.; Lozano, J.M. SMEs and CSR: An Approach to CSR in their Own Words. J. Bus. Ethics 2006, 67, 227–240. [Google Scholar] [CrossRef]
- Mousiolis, D.T.; Zaridis, A.D.; Karamanis, K.; Rontogianni, A. Corporate Social Responsibility in SMEs and MNEs. The Different Strategic Decision Making. Procedia Soc. Behav. Sci. 2015, 175, 579–583. [Google Scholar] [CrossRef] [Green Version]
- Baumann-Pauly, D.; Wickert, C.; Spence, L.J.; Scherer, A.G. Organizing Corporate Social Responsibility in Small and Large Firms: Size Matters. J. Bus. Ethics 2013, 115, 693–705. [Google Scholar] [CrossRef] [Green Version]
- Jansson, J.; Nilsson, J.; Modig, F.; Hed Vall, G. Commitment to sustainability in small and medium-sized enterprises: The influence of strategic orientations and management values. Bus. Strategy Environ. 2017, 26, 69–83. [Google Scholar] [CrossRef]
- Cuerva, M.C.; Triguero-Cano, Á.; Corcoles, D. Drivers of green and non-green innovation: Empirical evidence in Low-Tech SMEs. J. Clean. Prod. 2014, 68, 104–113. [Google Scholar] [CrossRef]
- Kesidou, E.; Demirel, P. On the drivers of eco-innovations: Empirical evidence from the UK. Res. Policy 2012, 41, 862–870. [Google Scholar] [CrossRef]
- Qiu, Y.; Shaukat, A.; Tharyan, R. Environmental and social disclosures: Link with corporate financial performance. Br. Account. Rev. 2016, 48, 102–116. [Google Scholar] [CrossRef] [Green Version]
- Cormier, D.; Magnan, M.; LeDoux, M.; LeDoux, M.J. The informational contribution of social and environmental disclosures for investors. Manag. Decis. 2011, 49, 1276–1304. [Google Scholar] [CrossRef] [Green Version]
- Michelon, G.; Boesso, G.; Kumar, K. Examining the link between strategic corporate social responsibility and company performance: An analysis of the best corporate citizens. Corp. Soc. Responsib. Environ. Manag. 2013, 20, 81–94. [Google Scholar] [CrossRef]
- Lys, T.; Naughton, J.P.; Wang, C. Signaling through corporate accountability reporting. J. Account. Econ. 2015, 60, 56–72. [Google Scholar] [CrossRef] [Green Version]
- Lubin, G.; Berlinger, J. 13 Companies That May Be Riskier Than You Think. In Business Insider. (published on 5 October 2012). Available online: https://www.businessinsider.com.au/companies-with-bad-esg-scores-2012-10#wal-mart-1 (accessed on 26 June 2019).
- Kang, J.; Hustvedt, G. Building trust between consumers and corporations: The role of consumer perceptions of transparency and social responsibility. J. Bus. Ethics 2014, 125, 253–265. [Google Scholar] [CrossRef]
- Pacheco, D.A.D.J.; Caten, C.S.T.; Jung, C.F.; Ribeiro, J.L.D.; Navas, H.V.G.; Cruz-Machado, V.A. Eco-innovation determinants in manufacturing SMEs: Systematic review and research directions. J. Clean. Prod. 2017, 142, 2277–2287. [Google Scholar] [CrossRef]
- Horbach, J.; Rammer, C.; Rennings, K. Determinants of eco-innovations by type of environmental impactd the role of regulatory push/pull, technology push and market pull. Ecol. Econ. 2012, 78, 112–122. [Google Scholar] [CrossRef]
- Rennings, K. Redefining innovation—Eco-innovation research and the contribution from ecological economics. Ecol. Econ. 2000, 32, 319–332. [Google Scholar] [CrossRef]
- Doran, J.; Ryan, G. Regulation and firm perception, eco-innovation and firm performance. Eur. J. Innov. Manag. 2012, 15, 421–441. [Google Scholar] [CrossRef]
- Saez-Martinez, F.J.; Díaz-García, C.; Gonzalez-Moreno, A. Firm technological trajectory as a driver of eco-innovation in young small and medium-sized enterprises. J. Clean. Prod. 2016, 138, 28–37. [Google Scholar] [CrossRef]
- Muscio, A.; Nardone, G.; Stasi, A. How does the search for knowledge drive firms’ eco-innovation? Evidence from the wine industry. Ind. Innov. 2017, 24, 298–320. [Google Scholar] [CrossRef]
- Montalvo Corral, C. Environmental Policy and Technological Innovation: Why do Firms Adopt or Reject New Technologies? (New Horizons in the Economics of Innovation); Edward Edgar: Cheltenham, UK, 2002. [Google Scholar]
- Canon de Francia, J.; Garces-Ayerbe, C.; Ramirez-Aleson, M. Are more innovative firms less vulnerable to new environmental regulation? Environ. Resour. Econ. 2007, 36, 295–311. [Google Scholar] [CrossRef]
- Horbach, J. Determinants of environmental innovation—New evidence from German panel data sources. Res. Policy 2008, 37, 163–173. [Google Scholar] [CrossRef]
- Rehfeld, K.-M.; Rennings, K.; Ziegler, A. Integrated product policy and environmental product innovations: An empirical analysis. Ecol. Econ. 2007, 61, 91–100. [Google Scholar] [CrossRef] [Green Version]
- Horbach, J.; Oltra, V.; Belin, J. Determinants and Specificities of Eco-Innovations Compared to Other Innovations—An Econometric Analysis for the French and German Industry Based on the Community Innovation Survey. Ind. Innov. 2013, 20, 523–543. [Google Scholar] [CrossRef]
- Borghesi, S.; Cainelli, G.; Mazzanti, M. Brown Sunsets and Green Dawns in the Industrial Sector: Eco Innovations, Firm Behavior and the European Emission Trading; Working Paper 3; Fondazione Eni Enrico Mattei: Milan, Italy, 2012. [Google Scholar]
- Green, K.; McMeekin, A.; Irwin, A. Technological trajectories and R&D for environmental innovation in UK firms. Futures 1994, 26, 1047–1059. [Google Scholar]
- Kemp, R.; Olsthoorn, X.; Oosterhuis, F.; Verbruggen, H. Supply and Demand Factors of Cleaner Technologies: Some Empirical Evidence. Environ. Resour. Econ. 1992, 2, 614–634. [Google Scholar]
- Winn, S.F.; Roome, N.J. R&D management responses to the environment: Current theory and implications to practice and research. RD Manag. 1993, 23, 147–160. [Google Scholar]
- Florida, R.; Atlas, M.; Cline, M. What Makes Companies Green? Organizational and Geographic Factors in the Adoption of Environmental Practices. Econ. Geogr. 2001, 77, 209–224. [Google Scholar] [CrossRef]
- Triebswetter, U.; Wackerbauer, J. Integrated environmental product innovation and impacts on company competitiveness: A case study of the automotive industry in the region of Munich. Eur. Environ. 2008, 18, 30–44. [Google Scholar] [CrossRef]
- Wagner, M. On the relationship between environmental management, environmental innovation and patenting: Evidence from German manufacturing firms. Res. Policy 2007, 36, 1587–1602. [Google Scholar] [CrossRef]
- Rennings, K.; Ziegler, A.; Ankele, K.; Hoffmann, E. The influence of different characteristics of the EU environmental management and auditing scheme on technical environmental innovations and economic performance. Ecol. Econ. 2006, 57, 45–59. [Google Scholar] [CrossRef]
- Wagner, M. Empirical influence of environmental management on innovation: Evidence from Europe. Ecol. Econ. 2008, 66, 392–402. [Google Scholar] [CrossRef] [Green Version]
- Khanna, M.; Deltas, G.; Harrington, D.R. Adoption of Pollution Prevention Techniques: The Role of Management Systems and Regulatory Pressures. Environ. Resour. Econ. 2009, 44, 85–106. [Google Scholar] [CrossRef]
- Mondéjar-Jiménez, J.; Vargas-Vargas, M.; Segarra-Oña, M.; Peiró-Signes, A. Categorizing variables affecting the proactive environmental orientation of firms. Int. J. Environ. Res. 2013, 7, 495–500. [Google Scholar]
- Segarra-Oña, M.D.V.; Peiró Signes, A.; Mondéjar Jiménez, J. Identifying variables affecting the proactive environmental orientation of firms: An empirical study. Pol. J. Environ. Stud. 2013, 22, 873–880. [Google Scholar]
- Rondinelli, D.; Vastag, G. Panacea, common sense, or just a label? The value of ISO 14001 environmental management systems. Eur. Manag. J. 2000, 18, 499–510. [Google Scholar] [CrossRef]
- Fryxell, G.E.; Szeto, A. The influence of motivations for seeking ISO 14001 certification: An empirical study of ISO 14001 certified facilities in Hong Kong. J. Environ. Manag. 2002, 65, 223–238. [Google Scholar] [CrossRef]
- Russo, M.V.; Harrison, N.S. Organizational Design and Environmental Performance: Clues from the Electronics Industry. Acad. Manag. J. 2005, 48, 582–593. [Google Scholar] [CrossRef]
- Boiral, O. Corporate Greening through ISO 14001: A Rational Myth? Organ. Sci. 2007, 18, 127–146. [Google Scholar] [CrossRef]
- De Marchi, V. Environmental innovation and R&D cooperation: Empirical evidence from Spanish manufacturing firms. Res. Policy 2012, 41, 614–623. [Google Scholar]
- Popp, D.; Hafner, T.; Johnstone, N. Environmental policy vs. public pressure: Innovation and diffusion of alternative bleaching technologies in the pulp industry. Res. Policy 2011, 40, 1253–1268. [Google Scholar] [CrossRef]
- Darnall, N. Why Firms Mandate ISO 14001 Certification. Bus. Soc. 2006, 45, 354–381. [Google Scholar] [CrossRef]
- Kammerer, D. The effects of customer benefit and regulation on environmental product innovation. Ecol. Econ. 2009, 68, 2285–2295. [Google Scholar] [CrossRef]
- Bansal, P.; Hunter, T. Strategic Explanations for the Early Adoption of ISO 14001. J. Bus. Ethics 2003, 46, 289–299. [Google Scholar] [CrossRef]
- Bleda, M.; Valente, M. Graded eco-labels: A demand-oriented approach to reduce pollution. Technol. Forecast. Soc. Chang. 2009, 76, 512–524. [Google Scholar] [CrossRef]
- Segarra-Oña, M.D.V.; Peiró-Signes, Á.; Mondéjar-Jiménez, J.; Vargas-Vargas, M. Service vs. manufacturing: How to address more effectively eco-innovation public policies by disentangling the different characteristics of industries. Innov. Eur. J. Soc. Sci. Res. 2014, 27, 134–151. [Google Scholar]
- Porter, M.E.; Van Der Linde, C. Toward a New Conception of the Environment-Competitiveness Relationship. J. Econ. Perspect. 1995, 9, 97–118. [Google Scholar] [CrossRef]
- Frondel, M.; Horbach, J.; Rennings, K. End-of-pipe or cleaner production? An empirical comparison of environmental innovation decisions across OECD countries. Bus. Strat. Environ. 2007, 16, 571–584. [Google Scholar] [CrossRef]
- Frondel, M.; Horbach, J.; Rennings, K. What Triggers Environmental Management and Innovation? Empirical evidence for Germany. Ecol. Econ. 2008, 66, 153–160. [Google Scholar] [CrossRef]
- Arimura, T.; Hibiki, A.; Katayama, H. Is a Voluntary Approach an Effective Environmental Policy Instrument? A Case for Environmental Management Systems. J. Environ. Econ. Manag. 2008, 55, 281–295. [Google Scholar] [CrossRef]
- Jaffe, A.B.; Peterson, S.; Portney, P.; Stavins, R. Environmental Regulation and the Competitiveness of US Manufacturing: What Does the Evidence Tell Us? J. Econ. Lit. 1995, 33, 132–163. [Google Scholar]
- Palmer, K.; Oates, W.E.; Portney, P.R. Tightening Environmental Standards: The Benefit-Cost or the No-Cost Paradigm? J. Econ. Perspect. 1995, 9, 119–132. [Google Scholar] [CrossRef]
- Delmas, M.A. The diffusion of environmental management standards in Europe and in the United States: An institutional perspective. Policy Sci. 2002, 35, 91–119. [Google Scholar] [CrossRef]
- Revell, A.; Stokes, D.; Chen, H. Small businesses and the environment: Turning over a new leaf? Bus. Strategy Environ. 2010, 19, 273–288. [Google Scholar]
- Zhang, C.; Liu, H.; Bressers, H.T.; Buchanan, K.S. Productivity growth and environmental regulations—Accounting for undesirable outputs: Analysis of China’s thirty provincial regions using the Malmquist–Luenberger index. Ecol. Econ. 2011, 70, 2369–2379. [Google Scholar] [CrossRef]
- Sethi, S.P. Dimensions of Corporate Social Performance: An Analytical Framework. Calif. Manag. Rev. 1975, 17, 58–64. [Google Scholar] [CrossRef]
- Palazzo, G.; Scherer, A.G. Corporate Legitimacy as Deliberation: A Communicative Framework. J. Bus. Ethics 2006, 66, 71–88. [Google Scholar] [CrossRef] [Green Version]
- Suchman, M.C. Managing Legitimacy: Strategic and Institutional Approaches. Acad. Manag. Rev. 1995, 20, 571–610. [Google Scholar] [CrossRef] [Green Version]
- Wagner, M. The role of corporate sustainability performance for economic performance: A firm-level analysis of moderation effects. Ecol. Econ. 2010, 69, 1553–1560. [Google Scholar] [CrossRef] [Green Version]
- Bowen, H.R. Social Responsibilities of the Businessman; Harper & Row: New York, NY, USA, 1953. [Google Scholar]
- Garriga, E.; Melé, D. Corporate Social Responsibility Theories: Mapping the Territory. J. Bus. Ethics 2004, 53, 51–71. [Google Scholar] [CrossRef]
- Freeman, R.E. Strategic Management: A stakeholder Approach; Pitman: Boston, MA, USA, 1984. [Google Scholar]
- McWilliams, A.; Siegel, D. Corporate Social Responsibility: A Theory of the Firm Perspective. Acad. Manag. Rev. 2001, 26, 117–127. [Google Scholar] [CrossRef]
- Freeman, R.E. Stakeholder Theory of the Modern Corporation. In Ethical Issues in Business: A Philosophical Approach, 7th ed.; Donaldson, T., Werhane, P., Eds.; Pearson/Prentice Hall: Upper Saddle River, NJ, USA, 2002; pp. 38–48. [Google Scholar]
- Lucas, T.; Wollin, A.; Lafferty, G. Achieving Social Responsibility through Corporate Strategy: A Matter of Governance, Governance and Capable Responsibility in the New Millennium. 2001. Available online: http://citeseerx.ist.psu.edu/viewdoc/download?doi=10.1.1.197.5914&rep=rep1&type=pdf (accessed on 13 August 2019).
- Camagni, R. The City as a Milieu: Applying GREMI’s Approach to Urban Evolution. Rev. D’economie Régionale Urbaine 1999, 3, 591–606. [Google Scholar]
- Coleman, J.S. Social Capital in the Creation of Human Capital. Am. J. Sociol. 1988, 94, S95–S120. [Google Scholar] [CrossRef]
- Coleman, J.S. Foundations of Social Theory; Harvard University Press: Cambridge, UK, 1990. [Google Scholar]
- Aydalot, P. (Ed.) Milieux Innovateurs in Europe; GREMI: Paris, France, 1986. [Google Scholar]
- Aydalot, P.; Keeble, D. (Eds.) High Technology Industry and Innovative Environment; Routledge: London, UK, 1988. [Google Scholar]
- Camagni, R. Technological Change, Uncertainty and Innovation Networks: Towards a Dinamic Theory of Economic Space. In Innovation Networks: Spatial Perspectives; Camagni, R., Ed.; Belhaven-Pinter: London, UK, 1991. [Google Scholar]
- Ratti, R.; Bramanti, A.; Gordon, R. (Eds.) The Dynamics of Innovative Regions; Ashgate: Aldershot, UK, 1997. [Google Scholar]
- Camagni, R. Global Network and Local Milieux: Towards a Theory of Economic Space. In The Industrial Enterprise and its Environment: Spatial Perspective; Conti, S., Malecki, E., Oinas, P., Eds.; Avebury: Aldershot, UK, 1995; pp. 195–216. [Google Scholar]
- OECD—Organization for Economic Development and Cooperation. OECD Territorial Outlook; OECD Publishing: Paris, France, 2001. [Google Scholar]
- Becattini, G. The Industrial District as a Socio-economic Notion. In Industrial Districts and Inter-firms Cooperation in Italy; Pike, F., Becattini, G., Sengerberger, W., Eds.; International Institute for Labour Studies: Geneva, Switzerland, 1990; pp. 37–51. [Google Scholar]
- Tyl, B.; Vallet, F.; Bocken, N.M.; Real, M. The integration of a stakeholder perspective into the front end of eco-innovation: A practical approach. J. Clean. Prod. 2015, 108, 543–557. [Google Scholar] [CrossRef]
- Wagner, M.; Llerena, P. Eco-Innovation Through Integration, Regulation and Cooperation: Comparative Insights from Case Studies in Three Manufacturing Sectors. Ind. Innov. 2011, 18, 747–764. [Google Scholar] [CrossRef]
- Beise, M.; Rennings, K. Lead markets and regulation: A framework for analyzing the international diffusion of environmental innovations. Ecol. Econ. 2005, 52, 5–17. [Google Scholar] [CrossRef]
- Hoffman, J.; Hoelscher, M.; Sorenson, R. Achieving Sustained Competitive Advantage: A Family Capital Theory. Fam. Bus. Rev. 2006, 19, 135–145. [Google Scholar] [CrossRef]
- Adler, P.S.; Kwon, S.W. Social Capital: Prospects for a New Concept. Acad. Manag. Rev. 2002, 27, 17–40. [Google Scholar] [CrossRef]
- Muscio, A. The impact of absorptive capacity on smes’ collaboration. Econ. Innov. New Technol. 2007, 16, 653–668. [Google Scholar] [CrossRef]
- Aghion, P.; Veugelers, R.; Serre, C. Cold Start for the Green Innovation Machine; Bruegel Policy Contribution, November 2009. Available online: https://bruegel.org/2009/11/cold-start-for-the-green-innovation-machine/ (accessed on 13 August 2019).
- Siqueira, A.C.O.; Guenster, N.; Vanacker, T.; Crucke, S. A longitudinal comparison of capital structure between young for-profit social and commercial enterprises. J. Bus. Ventur. 2018, 33, 225–240. [Google Scholar] [CrossRef] [Green Version]
- Flaig, G.; Stadler, M. Success breeds success—The dynamics ofmthe innovation process. Empir. Econ. 1994, 19, 55–68. [Google Scholar] [CrossRef]
- Geroski, P.A.; Walters, C.F. Innovative Activity over the Business Cycle. Econ. J. 1995, 105, 916–928. [Google Scholar] [CrossRef]
- Smolny, W. Determinants of innovation behaviour and investment estimates for west-german manufacturing firms. Econ. Innov. New Technol. 2003, 12, 449–463. [Google Scholar] [CrossRef]
- Barham, E. Translating terroir: The global challenge of French AOC labeling. J. Rural. Stud. 2003, 19, 127–138. [Google Scholar] [CrossRef]
- Sanz, J.; Macias, A. Quality certification, institutions and innovation in local agro-food systems: Protected designations of origin of olive oil in Spain. J. Rural Stud. 2005, 21, 475–486. [Google Scholar] [CrossRef]
- Wooldridge, J.M. Econometric Analysis of Cross Section and Panel Data, 2nd ed.; MIT Press: Cambridge, MA, USA; London, UK, 2010. [Google Scholar]
- Wooldridge, J.M. Introductory Econometrics: A Modern Approach, 3rd ed.; Cengage Learning: Boston, MA, USA, 2016. [Google Scholar]
- Cameron, A.C.; Trivedi, P.K. Microeconometrics Using Stata; Stata Press: College Station, TX, USA, 2010. [Google Scholar]
- Miller, D.; Le Breton-Miller, I. Managing for the Long Run: Lessons in Competitive Advantage from Great Family Businesses; Harvard Business Press: Brighton, MA, USA, 2005. [Google Scholar]
- Mitchell, R.K.; Agle, B.R.; Chrisman, J.J.; Spence, L.J. Toward a Theory of Stakeholder Salience in Family Firms. Bus. Ethics Q. 2011, 21, 235–255. [Google Scholar] [CrossRef]
- Cennamo, C.; Berrone, P.; Cruz, C.; Gomez-Mejia, L.R. Socioemotional Wealth and Proactive Stakeholder Engagement: Why Family-Controlled Firms Care More About Their Stakeholders. Entrep. Theory Pract. 2012, 36, 1153–1173. [Google Scholar] [CrossRef]
- Godfrey, P.C. The Relationship Between Corporate Philanthropy and Shareholder Wealth: A Risk Management Perspective. Acad. Manag. Rev. 2005, 30, 777–798. [Google Scholar] [CrossRef]
- Guiso, L.; Sapienza, P.; Zingales, L. Does Local Financial Development Matter? Q. J. Econ. 2004, 119, 929–969. [Google Scholar] [CrossRef]
- Galassi, F.L. Measuring social capital: Culture as an explanation of Italy’s economic dualism. Eur. Rev. Econ. Hist. 2001, 5, 29–59. [Google Scholar] [CrossRef]
- Catturani, I.; Kalmi, P.; Stefani, M.L. Social Capital and Credit Cooperative Banks. Econ. Notes 2016, 45, 205–234. [Google Scholar] [CrossRef]
- Stock, J.H.; Wright, J.H.; Yogo, M. A Survey of Weak Instruments and Weak Identification in Generalized Method of Moments. J. Bus. Econ. Stat. 2002, 20, 518–529. [Google Scholar] [CrossRef]
- Calic, G.; Mosakowski, E. Kicking off social entrepreneurship: How a sustainability orientation influences crowdfunding success. J. Manag. Stud. 2016, 53, 738–767. [Google Scholar] [CrossRef]
- Stock, J.H.; Yogo, M. Testing for Weak Instruments in Linear IV Regression. In Identification and Inference for Econometric Models: Essays in Honor of Thomas Rothenberg; Andrews, D.W.K., Stock, J.H., Eds.; Cambridge University Press: New York, NY, USA, 2005; pp. 80–108. [Google Scholar] [Green Version]
- Francis, P. Encyclical Letter Laudato Si’ on Care for Our Common Home; Libreria Editrice Vaticana: Vatican City, 2015; pp. 1–184. [Google Scholar]
Figure 1.
Distribution of firms by CSR intensity level and share of firms which carried out green investments by motivation.
Figure 1.
Distribution of firms by CSR intensity level and share of firms which carried out green investments by motivation.

Table 1.
Variable definitions (*).
| Variable | Definition |
|---|---|
| Dependent variables | |
| Green investments | Dummy variable: 1 if the firm invested in environmental sustainability in the period 2015–2017 |
| Green rules | Dummy variable: 1 if the firm reports that green investment is motivated by regulation |
| Green competitiveness | Dummy variable: 1 if the firm reports that green investment is motivated by competitiveness |
| Independent variables | |
| CSR | Continuous variable: Average of the six dummy variables related to relationship with: (i) Employees; (ii) other firms, university, and research centers; (iii) institutions; (iv) banks and trade associations; (v) non-profit organizations; (vi) customers |
| Territory | Dummy variable: 1 if the firm has a strong connection with the local community |
| R&D | Dummy variable: 1 if it invested in R&D during the period 2015–2017 |
| HC | Continuous variable: Share of employees with a university degree |
| Training | Dummy variable: 1 if the firm carried out training courses in the period 2015–2017 |
| Credit | Dummy variable: 1 if the firm states having problems of access to credit |
| Organizational innov | Dummy variable: 1 if the firm introduced organizational innovation in 2015–2017 |
| EMS | Dummy variable: 1 if the firm implemented Environmental Management Systems (EMS) |
| Local production | Dummy variable: 1 if the firm produces goods strongly linked to local production culture |
| Product innov | Dummy variable: 1 if the firm introduced product innovation in 2015–2017 |
| Marketing activities | Dummy variable: 1 if the firm carries out foreign commercial investments and marketing innovation for opening up new markets |
| Business situation | Dummy variable: 1 if the firm states high satisfaction about economic situation of the business |
| Business expectations | Dummy variable: 1 if it expects a good economic situation for the next year |
| Age | Continuous variable: Logarithm of the number of years since inception |
| Size | Continuous variable: Number of employees |
| HT | Dummy variable: 1 if the firm belongs to a medium-high/high technology intensive sector |
| North-West | Dummy variable: 1 if the firm is located in the North-West |
| North-East | Dummy variable: 1 if the firm is located in the North-East |
| Center | Dummy variable: 1 if the firm is located in the Center |
| South | Dummy variable: 1 if the firm is located in the South |
| Instrumental variables | |
| Family | Dummy variable: 1 if the main shareholder is an individual or a family |
| Social capital 1 | Continuous variable: Average voter turnout at the province level for all the referenda in the period between 1946 and 2016 |
| Social capital 2 | Continuous variable: Blood donors per 1000 inhabitants at the regional level |
| Cooperative banks in 1936 | Continuous variable: Number of Cooperative banks in 1936 per 100,000 inhabitants at the provincial level |
(*) Social capital 1, source: Ministry of the Interior. Social capital 2, source: Ministry of Health. Cooperative banks in 1936, source: Bank of Italy. All other variables were derived from the survey questionnaire.
Table 2.
Baseline results.
| Variable | Probit (1) | Probit (2) | Probit (3) | |||
|---|---|---|---|---|---|---|
| Coeff. | M.E. | Coeff. | M.E. | Coeff. | M.E. | |
| CSR | 0.865 *** (0.117) | 0.343 (0.047) | 0.852 *** (0.114) | 0.338 (0.045) | 0.574 *** (0.212) | 0.227 (0.084) |
| Territory | 0.105 * (0.054) | 0.042 (0.021) | 0.008 (0.080) | 0.003 (0.032) | ||
| CSR *Territory | 0.372 (0.240) | 0.148 (0.095) | ||||
| R&D | −0.018 (0.059) | −0.007 (0.023) | ||||
| HC | 0.008 *** (0.002) | 0.003 (0.001) | 0.007 *** (0.002) | 0.003 (0.001) | 0.007 *** (0.002) | 0.003 (0.001) |
| Training | 0.145 ** (0.068) | 0.058 (0.027) | 0.149 ** (0.068) | 0.059 (0.027) | 0.152 ** (0.068) | 0.060 (0.027) |
| Credit | −0.124 ** (0.055) | −0.049 (0.022) | −0.122 ** (0.055) | −0.048 (0.022) | −0.126 ** (0.055) | −0.050 (0.022) |
| Organizational innov | 0.256 *** (0.069) | 0.102 (0.027) | 0.261 *** (0.069) | 0.104 (0.027) | 0.261 *** (0.069) | 0.103 (0.027) |
| EMS | 0.303 *** (0.060) | 0.120 (0.024) | 0.302 *** (0.060) | 0.120 (0.024) | 0.305 *** (0.060) | 0.121 (0.024) |
| Local production | 0.130 * (0.076) | 0.052 (0.030) | 0.128 * (0.076) | 0.051 (0.030) | 0.132 * (0.076) | 0.052 (0.030) |
| Product innov | 0.358 *** (0.063) | 0.142 (0.025) | 0.353 *** (0.061) | 0.140 (0.024) | 0.356 *** (0.062) | 0.141 (0.024) |
| Marketing activities | 0.258 *** (0.069) | 0.102 (0.027) | 0.248 *** (0.069) | 0.099 (0.028) | 0.249 *** (0.069) | 0.099 (0.028) |
| Business situation | 0.295 *** (0.070) | 0.117 (0.028) | 0.321 *** (0.068) | 0.127 (0.027) | 0.318 *** (0.068) | 0.126 (0.027) |
| Business expectations | 0.082 (0.055) | 0.033 (0.022) | ||||
| Age | 0.400 *** (0.144) | 0.159 (0.057) | 0.389 *** (0.144) | 0.154 (0.057) | 0.377 *** (0.145) | 0.150 (0.057) |
| Size | −0.000 (0.001) | −0.000 (0.000) | −0.000 (0.001) | −0.000 (0.000) | −0.000 (0.001) | −0.000 (0.000) |
| Size square | 0.000 (0.000) | 0.000 (0.000) | 0.000 (0.000) | 0.000 (0.000) | 0.000 (0.000) | 0.000 (0.000) |
| HT | −0.070 (0.066) | −0.028 (0.026) | −0.066 (0.065) | −0.026 (0.026) | −0.065 (0.065) | −0.026 (0.026) |
| North-East | 0.041 (0.061) | 0.016 (0.024) | 0.045 (0.061) | 0.018 (0.024) | 0.045 (0.061) | 0.018 (0.024) |
| Center | 0.137 * (0.070) | 0.054 (0.028) | 0.143 ** (0.070) | 0.057 (0.028) | 0.140 ** (0.070) | 0.056 (0.028) |
| South | 0.019 (0.077) | 0.008 (0.030) | 0.024 (0.077) | 0.009 (0.030) | 0.019 (0.077) | 0.008 (0.030) |
| Constant | −1.582 *** (0.232) | −1.616 *** (0.234) | −1.530 *** (0.234) | |||
| Observations | 3007 | 3007 | 3007 | |||
| Wald Chi2 | 534.89 *** | 528.24 *** | 528.94 *** | |||
| Pseudo R2 | 0.148 | 0.148 | 0.149 | |||
Dependent variable: Green = 1 if the firm invested in environmental sustainability in the period 2015–2017, 0 = otherwise. Table displays coefficients of the probit model and marginal effects (M.E.) at the means. Robust standard errors in parentheses. Wald test of the model specification is reported. *** p < 0.01, ** p < 0.05, * p < 0.1.
Table 3.
Instrumental variables (IV) estimates.
| Variable | Probit (1) | IV-Probit (2) | OLS (3) | OLS (4) | IV-2SLS (5) | ||
|---|---|---|---|---|---|---|---|
| Coeff. | M.E. | Coeff. | M.E. | Bootstrap | |||
| CSR | 0.863 *** (0.114) | 0.343 (0.045) | 3.187 *** (0.502) | 0.316 (0.236) | 0.297 *** (0.039) | 0.297 *** (0.038) | 1.166 *** (0.271) |
| HC | 0.007 *** (0.002) | 0.003 (0.001) | 0.001 (0.003) | 0.003 (0.001) | 0.003 *** (0.001) | 0.003 *** (0.001) | 0.001 (0.001) |
| Training | 0.145 ** (0.068) | 0.058 (0.027) | −0.111 (0.091) | 0.057 (0.041) | 0.049 ** (0.023) | 0.049 ** (0.024) | −0.034 (0.036) |
| Credit | −0.125 ** (0.055) | −0.049 (0.022) | −0.227 *** (0.058) | −0.049 (0.024) | −0.046 ** (0.019) | −0.046 ** (0.018) | −0.090 *** (0.026) |
| Organizational innov | 0.259 *** (0.069) | 0.103 (0.027) | −0.016 (0.096) | 0.101 (0.043) | 0.094 *** (0.025) | 0.094 *** (0.025) | 0.010 (0.037) |
| EMS | 0.308 *** (0.060) | 0.122 (0.024) | 0.185 *** (0.071) | 0.129 (0.031) | 0.109 *** (0.021) | 0.109 *** (0.020) | 0.082 *** (0.025) |
| Local production | 0.140 * (0.076) | 0.055 (0.030) | 0.103 (0.073) | 0.048 (0.031) | 0.047 * (0.026) | 0.047 * (0.026) | 0.041 (0.028) |
| Product innov | 0.362 *** (0.061) | 0.143 (0.024) | 0.259 *** (0.069) | 0.137 (0.029) | 0.131 *** (0.022) | 0.131 *** (0.022) | 0.114 *** (0.024) |
| Marketing activities | 0.255 *** (0.069) | 0.101 (0.027) | 0.087 (0.083) | 0.102 (0.036) | 0.094 *** (0.025) | 0.094 *** (0.024) | 0.048 (0.031) |
| Business situation | 0.319 *** (0.068) | 0.127 (0.027) | 0.193 ** (0.078) | 0.124 (0.033) | 0.110 *** (0.023) | 0.110 *** (0.023) | 0.083 *** (0.027) |
| Age | 0.394 *** (0.144) | 0.155 (0.057) | 0.291** (0.145) | 0.150 (0.061) | 0.136 *** (0.049) | 0.136 *** (0.049) | 0.119 ** (0.055) |
| Size | −0.000 (0.001) | −0.000 (0.000) | −0.002 *** (0.001) | −0.000 (0.000) | −0.000 (0.000) | −0.000 (0.000) | −0.001 ** (0.000) |
| Size square | 0.000 (0.000) | 0.000 (0.000) | 0.000 *** (0.000) | 0.000 (0.000) | 0.000 (0.000) | 0.000 (0.000) | 0.000 ** (0.000) |
| HT | −0.066 (0.065) | −0.026 (0.026) | −0.015 (0.065) | −0.021 (0.027) | −0.018 (0.022) | −0.018 (0.022) | −0.003 (0.025) |
| North−East | 0.039 (0.061) | 0.016 (0.024) | 0.028 (0.058) | 0.005 (0.026) | 0.014 (0.021) | 0.014 (0.021) | 0.012 (0.022) |
| Center | 0.135 * (0.070) | 0.054 (0.028) | 0.111 * (0.066) | 0.054 (0.028) | 0.044 * (0.023) | 0.044 * (0.024) | 0.043 * (0.025) |
| South | 0.018 (0.076) | 0.008 (0.030) | 0.025 (0.070) | 0.021 (0.031) | 0.007 (0.025) | 0.007 (0.025) | 0.010 (0.027) |
| Constant | −1.556 *** (0.232) | −1.543 *** (0.233) | −0.044 (0.074) | −0.044 (0.077) | −0.118 (0.088) | ||
| Observations | 3007 | 3007 | 3007 | 3007 | |||
| Wald Chi2 | 525.69 *** | 898.09 *** | 1011.53 *** | 638.37 *** | |||
| F-statistic | 49.46 *** | ||||||
| Exogeneity: Wald test Chi2 | 12.50 *** | ||||||
| Exogeneity: Wu-Hausmann test F-statistic | 12.227 *** | ||||||
| Instr. relevance, F-statistic | 17.383 *** | ||||||
| Overidentification test, Sargan Chi2 | 4.468 | ||||||
| Pseudo R2 | 0.147 | ||||||
| R2 | 0.190 | 0.190 | 0.049 | ||||
| Adjusted R2 | 0.185 | ||||||
Dependent variable: Green = 1 if the firm invested in environmental sustainability in the period 2015–2017. The table displays marginal effects at the means (M.E.). Robust standard errors in parentheses. Wald test of the model specification is reported. *** p < 0.01, ** p < 0.05, * p < 0.1. Exogeneity test for the instrumented variable: Wald test on IV-probit and Wu–Hausmann test on IV-2SLS, significance means to reject the hypothesis of exogeneity of the instrumented variable. Instruments relevance: F-test on IV-2SLS, significance, with a F-value > 10, means to reject the hypothesis of irrelevance of the instrumental variables. Sargan test for the overidentification restriction on IV-2SLS, no significance means to not reject the hypothesis of exogeneity of the instrumental variables.
Table 4.
Firms’ motivation for making green investments.
| Variable | Green Rules (1) | Green Competitiveness (2) | ||
|---|---|---|---|---|
| Coeff. | M.E. | Coeff. | M.E. | |
| CSR | 0.360 *** (0.137) | 0.078 *** (0.030) | 2.150 *** (0.128) | 0.751 (0.045) |
| +controls | Y | Y | Y | Y |
| Observations | 3007 | 3007 | ||
| Wald Chi2 | 226.75 *** | 564.94 *** | ||
| Pseudo R2 | 0.087 | 0.187 | ||
The table displays the coefficients of the probit model and marginal effects (M.E.) at the means. The dependent variable is reported at the top of the column. Robust standard errors are in parentheses. The Wald test of the model specification is reported. *** p < 0.01.
© 2019 by the authors. Licensee MDPI, Basel, Switzerland. This article is an open access article distributed under the terms and conditions of the Creative Commons Attribution (CC BY) license (http://creativecommons.org/licenses/by/4.0/).
Share and Cite
MDPI and ACS Style
Ferri, G.; Pini, M. Environmental vs. Social Responsibility in the Firm. Evidence from Italy. Sustainability 2019, 11, 4277. https://0-doi-org.brum.beds.ac.uk/10.3390/su11164277
AMA Style
Ferri G, Pini M. Environmental vs. Social Responsibility in the Firm. Evidence from Italy. Sustainability. 2019; 11(16):4277. https://0-doi-org.brum.beds.ac.uk/10.3390/su11164277
Chicago/Turabian StyleFerri, Giovanni, and Marco Pini. 2019. "Environmental vs. Social Responsibility in the Firm. Evidence from Italy" Sustainability 11, no. 16: 4277. https://0-doi-org.brum.beds.ac.uk/10.3390/su11164277
Note that from the first issue of 2016, this journal uses article numbers instead of page numbers. See further details here.