Effects of Indoor Plants on Self-Reported Perceptions: A Systemic Review


Department of Landscape Architecture, National Chin-Yi University of Technology, 57 Sec. 2, Zhongshan Rd., Taichung City 41170, Taiwan
*
Author to whom correspondence should be addressed.
Sustainability 2019, 11(16), 4506; https://0-doi-org.brum.beds.ac.uk/10.3390/su11164506
Submission received: 8 July 2019
/
Revised: 8 August 2019
/
Accepted: 13 August 2019
/
Published: 20 August 2019
(This article belongs to the Section Environmental Sustainability and Applications)
Abstract
:Bringslimark, Hartig, and Pati conducted a literature review of empirical studies investigating the psychological benefits of indoor plants, all of which adopted an experimental design and were written in English. However, the researchers did not follow the rigorous Preferred Reporting Items for Systematic Reviews and Meta-Analysis (PRISMA) protocol. Additionally, the reviewed data were obtained at least a decade ago, and thus require an update. Therefore, the present article reports a systemic review of the quantitative empirical research (in English and Chinese) exploring the effects of indoor plants on subjective psychological perceptions. The information sources were mainly Web of Science (1900–) and WANFANG DATA (1980–), in which only empirical studies using quantitative methods were selected. The eligibility criteria were studies (1) involving any participants, (2) regarding indoor plants (real or surrogates) as an intervention, excluding those equipped with a power-driven biofilter, (3) involving comparators to facilitate within-subject and between-subject comparisons, (4) presenting psychological perceptions as outcome measures, and (5) of all study designs. The two authors collected 45 journal papers (with 50 studies in total). The (1) authors and publication years, (2) participants’ nationalities, sex, and age, (3) number of interventions, (4) duration of plant exposure, (5) participant–plant distance, (6) experiment room size, (7) room climate (i.e., lighting, temperature, and humidity), (8) study designs (i.e., experimental, field experimental, quasi-experimental, field quasi-experimental, or survey designs), and (9) self-reported perceptions (i.e., emotion, cognition, health, restoration, thermal comfort, productivity, and satisfaction) were identified and reviewed. These 50 studies were also analyzed for their quality. Most had moderate research quality. The synthesized results of the reviewed studies showed that the most noticeable effects of indoor plants on participants were increasing positive emotions and reducing negative feelings, followed by reducing physical discomfort. Because members of the general public today spend most of their time indoors and are faced with increasingly severe problems associated with physical–mental health and wellbeing, the application of indoor plants to improving people’s physical–mental health is worth exploring.
1. Introduction
People today spend 80–90% of their time indoors [1], limiting their opportunities to be exposed to a natural environment that is physically and mentally healthy. To improve their living and work spaces, people place plants indoors [2] because plants serve as a symbol of nature [3,4]. Growing indoor plants has a long history. For example, records show that Egyptians were growing indoor plants in 300 BC. Indoor plants were also unearthed at Pompeii, an Italian city buried by volcanic ash nearly 2000 years ago [5]. Empirical studies confirm the positive effects of indoor plants on physical and mental health and wellbeing [6,7] in an era in which people face increasingly severe problems of health and wellbeing [8].
According to the World Health Organization, by 2020 the three diseases that will deserve the most attention in the world are depression, cardiovascular disease, and AIDS. Depression is the disease that causes the greatest human disability and the second greatest societal burden [8]. If indoor plants can improve mental health, human resources and medical expenditures would both benefit. In addition, indoor plants consume little energy, absorb carbon dioxide, decelerate global warming, and contribute to ecological diversity. Thus, they contribute to both public health and sustainable development.
Therefore, research should focus on the physical and mental health benefits brought by growing indoor plants. However, few studies on the nature-generated benefits to physical–mental health [9,10] have investigated indoor plants. One review found only 21 studies using experiments to determine the mental health benefits of indoor plants [3]. To address this research gap, the present article conducted a systematic review of English and Chinese quantitative empirical studies focusing on the effects of indoor plants on psychological perceptions. Bringslimark et al. only reviewed empirical studies that had conducted experiments on indoor plants to examine their effects on human mental health, and all the papers they reviewed (all were in English) were published in 2009 or earlier [3]. Additionally, their study did not follow the rigorous Preferred Reporting Items for Systematic Reviews and Meta-Analyses (PRISMA) protocol [11]. Because the study was conducted 10 years ago, a review article with the latest data is necessary. The present study reviewed literature in both English and Chinese because they are among the most common scholarly languages worldwide. The literature in less common languages such as Hindustani, Spanish, Arabic, Malay, Russian, Bengali, Portuguese, and French [12] was not included in this review.
This review study contains three major sections. The first focuses on the systematic search for the studies of interest. The second provides a structured overview of the compiled studies and synthesized results of these reviewed studies rather than analyzes individual features of these studies. The third assesses each study for its research quality in terms of construct validity, statistical conclusion validity, external validity, and confounders. Again, the systematic review and the quality appraisal of this present study tend to emphasize the summarized and synthesized features of the included studies rather than criticize each study. The objective of this review article is to provide a comprehensive, reliable, and updated answer to the question of the effects of indoor plants on people’s psychological perceptions.
2. Materials and Methods
The present review article followed PRISMA protocol despite its emphasis on evaluating randomized trials and interventions of studies involving participants [8]. Of the 27 PRISMA checklist items, this present article included 20 items, namely (1) title, (2) abstract, (3) introduction (i.e., rationale and objectives), (4) methods (i.e., eligibility criteria, information sources, search, study selection, data collection process, data items, risk of bias in individual studies, and summary measures), (5) results (i.e., study selection, study characteristics, results of individual studies, and additional analysis), (6) discussion (i.e., summary of evidence, limitations, and conclusions), and (7) funding.
2.1. Eligibility Criteria
The eligibility criteria of participants, interventions, comparators, outcome measures, and study design were studies (1) involving any participants, (2) using indoor plants (real or surrogates) as an intervention but excluding plants equipped with a power-driven biofilter, (3) involving comparators to facilitate within-subject or between-subject comparisons, (4) presenting outcome measurements based on any psychological perceptions, and (5) of all study designs, respectively. Furthermore, the papers had to be written in either English or Chinese.
2.2. Information Sources
The Web of Science (1900–) and WANFANG DATA (1980–) databases were the main information sources for this review. The latest dates for data retrieval from Web of Science and WANFANG DATA were 21 and 22 May 2019, respectively.
2.3. Search
The selected search keywords were as follows: Indoor plant, indoor vegetation, air quality, perception, psychology, emotion, physiology, cognition, restoration, behavior, and health [13]. Only the Boolean search operator “and” was adopted; for example, “indoor plant and air quality” and “indoor vegetation and perception.” The researchers also examined the reference list of each collected study and continued to search for more literature using a simple forward snowball process.
2.4. Study Selection
This article only reviewed empirical and quantitative journal papers, excluding books and unpublished theses. Empirical research refers to research with actual data and analyses, whereas quantitative research is conducted using statistics, mathematics, and calculations to discuss proposed questions [14]. Published journal papers are rigorous because they have been peer-reviewed. Regarding quantitative research that determines causal relationships among variables, randomized experimental designs outperform nonrandomized quasi-experimental designs, and quasi-experimental designs outperform survey designs [15]. In practice, a field experiment yields greater ecological validity than does a laboratory experiment [16].
2.5. Data Collection Process
One researcher entered keywords into the aforementioned databases to search for titles and abstracts meeting the eligibility criteria. If the title and abstract of an article were lacking the required information, the researcher then reviewed the entire article. Each study of a searched paper found in this process was assessed by the researcher. Next, the other researcher assessed the full text of all eligible journal papers. As the two researchers had different opinions on 16 papers, they discussed these until they reached a consensus.
2.6. Data Items
The following items were analyzed in the literature review section: Sources, populations, interventions, study designs, psychological perceptions, outcomes, and publication language.
2.7. Risk of Bias in Individual Studies
Because most collected studies adopted experimental or quasi-experimental designs, experimental and control groups were involved. Additionally, several studies comprised multiple experimental groups, such as a group with numerous plants and one with a moderate amount [17]. However, unlike clinical research, interventions cannot be randomly distributed to participants when performing quasi-experiments, particularly for field research. Consequently, sequence generation cannot be applied to quasi-experiments, field quasi-experiments, and surveys to reduce the risk of bias. Moreover, concealing the allocation sequence of interventions from those assigning interventions to participants is difficult because indoor plants are easily noticed, leading to the failure of allocation concealment. Similarly, blinding participants to whether they have received an intervention can possibly fail. The risk of incomplete outcome data caused by exclusion and attrition biases can occur. In addition, authors have tended to report results with significance; the risk of selective outcome reporting is inevitable because journals tend to publish papers reporting significant results [18,19].
2.8. Summary Measure
The summary measure of this article was the self-reported perceptions of any aspect regarding the participants themselves, the environment, or the plants collected by the selected empirical studies using a scale or questionnaire.
3. Results
3.1. Study Selection
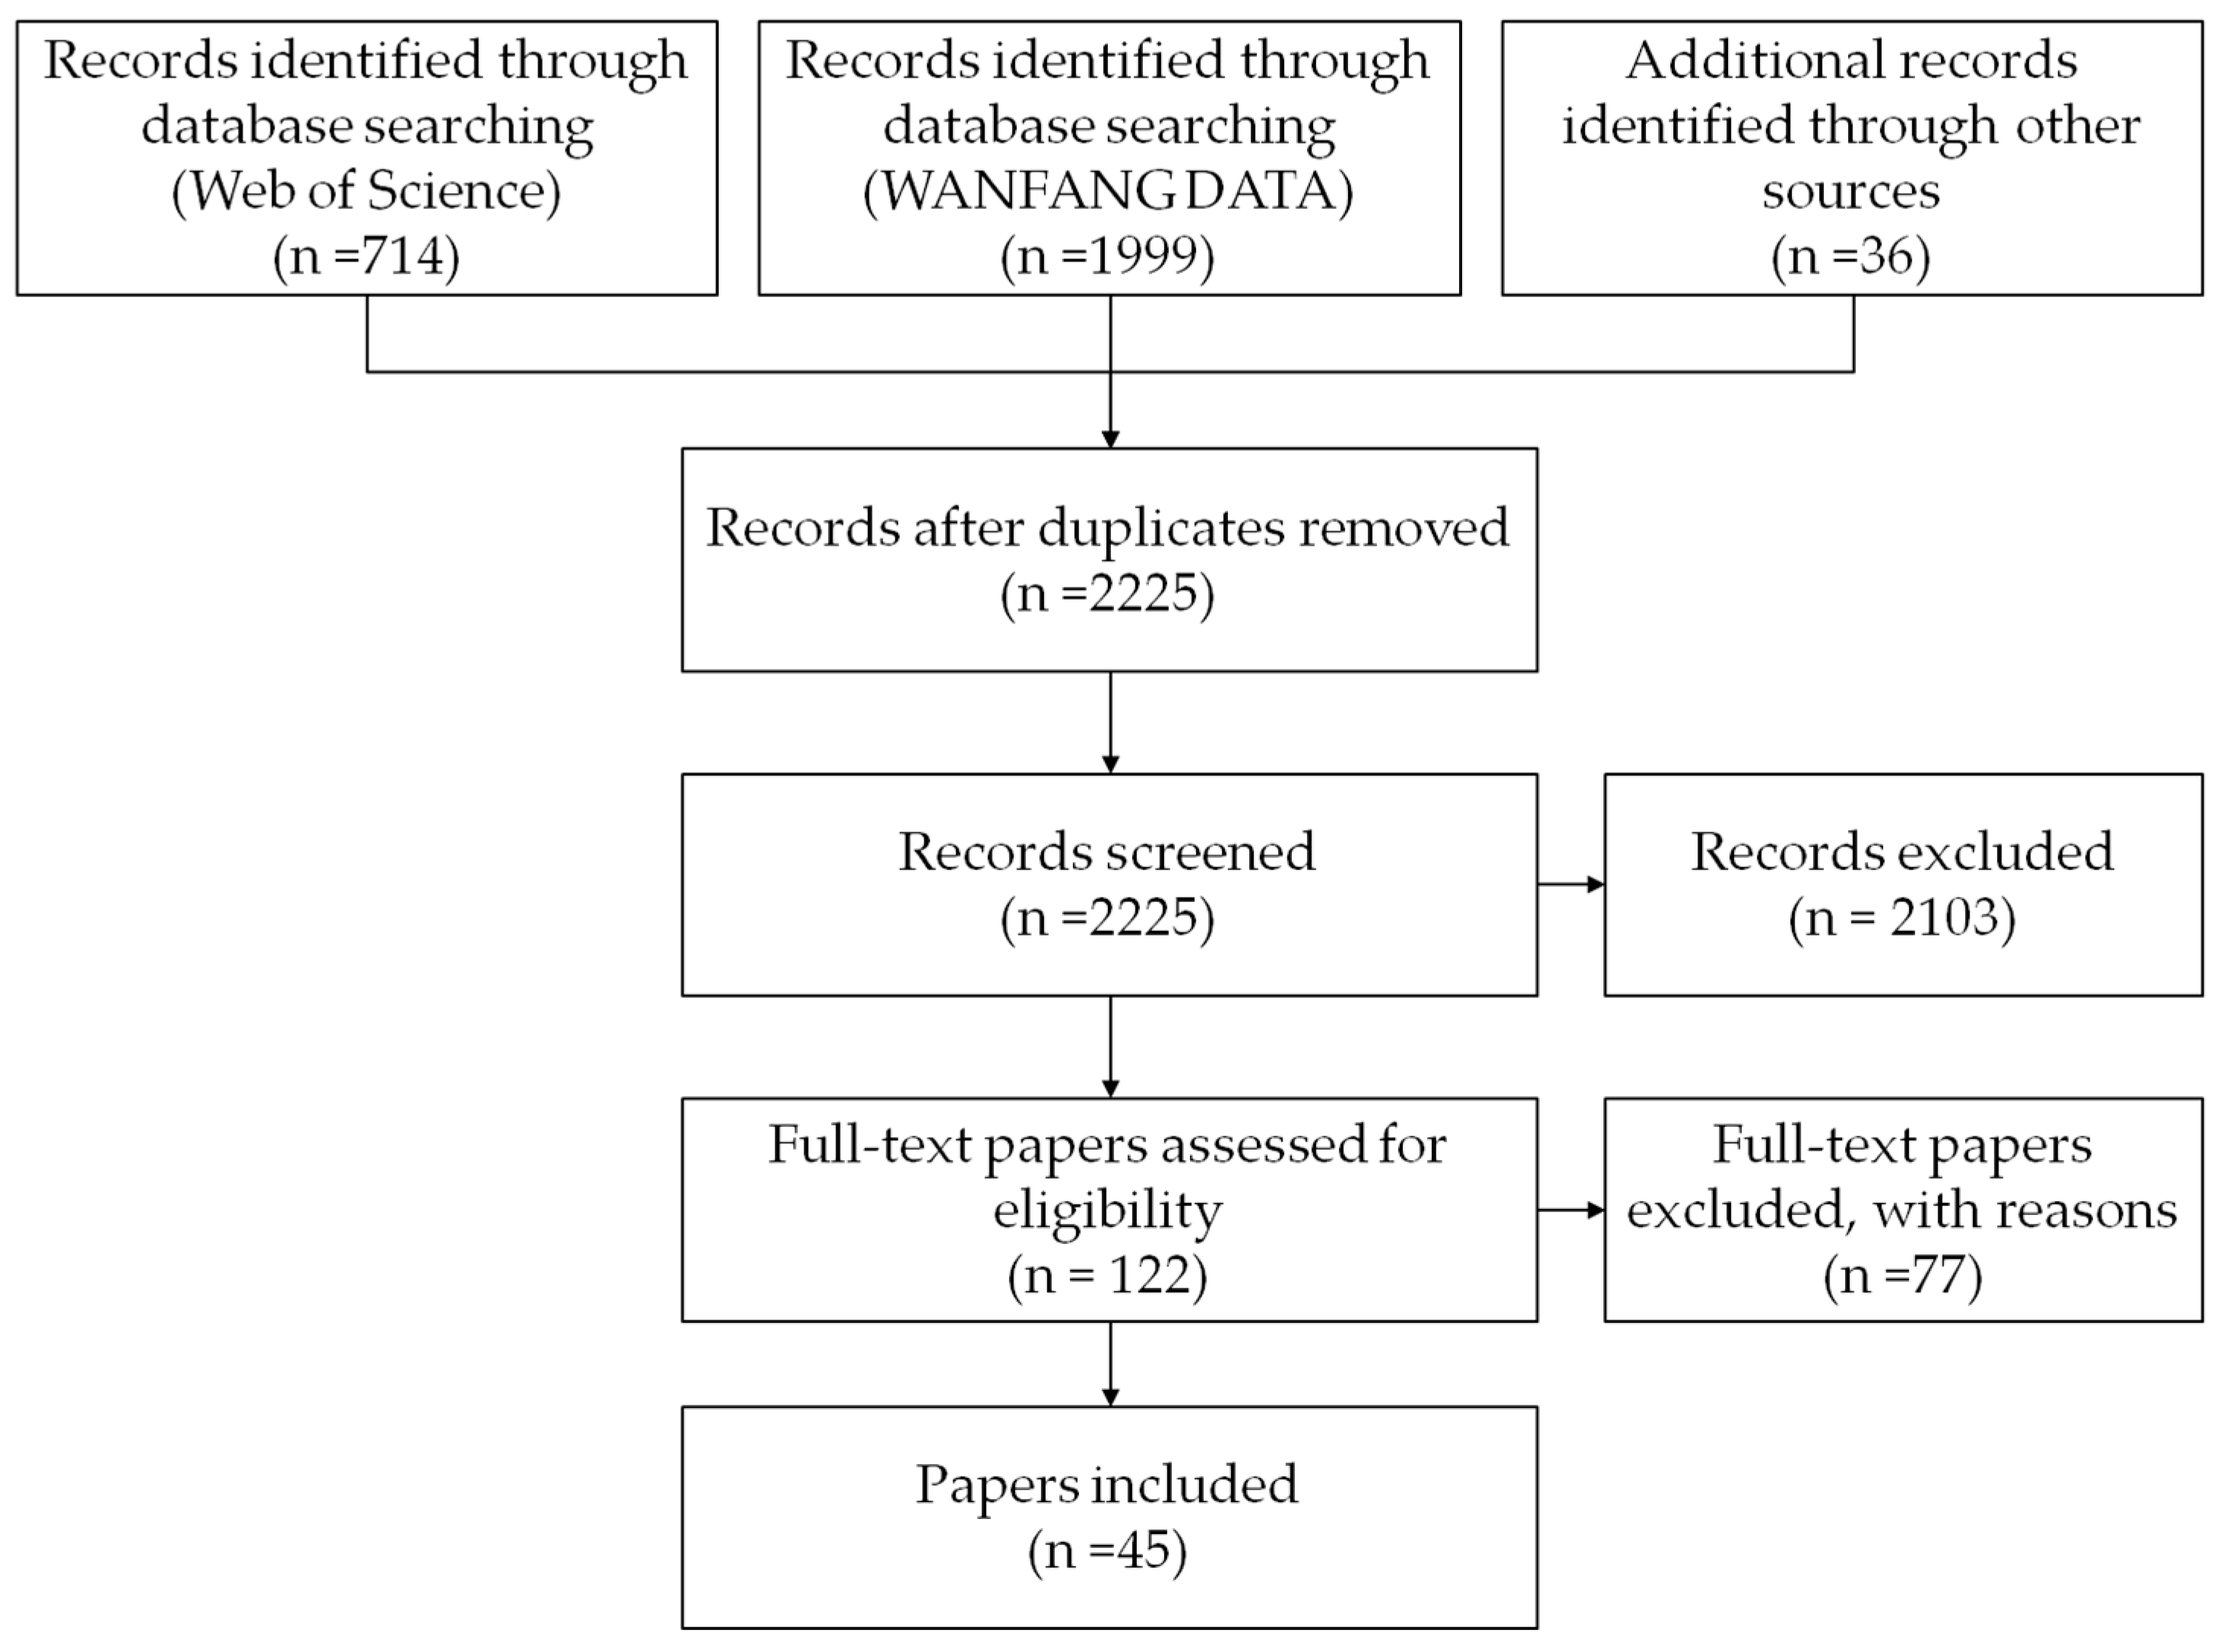
Performing queries on the keywords yielded 714, 1999, and 36 search results in Web of Science, WANFANG DATA, and other databases, respectively. After excluding repetitive papers, 2225 papers were retained. Subsequently, 2103 papers were excluded because their titles and abstracts did not meet the eligibility criteria, and thus, 122 papers were retained, of which the full text had to be obtained for evaluations. Next, after reviewing the full texts, the researchers excluded 77 papers that did not meet the criteria. Finally, 45 papers met the eligibility criteria, and thus were included (Figure 1).
3.2. Study Characteristics
This study reviewed the following elements of the selected studies: (1) authors and year of publication, (2) nationality, sex, and age of participants, (3) number of interventions, (4) duration that participants were exposed to indoor plants, (5) distance between plants and participants, (6) size of the experiment room, (7) ambient environment of the room (i.e., lighting, temperature, and humidity), (8) study design (i.e., experiment, field experiment, quasi-experiment, field quasi-experiment, or survey), (9) self-reported perceptions (emotions, cognition, health, restoration, thermal comfort, productivity, and satisfaction), (10) results, and (11) publication language (English or Chinese).
3.3. Results of Individual Studies
Table 1 summarizes the results of each study of each included article. However, not every study provided means and standard deviations. Additionally, several studies contained more than one experimental and control group. Furthermore, a few studies explored more than one type of self-reported perception, for example, by further categorizing emotions into fear, sadness, and anger [20]. These problems increased the difficulty of the meta-analysis.
The experimental settings in the 50 studies sampled herein varied widely. (1) The smallest number of participants was 16 [49,54] while the largest number of participants was 4293 [43]. (2) Not all studies reported the characteristics of the interventions using indoor plants, such as size, number, green cover ratio, and space occupied by the plants. For number of plants, the smallest was one [20,29] while the largest was 45 [7]. (3) A total of 35 studies (70%) reported the duration of the exposure to the indoor plants, with the shortest time being two minutes [45,46] and the longest 12 months [25]. (4) Only eight studies (16%) reported the distance from the participants to the indoor plants, with the shortest distance being 0.5 m [45,46,47,58] and the longest 2.9 m [29]. (5) A total of 21 studies (42%) reported the room size, with the smallest being 10 m2 [23,25] and 24.219 m3 [28] and the largest 10,000 m2 [52]. (6) Only 13 studies (26%) reported the room climate (15–27 °C, 34–70% humidity, 420–1365.5 lux) (Table 1).
3.4. Additional Analysis
Five papers in Chinese (11.11%) and 40 in English (88.89%) on empirical research into the effects of indoor plants on psychological perceptions were reviewed. The publication years ranged from 1979 to 2018, a period of 40 years. By evenly dividing the 40-year period into 10-year intervals, this review discovered that the number of English papers has substantially increased since 1999. Prior to 2009, however, no Chinese article concerning said effects was found (Table 2). This suggests that Chinese became interested in this area only recently.
Because several of the 45 papers in our sample simultaneously adopted multiple study designs, the present review compiled the total number of study designs adopted by the papers in question. A total of 49 study designs were identified, among which an experimental design was the most frequently used (19 times; 38.78%), followed by a field experimental design (11 times; 22.45%), survey design (10 times; 20.41%), field quasi-experimental design (five times; 10.20%), and quasi-experimental design (four times; 8.16%) (Table 3). Given that an experimental design has good internal validity [16], it was used most often in the studies examining the effects of indoor plants on the psychological perceptions. Since a field experimental design has good ecological validity [16], its application to investigate the effects of indoor plants on the psychological perceptions should be encouraged.
In addition, several studies explored multiple psychological perceptions, among which emotion was the most frequently investigated (31 times; 56.36%), followed by health (11 times; 20.00%), restoration (five times; 9.09%), which means recovery of physical and psychological resources [62], and cognition (four times; 7.27%). By contrast, knowledge, thermal comfort, satisfaction, and productivity were discussed only once (1.82% each) (Table 4). Because emotions are regarded as the fundamental factor influencing environmental perception [63], they were unsurprisingly the top subject in evaluating the effects of indoor plants on humans.
Most studies recruited US citizens as participants (nine studies; 20.45%), followed by South Korean citizens (seven studies; 15.91%). Norwegian, Dutch, Taiwanese, and Chinese participants were each investigated by five studies (11.36%) (Table 5). However, some studies did not provide information regarding the nationality of the participants. Among the included studies, 22 recruited Caucasians, 21 recruited Asians, and one recruited Africans. The uneven representation of ethnicity may be due to the selected languages of publications (English and Chinese).
The included journal papers were analyzed using the quality appraisal system created by Ohly et al. [64]. This system comprises quality indicators from the Centre for Reviews and Dissemination [65], critical appraisal checklists from the Critical Appraisal Skills Programme [66], and the quality assessment tool for quantitative studies from the Effective Public Health Practice Project [67], for a total of 19 appraisal items (Table 6).
The 45 papers containing 50 studies showed relatively low performance in the following aspects in relation to the appraisal items. (1) None of the studies (0%) met the requirement of intention-to-treat analysis. In other words, not all randomly assigned participants were included in the final analysis, mainly because of missing data provided by these participants or participant attrition during experiments. (2) Only one study (2%) had a representative sample of the target population, and most studies focused on college students. (3) Only two studies (4%) calculated statistical power. (4) Only two studies (4%) defined a baseline for their participant groups before interventions were administered. (5) Only three studies (6%) had their data analysts blinded to the group assignment of participants. (6) Only eight studies (16%) recruited participants who had similar socio-demographics.
By contrast, the included papers performed well in the appraisal items as follows. (1) A total of 49 studies (98%) conducted individual-level analyses of their participants. (2) The intervention measures and control designs were explicitly described in 47 studies (94%). (3) A total of 47 studies (94%) employed statistical methods that were suitable for their study designs. (4) A total of 44 studies (88%) collected data with consistency. (5) All participants in 38 studies (76%) after excluding those with missing responses were included in the final analysis. (6) A total of 32 studies (64%) adopted consistent intervention measures within and between groups. (7) Random assignment was applied in 30 studies (66.67%) (Table 7). These included papers (with 50 studies conducted) yielded an average quality score of 16.98 (out of a possible 38), achieving 44.68% of the full score, suggesting a moderate research quality (low: 0–33%, moderate: 34–66%, high: 67–100% [64]. In addition, 29 authors of the selected papers were contacted to clarify unclear data provided in their studies during the quality appraisal process, yet only nine authors replied (31.03%).
4. Discussion
4.1. Summary of Evidence
The synthesized results of the 50 reviewed studies with relatively heterogeneous features and a moderate research quality indicated that an indoor space with plants more strongly and positively affects participant psychological perceptions than a space without plants. Rooms with plants were perceived to be more comfortable with more and/or stronger positive emotions (friendliness, kindness, happiness, cheerfulness, calmness, peacefulness, pleasantness, relaxation, and warmth) and less and/or weaker negative emotions (pressure, anxiety, and fatigue) than rooms without plants, which led to a greater quality of life. Additionally, participants reported greater concentration, productivity, and academic performance in indoor spaces with plants. In brief, the selected 45 papers (containing 50 studies in total) provided relatively reliable evidence for and supported the argument that indoor plants generate positive self-reported perceptions. Further research should be conducted to determine whether these subjective perceptions are consistent with objective behaviors and performance.
More importantly, indoor plants, even as few as only one 45 × 45 × 45-cm flower pot [20], one 150-cm-tall plant pot [29], three flower pots [24], and five plant pots [24,26] were conducive to positive psychological perceptions. A recent study suggested that a very few indoor plants benefit peoples’ psychological perceptions and this conclusion is unlikely to be due to the effect of adding something new [68]. In addition, the time of the exposure to the indoor plants needed for positive perceptions is less than 20 min [26,27,29,49,54,55,59]. When the distance to the indoor plants is less than three meters, the participants have positive perceptions [27,29]. Therefore, using indoor plants to increase the occupants’ positive psychological perceptions is a highly achievable, feasible, and effective means, which does not cost much energy and money. Given that most of the world spends most of its time indoors [11], the benefits of bringing plants indoors could be great.
In addition to the investigations of the presence and absence of indoor plants, some of the included papers examined the effects of variations in plant–participant distance, exposure duration, plant type, plant scent, leaf and flower colors, and real plants and plant photos on self-reported perceptions. Placing a plant near participants increased the setting’s attractiveness. Levels of comfort and positive emotions increased with the duration of exposure to plants. Furthermore, the effect of real plants was stronger than that of plant photos [38]. Purple, green, red, pink, and white plants could reduce negative emotions including anxiety and anger, particularly purple and green plants [45]. Green plants of different shades of green exerted different effects on psychological perceptions. Specifically, yellowish-green and fresh-green plants enhanced the comfort and calmness of participants, whereas greenish-white plants could stimulate negative emotions [58]. However, the aforementioned effects on perceptions have rarely been examined, and thus, replications are required for verification.
4.2. Limitations
Among the 50 included studies, only 10 (20%) used surrogates of plants (slides and photos), while most studies used potted plants (Table 1). This shows that potted plants are a commonplace type of indoor plant. However, there are other types of indoor plants, such as movable room dividers with plants, permanent planting beds, and green walls. This review article included only a few studies using other types of indoor plants because (1) the search keywords did not include interior, architecture, building, greenery, greening, and green; (2) the eligibility criteria excluded power-driven biofilters; and (3) studies of indoor green walls remain scarce at present [69]. Future studies should use more search keywords to increase the number of eligible papers. Thus, the pre-specified eligibility criteria determine the search outcomes [19].
The quality appraisal results revealed that the 45 papers with 50 studies were of moderate quality on average, with no article reaching the high quality level. Furthermore, only 12 studies (24%) calculated the means and standard deviations of their results (Table 6), creating difficulty for the subsequent meta-analyses. Among the included papers, only five (11.11%) were written in Chinese. Most papers, regardless of language, focused on identifying the effects of the presence of indoor plants on psychological perceptions. Future research should explore the effects of more detailed aspects of the plants (e.g., plant amount, type, shape, color, scent, flower, and foliage) on perceptions, which are related to construct validity. In addition, only two studies (4%) reported power calculation, and most did not report the effect size, which are associated with the validity of the statistical conclusions. Moreover, most of the reviewed papers investigated student perceptions, which does not allow their results to be generalized to other groups, a signal of external validity. Furthermore, 23 studies (46%) did not provide information of the participants’ age. Future research should also report on the details of experimental settings such as exposure duration to the indoor plants, distance between participants and indoor plants, visual angles, size of the experiment room, and room climate (e.g., lighting, temperature, and humidity), which may have confounding influences. Among the 45 included papers, only five papers (11.11%) provide detailed information on participants, interventions of indoor plants, exposure time, distance to plants, room size, and room climate [45,46,50,51,58] (Table 1). Some of these issues were advocated by Bringslimark et al. [13] a decade ago. Issues regarding construct validity, statistical conclusion validity, external validity, and confounders of the studies of the indoor plant effects on people have yet to be treated appropriately in more recent studies.
4.3. Suggestions
More studies are needed to verify the effects such as plant size, plant amount, flower, foliage, distance, exposure duration, and even shape, color, and scent in order to provide specific guidelines and/or regulations for indoor plants [70]. For the indoor plants to survive, scholars should research room climates, to provide information for guidelines and/or regulations. A standardized study protocol should be established and followed in future research, which would be conducive to the transparency, reproducibility, construct validity, statistical conclusion validity, external validity, and reduction of confounding variables. Then meta-analyses can be conducted with studies of high research quality, enabling accurate and reliable synthesized results evaluating the effects of indoor plants on the psychological perceptions across many studies. In addition, some measurement units should be standardized. For example, the plant amount can be measured as green cover ratio or the space occupied by the vegetation and the room size can be measured as floor plan area or space volume.
5. Conclusions
The number of published papers investigating the effects of indoor plants on psychological perceptions has substantially increased since 1999 (Table 2). The 45 papers collected by this review study demonstrated that indoor plants positively affect self-reported perceptions. Specifically, indoor plants can boost positive emotions, reduce negative feelings, and relieve physical discomfort. To increase positive psychological perceptions, simple exposure to a couple of flower or foliage pots either with a small or moderate size at distances of within three meters to the occupants in a room for about 20 min is recommended. The beneficial effects of indoor plants provide practical references for policy makers, environmental planning and design professionals, and the general public. Because people today spend most of their time indoors [1] and are faced with increasingly severe physical and mental health and wellbeing problems [8], the use of indoor plants to provide physical and mental health benefits deserves more attention. This is not only a matter of public health but also of economic, societal, and environmental sustainability. Hopefully, guidelines and/or regulations for indoor plants will soon be established.
Author Contributions
Conceptualization, K.-T.H.; methodology, K.-T.H.; validation, K.-T.H. and L.-W.R.; formal analysis, K.-T.H. and L.-W.R.; investigation, K.-T.H. and L.-W.R.; resources, K.-T.H.; writing—original draft preparation, K.-T.H. and L.-W.R.; writing—review and editing, K.-T.H.; visualization, L.-W.R.; supervision, K.-T.H.; project administration, K.-T.H.; funding acquisition, K.-T.H.
Funding
This research was funded by the Ministry of Science and Technology in Taiwan (MOST 107-2410-H-167-008-MY2).
Conflicts of Interest
The authors declare no conflict of interest.
References
- American Lung Association. When You Can’t Breathe, Nothing Else Matters. Air Quality. 2001. Available online: www.lungusa.org/air/ (accessed on 27 September 2017).
- Dravigne, A.; Waliczek, T.M.; Lineberger, R.; Zajicek, J. The Effect of Live Plants and Window Views of Green Spaces on Employee Perceptions of Job Satisfaction. HortScience 2008, 43, 183–187. [Google Scholar] [CrossRef] [Green Version]
- Bringslimark, T.; Hartig, T.; Patil, G.G. The psychological benefits of indoor plants: A critical review of the experimental literature. J. Environ. Psychol. 2009, 29, 422–433. [Google Scholar] [CrossRef]
- Smardon, R.C. Perception and aesthetics of the urban environment: Review of the role of vegetation. Landsc. Urban Plan. 1988, 15, 85–106. [Google Scholar] [CrossRef]
- Manaker, G.H. Interior Plantscapes: Installation, Maintenance, and Management, 3rd ed.; Prentice-Hall: Englewood Cliffs, UK, 1996. [Google Scholar]
- Doxey, J.S.; Waliczek, T.M.; Zajicek, J.M. The Impact of Interior Plants in University Classrooms on Student Course Performance and on Student Perceptions of the Course and Instructor. HortScience 2009, 44, 384–391. [Google Scholar] [CrossRef]
- Han, K.T. Influence of passive versus active interaction with indoor plants on the restoration, behavior, and knowledge of students at a junior high school in Taiwan. Indoor Built Environ. 2018, 27, 818–830. [Google Scholar] [CrossRef]
- World Health Organization. World Health Report; World Health Organization: Geneva, Switzerland, 2001. [Google Scholar]
- Han, K.T. Urban Forestry: Theories and Applications; Lamper: Taipei, Taiwan, 1998. [Google Scholar]
- Bosch, M.V.D.; Sang, Å.O. Urban natural environments as nature-based solutions for improved public health—A systematic review of reviews. Environ. Res. 2017, 158, 373–384. [Google Scholar] [CrossRef] [PubMed]
- Moher, D.; Liberati, A.; Tetzlaff, J.; Altman, D.G.; The PRISMA Group. Preferred reporting items for systemic review and meta-analysis: The PRISMA statement. PLoS Med. 2009, 6, e1000097. [Google Scholar] [CrossRef] [PubMed]
- What Are the Most Spoken Languages in the World? Available online: https://www.fluentin3months.com/most-spoken-languages/ (accessed on 29 July 2019).
- Han, K.T. Restorative Nature: An. Overview of the Positive Influences of Natural Landscapes on Humans; Lambert Academic Publishing: Saarbrücken, Germany, 2011. [Google Scholar]
- Chiou, H.J. Quantitative Research and Statistical Analysis in Social & Behavioral Sciences; Wunan Publishing: Taipei, Taiwan, 2004. [Google Scholar]
- Frankfort-Nachmias, C.; Nachmias, D. Reasearch Methods in the Social Sciences; St. Martin’s Press: New York, NY, USA, 1996. [Google Scholar]
- Cook, T.D.; Campbell, D.T. Quasi-Experimentation: Design & Analysis issues for Field Settings; Hougton Mifflin: Boston, MA, USA, 1979. [Google Scholar]
- Larsen, L.; Adams, J.; Deal, B.; Kweon, B.S.; Tyler, E. Plants in the workplace: The effects of plant density on productivity, attitudes, and perceptions. Environ. Behav. 1998, 30, 261–281. [Google Scholar] [CrossRef]
- Higgins, J.P.T.; Altman, D.G. Chapter 8: Assessing risk of bias in included studies. In Cochrane Handbook for Systematic Reviews of Interventions; Higgins, J.P.T., Green, S., Eds.; John Wiley & Sons: London, UK, 2008; pp. 187–241. [Google Scholar]
- Liberati, A.; Altman, D.G.; Tetzlaff, J.; Mulrow, C.; Gøtzsche, P.C.; Ioannidis, J.P.A.; Clarke, M.; Devereaux, P.J.; Kleijnen, J.; Moher, D. The PRISMA Statement for Reporting Systematic Reviews and Meta-Analyses of Studies That Evaluate Health Care Interventions: Explanation and Elaboration. PLoS Med. 2009, 6, e1000100. [Google Scholar] [CrossRef]
- Liu, M.; Kim, E.; Mattson, R.H. Physiological and emotional influences of cut flower arrangements and lavender fragrance on university students. J. Ther. Hortic. 2003, 14, 18–27. [Google Scholar]
- Campbell, D.E. Interior office and visitor response. J. Appl. Psychol. 1979, 64, 648–653. [Google Scholar] [CrossRef]
- Lohr, V.I.; Pearson-Mims, C. H.; Goodwin, G.K. Interior plants may improve worker productivity and reduce stress in a windowless environment. J. Ther. Hortic. 1996, 14, 97–100. [Google Scholar]
- Fjeld, T.; Veiersted, B.; Sandvik, L.; Riise, G.; Levy, F. The Effect of Indoor Foliage Plants on Health and Discomfort Symptoms among Office Workers. Indoor Built Environ. 1998, 7, 204–209. [Google Scholar] [CrossRef]
- Adachi, M.; Rohde, C.; Kendle, A.D. Effects of Floral and Foliage Displays on Human Emotions. HortTechnology 2000, 10, 59–63. [Google Scholar] [CrossRef] [Green Version]
- Fjeld, T. The Effect of Interior Planting on Health and Discomfort among Workers and School Children. HortTechnology 2000, 10, 46–52. [Google Scholar] [CrossRef] [Green Version]
- Lohr, V.I.; Pearson-Mims, C.H. Physical Discomfort May Be Reduced in the Presence of Interior Plants. HortTechnology 2000, 10, 53–58. [Google Scholar] [CrossRef]
- Kim, E.; Mattson, R.H. Stress recovery effects of viewing red-flowering geraniums. J. Ther. Hortic. 2002, 13, 4–12. [Google Scholar]
- Park, S.H.; Mattson, R.; Kim, E. Pain tolerance effects of ornamental plants in a simulated hospital patient room. Acta Hortic. 2004, 639, 241–247. [Google Scholar] [CrossRef]
- Shibata, S.; Suzuki, N. Effects of an indoor plant on creative task performance and mood. Scand. J. Psychol. 2004, 45, 373–381. [Google Scholar] [CrossRef]
- Khan, A.R.; Younis, A.; Riaz, A.; Abbas, M.M. Effect of interior plantscaping on indoor academic environment. J. Agric. Res. 2005, 43, 235–242. [Google Scholar]
- Bringslimark, T.; Hartig, T.; Patil, G.G. Psychological Benefits of Indoor Plants in Workplaces: Putting Experimental Results into Context. HortScience 2007, 42, 581–587. [Google Scholar] [CrossRef] [Green Version]
- Dijkstra, K.; Pieterse, M.; Pruyn, A. Stress-reducing role of perceived attractiveness. Prev. Med. 2008, 47, 279–283. [Google Scholar] [CrossRef] [PubMed]
- Park, S.H.; Mattson, R.H. Effects of Flowering and Foliage Plants in Hospital Rooms on Patients Recovering from Abdominal Surgery. HortTechnology 2008, 18, 563–568. [Google Scholar] [CrossRef] [Green Version]
- Park, S.Y.; Song, J.S.; Kim, H.D.; Yamane, K.; Son, K.C. Effects of Interior Plantscapes on Indoor Environments and Stress Level of High School Students. J. Jpn. Soc. Hortic. Sci. 2008, 77, 447–454. [Google Scholar] [CrossRef] [Green Version]
- Han, K.T. Influence of limitedly visible leafy indoor plants on the psychology, behavior, and health of students at a junior high school in Taiwan. Environ. Behav. 2009, 41, 658–692. [Google Scholar] [CrossRef]
- Lim, Y.W.; Kim, H.H.; Yang, J.Y.; Kim, K.J.; Lee, J.Y.; Shin, D.C. Improvement of Indoor Air Quality by Houseplants in New-built Apartment Buildings. J. Jpn. Soc. Hortic. Sci. 2009, 78, 456–462. [Google Scholar] [CrossRef] [Green Version]
- Park, S.H.; Mattson, R.H. Therapeutic Influences of Plants in Hospital Rooms on Surgical Recovery. HortScience 2009, 44, 102–105. [Google Scholar] [CrossRef] [Green Version]
- Hung, C.Y.; Han, K.T. The Influence of Classroom Greening on Students’ Physical Psychology and Academic Performance-Taking Xinguang Guozhong in Taichung County as an Example. Sci. Agric. 2010, 58, 89–106. [Google Scholar]
- Kim, H.H.; Park, J.W.; Yang, J.Y.; Kim, K.J.; Lee, J.Y.; Shin, D.C.; Lim, Y.W. Evaluating the Relative Health of Residents in Newly Built Apartment Houses according to the Presence of Indoor Plants. J. Jpn. Soc. Hortic. Sci. 2010, 79, 200–206. [Google Scholar] [CrossRef] [Green Version]
- Raanaas, R.K.; Patil, G.G.; Hartig, T. Effects of an Indoor Foliage Plant Intervention on Patient Well-being during a Residential Rehabilitation Program. HortScience 2010, 45, 387–392. [Google Scholar] [CrossRef]
- Han, K.T.; Hung, C.Y. Influences of plants and their visibility, distance, and surrogate in a classroom on students’ psycho-physiology. J. Archit. Plann. 2011, 12, 1–22. [Google Scholar]
- Kim, H.H.; Lee, J.Y.; Yang, J.Y.; Kim, K.J.; Lee, Y.J.; Shin, D.C.; Lim, Y.W. Evaluation of Indoor Air Quality and Health Related Parameters in Office Buildings with or without Indoor Plants. J. Jpn. Soc. Hortic. Sci. 2011, 80, 96–102. [Google Scholar] [CrossRef]
- Brengman, M.; Willems, K.; Joye, Y. The Impact of In-Store Greenery on Customers. Psychol. Mark. 2012, 29, 807–821. [Google Scholar] [CrossRef]
- Han, K.T.; Hung, C.Y. Influences of physical interactions and visual contacts with plants on students’ psycho-physiology, behaviors, academic performance and health. Sci. Agric. 2012, 59, 195–210. [Google Scholar]
- Li, X.; Zhang, Z.; Gu, M.; Jiang, D.Y.; Wang, J.; Lv, Y.M.; Zhang, Q.X.; Pan, H.T. Effects of plantscape colors on psycho-physiological responses of university students. J. Food Agric. Environ. 2012, 10, 702–708. [Google Scholar]
- Li, X.; Lu, Y.M.; Zhang, Z.; Wang, J.; Pan, H.T.; Zhang, Q.X. The visual effects of flower colors on university students psycho-physiological responses. J. Food Agric. Environ. 2012, 10, 1294–1300. [Google Scholar]
- Elsadek, M.; Sayaka, S.; Fujii, E.; Koriesh, E.; Moghazy, E.; Elfatah, Y. A. Human emotional and psycho-physiological responses to plant color stimuli. J. Food Agric. Environ. 2013, 11, 1584–1591. [Google Scholar]
- Kim, H.H.; Lee, J.Y.; Kim, H.J.; Lee, Y.W.; Kim, K.J.; Park, J.H.; Shin, D.C.; Lim, Y.W. Impact of Foliage Plant Interventions in Classrooms on Actual Air Quality and Subjective Health Complaints. J. Jpn. Soc. Hortic. Sci. 2013, 82, 255–262. [Google Scholar] [CrossRef]
- Leng, H.B.; Zhang, X.J.; Zhou, X.; Sun, C.J.; Qin, J.; Lian, Z.W. Relationship between dominant feature of indoor plants and indoor environment satisfaction. J. Environ. Health 2013, 30, 1099–1102. [Google Scholar]
- Elsadek, M.; Fujii, E. People’s psycho-physiological responses to plantscape colors stimuli: A pilot study. Int. J. Psychol. Behav. Sci. 2014, 4, 70–78. [Google Scholar]
- Jang, H.S.; Kim, J.; Kim, K.S.; Pak, C.H. Human brain activity and emotional responses to plant color stimuli. Color Res. Appl. 2014, 39, 307–316. [Google Scholar] [CrossRef]
- Mangone, G.; Kurvers, S.; Luscuere, P. Constructing thermal comfort: Investigating the effect of vegetation on indoor thermal comfort through a four season thermal comfort quasi-experiment. Build. Environ. 2014, 81, 410–426. [Google Scholar] [CrossRef]
- Nieuwenhuis, M.; Knight, C.; Postmes, T.; Haslam, S.A. The relative benefits of green versus lean office space: Three field experiments. J. Exp. Psychol. Appl. 2014, 20, 199–214. [Google Scholar] [CrossRef] [PubMed]
- Qin, J.; Sun, C.; Zhou, X.; Leng, H.; Lian, Z. The effect of indoor plants on human comfort. Indoor Built Environ. 2014, 23, 709–723. [Google Scholar] [CrossRef]
- Lee, M.S.; Lee, J.; Park, B.J.; Miyazaki, Y. Interaction with indoor plants may reduce psychological and physiological stress by suppressing autonomic nervous system activity in young adults: A randomized crossover study. J. Physiol. Anthr. 2015, 34, 420. [Google Scholar] [CrossRef]
- Kim, H.; Kim, H.H.; Lee, J.Y.; Lee, Y.W.; Shin, D.C.; Kim, K.J.; Lim, Y.W. Evaluation of self-assessed ocular discomfort among students in classroom according to indoor plant intervention. HortTechnology 2016, 26, 386–393. [Google Scholar]
- Nejati, A.; Rodiek, S.; Shepley, M. Using visual simulation to evaluate restorative qualities of access to nature in hospital staff break areas. Landsc. Urban Plan. 2016, 148, 132–138. [Google Scholar] [CrossRef]
- Elsadek, M.; Sun, M.; Fujii, E. Psycho-physiological responses to plant variegation as measured through eye movement, self-reported emotion and cerebral activity. Indoor Built Environ. 2017, 26, 758–770. [Google Scholar] [CrossRef]
- Evensen, K.H.; Raanaas, R.K.; Hägerhäll, C.M.; Johansson, M. Nature in the office: An environmental assessment study. J. Archit. Plan. Res. 2017, 34, 133–146. [Google Scholar]
- Bogerd, N.V.D.; Dijkstra, S.C.; Seidell, J.C.; Maas, J. Greenery in the university environment: Students’ preferences and perceived restoration likelihood. PLoS ONE 2018, 13, e0192429. [Google Scholar]
- Yao, Y.; Huang, Q.; Li, S. Study on the relationship between green space around workplace and physical and mental health:IT professionals in Beijing as target population. Landsc. Archit. Health 2018, 34, 15–21. [Google Scholar]
- Hartig, T. Restorative environments. In Encyclopedia of Applied Psychology; Spielberger, C., Ed.; Academic Press: San Deigo, CA, USA, 2004; pp. 273–279. [Google Scholar]
- Ittelson, W.H.; Proshansky, H.M.; Rivlin, L.G.; Winkel, G.H. An Introduction to Environmental Psychology; Holt, Rinehart and Winston: New York, USA, 1974. [Google Scholar]
- Ohly, H.; White, M.P.; Wheeler, B.W.; Bethel, A.; Ukoumunne, O.C.; Nikolaou, V.; Garside, R. Attention Restoration Theory: A systematic review of the attention restoration potential of exposure to natural environments. J. Toxicol. Environ. Health Part B 2016, 19, 305–343. [Google Scholar] [CrossRef] [PubMed] [Green Version]
- Centre for Reviews and Dissemination. Nurs. Stand. 2009, 24, 30.
- Critical Appraisal Skills Programme. CASP UK Critical Appraisal Checklists; Critical Appraisal Skills Programme: Oxford, UK, 2013. [Google Scholar]
- Effective Public Health Practice Project. Quality Assessment Tool for Quantitative Studies. 2013. Available online: http://www.ephpp.ca/tools.html (accessed on 25 March 2019).
- Han, K.T. Effects of Indoor Plants on the Physical Environment with Respect to Distance and Green Coverage Ratio. Sustainability 2019, 11, 3679. [Google Scholar] [CrossRef]
- Gunawardena, K.; Steemers, K. Living walls in indoor environments. Build. Environ. 2019, 148, 478–487. [Google Scholar] [CrossRef]
- Innenraumbegrünungsrichtlinien. 2011. Available online: https://shop.fll.de/de/bauwerksbegruenung/innenraumbegruenungsrichtlinien-2011.html (accessed on 1 August 2019).
Figure 1.
Flow chart of the screening process.


Table 1.
Summary of empirical studies measuring the beneficial effects of indoor plants on psychological perceptions.
Table 1.
Summary of empirical studies measuring the beneficial effects of indoor plants on psychological perceptions.
| Source | Population | Interventions | Exposure Time | Distance to Plants | Room Size | Climate | Study Design | Psychological Perceptions | Outcomes | Publication Languages |
|---|---|---|---|---|---|---|---|---|---|---|
| Campbell, 1979 [21] | 251 US college students | 16 slides of a faculty office with or without four plants | Experiment | Emotion | Slides with plants produced higher level of comfort and were more welcoming to visitors than those without. | English | ||||
| Lohr, Pearson-Mims, and Goodwin, 1996 [22] | 96 US adults | Presence of 17 pots of plants in an indoor space | 13.5 × 7.3 × 2.6 m | 27 °C, 38% humidity, 420 lux | Field experiment | Cognition | Participants exhibited higher concentrations in an environment with the plants. | English | ||
| Fjeld, Veiersted, Sandvik, Riise, and Levy, 1998 [23] | 51 Norwegian office workers | 13 plants and a pot with five plants | Two spring periods of 3 months | 10 m2 | 22–24 °C | Field experiment | Health | The percentages by which the score sum of negative reactions decreased were observed: Discomfort symptoms (23%); complaints for coughing (37%); complaints for fatigue (30%); and levels of dry and hoarse throat as well as dry and itchy facial skin (23%). | English | |
| Larsen, Adams, Deal, Kweon, and Tyler, 1998 [17] | 81 US adults | A room with 22 pots of plants occupying 17.88% of the space, a room with 10 pots of plants occupying 7.16% of the space, and a room without plants | 20–30 min | 12 m2 | Experiment | Emotion | The room with 22 pots of plants was the most attractive. | English | ||
| Adachi, Rohde, and Kendle, 2000 [24] | 58 adults | The presence of 3 flower pot arrangements and 5 pots of foliage plants while watching videos | Experiment | Emotion | Videos were perceived as more attractive with the presence of flower pot arrangements than were the videos watched without the presence of flower pot arrangements | English | ||||
| Fjeld, 2000 [25] | Study 1: 51 Norwegian office workers Study 2: 48 X-ray department staff of a Norwegian hospital Study 3: 120 Norwegian junior high school students | Study 1: Presence of 13 pots of foliage plants in an office Study 2: Presence of pots of 23 foliage plants and a full-spectrum fluorescent lamp in an office Study 3: Presence of plants and a full-spectrum fluorescent lamp in a classroom | Study 1: Two spring periods of 3 months Study 2: 4 months Study 3: 12 months | Study 1: 10 m2 Study 2: 80 m2 | Study 3: 700–800 lux | Study 1: Field experiment Study 2: Field quasi-experiment Study 3: Field quasi-experiment | Health | Study 1: The score of health complaints among employees was significantly lower when the foliage plants were present than when they were absent. Study 2: The score of health complaints among employees decreased by 25% with fewer instances of fatigue, sleepiness, headache, dry and hoarse throat, and dry and itchy hands when the foliage plants were present than when they were not. Study 3: Health complaints among students decreased by 21% with fewer occasions of headache, dry and itchy eyes, and dry and hoarse throat in the classroom displaying plants than in the classroom without plants. | English | |
| Lohr and Pearson-Mims, 2000 [26] | 198 US adults | Presence of 5 pots of plants in a room where a pain-tolerance test involving participants submerging their hands in ice water was performed | Approx. 17 min | 3.5 × 6 × 2.4 m | 23 °C, 34% humidity, 703 lux | Experiment | Emotion | Prior to the test, participants reported higher levels of feeling carefree and friendly in the room with plants than in rooms without plants. After the test, participants felt happier in the presence of plants than with the absence of plants. | English | |
| Kim and Mattson, 2002 [27] | 150 US college students | The presence of 9 red-flowering geraniums | 20 min | 1.8 m | 22.4 °C | Experiment | Emotion, cognition | Participants reported more positive emotions and greater concentration in the presence of plants than in the space without plants. | English | |
| Liu, Kim, and Mattson, 2003 [20] | 66 US college students | The presence of a 45 x 45 x 45-cm flower pot arrangement | 30 min | 21 °C, 10.6 μmol·m−2s−1 | Experiment | Emotion | Participants reported more positive emotions when a flower pot arrangement was placed in the experiment room than in the room without plants. | English | ||
| Park, Mattson, and Kim, 2004 [28] | 90 female US college students | The presence of 10 pots of plants or seven pots of flowering plants when a pain-tolerance test was performed, in which participants submerged their hands in ice water | 40 min | 3.9 × 2.3 × 2.7 m | 21.7 °C, 904 lux | Experiment | Health | Participants perceived lower levels of pain and discomfort in the presence of plants than in the absence of plants. | English | |
| Shibata and Suzuki, 2004 [29] | 90 Japanese college students | A room with a 150-cm-tall plant, a magazine rack, or nothing placed 2.5 m in front of the participant | 15 min | Approx. 2.9 m | 2.78 × 5.81 × 2.35 m | Experiment | Emotion | Participants in the presence of plants reported more peaceful moods than when in the presence of the other two objects. | English | |
| Khan, Younis, Riaz, and Abbas, 2005 [30] | 250 faculty members and students from a university in Pakistan | The presence of indoor plants | Survey | Emotion, cognition | Indoor plants increased the pleasantness of the indoor landscapes; 76.8% of participants believed that indoor plants were helpful for improving academic performance. | English | ||||
| Bringslimark, Hartig, and Patil, 2007 [31] | 385 Norwegian employees | The presence of plants at several positions in a workplace | Survey | Health, productivity | The number of plants near work desks was correlated with health and productivity. | English | ||||
| Dijkstra, Pieterse, and Pruyn, 2008 [32] | 77 Dutch college students | Slides of a ward with and without 2 pots of plants | Experiment | Emotion | The slide of the ward with plants was perceived as more attractive than was the one without. Such attractiveness led to stress relief and physical and mental restoration. | English | ||||
| Dravigne, Waliczek, Lineberger, and Zajicek, 2008 [2] | 449 US office workers | The presence of plants | Survey | Emotion | People staying in the room with plants showed higher job satisfaction and higher quality of life than those in the room without plants. | English | ||||
| Park and Mattson, 2008 [33] | 90 patients receiving surgery | The presence of 12 pots of flowering plants in a ward | Field experiment | Emotion | Compared with patients staying in a plant-free ward, patients staying in the ward with plants exhibited lower anxiety and fatigue and greater satisfaction, relaxation, comfort, and warmth. | English | ||||
| Park, Song, Kim, Yamane, and Son, 2008 [34] | 23 South Korean female high school students | The presence of plants in a classroom | 15 weeks | Field quasi-experiment | Emotion | The presence of plants significantly reduced students’ stress. | English | |||
| Han, 2009 [35] | 76 Taiwanese junior high school students | The presence of plants (6 pots of plants 135 × 80 cm in height and width, with a green coverage of 6% in the room) | 12 weeks | Field quasi-experiment | Emotion | Students in the room with plants presented immediately stronger preferences, comfort, and friendliness than their control group counterparts. | English | |||
| Lim et al., 2009 [36] | 82 families | The presence of indoor plants | Survey | Health | Indoor plants and ventilation helped relieve symptoms of sick building syndrome. | English | ||||
| Park and Mattson, 2009 [37] | 80 South Korean female patients receiving surgery | The presence of 12 pots of flowering plants in a ward | Field experiment | Health | Patients in the ward with plants had lower perceived pain than those in the ward without plants. | English | ||||
| Hung and Han, 2010 [38] | 36 Taiwanese junior high school students | Placing 9 pots of plants or colorful photos of 9 pots of plants at the front or back of a classroom | 18 weeks | Field experiment | Emotion, restoration | When plants were placed at the front of the classroom, participants had greater friendliness. Students in the classroom with plants immediately perceived greater wellbeing. Real plants are associated with greater restorative components as well as higher student preferences, comfort, friendliness, perceived wellbeing and restoration than did the pictures. Sitting near a plant could immediately increase attractiveness. Levels of perceived preferences, comfort, wellbeing, restoration, and restorative components increased with the duration that plants were placed in the classroom. | Chinese | |||
| Kim et al., 2010 [39] | 82 residents of a newly built apartment in South Korea | The presence of plants in residences | Survey | Health | The presence of indoor plants and indoor ventilation created benefits for mental health and relieved symptoms of sick building syndrome. | English | ||||
| Raanaas, Patil, and Hartig, 2010 [40] | 282 Norwegian patients with heart or lung diseases | The presence of 28 pots of plants in the public area of a rehabilitation center | 4 weeks | Field quasi-experiment | Emotion | Patients in the ward with plants had higher satisfaction, yet only patients with lung diseases perceived greater wellbeing. | English | |||
| Han and Hung, 2011 [41] | 35 Taiwanese junior high school students | Placing 9 pots of plants and colorful photos of 9 pots of plants at the front or back of a classroom | 18 weeks | Field experiment | Emotion, restoration | Indoor plants helped improve perceived wellbeing. Plants placed at the front of a classroom were more likely to alleviate anxiety than plants being placed at the back. Additionally, placing plants at the back increased the perceived wellbeing more effectively than did placing colorful plant photos at the same spot. Furthermore, students sitting near a real plant or plant photo perceived lower anxiety than their classmates sitting far away. | Chinese | |||
| Kim et al., 2011 [42] | 71 Korean office workers | The presence of 22 and 25 pots of plants in new and old office buildings, respectively | 10 months | New building: 105 m2 Old building: 135 m2 | Survey | Health | The plants and ventilation in the old building helped reduce symptoms of sick building syndrome. | English | ||
| Brengman, Willems, and Joye, 2012 [43] | 4293 Dutch consumers | The presence of plants in the picture of a store | Survey | Emotion | Placing plants in stores did not trigger excitement, but did trigger happiness and reduced stress derived from a complex store layout. | English | ||||
| Han and Hung, 2012 [44] | 36 Taiwanese junior high school students | Placing 34 pots of plants inside and outside a classroom (green coverage rate inside the classroom = 6.3%) | 18 weeks | Field experiment | Emotion, restoration | Students who cared for plants perceived decreased anxiety and increased wellbeing, compared with their counterparts who did not. Students sitting near a plant reported lower anxiety and perceived greater wellbeing and attractiveness of plants compared with those sitting farther away. | Chinese | |||
| Li et al., 2012a [45] | 30 Chinese college students | Presenting 5 photos of vegetation landscapes to participants | 2 min | 0.5 m | 7 × 4 × 3 m | 25 °C, 40% humidity | Experiment | Emotion | Purple and green plants more effectively reduced levels of anger, fatigue, and anxiety than red, yellow, and white plants. | English |
| Li et al., 2012b [46] | 30 Chinese college students | Presenting 12 photos of flowers to participants | 2 min | 0.5 m | 7 × 4 × 3 m | 25 °C, 40% humidity | Experiment | Emotion | Pink and white flowers alleviated negative emotions including anxiety, anger, and fatigue; red and yellow plants stimulated vitality. Participants viewing photos of different colors revealed significantly different anxiety levels, whereas such difference was nonsignificant regarding plant species. | English |
| Elsadek et al., 2013 [47] | 29 Japanese college students | Five Hedera helix L. of different colors | 5 min | 0.5 m | Experiment | Emotion | More women reported stronger preferences for white plants than did men; yellow plants helped increase positive emotions for both men and women, whereas red plants stimulated perceived warmth and luxury. | English | ||
| Kim et al., 2013 [48] | 115 Korean elementary school students | Presence of plants in classrooms at two newly built elementary schools | 95 days | 9 × 7.5 m | Quasi-experiment | Health | Indoor plants reduced symptoms of sick building syndrome. | English | ||
| Leng et al., 2013 [49] | 16 Chinese college students | Seven types of environment (a nonplant environment and six environments with different plants) | 5 min | 6 × 5 × 3.2 m | Experiment | Satisfaction | 75% of participants reported greater satisfaction with environments with plants than with a nonplant environment. The scent, color, leaf size, and number of plants were significantly correlated with satisfaction. | Chinese | ||
| Elsadek and Fujii, 2014 [50] | 28 Japanese college students | Three plants in different colors | 3 min | 1.5 m | 59.4 m2 | 23 °C, 55% humidity, 700 lux | Experiment | Emotion | Both men and women preferred the green Spathiphyllum wallisii, disliked the green–red Cordyline terminalis the most, and exhibited neutral preferences for the white Aglaonema pictum. | English |
| Jang, Kim, Kim, and Pak, 2014 [51] | 30 Korean college students | Five plants of different colors | 5 min | 1 m | 7 × 4.5 × 2.8 m | 25 °C, 70% humidity, 700 lux | Experiment | Emotion | Green plants, green plants with white flowers, and green plants with yellow flowers generated feelings of comfort and pleasantness, whereas green plants with pink flowers and green plants with red flowers stimulated active brain functions and anxiety. | English |
| Mangone et al., 2014 [52] | 67 Dutch office workers | The presence of plants in offices | 4 months | 10,000 m2 | Quasi-experiment | Thermal comfort | Plant placement significantly affected perceived thermal comfort. | English | ||
| Nieuwenhuis, Knight, Postmes, and Haslam, 2014 [53] | Study 1: 67 UK office workers Study 2: 81 Dutch office workers Study 3: 33 UK office workers | Study 1: Presence of plants Study 2: Presence of plants Study 3: Presence of plants | Study 1: 3 weeks Study 2: 2 weeks, 3.5 months | Study 1: 4875 m2 Study 2: 360 m2 | Study 1: Field experiment Study 2: Quasi-experiment Study 3: Field experiment | Study 1: Emotion, cognition Study 2: Emotion, cognition Study 3: Cognition | Study 1: Indoor plants helped improve concentration, air quality, and productivity. Study 2: Indoor plants helped improve satisfaction and air quality; these levels were maintained for 3.5 months. The adopted plants also helped reduce disengagement. Study 3: Indoor plants helped improve the spatial quality of an office. | English | ||
| Qin, Sun, Zhou, Leng, and Lian, 2014 [54] | 16 Chinese college students | Presence of 3 plants with different colors, scents, and sizes. | 10–15 min | Experiment | Emotion | Greater satisfaction was perceived in the presence of plants than in the absence of plants. Small green plants with a slight scent yielded the highest satisfaction levels. | English | |||
| Lee, Lee, Park, and Miyazaki, 2015 [55] | 24 South Korean male adults | A task involving transplanting an indoor plant and a computer task | 15 min | 20.8 °C, 57.7% humidity, 1365.5 lux | Experiment | Emotion | Participants felt comfortable, soothed, and natural after completing the transplant task. | English | ||
| Kim et al., 2016 [56] | 115 South Korean elementary school students | The presence of plants in classrooms at two newly built elementary school | 113 days | 7.7 × 9 m | 15–25°C | Quasi-experiment | Health | Indoor plants helped reduce the frequency and alleviate symptoms associated with eye grittiness and other ocular discomfort. | English | |
| Nejati, Rodiek, and Shepley, 2016 [57] | 958 US nurses | 10 photos of indoor spaces | Survey | Restoration | Photos with plants were more conducive to relieving stress and restoring energy than non-plant photos. | English | ||||
| Elsadek, Sun, and Fujii, 2017 [58] | 30 Egyptian male adult students | Five Hedera helix L. of different colors | 3 min | 0.5 m | 59.4 m2 | 21 °C, 55% humidity | Experiment | Emotion | Yellowish-green and fresh green helped enhance comfort and calmness; red and dark green increased energy; and white increased negative emotions. | English |
| Evensen et al., 2017 [59] | Study 1: 56 Norwegian college students Study 2: 46 Norwegian college students | Study 1: An office with plants and inanimate objects, an office with only inanimate objects and an office without any plants or inanimate objects Study 2: Three slides of the office used in study 1 | Study 1: 15 min Study 2: 25 min | 2.1 × 3.9 × 3.6 m | Experiment | Emotion | Participants perceived significantly greater pleasantness in the office with plants than in the other two offices. | English | ||
| Han, 2018 [7] | 35 Taiwanese junior high school students | The presence of 45 plants inside and outside a classroom (green coverage inside the classroom = 3.1%) | 18 weeks | Field experiment | Emotion, restoration, knowledge | Participants who cared for plants had lower stress than those who did not. Interactions with plants helped students restore concentration. Plant-related knowledge increased with time spent caring for plants. | English | |||
| van den Bogerd et al., 2018 [60] | 722 Dutch college students | Six indoor photos and 4 outdoor photos | Survey | Emotion | Students preferred the picture of an indoor environment containing natural-landscape posters, green walls, and indoor plants. | English | ||||
| Yao et al., 2018 [61] | 351 employees working in the Chinese information technology industry | Changing the number of plants placed inside an office and those on office desks | Survey | Emotion, health | The number of indoor plants slightly affected participants’ health; the number of indoor plants in an office was significantly and negatively correlated with participants’ stress, anxiety, depression, fatigue, and somatic symptom disorders. | Chinese |
Table 2.
Statistics of Chinese and English papers for each decade.
| Publication Year | Publication Languages | Total | ||||
|---|---|---|---|---|---|---|
| Chinese | English | |||||
| Frequency | Percentage (%) | Frequency | Percentage (%) | Frequency | Percentage (%) | |
| 1979–1988 | 0 | 0 | 1 | 2.5 | 1 | 2.22 |
| 1989–1998 | 0 | 0 | 3 | 7.5 | 3 | 6.67 |
| 1999–2008 | 0 | 0 | 13 | 32.5 | 13 | 28.89 |
| 2009–2018 | 5 | 100 | 23 | 57.5 | 28 | 62.22 |
| Total | 5 | 100 | 40 | 100 | 45 | 100 |
Table 3.
Statistics of study designs.
| Study Design | Frequency | Percentage (%) |
|---|---|---|
| Experimental | 19 | 38.78 |
| Field experimental | 11 | 22.45 |
| Survey | 10 | 20.41 |
| Field quasi-experimental | 5 | 10.20 |
| Quasi-experimental | 4 | 8.16 |
| Total | 49 | 100 |
Table 4.
Statistics of psychological perceptions.
| Psychological Perceptions | Frequency | Percentage (%) |
|---|---|---|
| Emotion | 31 | 56.36 |
| Health | 11 | 20.00 |
| Restoration | 5 | 9.09 |
| Cognition | 4 | 7.27 |
| Knowledge | 1 | 1.82 |
| Thermal comfort | 1 | 1.82 |
| Satisfaction | 1 | 1.82 |
| Productivity | 1 | 1.82 |
| Total | 55 | 100 |
Table 5.
Participant nationalities.
| Participant Nationalities | Frequency | Percentage (%) |
|---|---|---|
| American | 9 | 20.45 |
| South Korean | 7 | 15.91 |
| Norwegian | 5 | 11.36 |
| Dutch | 5 | 11.36 |
| Taiwanese | 5 | 11.36 |
| Chinese | 5 | 11.36 |
| British | 3 | 6.82 |
| Japanese | 3 | 6.82 |
| Pakistani | 1 | 2.27 |
| Egyptian | 1 | 2.27 |
| Total | 44 | 100 |
Not every study reported participant nationalities.
Table 6.
Quality appraisal of included studies.
| Quality Indicators | Campbell, 1979 [21] | Lohr et al., 1996 [22] | Fjeld et al., 1998 [23] | Larsen et al., 1998 [17] | Adachi et al., 2000 [24] | Fjeld, 2000 [25] | Lohr and Pearson-Mims, 2000 [26] | Kim and Mattson, 2002 [27] | Liu et al., 2003 [20] | |
| Study Design | Power calculation reported | No | No | No | No | No | Study 1: No Study 2: No Study 3: No | No | No | No |
| Inclusion/exclusion criteria reported | No | No | Yes | No | No | Study 1: No Study 2: No Study 3: No | No | No | No | |
| Individual level allocation | No | No | Yes | Yes | Yes | Study 1: No Study 2: No Study 3: No | Yes | Yes | Yes | |
| Random allocation to groups/Condition/order | Yes | Yes | Yes | Yes | Unclear | Study 1: Yes Study 2: No Study 3: No | Yes | Yes | Yes | |
| Randomization procedure appropriate | Partial | Yes | Yes | Yes | Unclear | Study 1: Yes Study 2: No Study 3: No | Unclear | Yes | Yes | |
| Confounders | Groups similar (sociodemographic) | Unclear | Unclear | Unclear | Unclear | Partial | Study 1: Un. Study 2: Un. Study 3: Un. | Yes | Yes | Unclear |
| Group balanced at baseline | Unclear | Unclear | Unclear | Unclear | Unclear | Study 1: Un. Study 2: Un. Study 3: Un. | Unclear | Unclear | Unclear | |
| Participants blind to research question | Unclear | Yes | Unclear | Yes | Yes | Unclear | Unclear | Unclear | Yes | |
| Intervention integrity | Clear description of intervention and control | Yes | Yes | Yes | Yes | Yes | Study 1: Yes Study 2: Yes Study 3: Yes | Yes | Yes | Yes |
| Consistency of intervention (within and between groups) | Partial | Yes | Yes | Yes | Yes | Study 1: Pa. Study 2: Yes Study 3: No | Yes | Yes | Yes | |
| Data collection methods | Outcome assessors blind to group allocation | Yes | No | Unclear | No | Unclear | Unclear | Unclear | Unclear | Yes |
| Baseline measures taken before the intervention | Unclear | Yes | Unclear | Unclear | Unclear | Study 1: Unclear Study 2: Unclear Study 3: Unclear | Unclear | Unclear | Unclear | |
| Consistency of data collection | Yes | Yes | Yes | Yes | Yes | Study 1: Partial Study 2: Partial Study 3: Partial | Yes | Yes | Yes | |
| Analyses | All outcomes reported (means and SD/SE) | Yes | No | Yes | Yes | No | Study 1: No Study 2: No Study 3: No | No | No | No |
| All participants accounted for (i.e., losses/ exclusions) | Yes | Yes | No | Yes | Yes | Study 1: Yes Study 2: Yes Study 3: Yes | Yes | Yes | Yes | |
| ITT analysis conducted (all data included after allocation) | Unclear | Unclear | No | Unclear | Unclear | Study 1: Unclear Study 2: Unclear Study 3: Unclear | Unclear | Unclear | Unclear | |
| Individual level analysis | Yes | Yes | Yes | Yes | Yes | Study 1: Yes Study 2: Yes Study 3: Yes | Yes | Yes | Yes | |
| Statistical analysis methods appropriate for study design | Yes | Yes | Yes | Yes | Yes | Study 1: Yes Study 2: Yes Study 3: Yes | Yes | Yes | Yes | |
| External validity | Sample representative of target population | No | No | No | No | No | Study 1: No Study 2: No Study 3: No | No | No | No |
| Overall quality score | Total number of points (out of possible 38) | 18 | 20 | 20 | 22 | 17 | Study 1: 14 Study 2: 11 Study 3: 9 | 18 | 20 | 22 |
| Quality rating as percent | 47.4 | 52.6 | 52.6 | 57.9 | 44.7 | Study 1: 36.8 Study 2: 28.9 Study 3: 23.7 | 47.4 | 52.6 | 57.9 | |
| Responded to query about “uncertain” ratings | Yes | Yes | No | Yes | NA | No | No | NA | Yes | |
| Quality Indicators | Park et al., 2004 [28] | Shibata and Suzuki, 2004 [29] | Khan et al., 2005 [30] | Bringslimark et al., 2007 [31] | Dijkstra et al., 2008 [32] | Dravigne et al., 2008 [2] | Park and Mattson, 2008 [33] | Park et al., 2008 [34] | Han, 2009 [35] | |
| Study Design | Power calculation reported | No | No | No | No | No | No | No | No | No |
| Inclusion/ exclusion criteria reported | No | No | No | No | No | Yes | Yes | No | Yes | |
| Individual level allocation | Yes | Yes | NA | NA | Yes | NA | Yes | No | No | |
| Random allocation to groups/ Condition/ order | Yes | Yes | NA | NA | Yes | NA | Yes | No | No | |
| Randomization procedure appropriate | Yes | Yes | NA | NA | Yes | NA | Yes | No | No | |
| Confounders | Groups similar (sociodemographic) | Yes | Unclear | Unclear | Unclear | Unclear | Partical | Unclear | Unclear | Partial |
| Group balanced at baseline | Unclear | Unclear | Unclear | Unclear | Unclear | Unclear | Unclear | Unclear | Unclear | |
| Participants blind to research question | Unclear | Yes | No | Yes | Unclear | Unclear | Yes | Unclear | Yes | |
| Intervention integrity | Clear description of intervention and control | Yes | Yes | Unclear | No | Yes | No | Yes | Yes | Yes |
| Consistency of intervention (within and between groups) | Yes | Yes | Unclear | No | Yes | No | Yes | No | Yes | |
| Data collection methods | Outcome assessors blind to group allocation | Unclear | No | NA | NA | Unclear | Unclear | Unclear | Unclear | No |
| Baseline measures taken before the intervention | No | Yes | Unclear | No | No | No | No | Yes | Yes | |
| Consistency of data collection | Yes | Yes | Yes | Yes | Yes | Yes | Yes | Yes | Yes | |
| Analyses | All outcomes reported (means and SD/SE) | No | Yes | No | No | No | Yes | No | No | No |
| All participants accounted for (i.e., losses/ exclusions) | Yes | Yes | No | No | Yes | No | Yes | Yes | Yes | |
| ITT analysis conducted (all data included after allocation) | Unclear | Unclear | NA | NA | Unclear | NA | Unclear | Unclear | No | |
| Individual level analysis | Yes | Yes | Yes | Yes | Yes | Yes | Yes | Yes | Ye | |
| Statistical analysis methods appropriate for study design | Yes | Yes | No | Yes | Yes | Yes | Yes | Yes | Yes | |
| External validity | Sample representative of target population | No | No | No | No | No | No | No | No | No |
| Overall quality score | Total number of points (out of possible 38) | 20 | 24 | 4 | 8 | 18 | 11 | 22 | 12 | 19 |
| Quality rating as percent | 52.6 | 63.2 | 10.5 | 21.1 | 47.4 | 28.9 | 57.9 | 31.6 | 50.0 | |
| Responded to query about “uncertain” ratings | NA | Yes | No | No | No | No | No | |||
| Quality Indicators | Lim et al., 2009 [36] | Park and Mattson, 2009 [37] | Hung and Han, 2010 [38] | Kim et al., 2010 [39] | Raanaas et al., 2010 [40] | Han and Hung, 2011 [41] | Kim et al., 2011 [42] | Brengman et al., 2012 [43] | Han and Hung, 2012 [44] | |
| Study Design | Power calculation reported | No | No | No | No | No | No | No | No | No |
| Inclusion/exclusion criteria reported | No | Yes | No | No | No | No | No | No | No | |
| Individual level allocation | No | Yes | No | Yes | No | No | No | Yes | Yes | |
| Random allocation to groups/ Condition/order | No | Yes | Yes | No | No | Yes | No | Yes | Yes | |
| Randomization procedure appropriate | No | Yes | Yes | No | No | Yes | No | Yes | Yes | |
| Confounders | Groups similar (sociodemographic) | Unclear | Unclear | Unclear | Unclear | Unclear | Yes | Unclear | Yes | Yes |
| Group balanced at baseline | Unclear | Unclear | Unclear | Unclear | Yes | Unclear | Unclear | Unclear | Unclear | |
| Participants blind to research question | Unclear | Yes | Yes | Unclear | Unclear | Yes | Unclear | Yes | Yes | |
| Intervention integrity | Clear description of intervention and control | Yes | Yes | Yes | Yes | Yes | Yes | Yes | Yes | Yes |
| Consistency of intervention (within and between groups) | No | Yes | Yes | No | Yes | Yes | No | Yes | Yes | |
| Data collection methods | Outcome assessors blind to group allocation | Unclear | Unclear | No | Unclear | Unclear | No | Unclear | No | No |
| Baseline measures taken before the intervention | Yes | No | Yes | Yes | Yes | Yes | No | No | Yes | |
| Consistency of data collection | Yes | Yes | Yes | Yes | Partial | Yes | Yes | Yes | Yes | |
| Analyses | All outcomes reported (means and SD/SE) | No | No | Partial | No | No | No | No | No | No |
| All participants accounted for (i.e., losses/ exclusions) | No | Yes | Yes | Yes | No | Yes | Yes | No | Yes | |
| ITT analysis conducted (all data included after allocation) | Unclear | Unclear | Unclear | Unclear | No | Unclear | Unclear | No | Unclear | |
| Individual level analysis | No | Yes | Yes | Yes | Yes | Yes | Yes | Yes | Yes | |
| Statistical analysis methods appropriate for study design | No | Yes | Yes | Yes | Yes | Yes | Yes | Yes | Yes | |
| External validity | Sample representative of target population | No | No | No | No | No | No | No | Yes | No |
| Overall quality score | Total number of points (out of possible 38) | 6 | 22 | 21 | 14 | 13 | 22 | 10 | 22 | 24 |
| Quality rating as percent | 15.8 | 57.9 | 55.3 | 36.8 | 34.2 | 57.9 | 26.3 | 57.9 | 63.2 | |
| Responded to query about “uncertain” ratings | No | No | No | No | No | Yes | ||||
| Quality Indicators | Li et al., 2012a [45] | Li et al., 2012b [46] | Elsadek et al., 2013 [47] | Kim et al., 2013 [48] | Leng et al., 2013 [49] | Elsadek and Fujii, 2014 [50] | Jang et al., 2014 [51] | Mangone et al., 2014 [52] | Nieuwenhuis et al., 2014 [53] | |
| Study Design | Power calculation reported | No | No | No | No | Yes | No | No | No | Study 1: No Study 2: No Study 3: No |
| Inclusion/ exclusion criteria reported | Yes | Yes | Yes | No | Yes | Yes | Yes | No | Study 1: Yes Study 2: No Study 3: No | |
| Individual level allocation | Yes | Yes | Yes | No | No | Yes | Yes | No | Study 1: No Study 2: No Study 3: No | |
| Random allocation to groups/ Condition/order | Yes | Yes | Yes | No | Unclear | Yes | Yes | No | Study 1: Yes Study 2: No Study 3: Yes | |
| Randomization procedure appropriate | Yes | Yes | Yes | No | Unclear | Yes | Unclear | No | Study 1: Yes Study 2: No Study 3: Yes | |
| Confounders | Groups similar (sociodemographic) | Unclear | Unclear | Unclear | Unclear | Unclear | Unclear | Unclear | Unclear | Study 1: Pa. Study 2: Yes Study 3: Un |
| Group balanced at baseline | Unclear | Unclear | Unclear | Unclear | Unclear | Unclear | Unclear | Unclear | Study 1: Unclear Study 2: Unclear Study 3: Unclear | |
| Participants blind to research question | Unclear | Unclear | No | Unclear | Unclear | Yes | Unclear | Yes | Study 1: Yes Study 2: Yes Study 3: Yes | |
| Intervention integrity | Clear description of intervention and control | Yes | Yes | Yes | Yes | Yes | Yes | Yes | Yes | Study 1: Yes Study 2: Yes Study 3: Yes |
| Consistency of intervention (within and between groups) | Yes | Yes | Yes | No | Yes | Yes | Yes | Yes | Study 1: No Study 2: Yes Study 3: No | |
| Data collection methods | Outcome assessors blind to group allocation | Unclear | Unclear | No | Unclear | Unclear | Unclear | Unclear | Unclear | Study 1: No Study 2: No Study 3: No |
| Baseline measures taken before the intervention | Yes | Yes | Yes | Yes | Yes | No | No | No | Study 1: Yes Study 2: Yes Study 3: No | |
| Consistency of data collection | Yes | Yes | Yes | Yes | Yes | Yes | Yes | Yes | Study 1: Yes Study 2: Yes Study 3: Yes | |
| Analyses | All outcomes reported (means and SD/SE) | Yes | Yes | No | No | No | No | Yes | Yes | Study 1: Yes Study 2: Yes Study 3: No |
| All participants accounted for (i.e., losses/ exclusions) | Yes | Yes | Yes | Yes | Yes | Yes | Yes | Yes | Study 1: No Study 2: No Study 3: Yes | |
| ITT analysis conducted (all data included after allocation) | Unclear | Unclear | Unclear | Unclear | Unclear | Unclear | Unclear | Unclear | Study 1: Un Study 2: Un Study 3: Un | |
| Individual level analysis | Yes | Yes | Yes | Yes | Yes | Yes | Yes | Yes | Study 1: Yes Study 2: Yes Study 3: Yes | |
| Statistical analysis methods appropriate for study design | Yes | Yes | Yes | Yes | Yes | Unclear | Yes | Yes | Study 1: Yes Study 2: Yes Study 3: Yes | |
| External validity | Sample representative of target population | No | No | No | No | No | No | No | No | Study 1: No Study 2: No Study 3: No |
| Overall quality score | Total number of points (out of possible 38) | 24 | 24 | 22 | 12 | 18 | 20 | 20 | 16 | Study 1: 21 Study 2: 18 Study 3: 16 |
| Quality rating as percent | 63.2 | 63.2 | 57.9 | 31.6 | 47.4 | 52.6 | 52.6 | 42.1 | Study 1: 55.3 Study 2: 47.4 Study 3: 42.1 | |
| Responded to query about “uncertain” ratings | No | No | Yes | No | No | No | No | No | Yes | |
| Quality Indicators | Qin et al., 2014 [54] | Lee et al., 2015 [55] | Kim et al., 2016 [56] | Nejati et al., 2016 [57] | Elsadek et al., 2017 [58] | Evensen et al., 2017 [59] | Han, 2018 [7] | van den Bogerd et al., 2018 [60] | Yao et al., 2018 [61] | |
| Study Design | Power calculation reported | Yes | No | No | No | No | Study 1: No Study 2: No | No | No | No |
| Inclusion/ exclusion criteria reported | Yes | No | No | No | Yes | Study 1: No Study 2: No | No | Yes | Yes | |
| Individual level allocation | No | Yes | No | NA | Yes | Study 1: Yes Study 2: Yes | No | Yes | NA | |
| Random allocation to groups/ Condition/ order | Unclear | Yes | No | NA | Yes | Study 1: Yes Study 2: Yes | Yes | Yes | NA | |
| Randomization procedure appropriate | Unclear | Yes | No | NA | Unclear | Study 1: Un. Study 2: Un. | Yes | Unclear | NA | |
| Confounders | Groups similar (sociodemographic) | Unclear | Unclear | Unclear | Unclear | Unclear | Study 1: Un. Study 2: Un. | Yes | Unclear | Unclear |
| Group balanced at baseline | Unclear | Unclear | Unclear | Unclear | Unclear | Study 1: Un. Study 2: Un. | Yes | Unclear | Unclear | |
| Participants blind to research question | Unclear | Unclear | Unclear | Yes | Unclear | Study 1: Yes Study 2: Yes | Yes | Unclear | Unclear | |
| Intervention integrity | Clear description of intervention and control | Yes | Yes | Yes | Yes | Yes | Study 1: Yes Study 2: Yes | Yes | Yes | Yes |
| Consistency of intervention (within and between groups) | No | Yes | No | Yes | Yes | Study 1: Yes Study 2: Yes | Partial | No | No | |
| Data collection methods | Outcome assessors blind to group allocation | Unclear | Unclear | Unclear | Yes | Unclear | Study 1: Un. Study 2: Un. | No | Unclear | Unclear |
| Baseline measures taken before the intervention | No | No | Yes | No | No | Study 1: No Study 2: No | Yes | No | No | |
| Consistency of data collection | Yes | Yes | Yes | Yes | Yes | Study 1: Yes Study 2: Yes | Yes | No | No | |
| Analyses | All outcomes reported (means and SD/SE) | No | No | No | Yes | No | Study 1: No Study 2: No | No | No | No |
| All participants accounted for (i.e., losses/ exclusions) | Yes | Yes | Yes | No | Yes | Study 1: Yes Study 2: Yes | Yes | No | No | |
| ITT analysis conducted (all data included after allocation) | Unclear | Unclear | Unclear | NA | Unclear | Study 1: Un. Study 2: Un. | Unclear | No | No | |
| Individual level analysis | Yes | Yes | Yes | Yes | Yes | Study 1: Yes Study 2: Yes | Yes | Yes | Yes | |
| Statistical analysis methods appropriate for study design | Yes | Yes | Yes | Yes | Yes | Study 1: Yes Study 2: Yes | Yes | Yes | Yes | |
| External validity | Sample representative of target population | No | No | No | No | No | Study 1: No Study 2: No | No | No | No |
| Overall quality score | Total number of points (out of possible 38) | 14 | 18 | 12 | 16 | 18 | Study 1: 16 Study 2: 18 | 23 | 12 | |
| Quality rating as percent | 36.8 | 47.4 | 31.6 | 42.1 | 47.4 | Study 1: 42.1 Study 2: 47.4 | 60.5 | 31.6 | ||
| Responded to query about “uncertain” ratings | Yes | NA | ||||||||
ITT: intention to treatment. Yes = 2; Partial (Pa.) = 1; No = 0; Unclear (Un) = 0; NA = criterion not applicable to this study design. Any changes made after consultation with study authors are highlighted in boldface.
Table 7.
Quality appraisal results.
| Quality Indicators | Yes | Partial | No | Unclear | ||||
|---|---|---|---|---|---|---|---|---|
| Frequency | (%) | Frequency | (%) | Frequency | (%) | Frequency | (%) | |
| Power calculation reported | 2 | 4.00 | 0 | 0.00 | 48 | 96.00 | 0 | 0.00 |
| Inclusion/exclusion criteria reported | 16 | 32.00 | 0 | 0.00 | 34 | 68.00 | 0 | 0.00 |
| Individual level allocation | 24 | 53.33 | 0 | 0.00 | 21 | 46.67 | 0 | 0.00 |
| Random allocation to groups/Condition/order | 30 | 66.67 | 0 | 0.00 | 12 | 26.67 | 3 | 6.67 |
| Randomization procedure appropriate | 23 | 51.11 | 1 | 2.22 | 12 | 26.67 | 9 | 20.00 |
| Groups similar (sociodemographic) | 8 | 16.00 | 4 | 8.00 | 0 | 0.00 | 38 | 76.00 |
| Group balanced at baseline | 2 | 4.00 | 0 | 0.00 | 0 | 0.00 | 48 | 96.00 |
| Participants blind to research question | 22 | 44.00 | 0 | 0.00 | 2 | 4.00 | 26 | 52.00 |
| Clear description of intervention and control | 47 | 94.00 | 0 | 0.00 | 2 | 4.00 | 1 | 2.00 |
| Consistency of intervention (within and between groups) | 32 | 64.00 | 3 | 6.00 | 14 | 28.00 | 1 | 2.00 |
| Outcome assessors blind to group allocation | 3 | 6.25 | 0 | 0.00 | 13 | 27.08 | 32 | 66.67 |
| Baseline measures taken before the intervention | 19 | 38.00 | 0 | 0.00 | 20 | 40.00 | 11 | 22.00 |
| Consistency of data collection | 44 | 88.00 | 4 | 8.00 | 2 | 4.00 | 0 | 0.00 |
| All outcomes reported (means and SD/SE) | 12 | 24.00 | 1 | 2.00 | 37 | 74.00 | 0 | 0.00 |
| All participants accounted for (i.e., losses/exclusions) | 38 | 76.00 | 0 | 0.00 | 12 | 24.00 | 0 | 0.00 |
| ITT analysis conducted (all data included after allocation) | 0 | 0.00 | 0 | 0.00 | 6 | 13.04 | 40 | 86.96 |
| Individual level analysis | 49 | 98.00 | 0 | 0.00 | 1 | 2.00 | 0 | 0.00 |
| Statistical analysis methods appropriate for study design | 47 | 94.00 | 0 | 0.00 | 2 | 4.00 | 1 | 2.00 |
| Sample representative of target population | 1 | 2.00 | 0 | 0.00 | 49 | 98.00 | 0 | 0.00 |
Not every appraisal item applicable to every study.
© 2019 by the authors. Licensee MDPI, Basel, Switzerland. This article is an open access article distributed under the terms and conditions of the Creative Commons Attribution (CC BY) license (http://creativecommons.org/licenses/by/4.0/).
Share and Cite
MDPI and ACS Style
Han, K.-T.; Ruan, L.-W. Effects of Indoor Plants on Self-Reported Perceptions: A Systemic Review. Sustainability 2019, 11, 4506. https://0-doi-org.brum.beds.ac.uk/10.3390/su11164506
AMA Style
Han K-T, Ruan L-W. Effects of Indoor Plants on Self-Reported Perceptions: A Systemic Review. Sustainability. 2019; 11(16):4506. https://0-doi-org.brum.beds.ac.uk/10.3390/su11164506
Chicago/Turabian StyleHan, Ke-Tsung, and Li-Wen Ruan. 2019. "Effects of Indoor Plants on Self-Reported Perceptions: A Systemic Review" Sustainability 11, no. 16: 4506. https://0-doi-org.brum.beds.ac.uk/10.3390/su11164506
Note that from the first issue of 2016, this journal uses article numbers instead of page numbers. See further details here.