Quantitative Assessment of Environmental Soil Functions in Volcanic Zones from Mexico Using S&E Software


Center for Research in Environmental Geography, National Autonomous University of Mexico, Morelia, Michoacán 58190, Mexico
*
Authors to whom correspondence should be addressed.
Sustainability 2019, 11(17), 4552; https://0-doi-org.brum.beds.ac.uk/10.3390/su11174552
Submission received: 29 May 2019
/
Revised: 15 August 2019
/
Accepted: 18 August 2019
/
Published: 22 August 2019
(This article belongs to the Special Issue Selected Papers from "Soil Security and Planetary Health Conference")
Abstract
:Making quantitative evaluations of the environmental functions of the soil in a quantitative way is an urgent necessity for transitioning towards the sustainable use of soils. The objective of this work was to use and improve the Soil and Environment software for soils of volcanic areas, for which the software was not designed to work on. The study was conducted in the volcanic area of Michoacan, Mexico. Nine soil profiles were described; samples were taken from each horizon and the physical and chemical properties of each sample were analyzed. The Soil and Environment software was used to conduct pedoecological evaluations of the soil samples and, subsequently, an evaluation of the environmental functions of the soils and the modeling of scenarios was carried out. The soil profiles studied showed variable properties of hydraulic conductivity, field capacity, air capacity, effective cation exchange capacity, and soil organic carbon. The soils showed very high nutrient retention, high naturalness and sorption of heavy metals, and low cultural and natural archive properties. The Soil and Environment software generally works well with soils of volcanic areas; however, we suggest improvements in the evaluation method of the following functions: naturalness and agricultural quality. Additionally, the estimating method of aeration capacity and hydraulic conductivity should be calibrated for the properties of the volcanic soils. The modeling of scenarios allowed us to identify the soil profiles that are most vulnerable to degradation. The modeling of scenarios provided a clear idea of the negative and positive effects that a change in soil use would have.
1. Introduction
Some estimations suggest that about 12 million hectares of soil are lost and degraded per year in the world [1]. The accelerated growth of the world population has increased the demand for food and materials obtained from the soil [2]. This phenomenon has exerted ever greater pressure on edaphic resources and, as a consequence, has accelerated degradation of the soil, putting at risk the capacity of the soils to provide enough to guarantee food security [3].
Traditionally, the agricultural capacity of soils has been evaluated using quantitative methods [4,5,6], but only isolated properties, such as slope, depth, etc., have been taken into account. These evaluations never consider the properties of the complete soil profile.
In the center of Mexico, the physiographic province called the “transversal Neovolcanic axis” is located, which has more than two thousand volcanoes, with heights of up to 5610 m above sea level in the Pico de Orizaba volcano. In this physiographic province, several lakes and aquifers are located, as well as the two main rivers of the country, the Lerma River and the Balsas River, and the most fertile soils of the country (Andosols, Cambisols, Luvisols, Acrisols, and Vertisols). The sustainable management of these soils of volcanic origin is of immense importance for Mexico [7].
On the other hand, the value of the environmental functions of soils has been recognized in recent years [8,9,10,11], but only qualitative models have been developed for evaluating these functions [12,13,14]. There are a few examples of quantitative models that consider the environmental soil functions, but the complete soil profile has never been included in these evaluations [15,16,17,18,19]. The first quantitative models for evaluating the environmental soil functions considering the complete soil profile were made by [8,20]. These models were later modified and improved for the development of algorithms [15] and a commercial multiplatform and multilingual software called Soil & Environment [16,17].
The Soil & Environment software has been evaluated and used successfully [8,18,21]; however, it is still necessary to calibrate it to work with the specific conditions of all possible soils, such as Andosols.
The objective of this work was to conduct a quantitative evaluation of the environmental soil functions in volcanic zones to improve the functionality of Soil & Environment software algorithms, as well as the development of change models by the degradation or conservation of soil profiles.
2. Materials and Methods
2.1. Study Area and Sampling
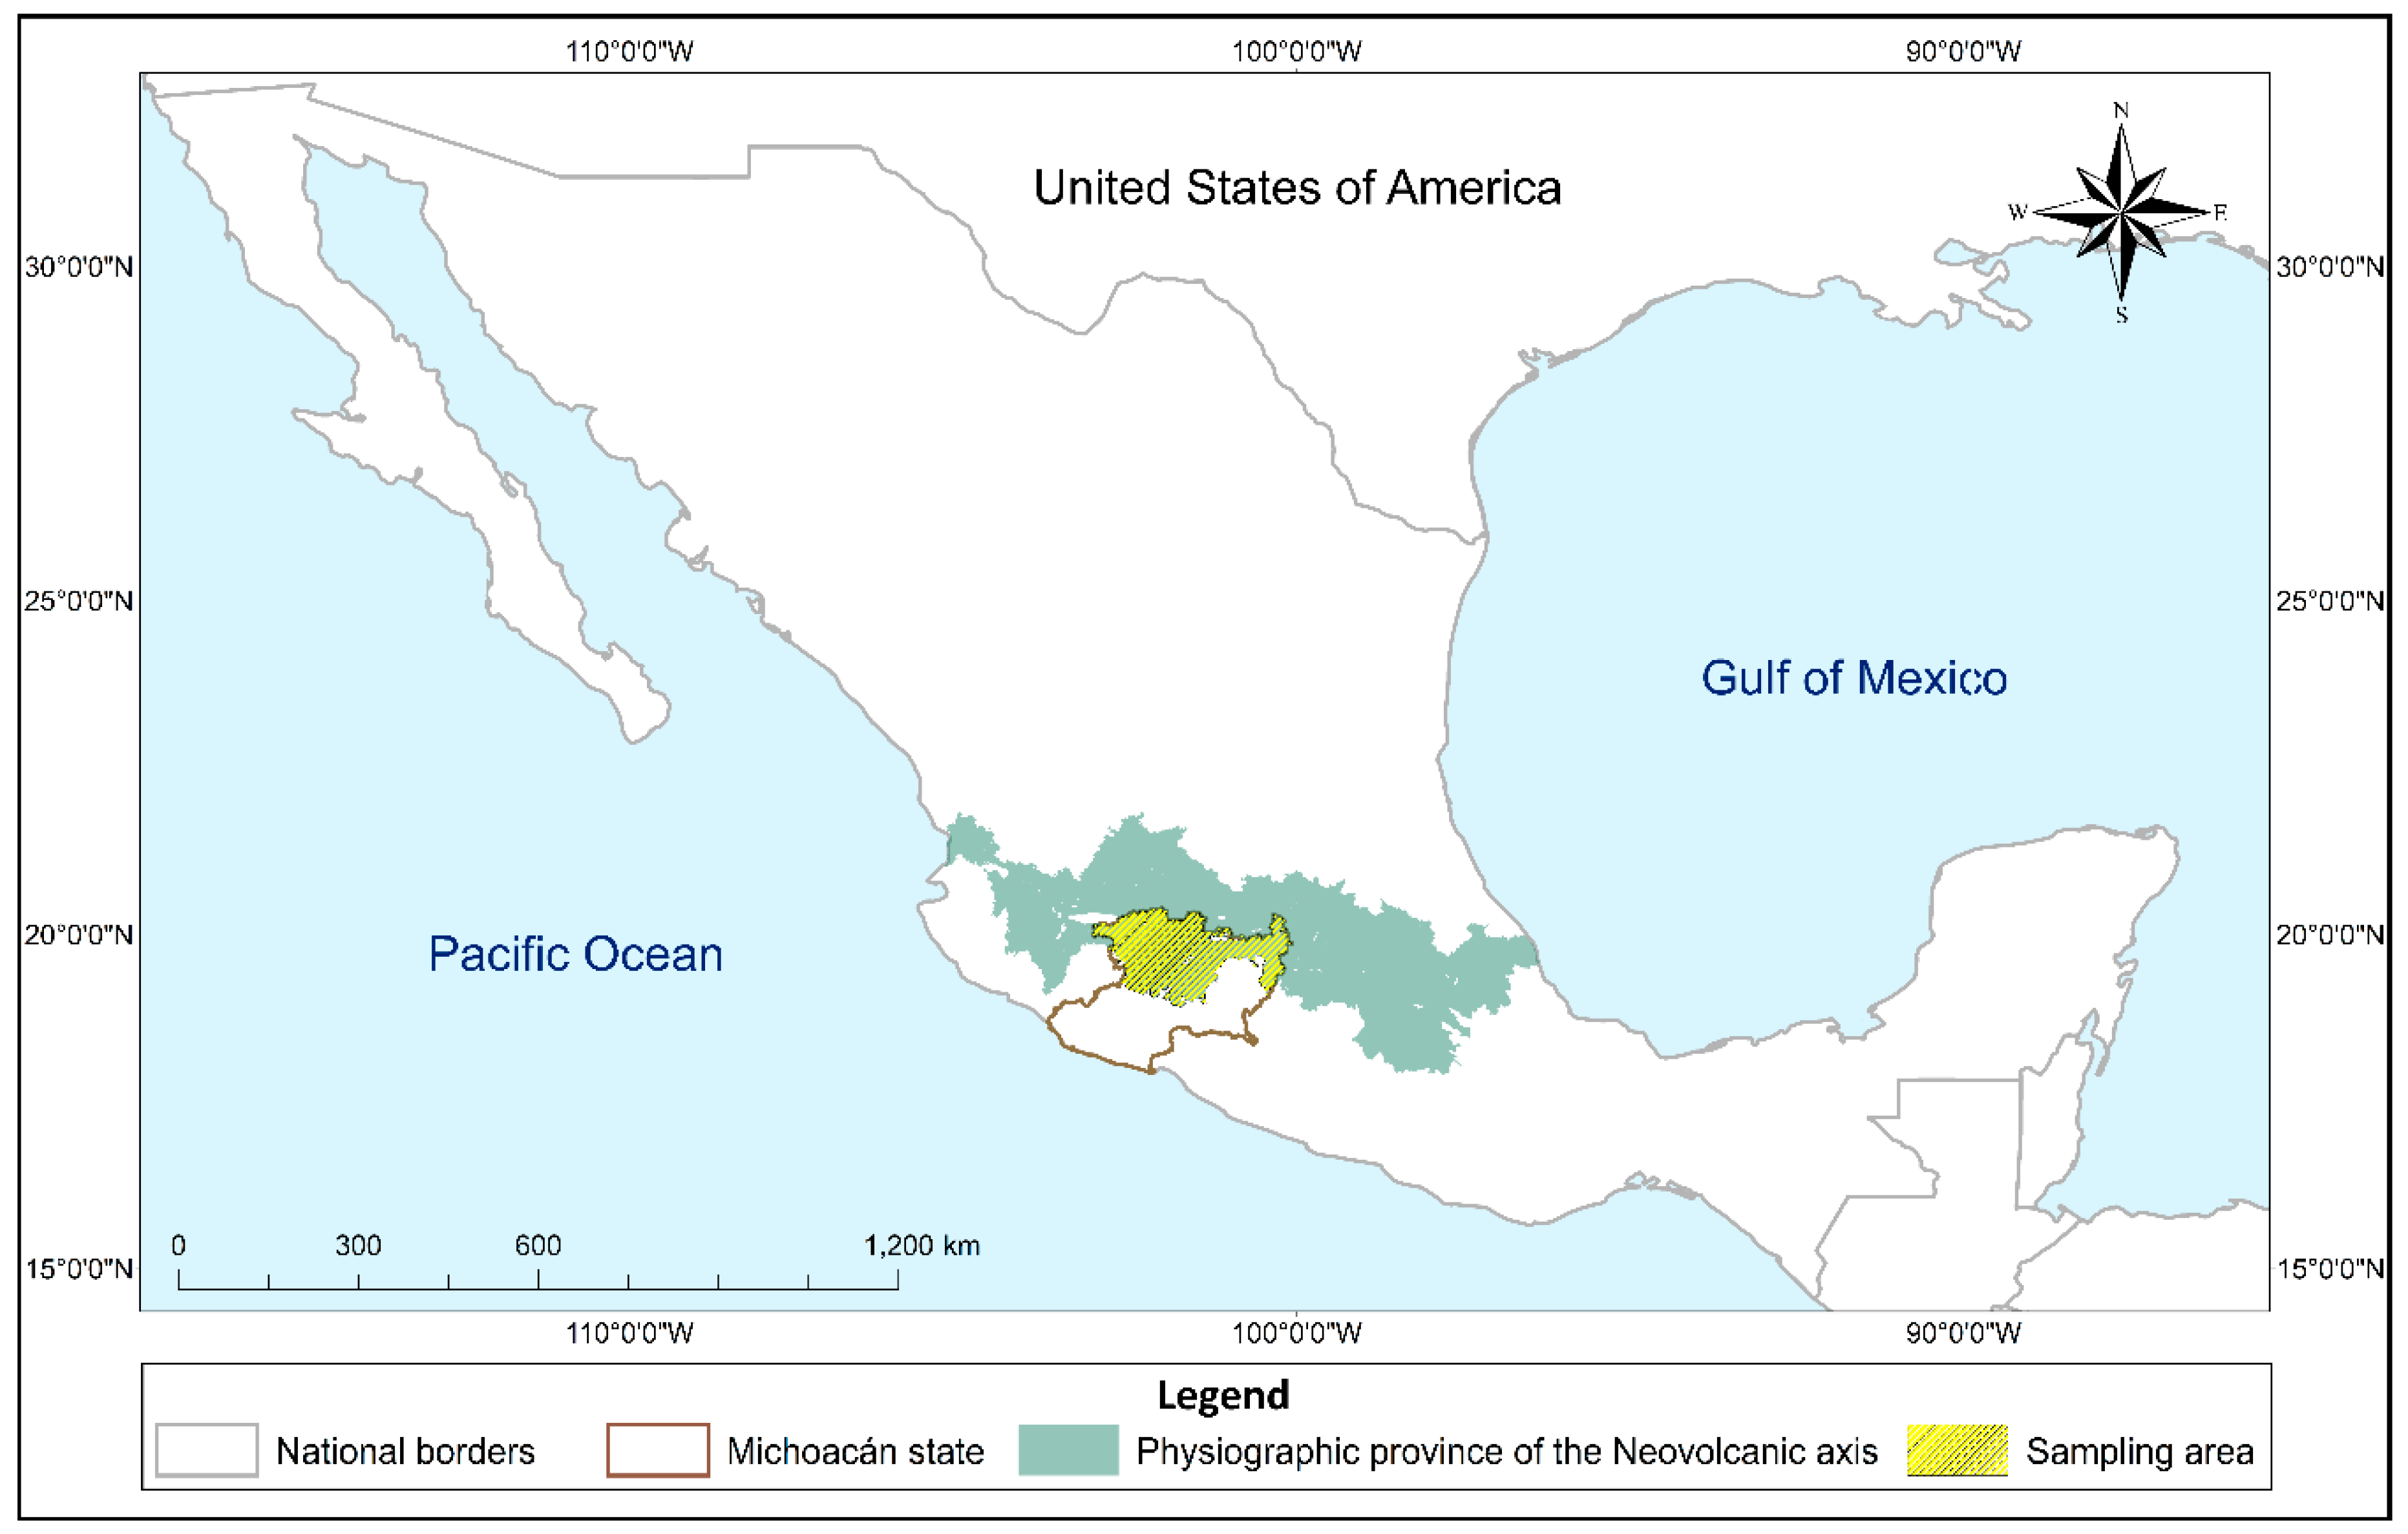
All the described soils were found in the physiographic province of the Neovolcanic axis in the municipalities of Cheran, Zacapu, and Quiroga, in the state of Michoacán (Figure 1). The predominant vegetation in the studied sites is classified as dominated or mixed temperate forests with Pinus, Quercus, Juniperus, and secondary vegetation [22]. The main economic activity is forestry and the production of rainfed corn [23]. The climate is temperate, with rains in the summer (Cw); the average annual temperature is 15 °C ± 10, with an average annual precipitation of 800 ± 150 mm [24]. The main soils are Luvisols, Andosols, Phaeozems, Cambisols, Leptosols, Vertisols, and Durisols from extrusive igneous rocks, mainly basalt, dacite, and basic volcanic breccia [25].
The sites were selected based on their geomorphological attributes: plains, hills, mountains, high hills, and low hills. A total of forty-four horizons from nine soil profiles were described by making pits at least 1.2 m deep or until reaching the parent material (Table 1).
2.2. Description of Soils and Methods
The soils were classified based on the standards of the World Reference Base [26]. The geographical and geomorphological characteristics, as well as the dominant vegetation and its management, were described for each site. In addition, the soil structure, pedological traits, wet color, and bulk density of each soil were analyzed [6,7,27].
A soil sample was collected from each horizon in order to identify diagnostic horizons, properties, and materials of the soil profiles, and to model the soil functions [5,6,16]. The physical and chemical properties of the soil samples were analyzed. The pH and electrical conductivity were measured using a potentiometer and conductivity meter, respectively (1:2 H2O) [6]. The content of organic matter and organic carbon was analyzed by the wet digestion method [28]. The cation exchange capacity and exchangeable bases (Ca, Mg, Na, and K) were determined using ammonium acetate (pH 7.0) [29]. The percentage of particles (sand, silt, and clay) was determined by the American pipette method [30], and the textural class of the soil horizon was verified using the soil texture triangle [31].
2.3. Evaluation of Environmental Soil Functions
The environmental soil functions were determined with the Soil and Environment software [16], which is a private software registered by the Mexican company Acts with Science [32]. This tool allows the environmental functions of soils to be evaluated based on the integration of quantitative and qualitative attributes of the soil profile and environmental elements such as vegetation, soil management, soil history, and the physical and chemical properties evaluated in the field and laboratory.
The evaluations carried out by Soil and Environment are based on algorithms of the Technique for Soil Evaluation and Categorization (TUSEC) [20]. The software provides an evaluation, on a scale of 1–5, where five represents a very high soil aptitude to perform the environmental function, four refers a high aptitude, three is an intermediate aptitude, two represents a low aptitude, and one is a very low aptitude [16]. The soil function scenarios that can be modeled are: (1) human habitats, in which sites suitable for human settlements are identified; (2) decomposition of organic compounds, which allows the capacity of microorganisms to maintain the cycling of nutrients to be evaluated; (3) the natural archive, which allows the history of soils to be evaluated through pedological or geological features in the subsoil; (4) the cultural archive, which considers elements related to ancient populations such as artifacts; (5) naturalness of the soil, which evaluates the importance of the soil as a reservoir of diversity of animals and plants; (6) aquifer recharge, which evaluates the importance of soils for the water purification and recharge of aquifers; (7) retention of nutrients, which analyses soil fertility in order to plan soil management practices; (8) agricultural quality, which evaluates the capacity of soils for food production; (9) soil organic carbon content, which estimates the soil organic carbon content by horizon and profile; and (10) absorption and adsorption of heavy metals, which evaluates the capacity of soils to adsorb contaminants such as heavy metals [16,17].
The Soil and Environment software evaluates the environmental soil functions through the analysis of quantitative and semi-quantitative parameters determined in the laboratory and field, respectively [17]. For example, heavy metal sorption is estimated using the following equations [8]:
- (1)
- Estimation of the fine earth volume:where FEi (kg m−2) refers to the soil particles smaller than 2 mm of soil horizon i in kg m−2; BDi (g cm−3) is the bulk density of soil horizon i in g cm−3; THi (dm) is the thickness of horizon i in decimeters; and CRi (Vol. %) is the volume of stones in soil horizon i.FEi (kg m−2) = BDi (g cm−3) * THi (dm) * (1–(CRi [Vol. %]/100))
- (2)
- The amount of clay is calculated aswhere ARi (kg m−2) is the content of clay at depth i in kg m−2; FEi (kg m−2) refers to the soil particles smaller than 2 mm at depth i in kg m−2; and PAh (%) is the percentage of clay at depth i.ARi (kg m−2) = FEi (kg m−2) * (PAh [%]/100)
- (3)
- The content of organic carbon is calculated aswhere COSi (kg m−2) is the content of organic carbon at depth i in kg m−2; FEi (kg m−2) refers to the soil particles smaller than 2 mm at depth i in kg m−2; and Ci (%) is the carbon percentage at depth i.Cosi (kg m−2) = FEi (kg m−2) * (Ci [%]/100)
- (4)
- To estimate the sorption index, the values of pHFi, ARFi, and COSFi are converted into factor values (Table 2) and applied to the following equation:where IABCi is the adsorption index; pHFi is the pH factor; ARFi is the clay factor; and COSFi is the carbon factor.IABCi = (pHFi + ARFi + COSFi)/3
Other models for evaluating the environmental soil functions are described in detail in the Soil & Environment software manual [16].
2.4. Degradation and Conservation Models
The environmental functions of the nine soil profiles were evaluated (Table 3), and three scenarios were modeled: (a) a degradation scenario for each soil profile considering the loss of horizon A by simulating an agricultural use; (b) a degradation scenario for each soil profile simulating the loss of horizon A and half of horizon B as a result of livestock use; and (c) a conservation scenario for each soil profile in which the thickness of horizon A increases up to 40 cm to represent a forest use [33].
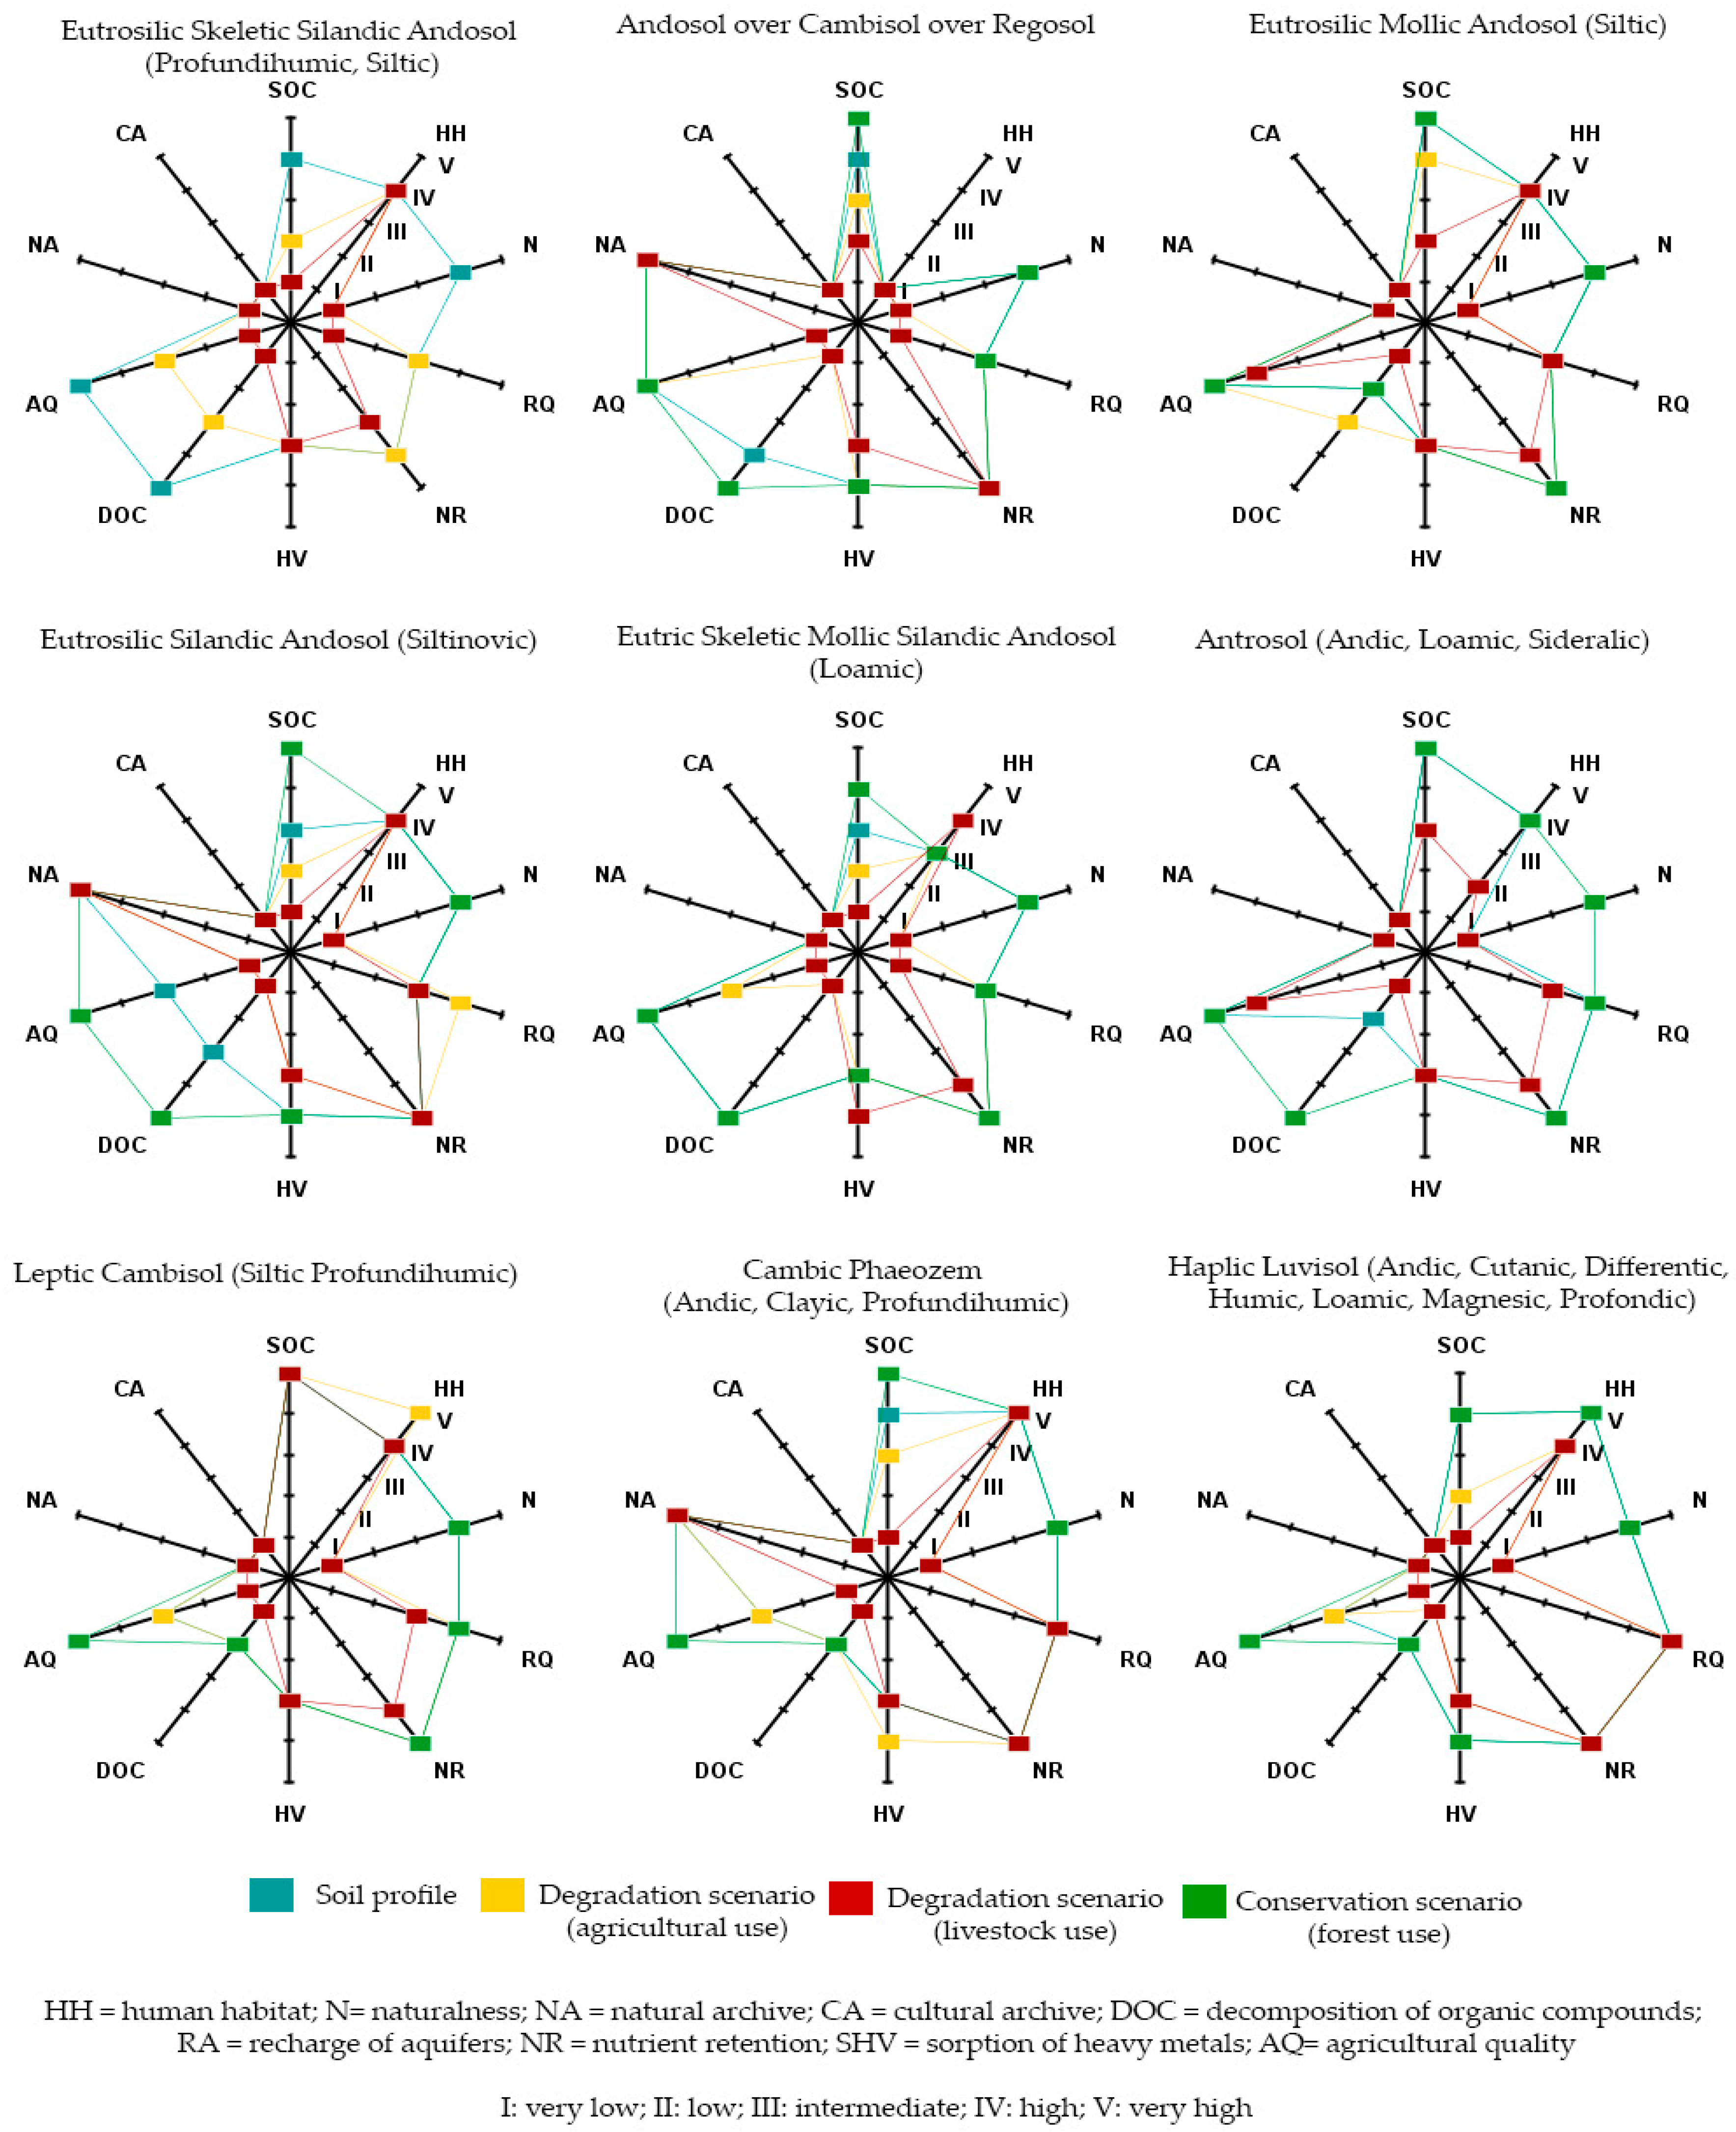
The aptitude graphs to perform the environmental functions from the modeled scenarios were generated using the Soil and Environment software with a scale of I to V—where V represents a very high soil aptitude, IV refers to high aptitude, III is an intermediate aptitude, II represents a low aptitude, and I is a very low aptitude to perform the environmental soil function [16].
3. Results and Discussion
3.1. Soil Description
The soils in the study area reflect the characteristic features of volcanic areas and the predominant role of the parent material and relief as the shaping factors that govern them [34,35]. These soils are mostly young and deep, with a sequence of horizons of Ah–Bw–C, except for Luvisol, in which the sequence of soil horizons is A–Bt–C, and Antrosol, in which horizon A has been lost.
Five of the nine soils were classified as Andosols (Table 3), showing a reaction to the allophane test, loamy textures, silty loams, and silty clay loams, with a slightly acidic to slightly alkaline pH and variable organic matter values (Table 3). The pedoecological evaluation showed very high values for the field capacity and cation exchange capacity, as well as high values for the aeration capacity for the soils with a greater depth and lower bulk density (Table 4).
Haplic Luvisol (Andic, Cutanic, Differentic, Humic, Loamic, Magnesic, and Profondic) had a pH that ranged from very slightly acidic to very slightly alkaline, while the percentage of organic matter was intermediate for the first horizon and null for the deeper horizons (Table 3). In the pedoecological evaluation, this soil obtained intermediate values of hydraulic conductivity and aeration capacity, which were attributed to the argic horizon, which limits water filtration. The field capacity and cation exchange capacity of this soil were very high (Table 4).
One of the soils was a Leptic Cambisol (Siltic Profundihumic), with a silt loam texture, organic matter content that gradually decreased with depth from medium–high to low content, and a pH that was slightly acidic to very slightly acidic. The pedoecological evaluation showed very high field capacity and cation exchange values, intermediate hydraulic conductivity, and a low aeration capacity, which can make plant rooting difficult [36] (Table 4).
Another soil was a Cambic Phaeozem (Andic, Clayic, Profundihumic), with a mollic horizon of 21 cm, a pH that was slightly acidic to very slightly alkaline, and an organic matter content ranging from medium–high to very low throughout the profile (Table 3). The pedoecological evaluation showed intermediate values of hydraulic conductivity and aeration capacity, which allow plant rooting to develop satisfactorily, although with certain limitations [37] (Table 4).
An Anthrosol (Andic, Loamic, Sideralic) was also characterized, and was collected from a plain with corn cultivation, a loam and sandy loam texture, intermediate organic matter content, and a pH that was slightly acidic to very slightly alkaline (Table 3). The pedoecological evaluation showed intermediate values of hydraulic conductivity in soil profile horizons with an intermediate bulk density [31], and very high values for the field capacity, aeration capacity, and cation exchange capacity, providing appropriate conditions for agriculture [35] (Table 4).
3.2. Evaluation of Environmental Soil Functions
The aptitude of the soils to perform environmental functions varied. The historical archive function obtained high scores in sites with buried soils because this function is associated with ancient soil formations, indications of historical use, or conserved environmental conditions [16,20] (Table 5).
The human habitat function allowed us to identify soils suitable for human settlements. For this function, the presence of contaminants and the generation of dust and humidity in the environment were evaluated, which are factors that can have negative repercussions on human health [17]. The Eutric Skeletic Mollic Silandic Andosol (Loamic) had medium aptitude levels with respect to its ability to perform this function is a result of its weak aggregate stability, causing dust formation, which can potentially cause gastric or pulmonary diseases [18]. The fact that Andosol was more highly evaluated than Cambisol and Regosol evidenced the need to complement the evaluation by considering natural risk factors. Since Andosol was located on a mountain, its initial (very high) aptitude was changed to a very low aptitude by considering the risks associated with sites with steep slopes, such as mass movements [2].
In the evaluation of the function of soil naturalness, sites without anthropic alterations were identified, since these sites may be appropriate for the conservation of native plants and animals [18,38]. The soils were evaluated as having a high aptitude to perform this function, except for Antrosol (Andic, Loamic, Sideralic), which had a very low aptitude due to its agricultural use. In order to improve the evaluation of this environmental function, we proposed integrating other indicators, such as the soil management, cover type, and thickness of horizon A; in this way, a conserved soil with a deep A horizon would indicate a more natural soil [39]. Using this criterion, two soils improved their evaluation results to very high: the Eutrosilic Skeletic Silandic Andosol (Profundihumic, Siltic) and the Eutric Skeletic Mollic Silandic Andosol (Loamic) (Table 5).
The function of decomposing organic compounds obtained low scores in five of the nine evaluated soils (Table 5). This environmental function is based on the capacity of microorganisms to produce, decompose, and transform chemical substances [17,20]. The soils that obtained the lowest scores had intermediate values of organic matter content and/or a structure of subangular blocks (Table 2). A better evaluation of this function could take into account: (a) the number of fine roots of plants, since these can exude organic compounds that promote microbial activity [40], and (b) the cation exchange capacity, since this influences the adsorption of microbial enzymes that decompose organic matter [41].
To assess the aquifer recharge function, the capacity of soils to filter and infiltrate water was evaluated. This environmental function assesses hydraulic conductivity using the (a) field capacity to infer water quality and (b) aeration capacity to estimate the amount of natural recharge water [20,33]. These soils have the peculiarity of having a high-water retention capacity, which is reflected in the high values of the field capacity. Water can filter through the profile of these soils, but not quickly; thus, lowering their aptitude, mainly for Andosols, could generate a more reliable scenario.
The function of sorption of heavy metals by soils is of great importance for urban environments, since it is in cities where human beings agglomerate, and their health can be affected [8,16,42]. The properties of the soils used to assess this environmental function were the pH, organic matter content, and clays, since these have the greatest influence on the sorption of heavy metals [8]. The evaluated soils had intermediate and high scores at a depth of 5 cm, mainly due to their pH values (Table 3).
The agricultural quality function obtained high scores in five of the nine evaluated soils (Table 5). This environmental function is based on soil properties that favor the growth of plants and crops [16,38]. The evaluation of this environmental function might be improved by considering limiting factors for agriculture, such as the slope, which is associated with erosion [43]. Another factor that reduces the agricultural quality of soils is the presence of coarse surface fragments, which hinder tillage [44]. In the specific case of Andosols, this group of soils retains a large amount of phosphates, which greatly reduces their suitability for agriculture [35]. Electrical conductivity should also be taken into account as a factor that reduces the agricultural quality of soils, as it is a direct indicator of the presence of salts, which can cause plants to undergo osmotic stress [45]. The previous suggestions were applied to the evaluation models. In the case of Andosols, two aptitude classes were subtracted by simulating the loss of fertility due to the retention of phosphates. As for the soils with andic characteristics, only one class was subtracted after performing this correction. None of the evaluated soils reached a very high class, which we consider to be more accurate (Table 5).
The nutrient retention function is based on the evaluation of the natural fertility of soils [15,38]. All the soils under study obtained a very high score, which indicates that they have a good ability to retain and release nutrients for plants, with a low risk of loss by leaching [20]. The soil properties that were used to assess this function were the amount of fine earth, the capacity to adsorb interchangeable cations, and the structure and texture of the soil, all of which are highly important for the supply of nutrients [46]. To improve the evaluation of this environmental function, we proposed the adoption of a criterion like that of agricultural quality.
The assessment of the soil organic carbon content function allowed the content of organic carbon in tons per hectare to be calculated for each soil profile. The deepest soils presented the highest amount of organic carbon (Table 4), such as the Antrosol (Andic, Loamic, Sideralic) and the Eutrosilic Mollic Andosol (Siltic).
Degradation and Conservation Models
The conservation model with forest soil use showed that the naturalness of soils increased with depth in the A horizon. The capacity to decompose organic compounds and the agricultural quality of the soils improved as the organic matter content and aeration capacity increased. The scores corresponding to the human habitat function, archival function, aquifer recharge function, nutrient retention, and heavy metal adsorption remained mostly the same, without any significant changes. This is because the properties of the soils that were considered for each of these functions improved, but not enough to reach a higher score; it was also the case that the soils in their original state had already been evaluated as having the best aptitude for some of these functions (Figure 2).
Modeling this type of soil use allowed us to identify the capacities that the soils have possibly lost with their current uses. In the case of Antrosol (Andic, Loamic, Sideralic), a significant change in capacity was expected; however, only the decomposition of organic compounds and the naturalness of the soil presented significant improvements. This indicates that although this soil has lost important capacities, it is still able to perform other functions.
The degradation model with agricultural soil use showed that the erosion of the A horizon results in a complete loss of naturalness of the soils. The ability to decompose organic compounds was also significantly reduced and agricultural quality was slightly affected. Nevertheless, the human habitat function, archival function, aquifer recharge function, and nutrient retention remained unchanged or showed no significant changes (Figure 2). The function of the sorption of heavy metals did show significant changes, with the scores of some soils improving at a 30 cm depth. This happened because, in these soils, the subsurface horizons have pH values of around 7, which benefits this environmental function [8]. This model showed a major negative change in the capabilities of the Eutric Skeletic Mollic Silandic Andosol (Loamic) and the Eutrosilic Skeletic Silandic Andosol (Profundihumic, Siltic).
The effects of agriculture on soil are usually associated with negative aspects, such as erosion by tillage, compaction, a loss of soil structure, nutrient degradation, and salinity [47]. However, in the case of the soils studied here, the capacity to regulate heavy metals improved. The functions that are key for this type of soil use, such as agricultural quality and nutrient retention, are still effectively performed according to the characteristics of the evaluation technique used [15,20].
The degradation model with livestock soil use showed that the disappearance of the A horizon and part of the B horizon results in a total loss of naturalness and a drastic decrease in the capacity of the soil to decompose organic compounds. The agricultural quality score was also significantly reduced, and the functions of aquifer recharge and nutrient retention were also affected. The functions related to human habitat and heavy metal adsorption decreased by very little at a 5 cm depth, while heavy metal adsorption improved in Andosol, which obtained higher scores than Cambisol, Regosol, and Eutrosilic Skeletic Silandic Andosol (Profundihumic, Siltic). The most vulnerable soils in the scenario of livestock use were again the Eutrosilic Skeletic Silandic Andosol (Profundihumic, Siltic) and Eutric Skeletic Mollic Silandic Andosol (Loamic), as well as Andosol, over Cambisol and Regosol. Therefore, it is recommended that the current use of these soils is maintained to preserve their environmental functions.
Given that the decrease in the capacity of the soils was considered significant before running this degradation model (Figure 2), it is suggested that the soils selected for livestock use should have characteristics that provide resistance to the degradation factors associated with grazing [48]; for example, coarse textured soils that minimize the effects of compaction by trampling. It is also suggested that soils with low scores for their environmental soil functions are selected.
Environmental soil functions are a broad concept that can include ecosystem services and pedoecological properties. An evaluation of these functions must consider the physical and chemical properties of the soil, as well as soil management practices and the cultural and geological history of the complete soil profile [16]. The Soil & Environment software evaluated soil properties that can be associated with ecosystem support services, regulation, culture, and soil provision services [14,46,49,50]. The evaluations carried out using the Soil & Environment software were based on a quantitative, objective analysis of the ecosystem services of the soil, considering the entire soil profile, not only the arable layer or the surface horizons of conserved sites [16,17,33].
This study will serve as an input for modifying and improving the evaluation algorithms of the Soil & Environment software. In the future, these evaluation models could provide results in economic terms that would better communicate the value of soil for different users.
The growing degradation of the world’s soils urgently requires the modernization of soil science, which should consist of the generation of information and communication technologies to: (a) generate thousands of millions of data at the level of the soil profile with proximal sensors; (b) the analysis of large databases with apps and software for evaluating the environmental soil functions; and (c) transfer the pedological information to the decision makers. All of this is part of the new line of work, soil security [51,52].
4. Conclusions
The method and algorithms employed for assessing the functions of soil naturalness and agricultural quality should be improved for the evaluation of soils in volcanic zones. The estimating method of aeration capacity and hydraulic conductivity should be calibrated for the particular characteristics of the Andosols.
The modeling of scenarios in this case was very particular due to the soil management practices of the local farmers, which change from forest to corn cultivation and then to livestock use. However, in other cases, the dynamics of land use may be totally different and thus the models must be different. In this case, the modeling of scenarios provided a clear idea of the negative and positive effects that a change in land use could have. The models also served to identify the soil profiles that are most vulnerable to disturbance, as well as the soil profiles with agricultural or livestock potential.
Given the current need to ensure the security, conservation, and improvement of soil resources, a quantitative evaluation of the environmental functions of soil allows us to recognize the value of soil profiles and to develop sustainable management strategies to produce food, fibers, textiles, fresh water, etc., as well as to preserve diversity and rely on soil functions as a buffer against pollution and climate change.
Author Contributions
Formal analysis, Á.G, D.L.-C. and F.B.; funding acquisition, F.B.; investigation, Á.G., D.L.-C. and F.B.; methodology, A.G., D.L.-C. and F.B.; project administration, F.B.; Resources, F.B.; Software, Á.G. and F.B.; Supervision, F.B.; Writing—original draft, Á.G., D.L.-C. and F.B.; Writing—review & editing, Á.G. and F.B.
Funding
This research was funded by DGAPA of the National Autonomous University of Mexico, grant number IN209218, within the research project “Generación de modelos de evaluación ambiental del perfil del suelo en zonas volcánicas y de karst".
Acknowledgments
We thank the Mexican company Acts with Science for providing the user license from the Soil and Environment software.
Conflicts of Interest
The authors declare no conflict of interest.
References
- ELD Initiative. Report for Policy and Decision Makers: Reaping Economic and Environmental Benefits from Sustainable Land Management, 1st ed.; German Federal Ministry for Economic Cooperation and Development: Bonn, Germany, 2015. [Google Scholar]
- Goudie, A. Human Impact on the Natural Environment: Past, Present and Future, 8th ed.; John Wiley & Sons: Oxford, UK, 2018; 422p. [Google Scholar]
- Lal, R. Soil degradation as a reason for inadequate human nutrition. Food. Secur. 2009, 1, 45–57. [Google Scholar] [CrossRef]
- De la Rosa, D.; Mayol, F.; Díaz-Pereira, E.; Fernández, M.; De la Rosa, D. A land evaluation decision support system (MicroLEIS DSS) for agricultural soil protection: With special reference to the Mediterranean region. Environ. Model. Softw. 2004, 19, 929–942. [Google Scholar] [CrossRef]
- Food and Agriculture Organization of The United Nations (FAO). Guidelines for Soil Description, 4th ed.; Management Service Information Division FAO: Rome, Italy, 2006. [Google Scholar]
- Schoeneberger, P.J.; Wysocki, D.A.; Benham, E.C. Field Book for Describing and Sampling Soils, 3rd ed.; National Soil Survey Center, Natural Resources Conservation Service: Lincoln, NE, USA, 2012. [Google Scholar]
- INEGI Fisiografía. Available online: https://www.inegi.org.mx/temas/fisiografia/# (accessed on 10 July 2019).
- Bautista, F.; Campuzano, E.; Delgado, C.; Goguitchaichvili, A. Índices de sorción de metales pesados en suelos urbanos: El caso de Morelia. Boletín Soc. Geológica Mex. 2017, 69, 433–445. [Google Scholar] [CrossRef]
- Baveye, P.C.; Baveye, J.; Gowdy, J. Soil ecosystem services and natural capital: Critical appraisal of research on uncertain ground. Front. Environ. Sci. 2016, 4, 41. [Google Scholar] [CrossRef]
- Blum, W.E. Problems of Soil Conservation, Nature and Environment Series No. 39; Council of Europe: Strasbourg, France, 1988. [Google Scholar]
- Omuto, C.; Nachtergaele, F.; Rojas, R.V. State of the Art Report on Global and Regional Soil Information: Where are We? Where to Go? 1st ed.; FAO: Rome, Italy, 2013. [Google Scholar]
- Celio, E.; Koellner, T.; Grêt-Regamey, A. Modeling land use decisions with Bayesian networks: Spatially explicit analysis of driving forces on land use change. Environ. Model. Softw. 2014, 52, 222–233. [Google Scholar] [CrossRef]
- Hans-Georg, F.; Bach, M.; Fohrer, N.; Breuer, L. Interdisciplinary modeling and the significance of soil functions. J. Plant Nutr. Soil Sci. 2002, 165, 460–467. [Google Scholar] [CrossRef]
- Robinson, D.A.; Jackson, B.M.; Clothier, B.E.; Dominati, E.J.; Marchant, S.C.; Cooper, D.M.; Bristow, K.L. Advances in soil ecosystem services: Concepts, models, and applications for earth system life support. Vadose Zone J. 2013, 12. [Google Scholar] [CrossRef]
- Gallegos-Tavera, Á.; Bautista, F.; Álvarez, O. Software Assofu to assess environmental soil functions. Rev. Chapingo Ser. Ciencias For. Ambient. 2014, 20, 237–249. [Google Scholar] [CrossRef]
- Bautista, F.; Gallegos, A.; Pacheco, A. Analysis of the environmental functions of soil profile data (Soil & Environment), 2nd ed.; Skiu: Ciudad de México, México, 2016. [Google Scholar]
- Gallegos, A.; Bautista, F.; Dubrovina, I. Software to evaluate the environmental functions of soils. Softw. Syst. 2016, 2, 195–200. [Google Scholar] [CrossRef]
- Bedolla-Ochoa, C.; Bautista, F.; Gallegos, Á. Environmental functions of smallholder farmer land classes in the Zicuirán-Infiernillo Biosphere Reserve, México. Rev. Chapingo Ser. Ciencias For. Ambient. 2018, 3, 265–274. [Google Scholar] [CrossRef]
- Muñoz-Rojas, M.; Doro, L.; Ledda, L.; Francaviglia, R. Application of CarboSOIL model to predict the effects of climate change on soil organic carbon stocks in agro-silvo-pastoral Mediterranean management systems. Agric. Ecosyst. Environ. 2015, 202, 8–16. [Google Scholar] [CrossRef]
- Lehmann, D.; David, S.; Stahr, K. TUSEC-Technique for Soil Evaluation and Categorization for Natural and Anthropogenic Soils; Universitat Hohenheim Bodenkundliche Hefte: Stuttgart, Germany, 2008; ISSN 0942-0754. [Google Scholar]
- Aguilar, Y.; Bautista, F.; Mendoza, M.; Frausto, O.; Ihl, T.; Delgado, C. Índice de la vulnerabilidad del acuífero kárstico yucateco a la contaminación. Revisa Mex. Ing. Química 2016, 3, 913–933. [Google Scholar]
- Rzedowski, J. Vegetación de México, 2nd ed.; Comisión Nacional para el Conocimiento y Uso de la Biodiversidad: Ciudad de México, México, 2006. [Google Scholar]
- Arredondo-León, C. Estado y dinámica del paisaje forestal en el municipio Cherán, Sierra Tarasca, Michoacán. Rev. Mex. Ciencias For. 2017, 8, 7–24. [Google Scholar]
- Velázquez, A.; Toledo, V.; Luna, I. Mexican temperate vegetation. In North American Terrestrial Vegetation; Barbour, M., Billings, D., Eds.; Cambridge University Press: Cambridge, UK, 2000; pp. 573–592. [Google Scholar]
- Instituto Nacional de Estadística y Geografía (INEGI). Prontuario de Información Geográfica Municipal de Los Estados Unidos Mexicanos; INEGI: Ciudad de México, México, 2009. [Google Scholar]
- IUSS Working Group WRB. World reference base for soil resources. In International Soil Classification System for Naming Soils and Creating Legends for Soil Maps, 2015th ed.; World Soil Resources Reports No. 106; World Soil Resources: Rome, Italy, 2014. [Google Scholar]
- Munsell Color Company. Munsell Soil Color Charts; Munsell Color Company: Boston, MA, USA, 2000. [Google Scholar]
- Nelson, D.; Sommers, L.E. Total carbon, organic carbon and organic matter. In Methods of Soil Analysis, Part 2, Chemical and Microbiological Properties; Page, A.L., Miller, R.H., Keeney, D.R., Eds.; American Society of Agronomy and Soil Science Society of America: Madison, WI, USA, 1982; pp. 539–577. [Google Scholar]
- Rhoades, J. Cation exchange capacity. In Methods of Soil Analysis. Part 2. Agronomy Monograph; Page, A.L., Miller, R.H., Keeney, D.R., Eds.; American Society of Agronomy, Inc.: Madison, WI, USA, 1982; pp. 178–190. [Google Scholar]
- Day, R.P. Pipette method of particle size analysis. In American Society of Agronomy; Black, C.A., Ed.; Methods of Soil Analysis: Madison, WI, USA, 1965; pp. 553–562. [Google Scholar]
- Siebe, C.; Janh, R.; Stahr, K. Manual Para la Descripción y Evaluación Ecológica de Suelos en el Campo, 4th ed.; Sociedad Mexicana de la Ciencia del Suelo, A.C.: México, 2006. [Google Scholar]
- Skiu. Soil and Environment (S&E). Available online: https://www.actswithscience.com/se-2/ (accessed on 12 August 2019).
- Bautista, F.; Barajas, A.; Cortés, J.L.; Olivares, L.D.; Gallegos, Á.; Pérez, A. Los costos ambientales de la pérdida de suelo en la Reserva de la Biosfera Sierra Gorda de Guanajuato. GEOS 2016, 36, 309–315. [Google Scholar]
- Alcalá, J.M.; Ortiz-Solorio, C.A.; Gutiérrez-Castorena, M.C. Clasificación de los suelos de la Meseta Tarasca, Michoacán. Terra Latinoam. 2001, 19, 227–239. [Google Scholar]
- Sedov, S.N.; Solleiro-Rebolledo, E.; Gama-Castro, J.E. Andosol to Luvisol evolution in Central Mexico: Timing, mechanisms and environmental setting. CATENA 2003, 54, 495–513. [Google Scholar] [CrossRef]
- Schöning, I.; Kögel-Knabner, I. Chemical composition of young and old carbon pools throughout Cambisol and Luvisol profiles under forests. Soil Biol. Biochem. 2006, 38, 2411–2424. [Google Scholar] [CrossRef]
- Flessa, H.; Amelung, W.; Helfrich, M.; Wiesenberg, G.L.B.; Gleixner, G.; Brodowski, S.; Rethemeyer, J.; Kramer, C.; Grootes, P.M. Storage and stability of organic matter and fossil carbon in a Luvisol and Phaeozem with continuous maize cropping: A synthesis. J. Plant Nutr. Soil Sci. 2008, 171, 36–51. [Google Scholar] [CrossRef] [Green Version]
- Lehmann, A.; Stahr, K. The potential of soil functions and planner-oriented soil evaluation to achieve sustainable land use. J. Soils Sediments 2010, 10, 1092–1102. [Google Scholar] [CrossRef]
- Westphal, C.; Härdtle, W.; Oheimb, G. Forest history, continuity and dynamic naturalness. In Forest Biodiversity: Lessons from History for Conservation; CABI: Wallingford, Oxfordshire, UK, 2004; pp. 205–220. [Google Scholar]
- Lynch, J.M.; de Leij, F. Rhizosphere. 2012. Available online: https://0-onlinelibrary-wiley-com.brum.beds.ac.uk/doi/abs/10.1002/9780470015902.a0000403.pub2 (accessed on 22 August 2019). [CrossRef]
- Romaní, A.M.; Fischer, H.; Mille-Lindblom, C.; Tranvik, L.J. Interactions of bacteria and fungi on decomposing litter: Differential extracellular enzyme activities. Ecology 2006, 87, 2559–2569. [Google Scholar] [CrossRef]
- Lehmann, A.; David, S.; Stahr, K. Technique for Soil Evaluation and Categorization for Natural and Anthropogenic Soils, 2nd ed.; Hohenheimer Bodenkundliche Hefte: Landeshauptstadt München, Germany, 2013. [Google Scholar]
- Bridges, E.M.; Oldeman, L.R. Global assessment of human-induced soil degradation. Arid Soil Res. Rehabil. 1999, 13, 319–325. [Google Scholar] [CrossRef]
- De la Rosa, D.; Anaya-Romero, M.; Díaz-Pereira, E.; Heredia, N.; Shahbazi, F. Soil-specific agro-ecological strategies for sustainable land use—A case study by using MicroLEIS DSS in Sevilla Province (Spain). Land Use Policy 2009, 26, 1055–1065. [Google Scholar] [CrossRef]
- Bohnert, H.J.; Jensen, R.G. Strategies for engineering water-stress tolerance in plants. Trends Biotechnol. 1996, 14, 89–97. [Google Scholar] [CrossRef]
- Dubrovina, I.; Bautista, F. Analysis of the suitability of various soil groups and types of climate for avocado growing in the state of Michoacán, México. Eurasian Soil Sci. Agric. Chem. Soil Fertil 2015, 5, 491–503. [Google Scholar] [CrossRef]
- Food and Agriculture Organization of the United Nations (FAO). Status of the World’s Soil Resources; FAO: Rome, Italy, 2015. [Google Scholar]
- Greenwood, K.L.; McKenzie, B.M. Grazing effects on soil physical properties and the consequences for pastures: A review. Aust. J. Exp. Agric. 2001, 41, 1231–1250. [Google Scholar] [CrossRef]
- Blum, W. Functions of soil for society and the environment. Rev. Environ. Sci. Biotechnol. 2005, 4, 75–79. [Google Scholar] [CrossRef]
- Costanza, R.; d’Arge, R.; de Groot, R.; Farber, S.; Grasso, M.; Hannon, B.; Limburg, K.; Naeem, S.; O’Neill, R.V.; Paruelo, J.; et al. The value of the world’s ecosystem services and natural capital. Nature 1997, 387, 253–260. [Google Scholar] [CrossRef]
- McBratney, A.; Field, D.J.; Koch, A. The dimensions of soil security. Geoderma 2014, 213, 203–213. [Google Scholar] [CrossRef] [Green Version]
- McLean, J.; McBratney, A.; Field, D.; Kidd, K.; Stockmann, U.; Liddicoat, C.; Grover, S. Soil Security for Australia. Sustainability 2019, 11, 3416. [Google Scholar] [CrossRef]
Figure 1.
Sampling area location.

Figure 2.
Modeling scenarios of the degradation and conservation of soils due to their use.


Table 1.
Geographical location of the soil profiles and their management.
| No. | Key | Geoform | Coordinates | Soil Use | ||
|---|---|---|---|---|---|---|
| X | Y | Zone | ||||
| 1 | Cherán 001 | Plain | 191137.77 | 2176993.00 | 13 N | Rainfed corn |
| 2 | Cherán 002 | Hill | 807927.56 | 2184911.75 | 13 N | Quercus Forest |
| 3 | Cherán 003 | Mountain | 810550.44 | 2185337.75 | 13 N | Pinus-Quercus forest |
| 4 | Cherán 004 | Plain | 810525.12 | 2185213.75 | 13 N | Rainfed corn (3 years without cultivation) |
| 5 | Zacapu 001 | Hill | 211840.64 | 2187352.75 | 14 N | Abandoned grassland |
| 6 | Zacapu 002 | High hills | 207175.25 | 2186290.75 | 14 N | Quercus Forest |
| 7 | Zacapu 003 | Low hills | 213589.80 | 2185233.70 | 14 N | Secondary Vegetation/Huizachal |
| 8 | Quiroga 001 | High hills | 228113.43 | 2179897.25 | 14 N | Pinus forest |
| 9 | Quiroga 002 | Hill | 237127.81 | 2174538.75 | 14 N | Pinus-Quercus forest |
Table 2.
Value of the pH, clay, and organic carbon factors for an estimation of the sorption index [7].
Table 2.
Value of the pH, clay, and organic carbon factors for an estimation of the sorption index [7].
| pH | Factor | Clays (kg m−2) | Factor | Organic Carbon (kg m−2) | |
|---|---|---|---|---|---|
| >7 | 5 | >3 | 5 | >0.8 | 5 |
| 6.5–7 | 4 | 2.5–3 | 4 | 0.6–0.8 | 4 |
| 6–6.5 | 3 | 2–2.5 | 3 | 0.4–0.6 | 3 |
| 5.5–6 | 2 | 1.5–2 | 2 | 0.2–0.4 | 2 |
| ≤5.5 | 1 | <2 | 1 | <0.2 | 1 |
Table 3.
Basic chemical and physical properties of soils.
| Profile Key | Horizon | Depth cm | pH H2O | Exchangeable Bases | CEC | OM | BD | Sand | Silt | Clay | Texture | |||
|---|---|---|---|---|---|---|---|---|---|---|---|---|---|---|
| Ca2+ | Mg2+ | Na+ | K+ | |||||||||||
| Cherán-001 | Bw1 | 0–27 | 6.07 | 1.70 | 13.76 | 0.43 | 0.82 | 10.18 | 3.25 | 1.30 | 49.90 | 31.80 | 18.30 | L |
| Bw2 | 27–38 | 6.32 | 1.66 | 14.67 | 0.45 | 0.51 | 31.49 | 2.21 | 1.17 | 49.90 | 31.00 | 19.00 | L | |
| Bw3 | 38–97 | 6.73 | 1.66 | 17.81 | 0.43 | 0.40 | 18.82 | 2.73 | 1.06 | 47.20 | 34.30 | 18.50 | L | |
| Bw4 | 97–135 | 6.95 | 1.69 | 17.54 | 0.51 | 0.47 | 19.01 | 1.82 | 1.00 | 52.70 | 33.40 | 13.90 | SL | |
| Bw5 | 135–193 | 6.95 | 1.71 | 19.26 | 0.56 | 0.59 | 12.10 | 2.60 | 1.05 | 63.50 | 24.90 | 11.70 | SL | |
| Cherán-002 | Ah | 0–40 | 6.05 | 1.68 | 18.11 | 0.36 | 0.67 | 27.26 | 9.61 | 0.73 | 33.90 | 53.80 | 12.30 | SiL |
| Bw | 40–79 | 6.84 | 1.40 | 13.90 | 0.34 | 0.91 | 29.95 | 4.55 | 0.83 | 29.40 | 57.90 | 12.70 | SiL | |
| C | 79–142 | 6.85 | 1.55 | 18.19 | 0.43 | 0.39 | 34.37 | 3.51 | 0.91 | 26.00 | 56.60 | 17.40 | SiL | |
| Cherán-003 | Ah | 0–17 | 6.40 | 1.61 | 27.28 | 0.49 | 2.15 | 29.38 | 5.46 | 0.92 | 40.40 | 41.80 | 17.80 | L |
| Bw1 | 17–56 | 7.17 | 1.59 | 29.68 | 0.75 | 2.40 | 45.12 | 1.30 | 0.84 | 25.30 | 48.90 | 25.80 | L | |
| 2BC | 56–74 | 7.16 | 1.49 | 27.12 | 1.29 | 0.40 | 36.29 | 1.69 | 1.11 | 53.80 | 37.60 | 8.70 | SL | |
| 2C | 74–89 | 7.05 | 1.57 | 30.75 | 0.94 | 0.46 | 19.39 | 1.43 | 1.06 | 79.30 | 13.00 | 7.80 | LS | |
| 3B2 | 89–116 | 7.15 | 1.68 | 25.57 | 0.62 | 0.48 | 32.45 | 1.43 | 1.26 | 92.10 | 2.50 | 5.40 | S | |
| 3BC2 | 116–136 | 7.34 | 1.54 | 30.40 | 0.75 | 0.75 | 27.46 | 0.78 | 1.28 | 82.70 | 15.70 | 1.60 | LS | |
| 4C2 | 136–151 | 6.95 | 1.54 | 30.00 | 0.73 | 1.09 | 17.28 | 0.82 | 1.60 | 90.30 | 2.40 | 7.30 | S | |
| Cherán-004 | Ah | 0–39 | 6.28 | 1.66 | 16.38 | 0.39 | 0.23 | 28.80 | 4.16 | 1.09 | 32.40 | 55.10 | 12.50 | SiL |
| Bw1 | 39–60 | 6.91 | 1.68 | 19.68 | 0.54 | 0.23 | 18.62 | 2.73 | 1.04 | 32.40 | 51.20 | 16.40 | SiL | |
| Bw2 | 60–131 | 6.84 | 1.61 | 25.04 | 0.79 | 0.10 | 25.92 | 2.86 | 0.93 | 15.90 | 61.30 | 22.80 | SiL | |
| Bw3 | 131–194 | 7.45 | 1.58 | 25.87 | 1.18 | 0.08 | 33.79 | 1.82 | 0.94 | 15.50 | 57.80 | 26.70 | SiL | |
| Zacapu-001 | Ah | 0–18 | 5.92 | 1.66 | 16.38 | 0.39 | 0.23 | 28.80 | 4.16 | 1.27 | 32.40 | 55.10 | 12.50 | SiL |
| Bw1 | 18–59 | 5.91 | 1.68 | 19.68 | 0.54 | 0.23 | 18.62 | 2.73 | 1.39 | 32.40 | 51.20 | 16.40 | SiL | |
| Bw2 | 59–89 | 6.21 | 1.61 | 25.04 | 0.79 | 0.10 | 25.92 | 2.86 | 1.24 | 15.90 | 61.30 | 22.80 | SiL | |
| Bm | 89–127 | -- | 1.58 | 25.87 | 1.18 | 0.08 | 33.79 | 1.82 | 1.60 | 15.50 | 57.80 | 26.70 | SiL | |
| Zacapu-002 | Ah | 0–12 | 6.74 | 1.70 | 24.03 | 0.36 | 1.09 | 29.18 | 3.12 | 0.95 | 14.70 | 57.40 | 27.90 | SiCL |
| Bw1 | 12–28 | 6.58 | 1.61 | 27.60 | 0.86 | 1.19 | 48.19 | 2.34 | 0.90 | 4.80 | 71.40 | 23.80 | SiL | |
| Bw2 | 28–53 | 6.67 | 1.68 | 21.15 | 0.56 | 0.66 | 41.28 | 2.73 | 1.14 | 8.50 | 67.40 | 24.10 | SiL | |
| Bw3 | 53–78 | 6.62 | 1.67 | 28.43 | 0.86 | 0.94 | 37.82 | 1.30 | 1.03 | 6.80 | 65.50 | 27.60 | SiCL | |
| Bw4 | 78–104 | 6.67 | 1.57 | 28.80 | 0.79 | 0.65 | 49.54 | 0.78 | 1.01 | 3.50 | 60.60 | 35.90 | SiCL | |
| C | 104–140 | 6.76 | 1.50 | 29.55 | 0.99 | 0.35 | 57.98 | 0.65 | 1.00 | 2.20 | 52.70 | 45.10 | SiC | |
| Zacapu-003 | Ah | 0–21 | 5.93 | 1.71 | 24.06 | 0.58 | 2.02 | 43.39 | 4.42 | 1.15 | 4.20 | 66.90 | 28.90 | SiCL |
| Bw1 | 21–37 | 6.23 | 1.59 | 27.90 | 0.62 | 0.89 | 48.00 | 5.46 | 1.06 | 1.30 | 60.60 | 38.10 | SiCL | |
| Bw2 | 37–88 | 6.11 | 1.62 | 26.85 | 0.79 | 3.79 | 41.09 | 1.30 | 1.10 | 1.50 | 49.80 | 48.70 | SiC | |
| Bw3 | 88–128 | 6.46 | 1.65 | 22.83 | 0.60 | 0.99 | 29.76 | 0.39 | 1.33 | 1.60 | 51.70 | 46.60 | SiC | |
| 2Bbw | 128–153 | 6.75 | 1.66 | 22.94 | 0.79 | 0.99 | 25.15 | 0.78 | 1.53 | 2.60 | 67.60 | 29.80 | SiCL | |
| Quiroga-001 | Ah | 0–15 | 6.48 | 1.64 | 18.53 | 0.49 | 1.08 | 51.65 | 4.55 | 0.98 | 6.10 | 72.10 | 21.80 | SiL |
| Bt1 | 15–46 | 6.89 | 1.68 | 24.51 | 0.66 | 2.53 | 59.71 | 0.52 | 1.24 | 3.20 | 57.80 | 39.10 | SiCL | |
| Bt2 | 46–63 | 7.02 | 1.66 | 25.54 | 1.01 | 2.02 | 49.73 | 0.78 | 0.93 | 4.10 | 58.90 | 37.00 | SiCL | |
| Bt3 | 63–81 | 7.02 | 1.62 | 26.77 | 1.05 | 0.85 | 45.70 | 1.30 | 1.15 | 4.50 | 55.10 | 40.40 | SiC | |
| Bt4 | 81–113 | 6.49 | 1.65 | 27.76 | 1.35 | 1.20 | 51.26 | 0.00 | 1.20 | 4.50 | 57.00 | 38.50 | SiCL | |
| Bt5 | 113–150 | 7.05 | 1.69 | 21.82 | 1.50 | 0.77 | 51.07 | 0.00 | 1.35 | 1.80 | 65.30 | 32.90 | SiCL | |
| Quiroga-002 | Ah | 0–29 | 6.33 | 1.56 | 28.18 | 0.77 | 2.78 | 40.13 | 5.97 | 0.97 | 4.30 | 66.50 | 29.30 | SiCL |
| Bw | 29–65 | 6.69 | 1.57 | 30.03 | 0.97 | 2.53 | 31.30 | 2.47 | 1.07 | 4.00 | 63.20 | 32.90 | SiCL | |
| BwC | 65–104 | 7.25 | 1.56 | 27.14 | 1.09 | 1.89 | 37.82 | 0.52 | 1.00 | 5.10 | 56.00 | 38.90 | SiCL | |
| C | 104–163 | 6.85 | 1.65 | 28.53 | 1.97 | 1.89 | 39.74 | 0.78 | 1.00 | 4.40 | 65.00 | 30.70 | SiCL | |
CEC = cation exchange capacity (cmol kg−1); OM = organic matter (%); BD = bulk density (g cm−3); L = loam; SL = sandy loam; SiL = silty loam; LS = loamy sand; S = sand; SiCL = silty clayey loam; SiC = silty clay.
Table 4.
Chemical and physical properties of the soils expressed per unit area.
| Profile Key | Soil | HC (cm día−1) | FC (L m−2) | AC (L m−2) | FE (kg m−2) | CEC (mol m−2) | SOC (t ha−1) |
|---|---|---|---|---|---|---|---|
| Cherán-001 | Antrosol (Andic, Loamic, Sideralic) | 24.5 | 709.95 | 195.31 | 2088.20 | 341.14 | 310.22 |
| Cherán-002 | Eutrosilic Skeletic Silandic Andosol (Profundihumic, Siltic) | 123 | 350.45 | 87.35 | 570.61 | 173.00 | 198.26 |
| Cherán-003 | Andosol over Cambisol over Regosol | 97 | 364.29 | 149.72 | 1082.05 | 391.51 | 131.18 |
| Cherán-004 | Eutrosilic Mollic Andosol (Siltic) | 87.5 | 843.41 | 190.97 | 1820.88 | 512.76 | 296.24 |
| Zacapu-002 | Eutrosilic Silandic Andosol (Siltinovic) | 82 | 450.20 | 82.25 | 1042.60 | 450.65 | 105.78 |
| Quiroga-002 | Eutric Skeletic Mollic Silandic Andosol (Loamic) | 82 | 431.95 | 78.37 | 923.74 | 389.04 | 149.41 |
| Zacapu-001 | Leptic Cambisol (Siltic Profundihumic) | 20 | 311.32 | 67.72 | 1135.60 | 320.21 | 176.86 |
| Quiroga-001 | Haplic Luvisol (Andic, Cutanic, Differentic, Humic, Loamic, Magnesic, Profondic) | 19.5 | 540.89 | 91.27 | 1635.54 | 857.31 | 71.69 |
| Zacapu-003 | Cambic Phaeozem (Andic, Clayic, Profundihumic) | 16 | 629.45 | 86.45 | 1886.60 | 671.23 | 185.59 |
HC = hydraulic conductivity; FC = field capacity; AC = air capacity; FE = fine earth; CEC = cation exchange capacity; SOC = soil organic carbon.
Table 5.
Environmental soil functions (1: very low; 2: low; 3: intermediate; 4: high; 5: very high).
Table 5.
Environmental soil functions (1: very low; 2: low; 3: intermediate; 4: high; 5: very high).
| Profile Key | HH | N | N (Mod) | NA | CA | DOC | RA (Qa) | RA (Qu) | NR | SHV (5 cm) | AQ | AQ (Mod) |
|---|---|---|---|---|---|---|---|---|---|---|---|---|
| Cherán-001 | 4 | 1 | 1 | 1 | 1 | 2 | 4 | 5 | 5 | 3 | 5 | 4 |
| Cherán-002 | 4 | 4 | 5 | 1 | 1 | 5 | 3 | 5 | 4 | 3 | 5 | 3 |
| Cherán-003 | 1 | 4 | 4 | 5 | 1 | 4 | 3 | 5 | 5 | 4 | 5 | 3 |
| Cherán-004 | 4 | 4 | 1 | 1 | 1 | 2 | 3 | 5 | 5 | 3 | 5 | 3 |
| Zacapu-002 | 4 | 4 | 4 | 5 | 1 | 3 | 3 | 5 | 5 | 4 | 3 | 1 |
| Quiroga-002 | 3 | 4 | 5 | 1 | 1 | 5 | 3 | 5 | 5 | 3 | 5 | 3 |
| Zacapu-001 | 4 | 4 | 1 | 1 | 1 | 2 | 4 | 3 | 5 | 3 | 3 | 2 |
| Quiroga-001 | 5 | 4 | 4 | 1 | 1 | 2 | 5 | 3 | 5 | 4 | 3 | 2 |
| Zacapu-003 | 5 | 4 | 4 | 5 | 1 | 2 | 4 | 3 | 5 | 3 | 3 | 2 |
HH = human habitat; N= naturalness; N (Mod) = naturalness modified; NA = natural archive; CA = cultural archive; DOC = decomposition of organic compounds; RA = recharge of aquifers; Qa = quality; Qu = quantity; NR = nutrient retention; SHV = sorption of heavy metals; AQ= agricultural quality; AQ (Mod) = agricultural quality modified.
© 2019 by the authors. Licensee MDPI, Basel, Switzerland. This article is an open access article distributed under the terms and conditions of the Creative Commons Attribution (CC BY) license (http://creativecommons.org/licenses/by/4.0/).
Share and Cite
MDPI and ACS Style
Gallegos, Á.; López-Carmona, D.; Bautista, F. Quantitative Assessment of Environmental Soil Functions in Volcanic Zones from Mexico Using S&E Software. Sustainability 2019, 11, 4552. https://0-doi-org.brum.beds.ac.uk/10.3390/su11174552
AMA Style
Gallegos Á, López-Carmona D, Bautista F. Quantitative Assessment of Environmental Soil Functions in Volcanic Zones from Mexico Using S&E Software. Sustainability. 2019; 11(17):4552. https://0-doi-org.brum.beds.ac.uk/10.3390/su11174552
Chicago/Turabian StyleGallegos, Ángeles, Dante López-Carmona, and Francisco Bautista. 2019. "Quantitative Assessment of Environmental Soil Functions in Volcanic Zones from Mexico Using S&E Software" Sustainability 11, no. 17: 4552. https://0-doi-org.brum.beds.ac.uk/10.3390/su11174552
Note that from the first issue of 2016, this journal uses article numbers instead of page numbers. See further details here.