Economic Sustainability Study of São Miguel Island in the Azores Using Photovoltaic Panels and Wind Turbines


1
Department of Electrical and Computer Engineering, Instituto Superior Técnico, 1049-001 Lisboa, Portugal
2
Department of Electrical and Computer Engineering, Instituto de Telecomunicações, Instituto Superior Técnico, 1049-001 Lisboa, Portugal
*
Author to whom correspondence should be addressed.
Sustainability 2019, 11(17), 4782; https://0-doi-org.brum.beds.ac.uk/10.3390/su11174782
Submission received: 15 July 2019
/
Revised: 19 August 2019
/
Accepted: 28 August 2019
/
Published: 2 September 2019
Abstract
:Currently, the nine islands of the Autonomous Region of the Azores have fossil fuel power stations as their main source of electric power. Each island has an independent electrical system classified as an isolated micro-system, given its size and location. The goal of this study is to analyze the best set of technologies for a sustainable hybrid system. This study will be applied first on São Miguel to make the largest island of the archipelago 100% renewable. We will consider factors such as the island’s actual data production, economic scenarios, growth perspectives of consumption and reliability of supply.
1. Introduction
On a worldwide level, there are many initiatives available to increase the utilization rate of renewable energies on islands, thereby reducing their dependence on fossil fuels and allowing their transformation towards more sustainable energy systems. Several islands follow these initiatives and have set ambitious goals for the transformation of their energy systems [1].
The problem of confirming and predicting the effect of energy savings is subject to data on energy consumption volumes, climate data, geo-information and socio-economic conditions, among others [2]. With these data, it is possible to form predictive functions of energy consumption and make better choices concerning the renewable sources to be used in the design of each micro-net.
In general, islands provide favorable conditions for the use of some renewable energies. However, it must be stated that it is complicated to have a 100% renewable system in a micro-network like the Azores islands, because the huge oscillation in the weather during the year makes it difficult to predict the energy production of each renewable source.
To establish a sustainable hybrid system is a good solution for isolated islands like the Azores, because, in addition to allowing lower energy costs, such a system also avoids the requirement of transporting fuels to the islands. This transport is sometimes complicated given the distance, adverse conditions of the sea, or even the ports themselves, though mainly by the costs associated with the operation.
2. Description of Problem and Ways of Solving It
The Azores archipelago is one of the outermost regions of the European Union, and its oceanic position shows great geographical isolation. The autonomous region is made up of nine islands, with a total of 246,772 residents and an area of 2346 km2, with 744.6 km2 attributable to São Miguel Island.
These islands are located in the transition zone between hot and humid air masses of subtropical origin and air masses with cooler and drier characteristics of subpolar origin [3]. Regarding the climate, it is considered sea temperate, with characteristics of geothermal wet, given the low thermal amplitude, persistent wind, high rainfall and relative humidity.
Generally, islands provide favorable conditions for renewable energy sources, especially due to their favorable wind and solar conditions [1]. In view of the unpredictability of renewable energy production, it is necessary that an isolated micro-network like the Azores have more than one energy source. It is also necessary to implement a storage system to bridge the periods when the sources do not produce sufficient energy, or even when they produce more energy than required.
The main goal of a hybrid power system solution (wind, photovoltaic and energy storage system) is to maximize the contribution of generators and minimize the costs of electricity generation in the life cycle of island networks. In this case, an energy storage system (ESS) is used to store energy during periods of high electricity production and return it for consumption in periods of low solar irradiance or at night [4].
3. Analysis of Values for The Creation of Models
In order to create specific implementation models for São Miguel Island, it was necessary to evaluate the energy production evolution, population evolution, climatic data and existent producer and consumer profiles.
This paper presents the study results for the largest island of the archipelago, and applies the objective in a similar way to the other islands of the Azores.
São Miguel Island
In Table 1, the total capacity installed on São Miguel Island in 2016 with renewable and fossil fuel power plants can be seen [5].
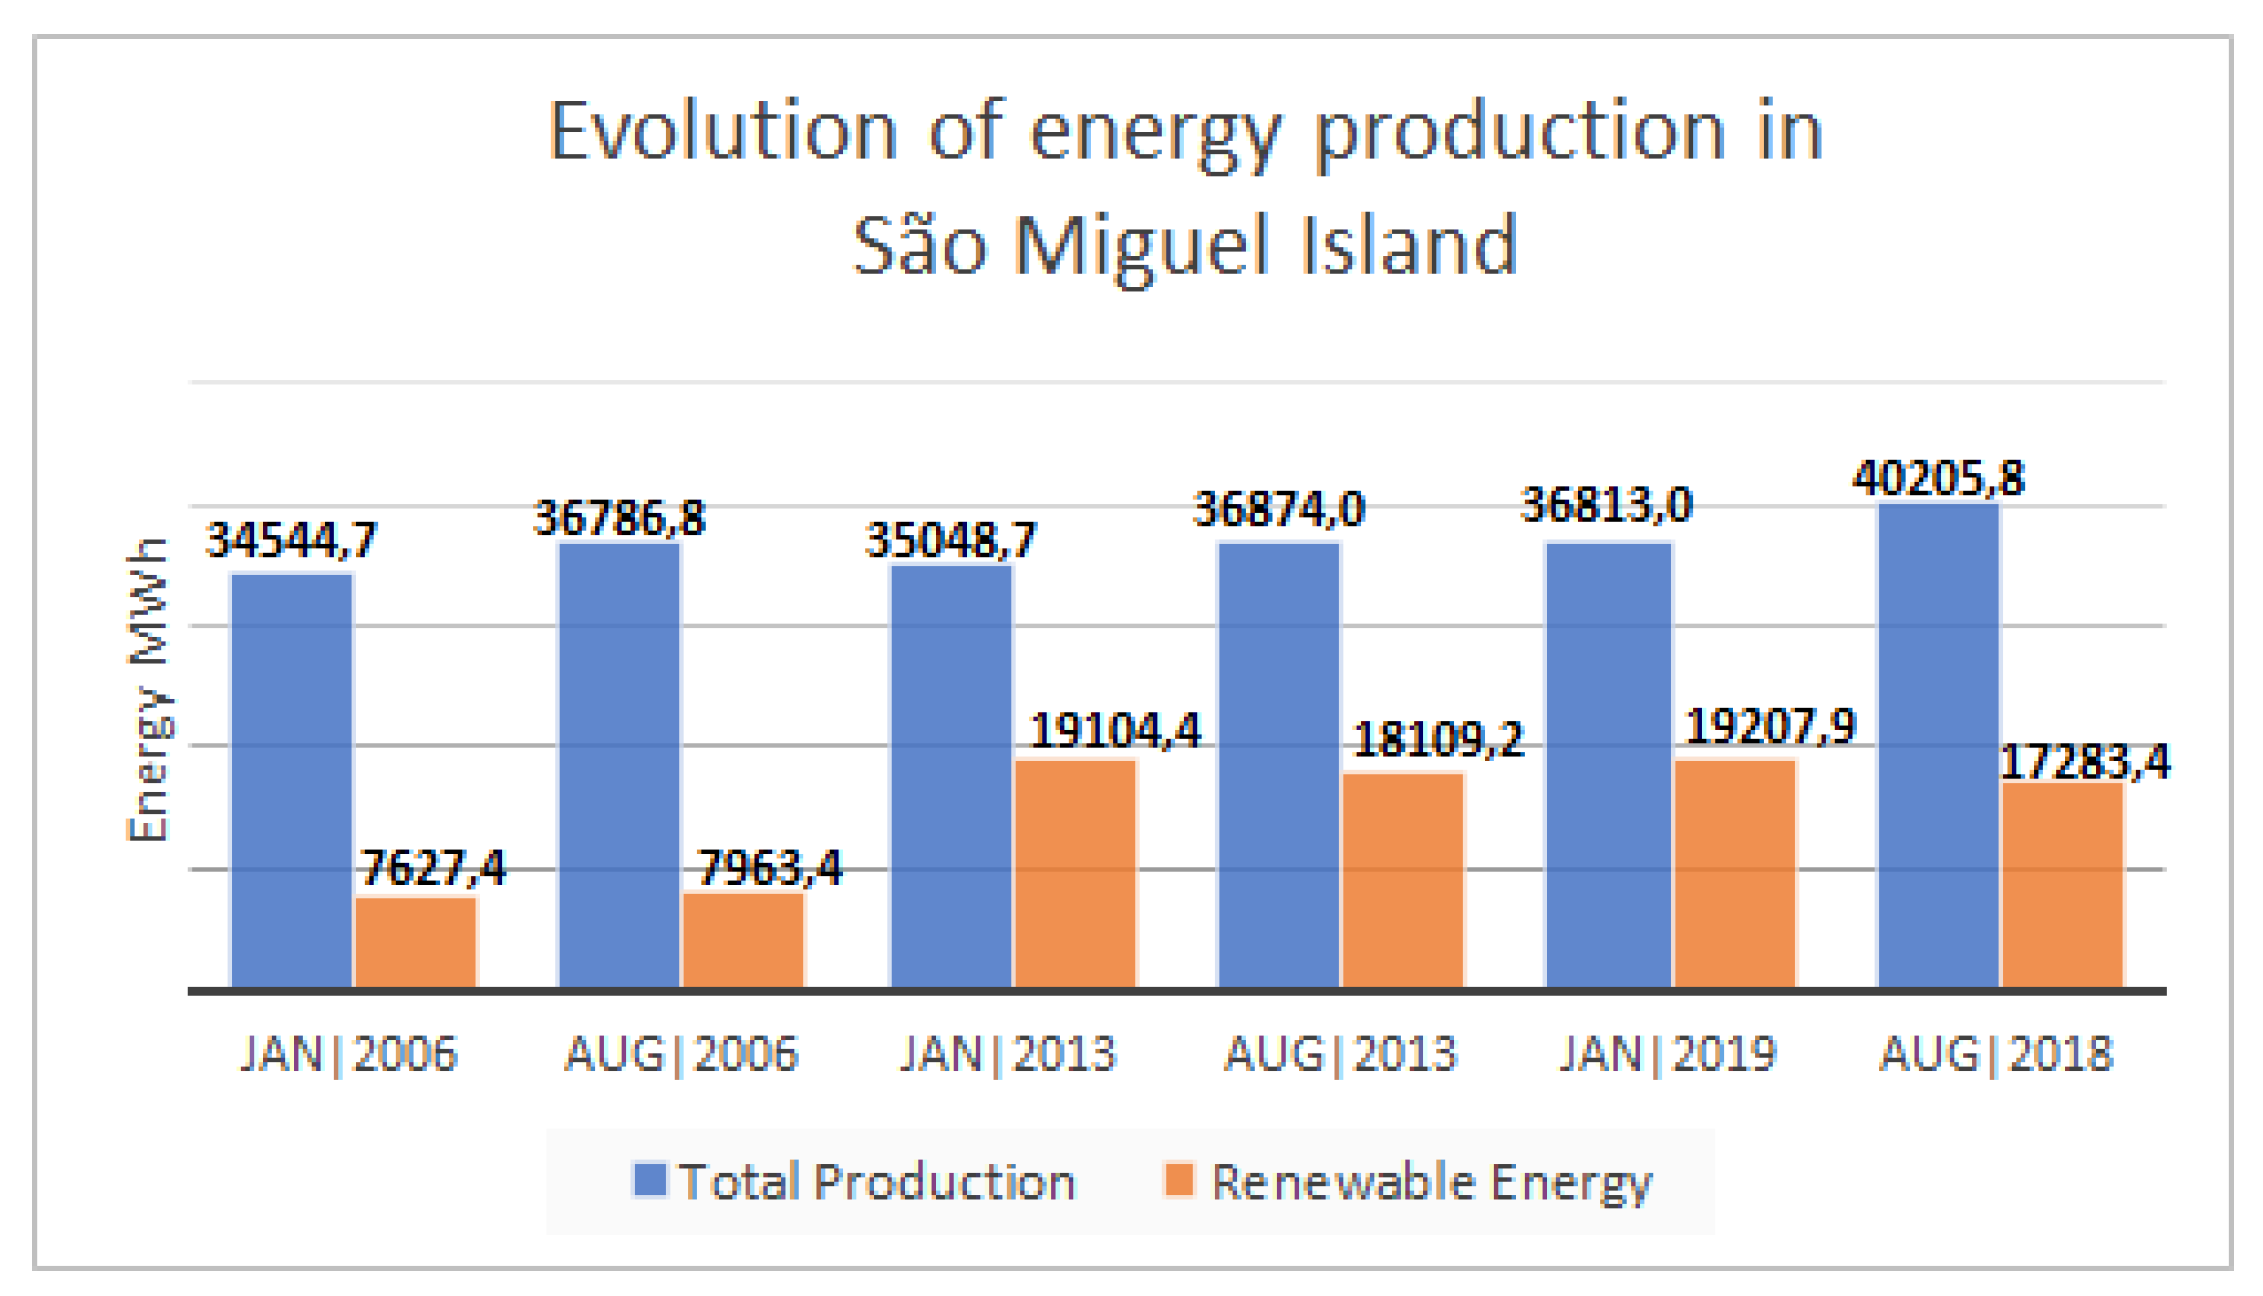
In Figure 1, obtained from documents from the EDA (Electricity from Azores) [6,7,8,9,10,11], the evolution of energy production on the island and the corresponding evolution of renewable energies between 2006 and 2019 are analyzed. In this graphic the months of January and August are depicted, as these are the critical months in terms of production. In January 2019 the maximum tip of the island was 67.76 MW and the minimum reached 31.56 MW. In August 2018 the maximum tip of the island was 71.84 MW and the minimum reached 36.53 MW. It is important to compare the energy production in a summer month and in a winter month, because the wind energy and the photovoltaic energy oscillates, so the total production of renewable energies is different.
According to the most recent data, the annual energy production last year (2018) was 436.9 GWh [12]. Currently, according to data from January 2019 [6], approximately 52% of the energy required is produced by renewable sources, with 40.9% from geothermal sources, 5.1% from wind energy and 6% from hydro energy. By checking the data represented in Figure 1 relative to January 2019, it can be concluded that approximately 48% of energy production is still derived from fossil energy sources.
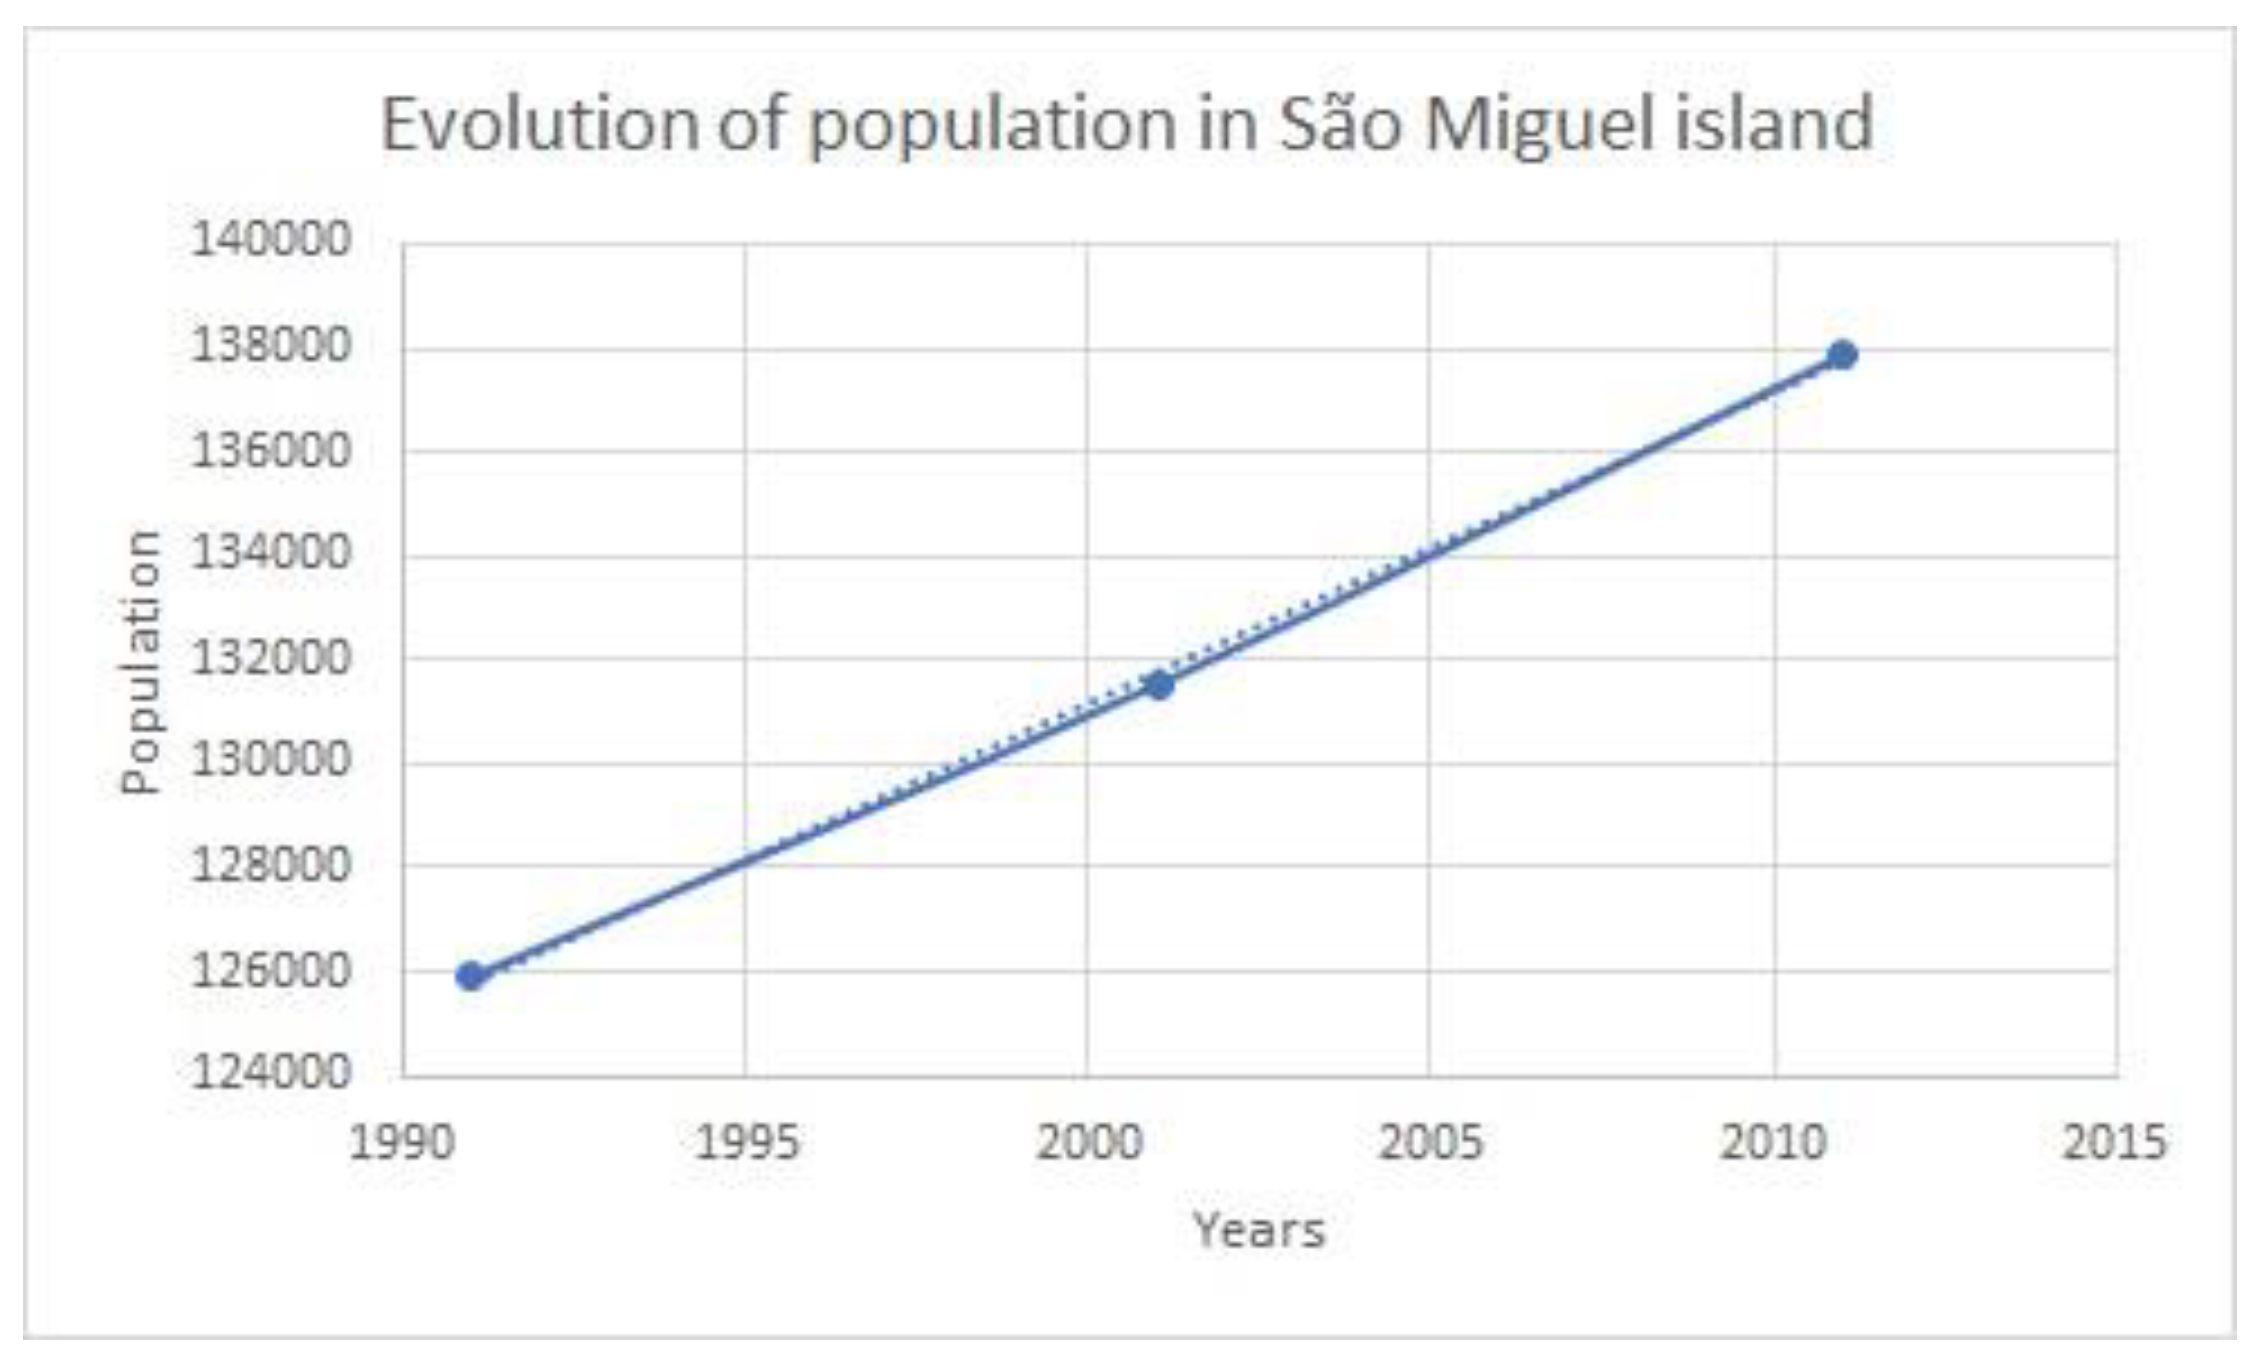
According to the censuses between 1991 and 2011, we can confirm that the evolution of the population on São Miguel was approximately linear (Figure 2). However, according to [5], the last update from 15 June 2018 (INE) of the Provisional Annual Estimates of the Population, the number of inhabitants on São Miguel Island is 138,213. With this estimate of 2018 we can conclude that the population in the next 20 years will not increase linearly, as it did in the previous 20 years. So, the sizing conducted using the data from 2019 will need some adjustments in the next 20 years.
4. Objectives of The Model
The main aim of the model is to establish a completely sustainable island with a hybrid power system (wind power, photovoltaic and energy storage system). For this, it is necessary to implement a battery system with the minimum capacity of the electricity tip. Considering the highest tip of January 2019 [6], because normally in the year this value occurs during the winter time, 70 MW batteries will be required. The two sources of renewable energy, wind and photovoltaic, must produce the remaining energy that is still produced by fossil energy. Accordingly, these two sources have to guarantee approximately 48% of the total production of the island (around 210 GWh), because the other 52% are assured by the other producers of renewable energy that already exist on the island. So, the sizing conducted will be based on this value in order to achieve a 100% renewable island, taking into account the January 2019 results in Figure 1.
The base data for the model creation are:
![Sustainability 11 04782 i001]()

4.1. Solar Panels Sizing
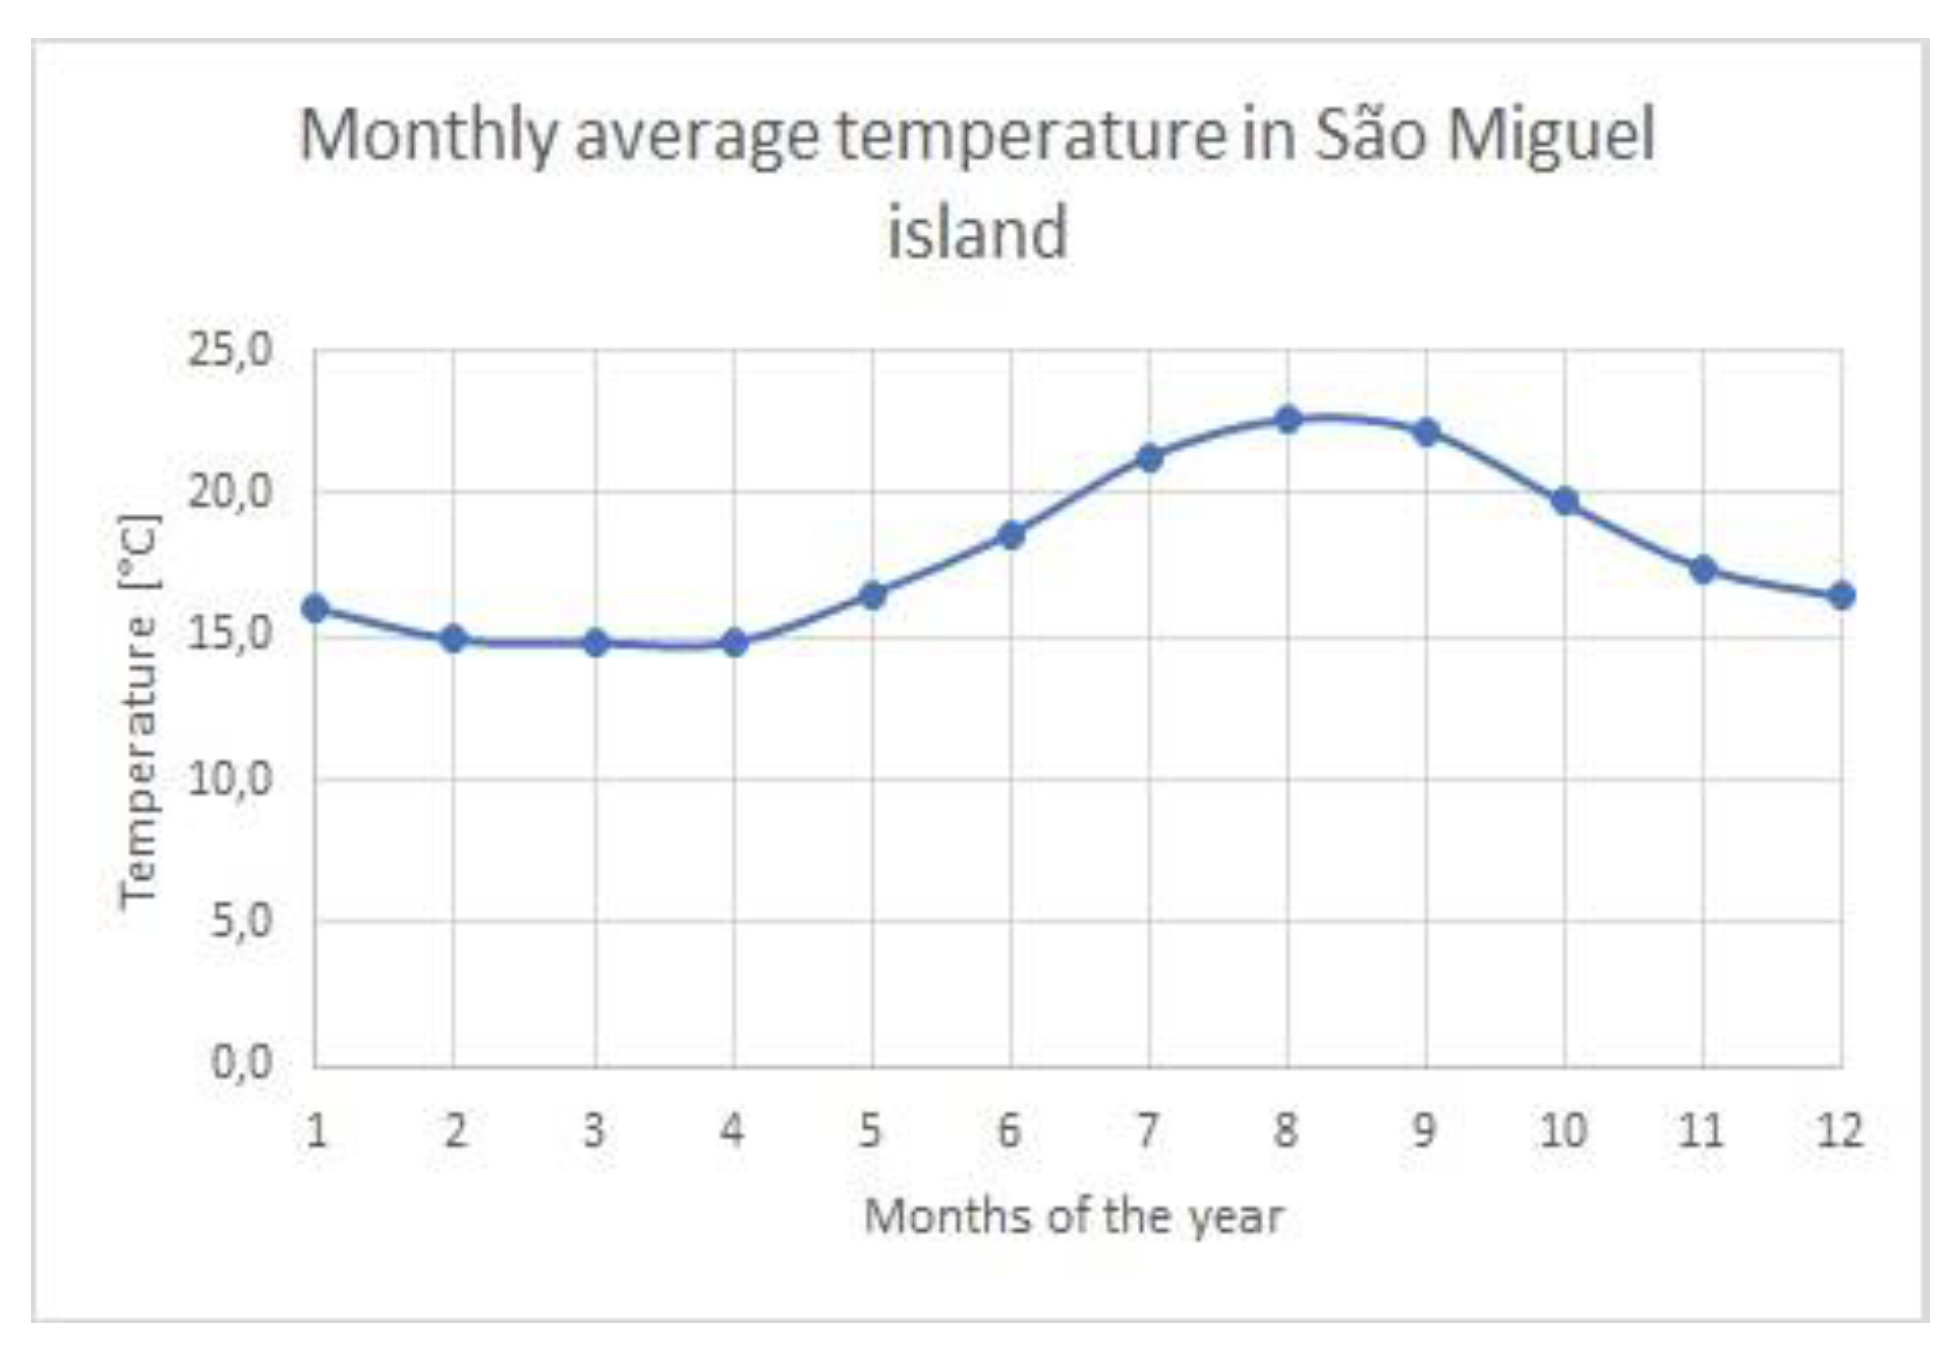
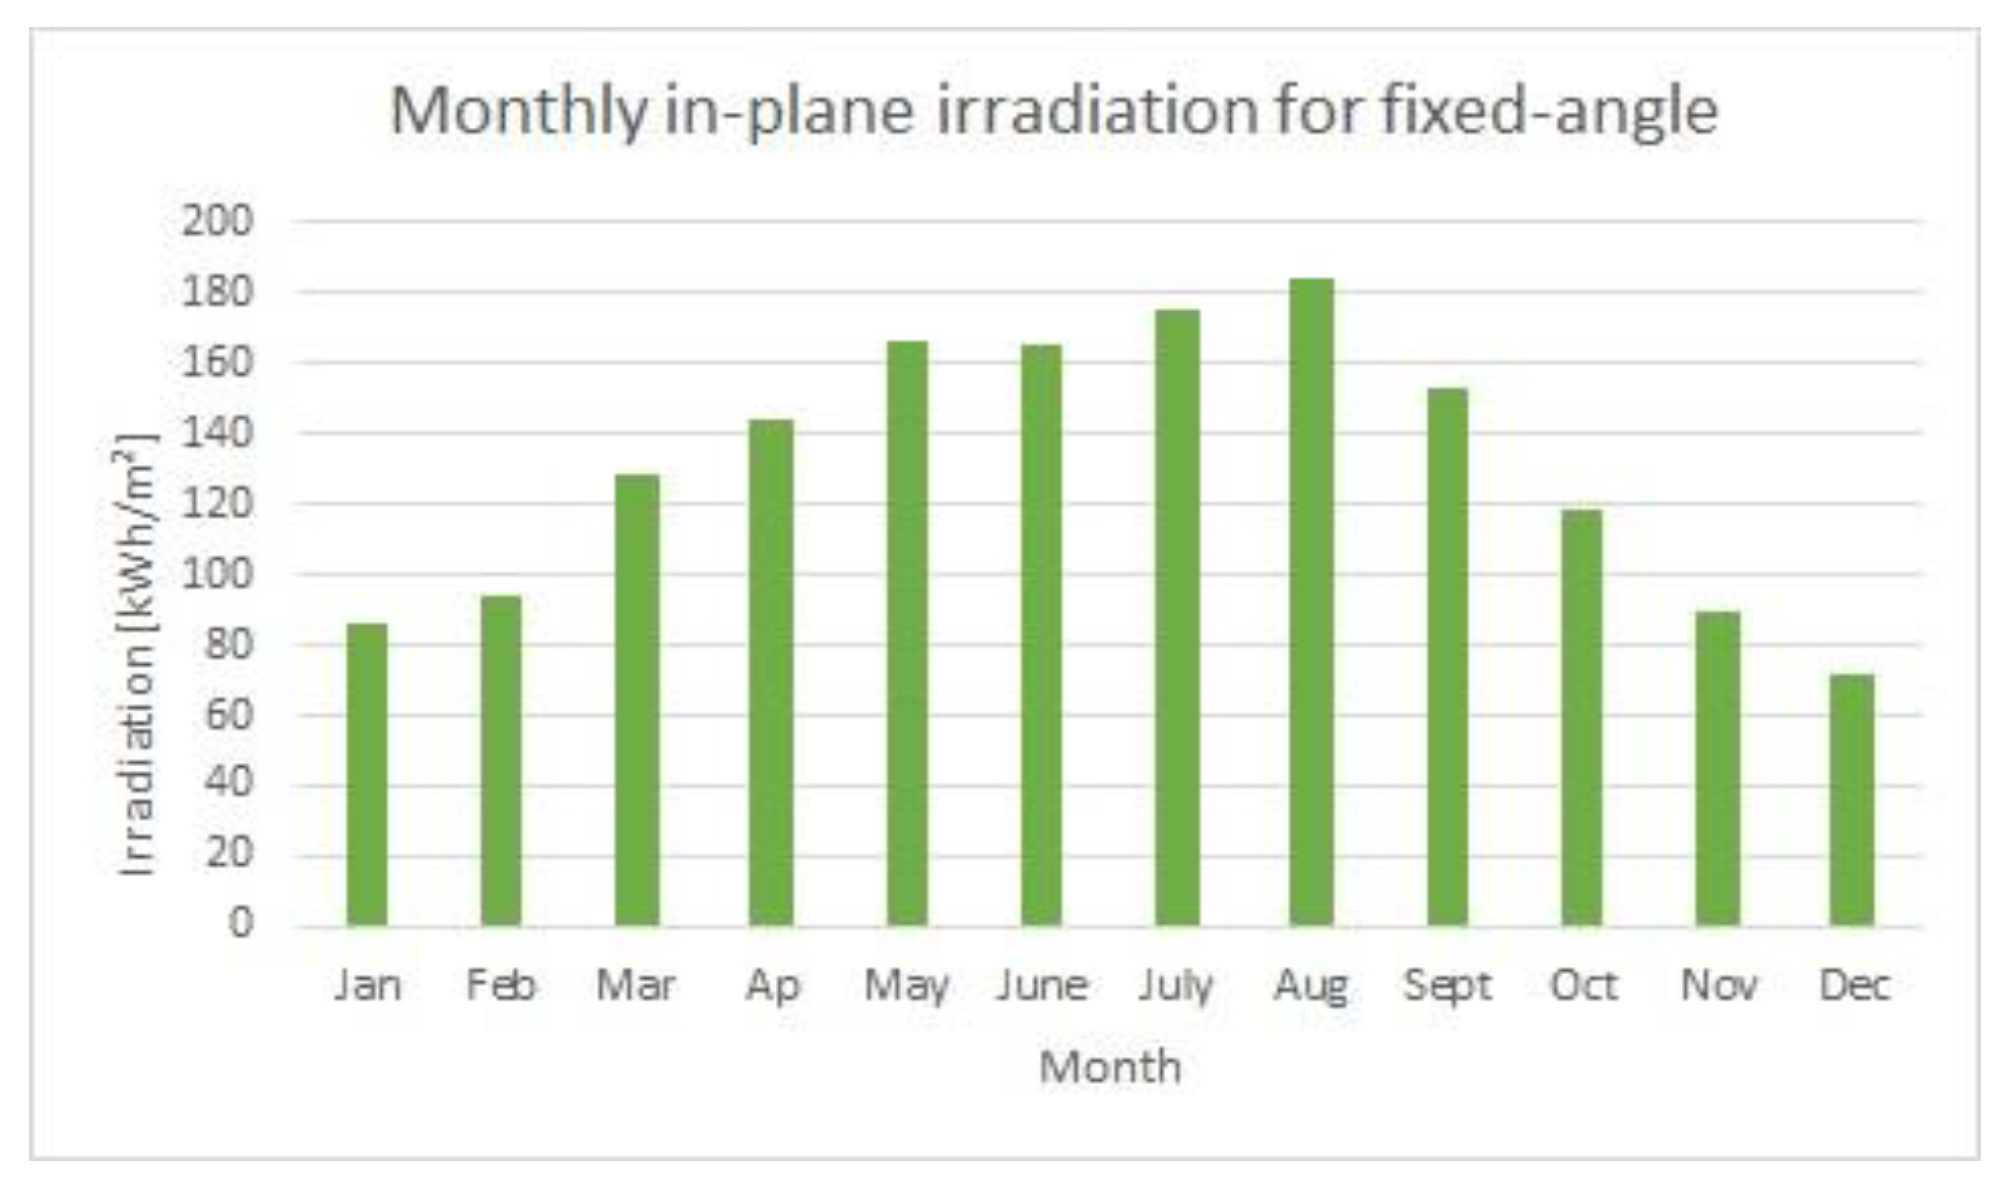
Using the data obtained from the EDA [12], it is possible draw the curve of the monthly average of temperature and irradiance on São Miguel Island for one year, as is represented in Figure 3 and Figure 4, respectively.
The chosen technology for the photovoltaic (PV) panels was crystalline silicon, in this case polycrystalline instead of monocrystalline, because although it does not have a higher efficiency comparative to monocrystalline panels, the cost is lower. Both technologies ensure project viability and long-term throughput.
The sizing introduced in Table 2 was based on crystalline silicon technology with a peak power of 250 W. For the economic study, the selected panels were Axitec panels (model AC-250P/156-60S) with the following specifications: Pmp = 250 Wp, Ump = 30.70 V, Imp = 8.18 A, Uoc = 37.80 V, Isc = 8.71 A, η = 15.37%.
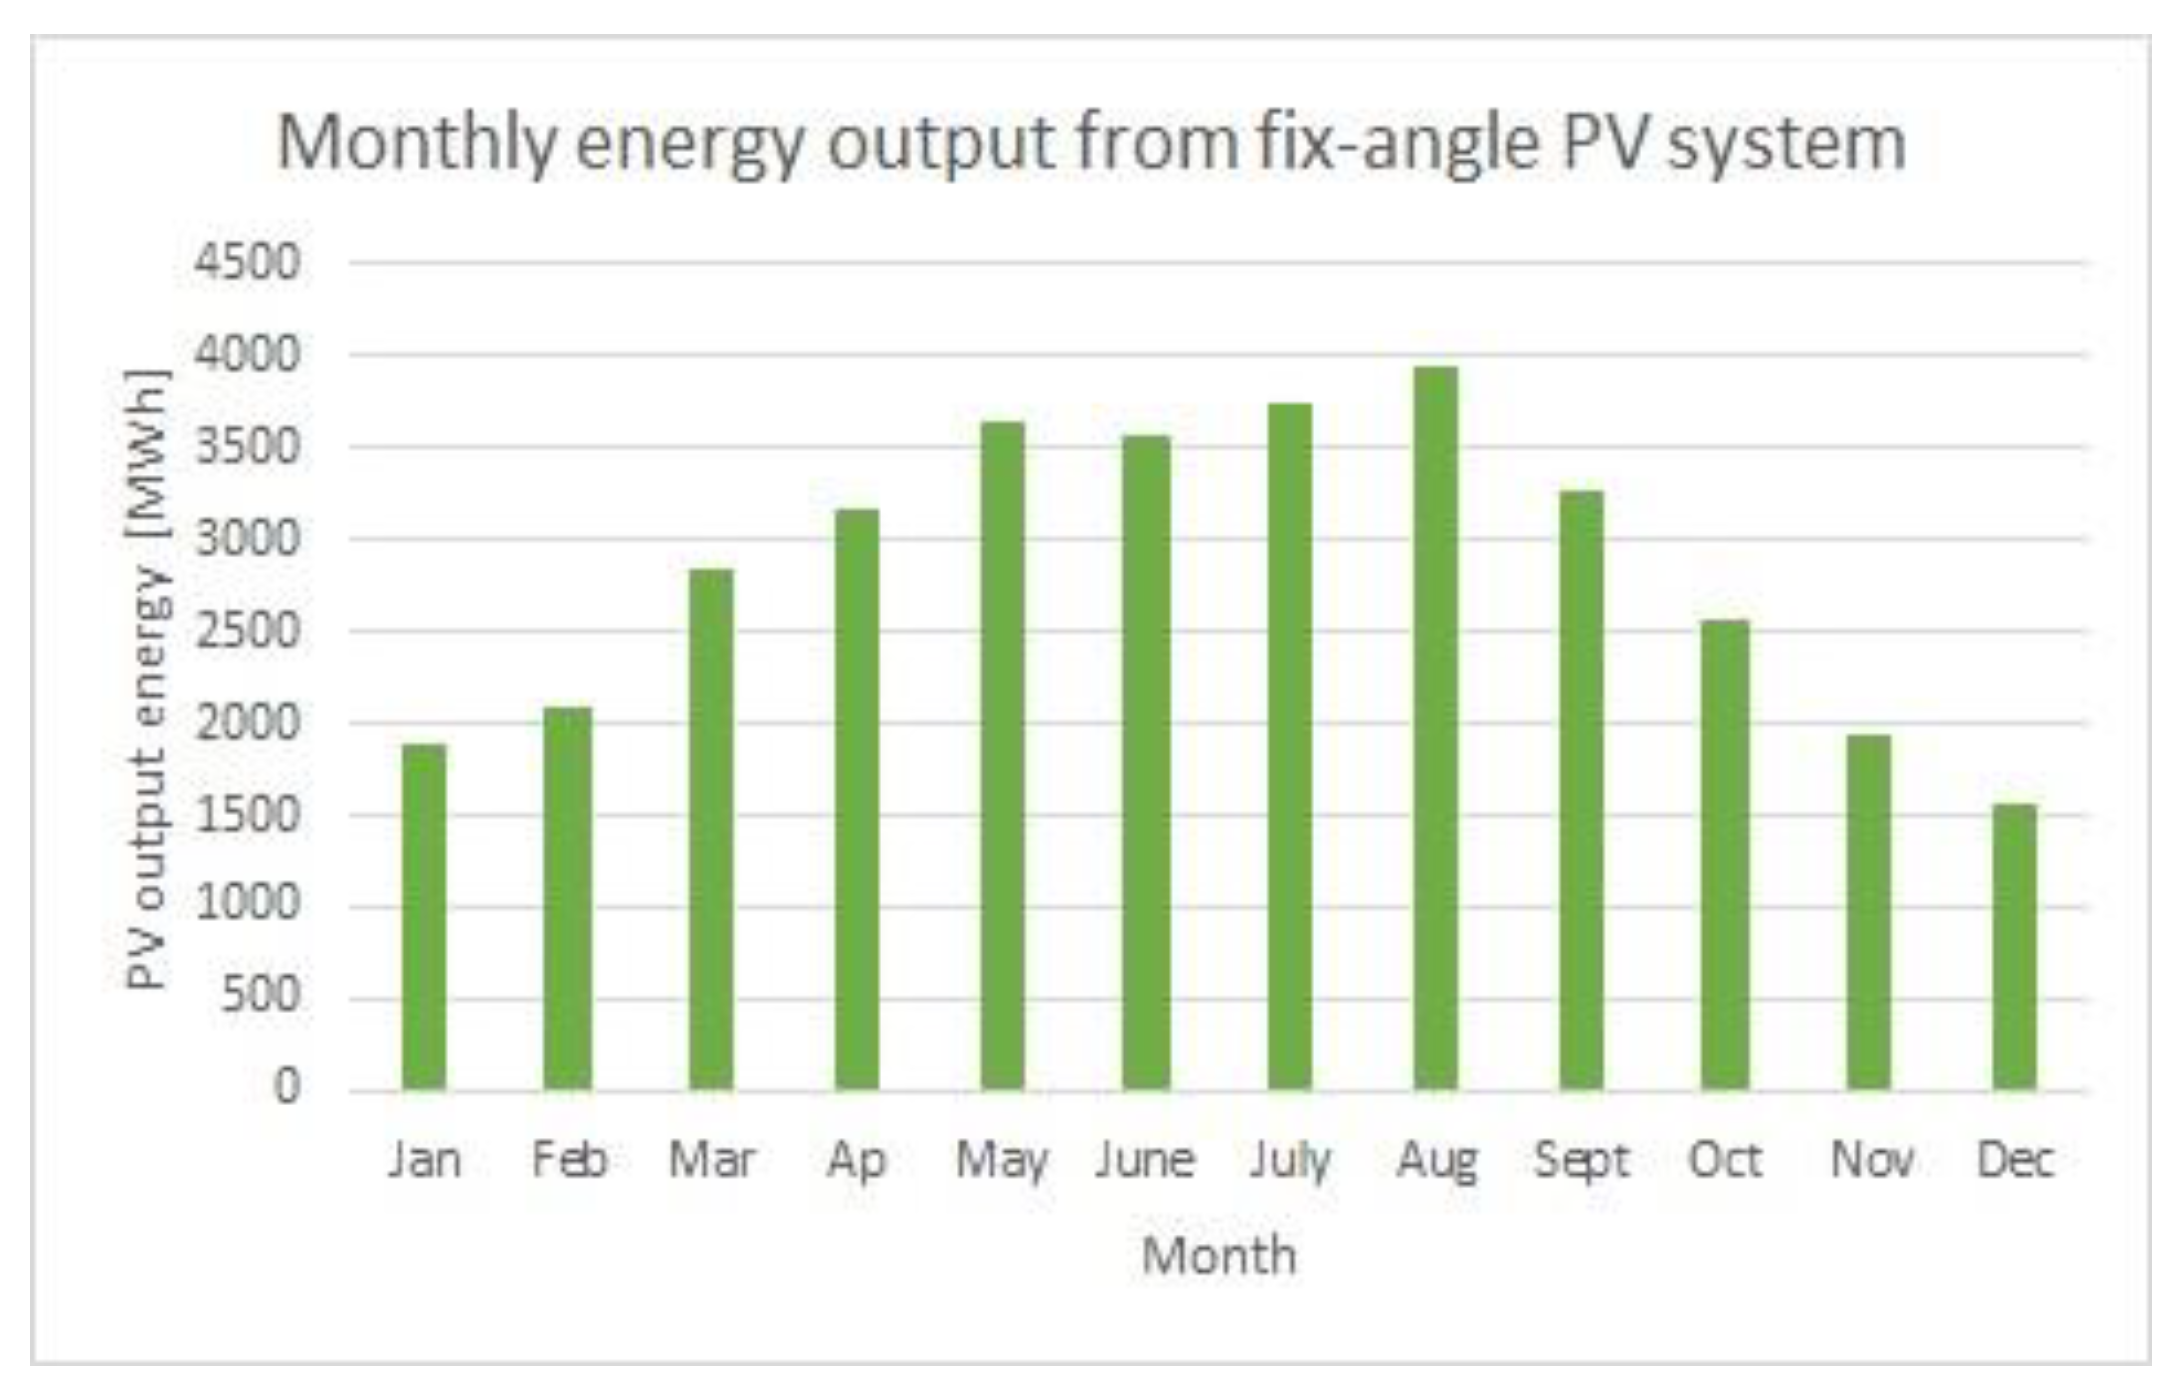
Considering the values of irradiance presented in Figure 4 and the data presented in Table 2 obtained through the simulation made in [13], it was possible to obtain the results of the annual production, as presented in Figure 5.
The standard price for polycrystalline panels is approximately 0.5 euros per watt. So, given the simulation in Table 2, the total investment for solar panels alone is 12.5 million euros. In total, these solar panels occupy an area of 162,688 m2.
4.2. Wind Turbines Sizing
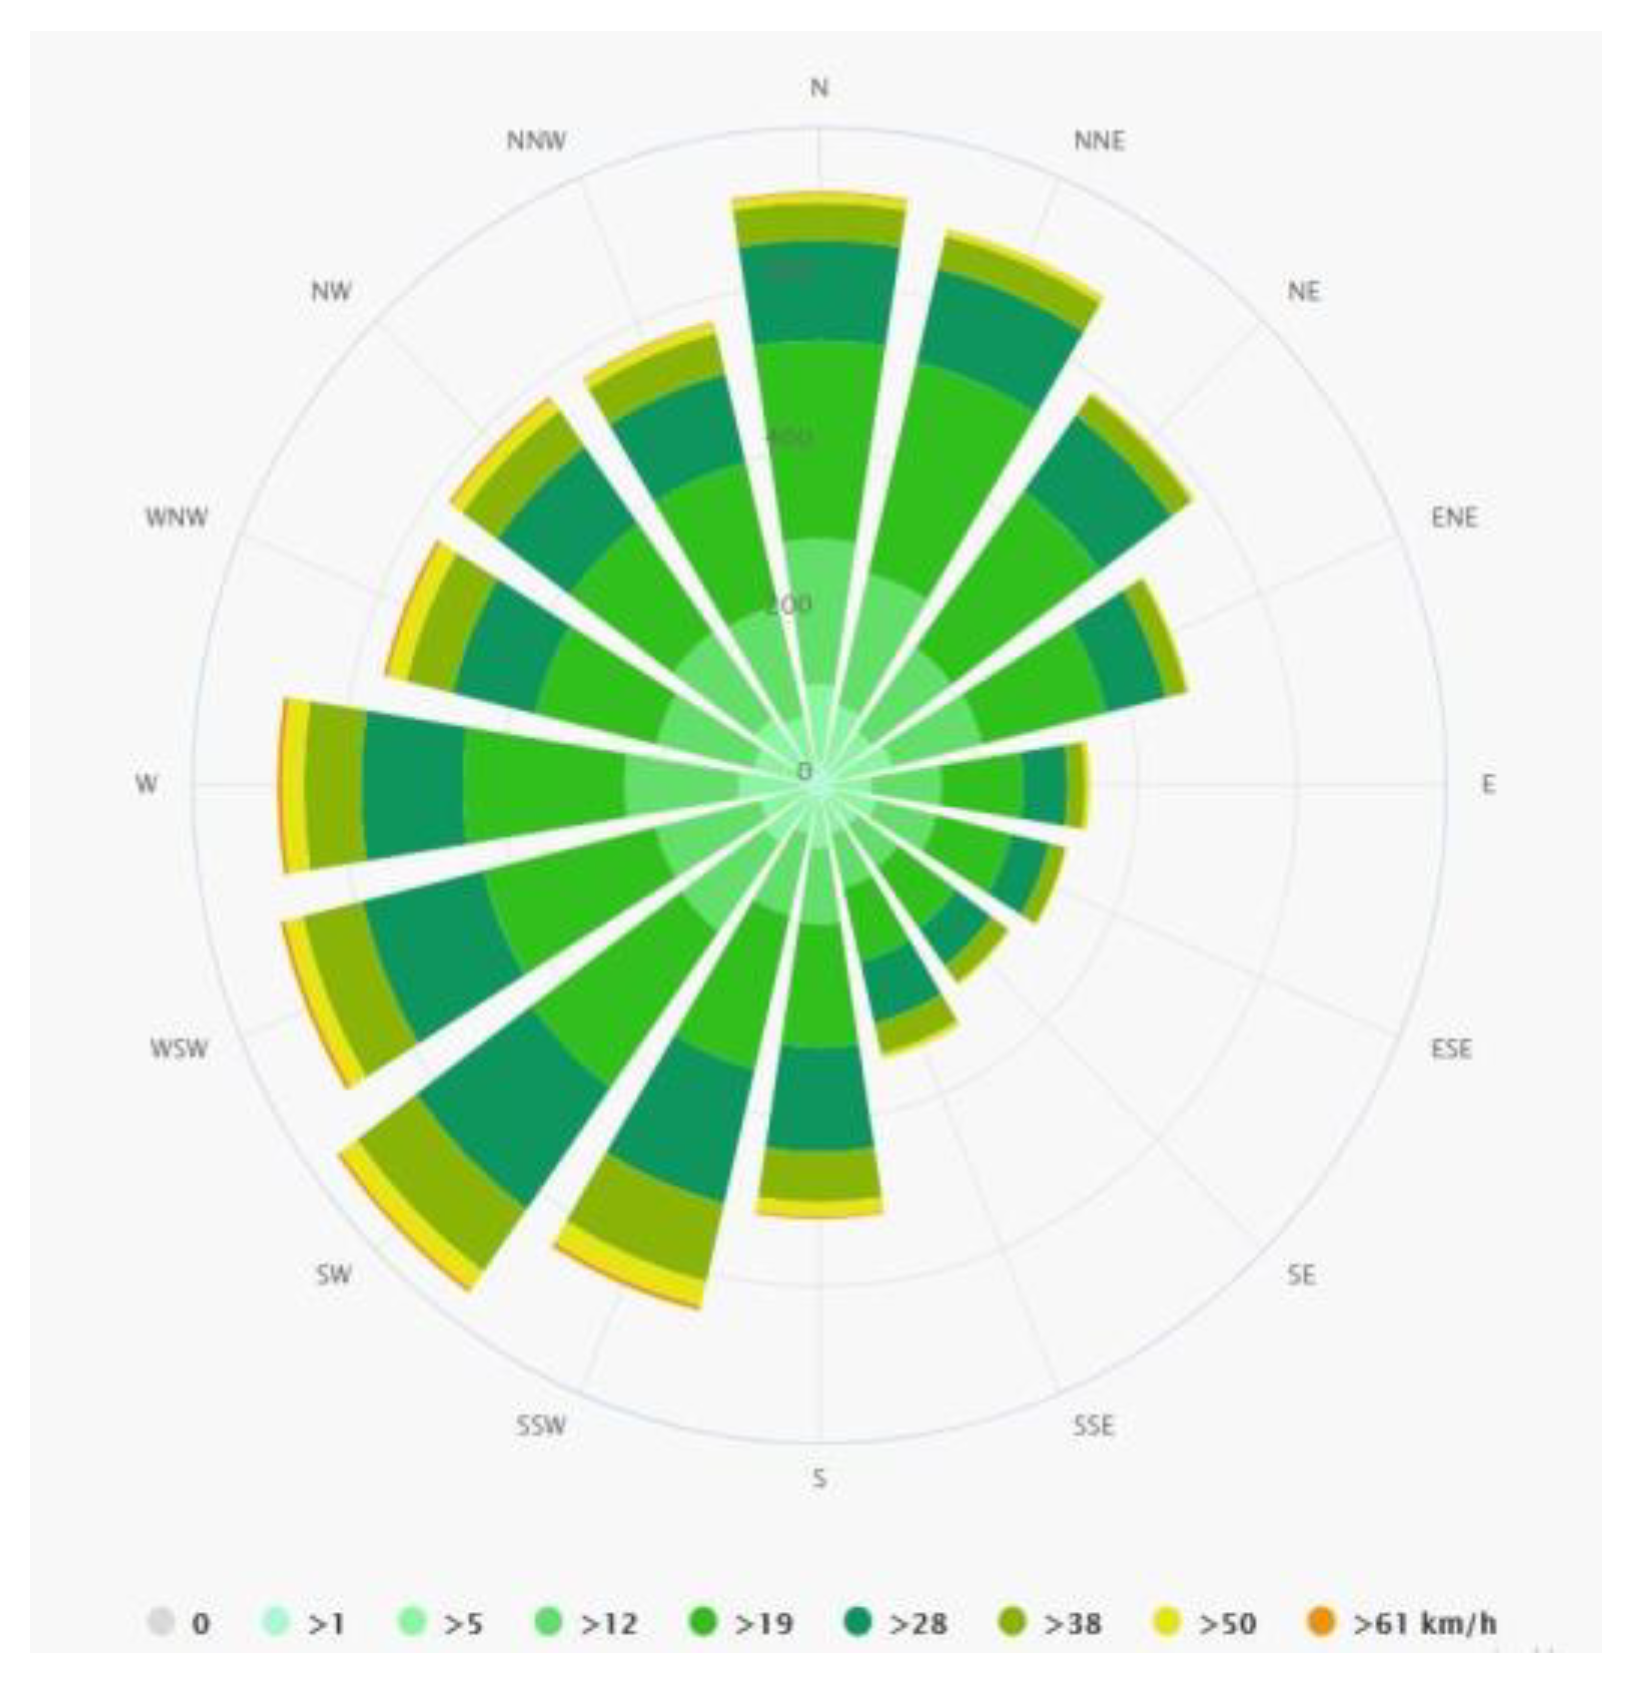
According to data from the meteorological site Meteoblue [14], in 2018 the prevailing winds throughout the island came from the southwest and north, as seen in Figure 6, so this is the best direction to install the wind turbines.
With a typical power curve of a wind turbine of 2 MW with a cut-in speed of 3 m/s, a rated speed of 14 m/s and a cut-off speed of 25 m/s, coupled with the results presented in the histogram in Figure 7 representing the hourly wind speed over one year, it is possible to estimate the total monthly wind production over one year.
The suggested sizing is 90 MW for wind production, composed of 45 turbines, each with a nominal power of 2 MW.
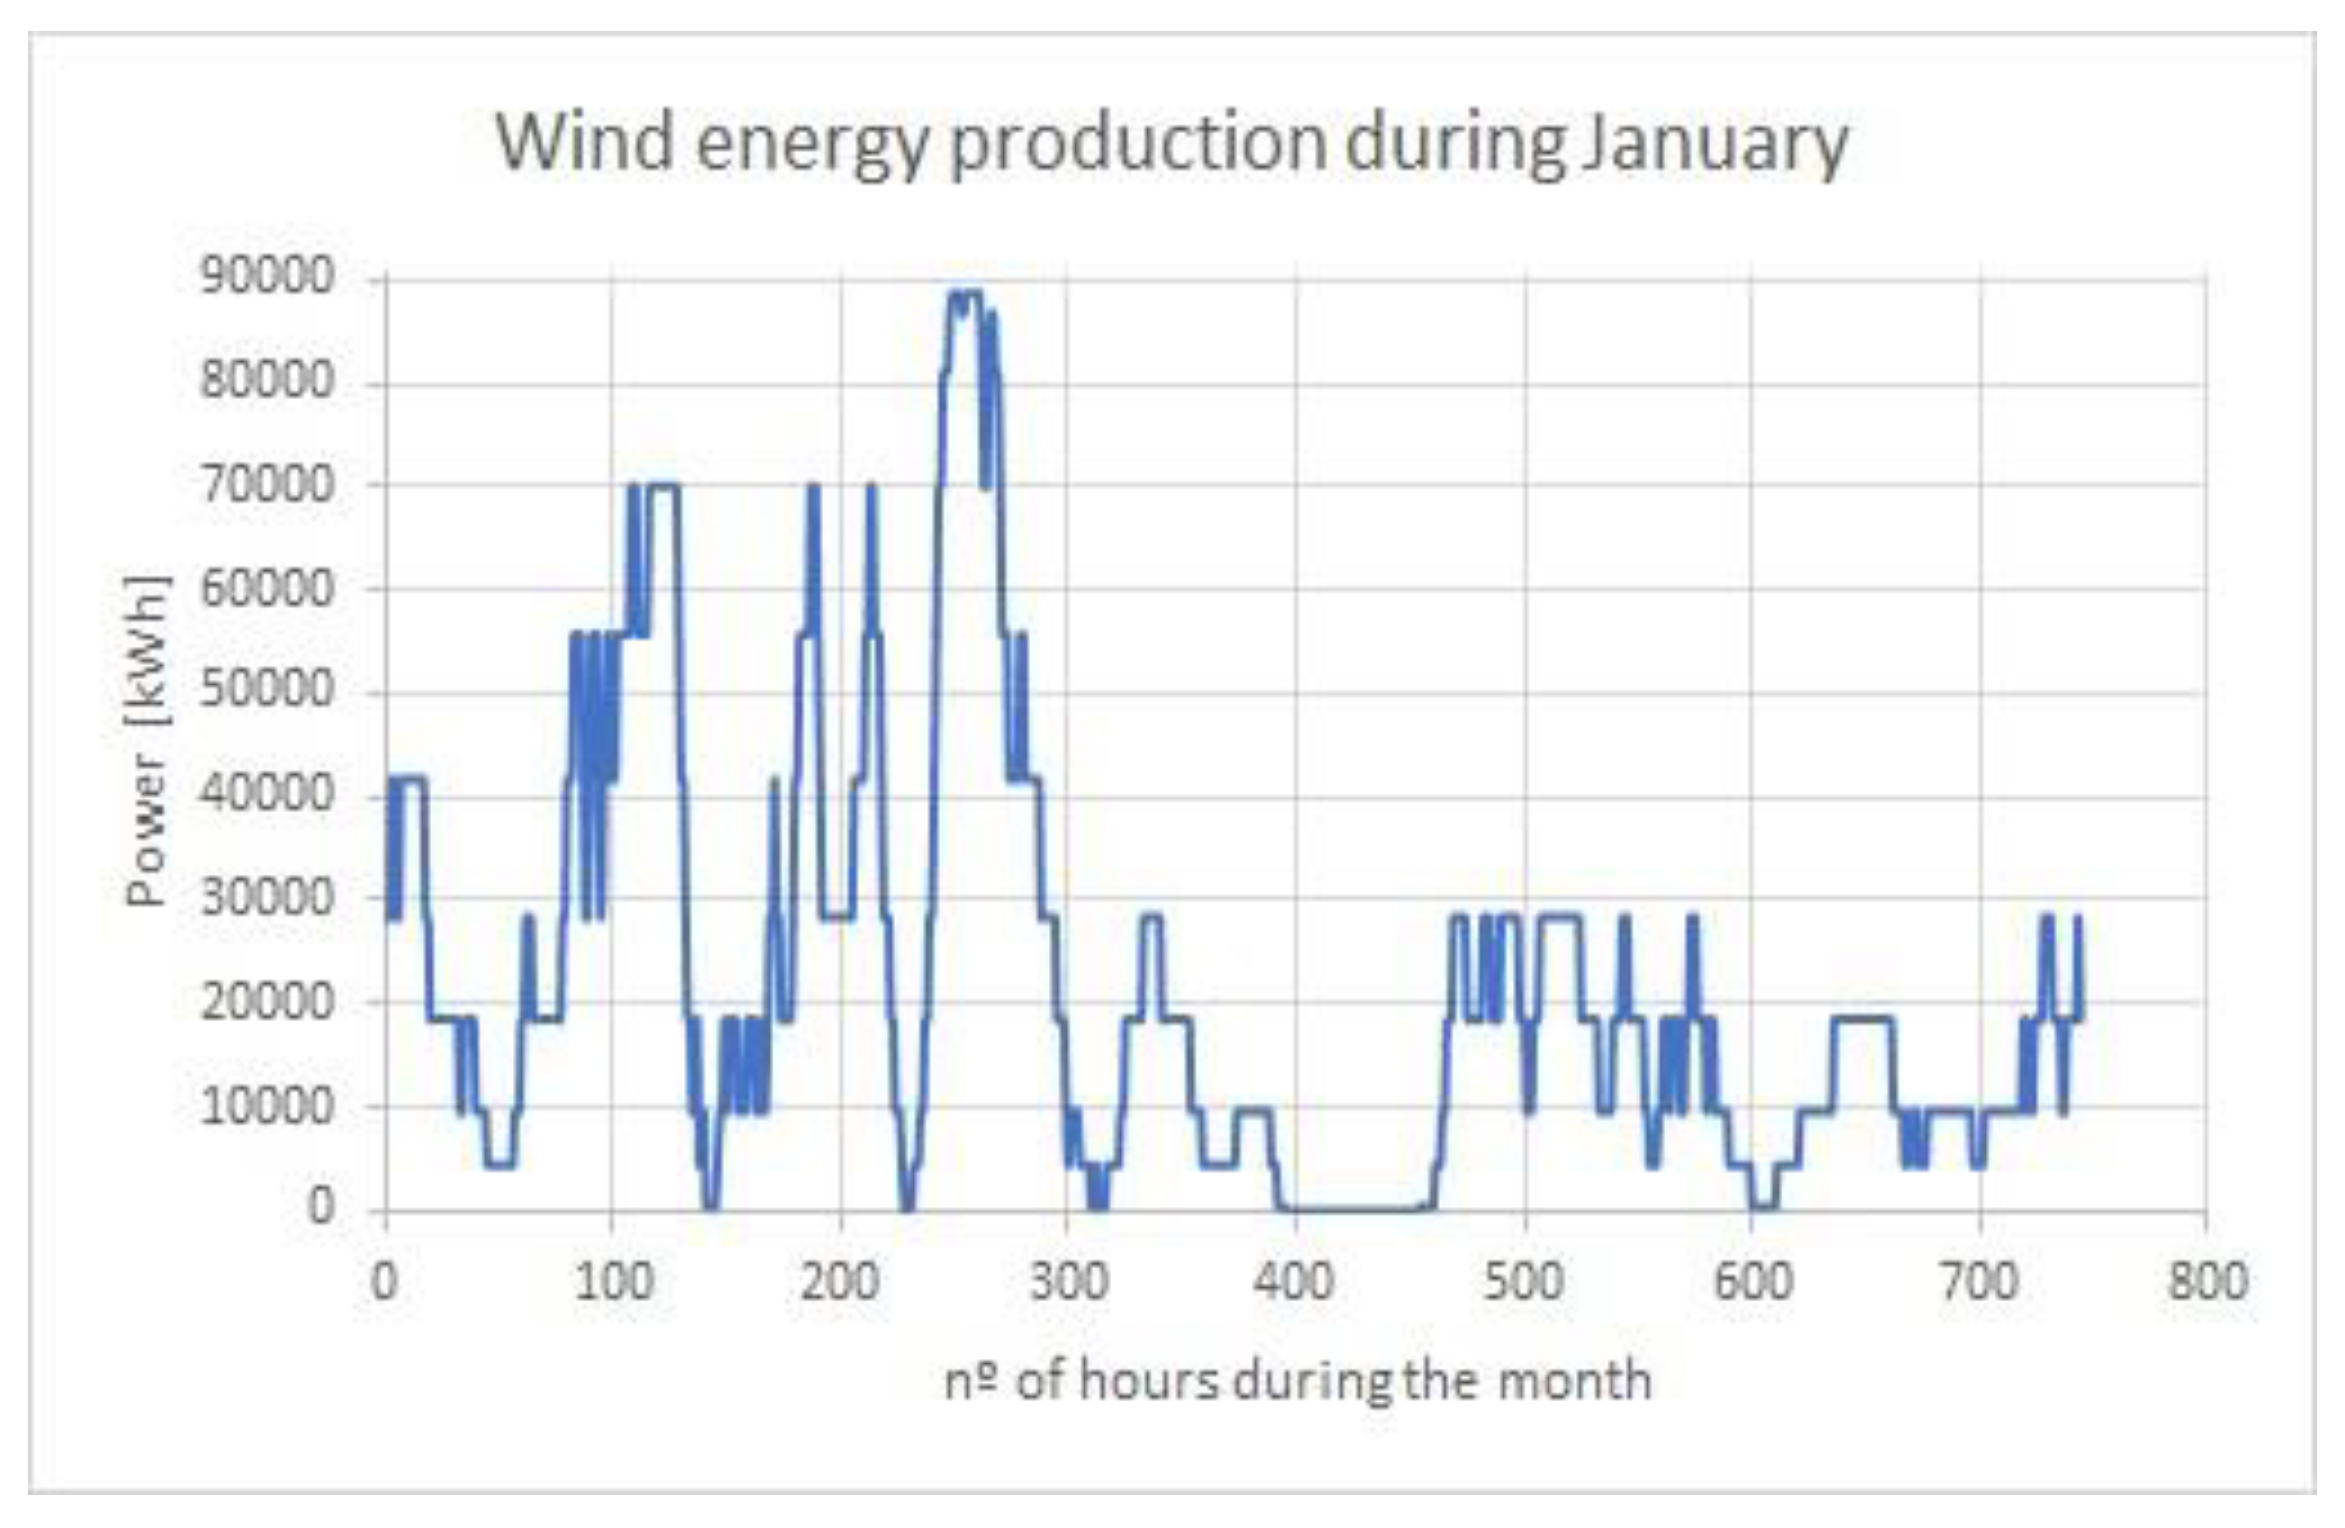
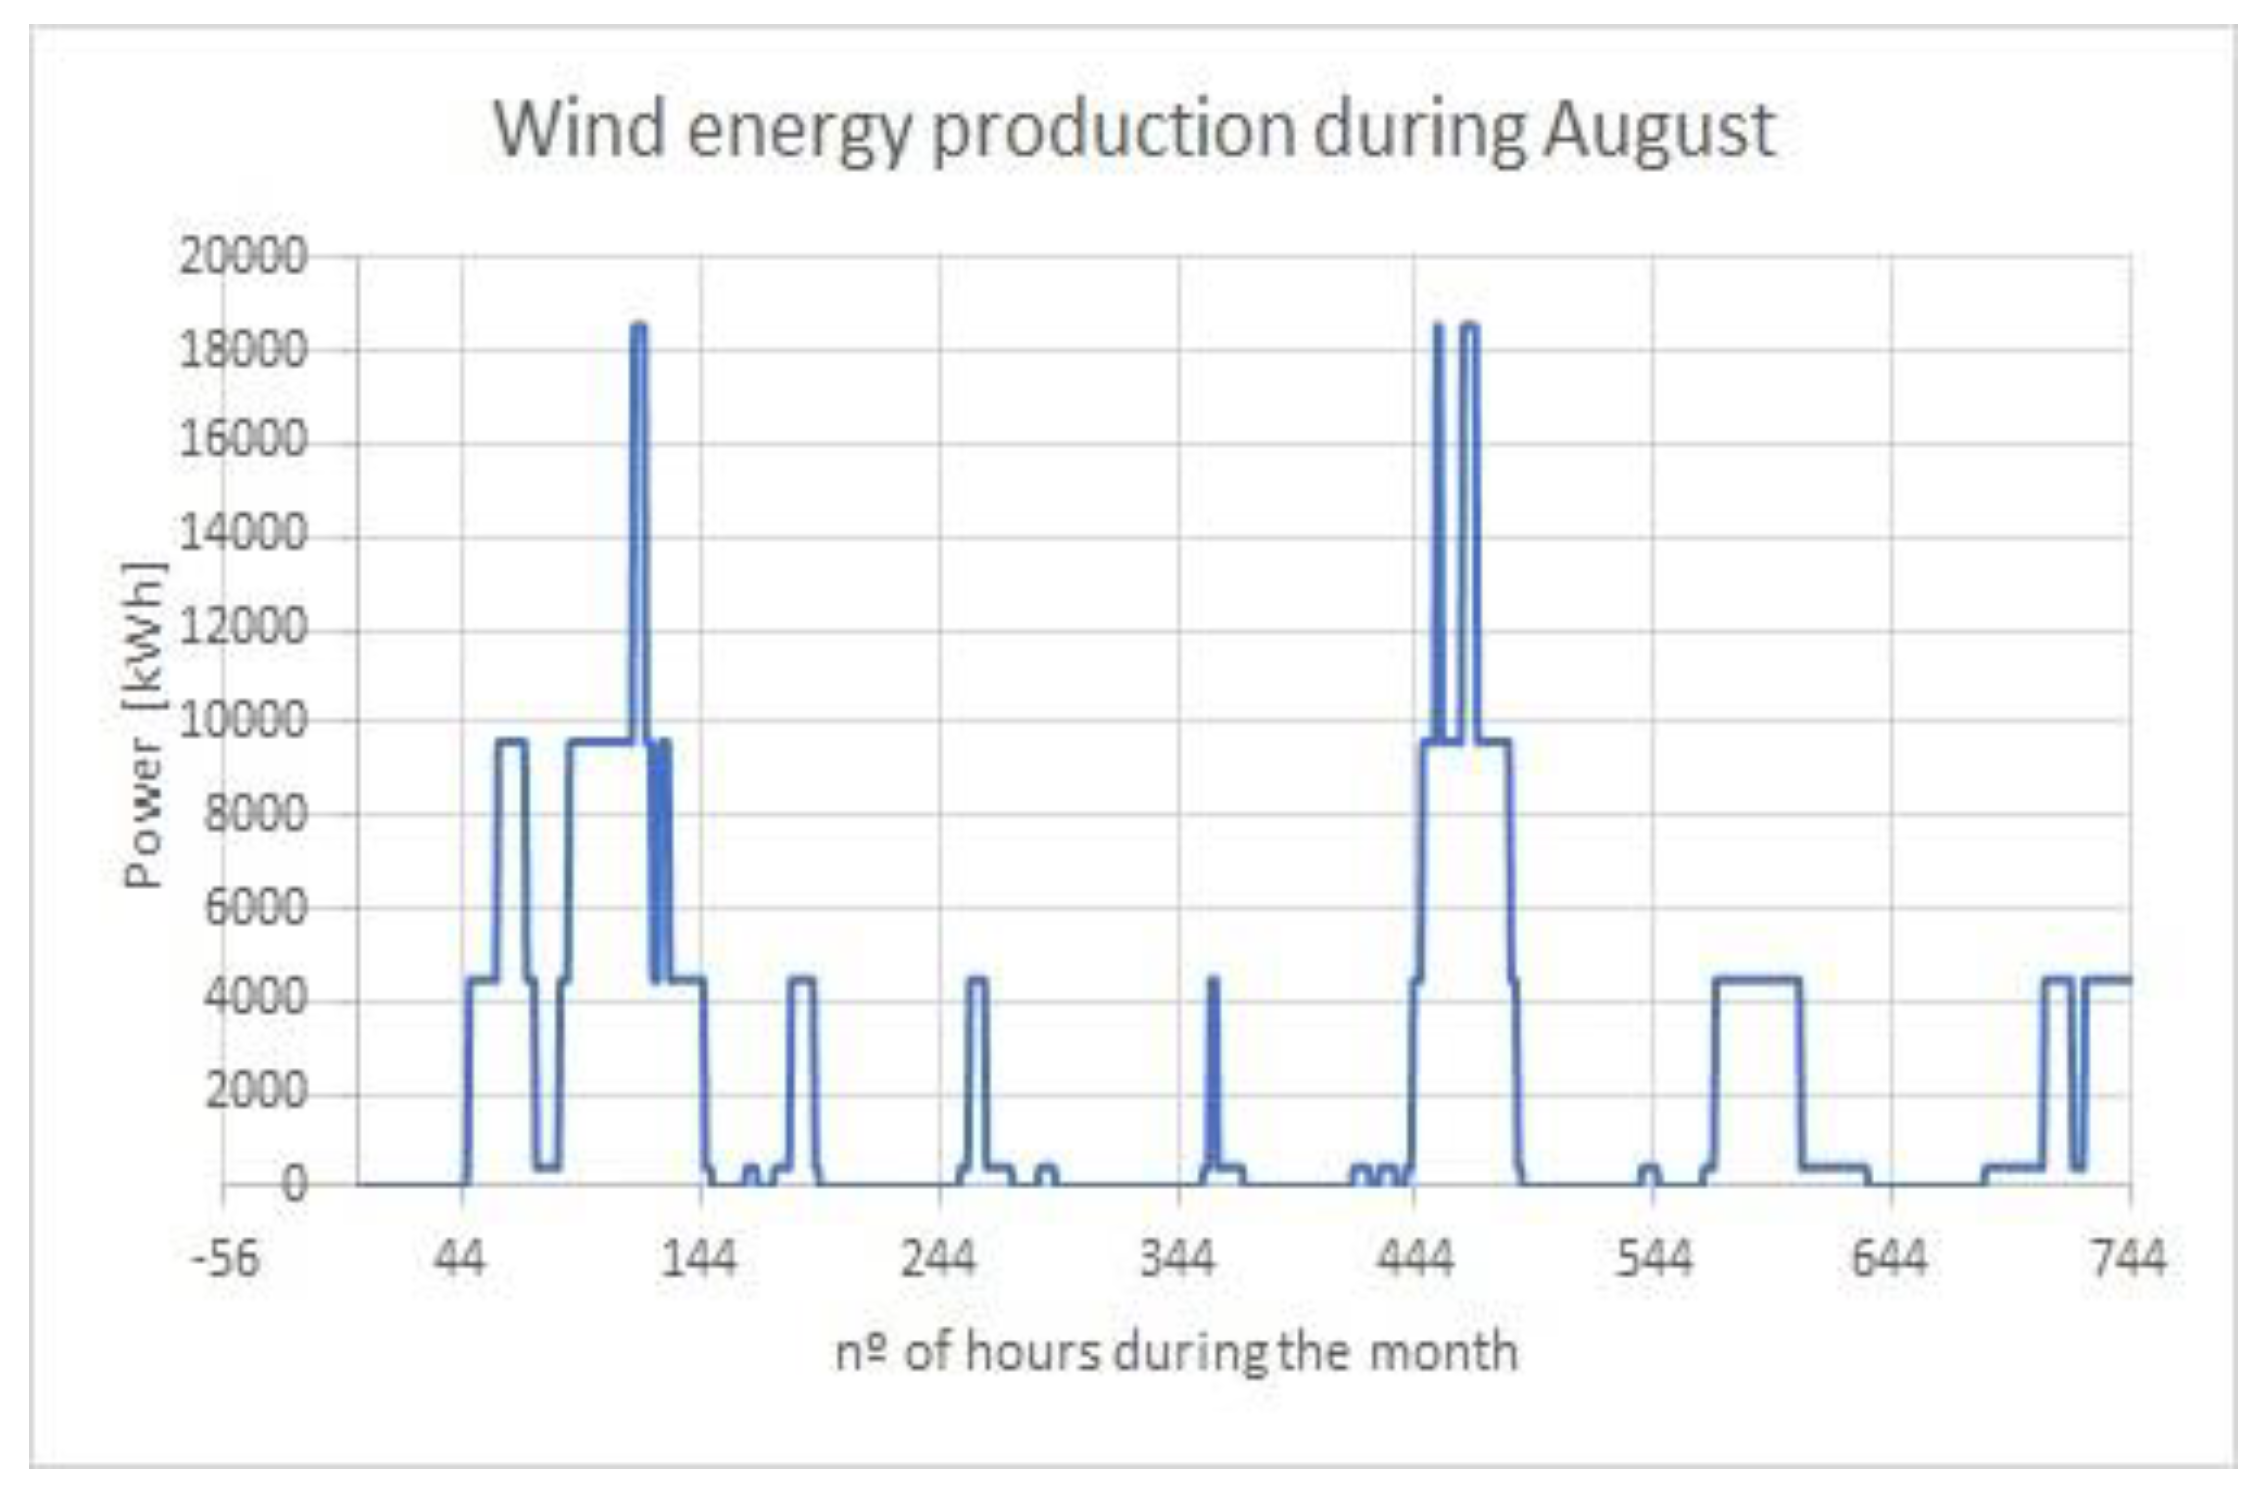
Performing the sizing using the data obtained with the hourly wind speed for one year, we can obtain a total production around 4 GW per wind turbine of 2 MW. The result for the month of January was 353 MW per wind turbine, as presented in Figure 8. Therefore, for 45 wind turbines, the total production in January was approximately 15,884 MW. For August, the curve of hourly wind production is represented in Figure 9. For this sizing, the total production for the month was 1619 MW.
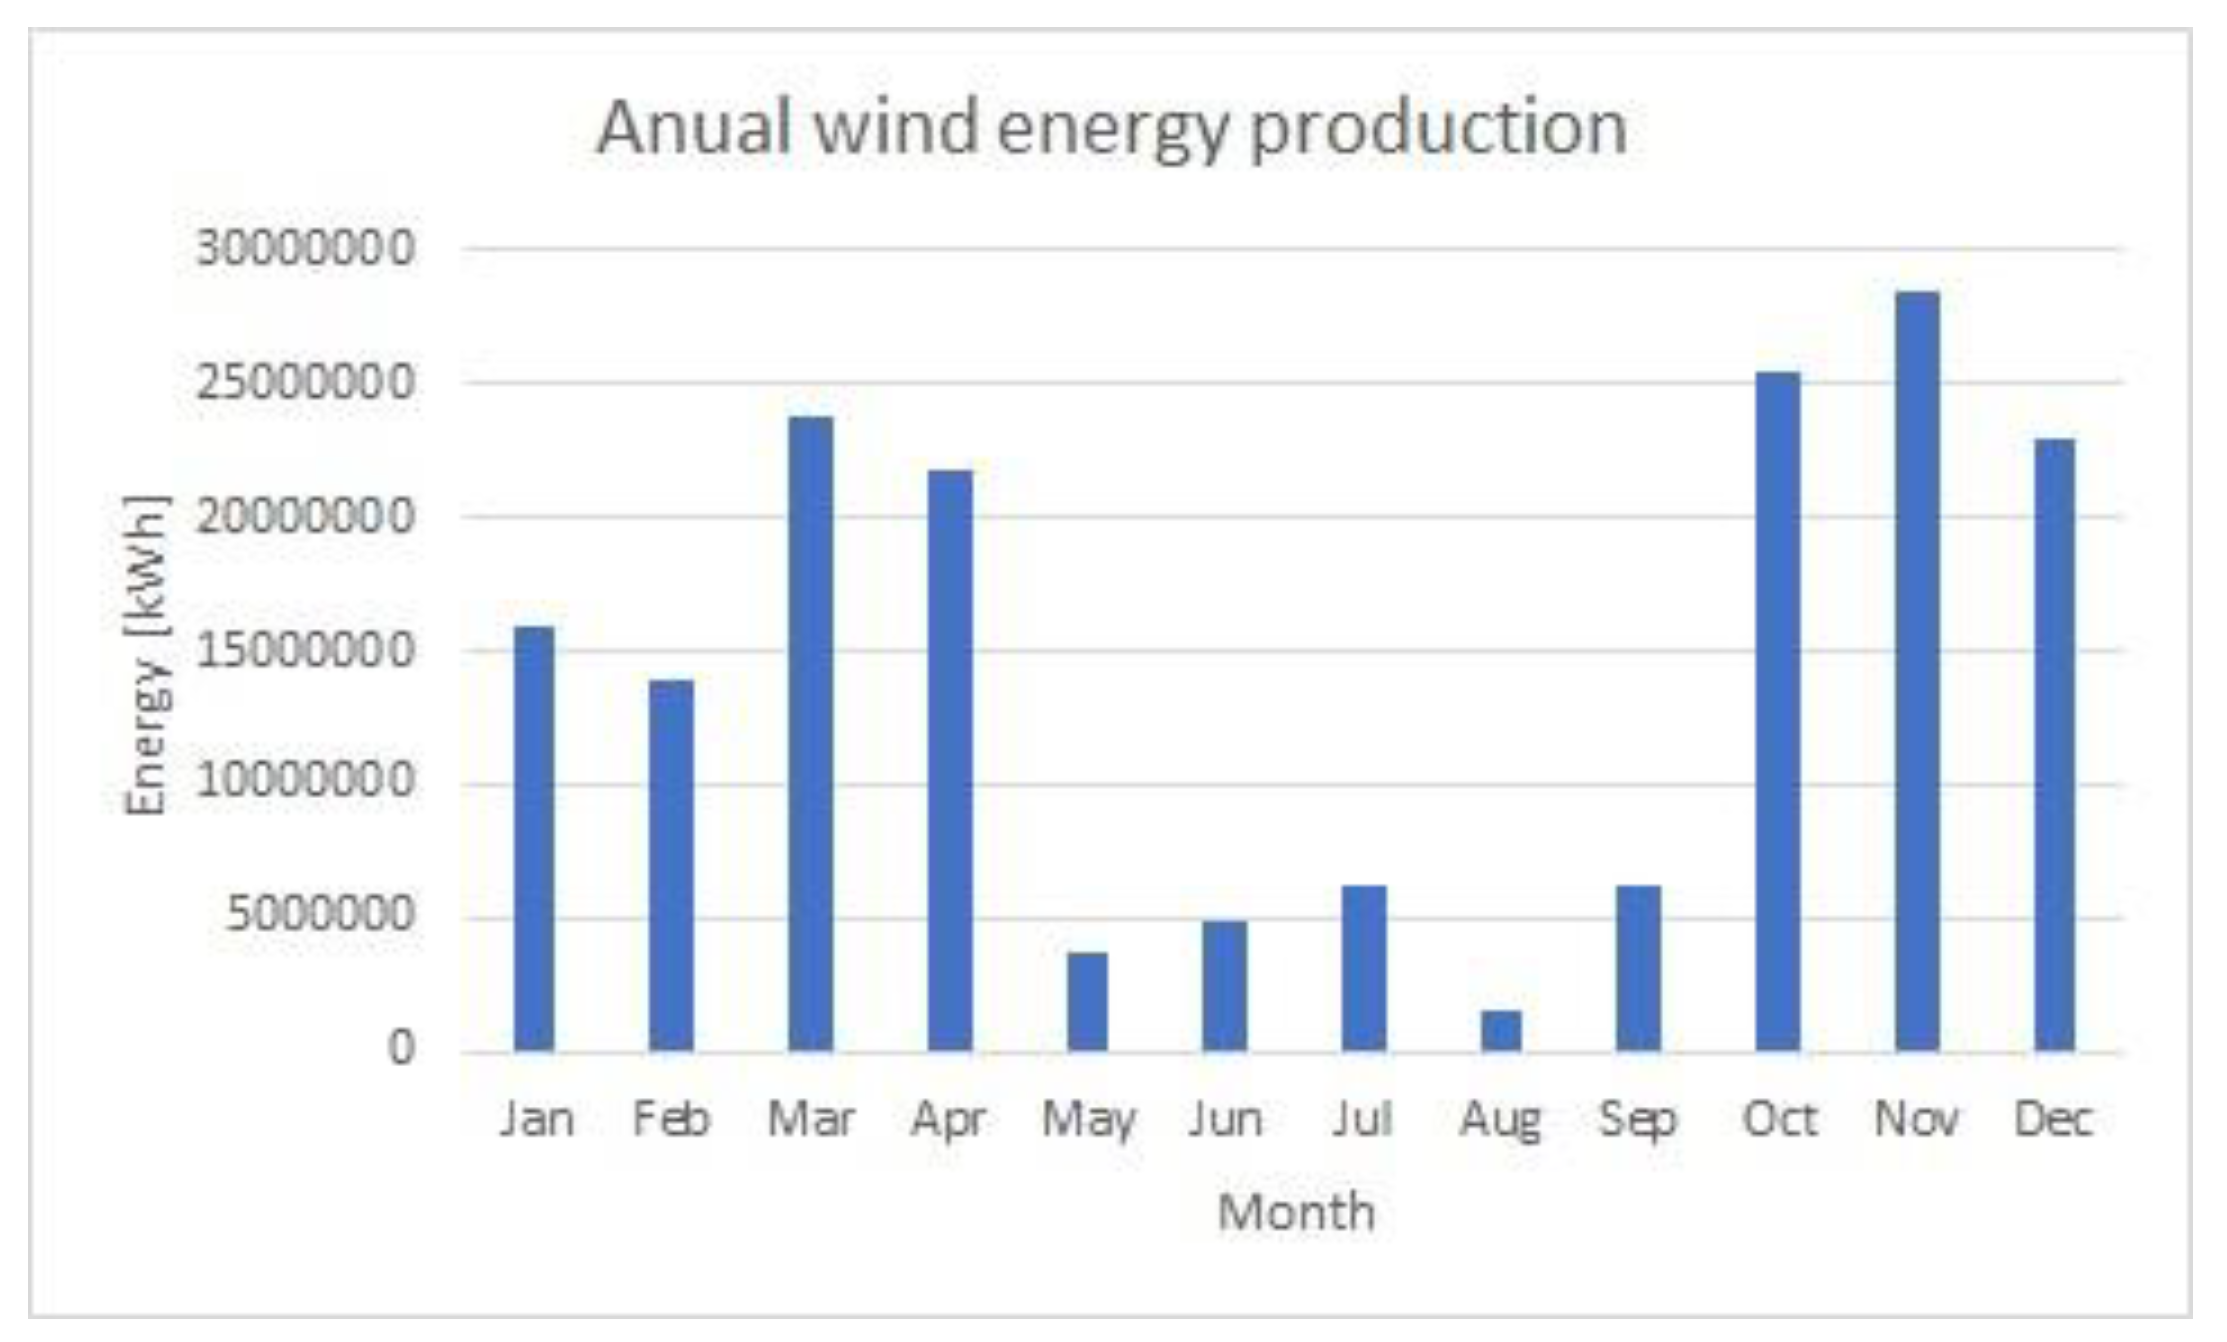
The estimation of the total production is represented in Figure 10; the total annual production estimation was approximately 175 GWh. The cost per unit of installed power oscillates between values close to 1 million euros per MW, with this price also including installation. The total cost to install 45 wind turbines is approximately 90 million euros.
4.3. Total Results
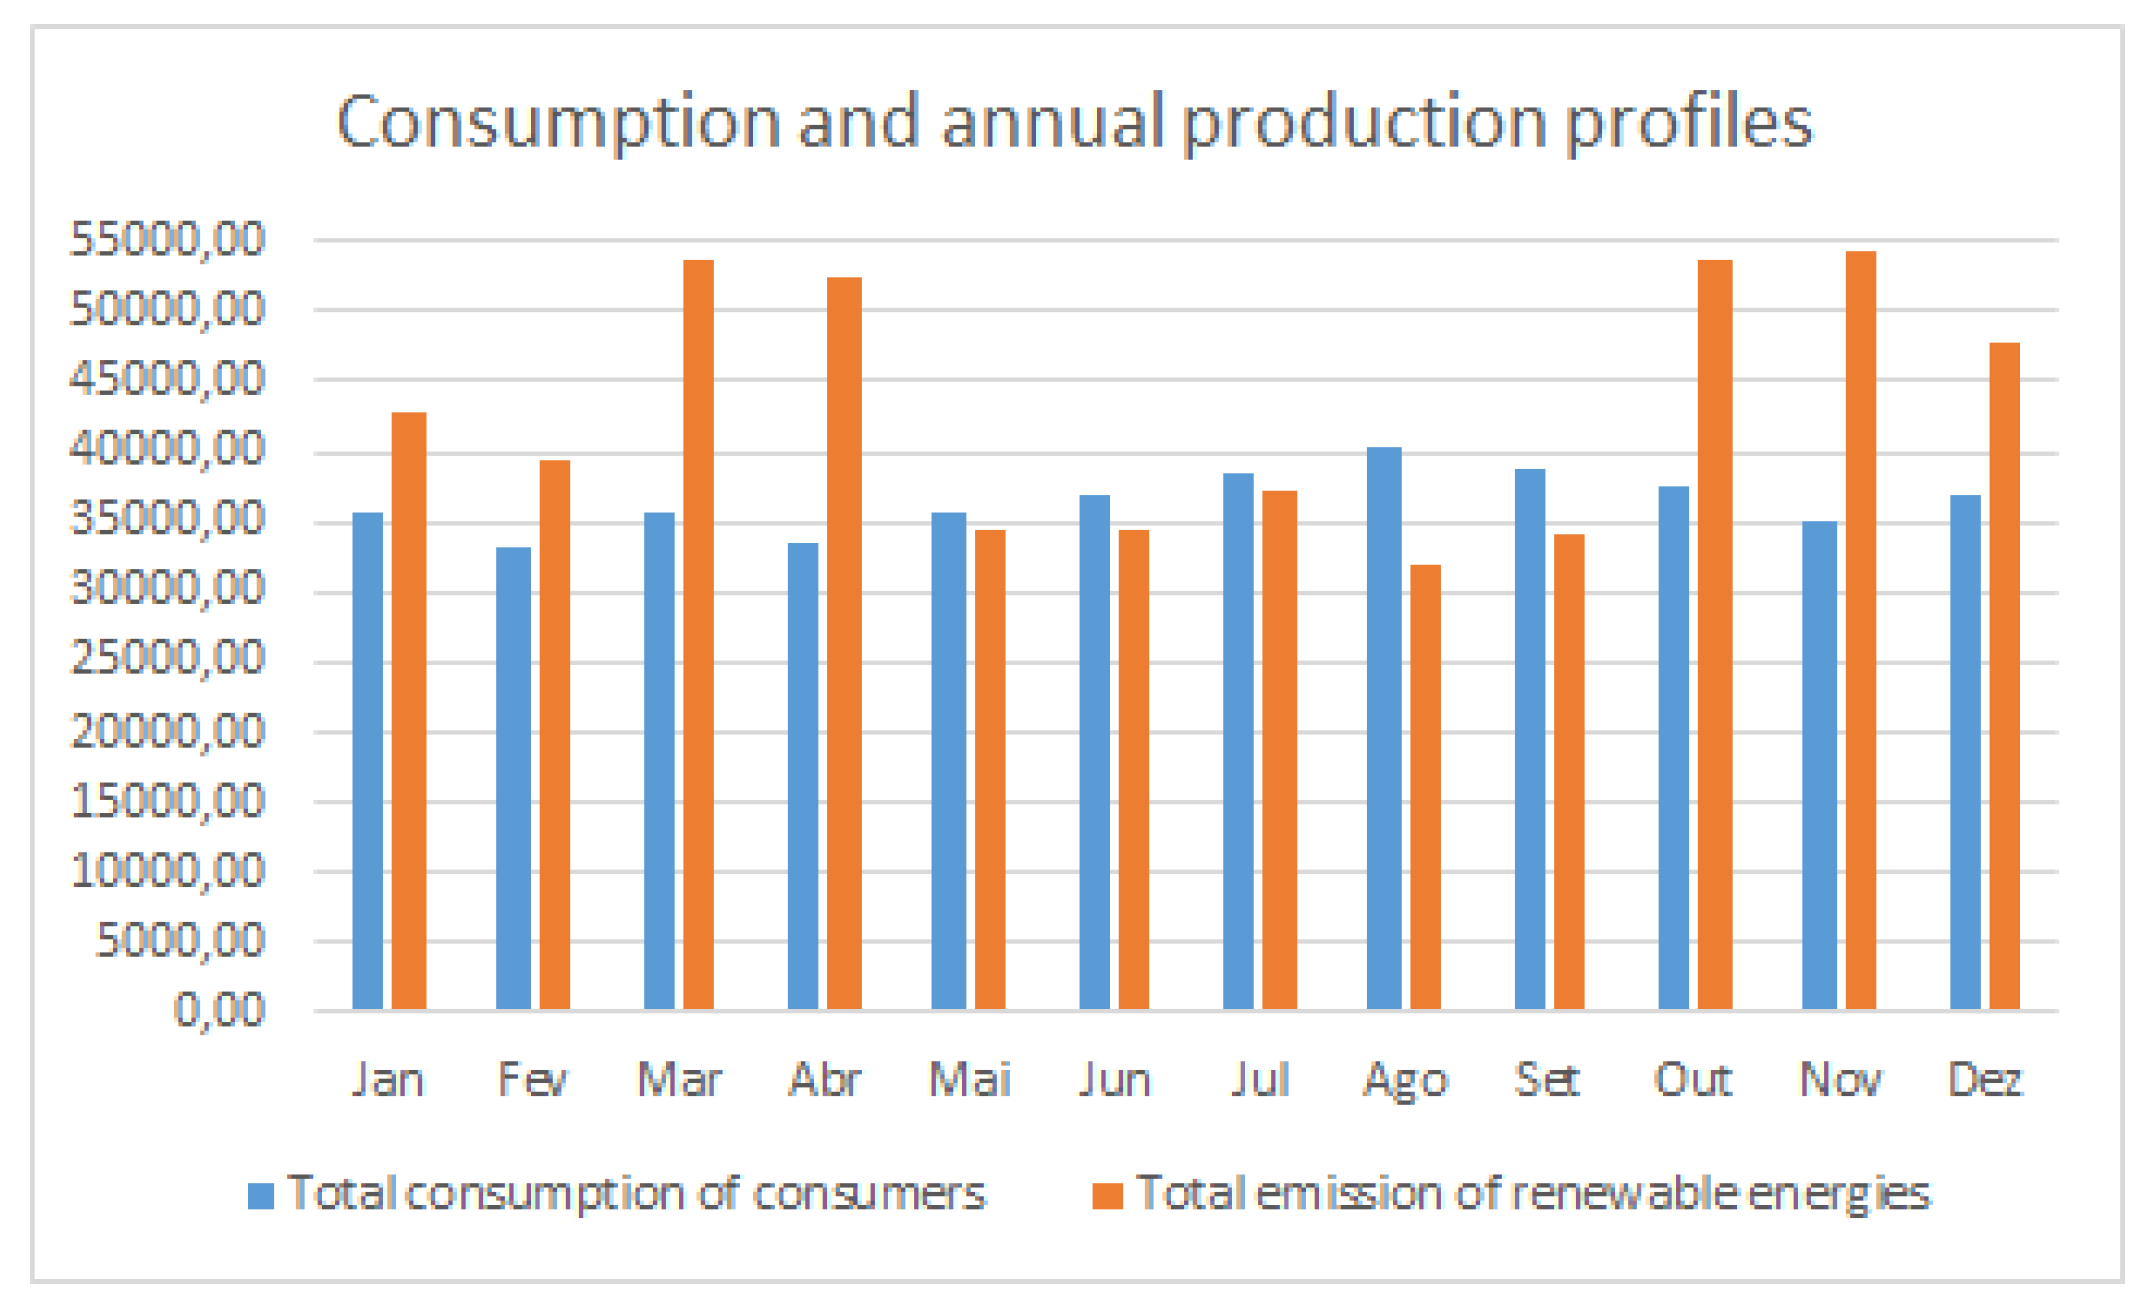
To conclude, it is necessary to visualize all the consumption data for the island during 2018. Furthermore, it is important to note the total energy produced by renewable energy sources that were previously sized (wind and photovoltaic), and what was produced during 2018 by the renewable energy sources already installed.
From the graph in Figure 11, we can conclude that, during the months of May, June, July, August and September, the renewable sources were not able to produce all the energy required by consumers. So, in these months it would be necessary to use fossil fuel sources. In the other months, the production by renewable sources was higher than what consumers needed, so it would be necessary to store this energy in batteries, to be implemented through further study in this case.
4.4. Reactive Energy
Reactive energy is an integral part of companies’ electricity bills and constitutes a significant financial weight. The reactive energy consumption may, however, be deleted from the bill, through the installation of a power factor correction system. Power factor correction overrides the reactive power consumption of the grid by generating energy by capacitor batteries installed in infrastructures. The reduction of reactive energy promotes the proper energy functioning of facilities, maximizing the installed power harvest. Investment in such a system can be recovered within a few months by saving on reactive energy. In future work, the possibility of including capacitor batteries to reduce the reactive power will be investigated.
5. Conclusion
After performing sizing based on data obtained during a summer month, we conclude that it is possible to produce more 14,818 MWh, divided between 13,200 MWh produced by PV panels and 1619 MWh produced by eolic turbines. With the calculations made approximately 8100 MWh is still produced by fossil fuel although these approximations depend on the available wind, irradiation and on the consumption that the island need. In a winter month, the total production was 36,816 MWh, so with this sizing plus the renewable sources already implemented, the total energy produced would be approximately 41,562 MWh. In the winter months, according to the design, there is more energy produced than is necessary.
To conclude, it is important to implement a battery system with a capacity of at least 70 MWh that can support the tip of the island. This system will satisfy potential production voids in renewable energy sources and ensure that the island can be close to 100% renewable. Later, a detailed study of the implementation of batteries will be added to this project.
The total costs of implementation reach approximately 1025 million euros for wind turbines and photovoltaic panels. There are other costs that must be broken down after further study, such as the costs of maintenance that are not included in the total costs and implementation costs. The maintenance has to be periodic, once a year, and will have a residual cost. It is also necessary to do a more detailed study of the materials that are required, such as three-phase inverters to connect six panels in series, hybrid inverters to connect to the batteries, lithium batteries and transformers.
Author Contributions
I.B.M performed all the results, and wrote the manuscript. J.P.N.T. analyzed the results and revised the manuscript. All authors read and approved the final manuscript.
Funding
This research received no external funding.
Acknowledgments
The authors acknowledge support of the Instituto de Telecomunicações through the project UID/EEA/50008/2019.
Conflicts of Interest
The authors declare no conflict of interest.
References
- Stenzel, P.; Schreiber, A.; Josefine, M.; Wulf, C.; Schreieder, M.; Stephan, L. Renewable energies for Graciosa Island, Azores—Life Cycle Assessment of electricity generation. Energy Procedia 2017, 135, 62–74. [Google Scholar] [CrossRef]
- Guzhov, S.; Krolin, A. Use of big data technologies for the implementation of energy-saving measures and renewable energy sources in buildings. Proceedings of the 2018 Renewable Energies, Power Systems & Green Inclusive Economy (REPS-GIE), Casablanca, Morocco, 23–24 April 2018, Institute of Electrical and Electronics Engineers (IEEE): Piscataway, NJ, USA, 2018. [Google Scholar]
- Portal do Governo dos Açores. Available online: http://www.azores.gov.pt (accessed on 15 July 2019).
- Kaldellis, J.K.; Zafirakis, D.; Kaldelli, E.L.; Kavadias, K. Cost benefit analysis of a photovoltaic-energy storage electrification solution for remote islands. Renew. Energy 2009, 34, 1299–1311. [Google Scholar] [CrossRef]
- EDA (2016)—CARE. CARACTERIZAÇÃO DAS REDES DE TRANSPORTE E DISTRIBUIÇÃO DE ENERGIA ELÉTRICA EM 2016. Available online: https://www.eda.pt/Regulacao/Lists/CaracterizacaodeRedes1/Attachments/27/CARE%202016.pdf (accessed on 31 August 2019).
- EDA (2019)—POEE. Procura e Oferta de Energia Elétrica, janeiro 2019. Available online: https://www.eda.pt/Mediateca/Publicacoes/Producao/Paginas/Produ%C3%A7%C3%A3o-de-Energia-El%C3%A9trica.aspx (accessed on 31 August 2019).
- EDA (2018)—POEE. Procura e Oferta de Energia Elétrica agosto 2018. Available online: https://www.eda.pt/Mediateca/Publicacoes/Producao/Paginas/Produ%C3%A7%C3%A3o-de-Energia-El%C3%A9trica.aspx (accessed on 31 August 2019).
- EDA (2006)—POEE Procura e Oferta de Energia Elétrica janeiro 2006. Available online: https://www.eda.pt/Mediateca/Publicacoes/Producao/Paginas/Produ%C3%A7%C3%A3o-de-Energia-El%C3%A9trica.aspx (accessed on 31 August 2019).
- EDA (2006)—POEE Procura e Oferta de Energia Elétrica agosto 2006. Available online: https://www.eda.pt/Mediateca/Publicacoes/Producao/Paginas/Produ%C3%A7%C3%A3o-de-Energia-El%C3%A9trica.aspx (accessed on 31 August 2019).
- EDA (2013)—POEE Procura e Oferta de Energia Elétrica agosto 2013. Available online: https://www.eda.pt/Mediateca/Publicacoes/Producao/Paginas/Produ%C3%A7%C3%A3o-de-Energia-El%C3%A9trica.aspx (accessed on 31 August 2019).
- EDA (2013)—POEE Procura e Oferta de Energia Elétrica janeiro 2013. Available online: https://www.eda.pt/Mediateca/Publicacoes/Producao/Paginas/Produ%C3%A7%C3%A3o-de-Energia-El%C3%A9trica.aspx (accessed on 31 August 2019).
- EDA (2018)—POEE Procura e Oferta de Energia Elétrica dezembro 2018. Available online: https://www.eda.pt/Mediateca/Publicacoes/Producao/Paginas/Produ%C3%A7%C3%A3o-de-Energia-El%C3%A9trica.aspx (accessed on 31 August 2019).
- European Commission. Photovoltaic Geographical Information System (PVGIS). Available online: https://re.jrc.ec.europa.eu/ (accessed on 15 July 2019).
- Meteoblue, Climate archive Sao Miguel Island. Available online: www.meteoblue.com (accessed on 15 July 2019).
Figure 1.
Evolution of total energy production and quantity of renewable energies on São Miguel.

Figure 2.
Evolution of population on São Miguel Island.

Figure 3.
Monthly average temperature on São Miguel Island.

Figure 4.
Monthly average irradiance on São Miguel Island.

Figure 5.
Monthly average production during one year on São Miguel Island.

Figure 6.
Direction and intensity of the wind on São Miguel Island.

Figure 7.
Histogram of wind speed over a year on São Miguel.

Figure 8.
Production of wind energy during the month of January.

Figure 9.
Production of wind energy during the month of August.

Figure 10.
Production of wind energy during 2018.

Figure 11.
Total production of renewable energy and production profiles during 2018.


Table 1.
Capacity of power plants on São Miguel Island.
| Energy Source | Power Plant | Capacity (MW) |
|---|---|---|
| Fuel Oil | Caldeirão | 98 |
| Geothermal | Pico Vermelho | 13 |
| Ribeira Grande | 16.6 | |
| Eolic | Graminhais | 9 |
| Hydro | Several Plants | 5.1 |
Table 2.
Data of the sizing of a photovoltaic (PV) system proposed.
| Number of panels | 100,000 | |
| PV installed (Pmax) | 25,000 kWp | |
| System loss | 10% | |
| Slope angle | 30(opt) | |
| Azimuth angle | 3(opt) | |
| Yearly PV energy production | 34,200,000 kWh | |
| Yearly in-plane irradiation | 1580 kWh/m2 | |
| Losses due to | Angle of incidence | −3% |
| Temperature and low irradiance | −0.4% | |
| Total losses | −13.1% | |
© 2019 by the authors. Licensee MDPI, Basel, Switzerland. This article is an open access article distributed under the terms and conditions of the Creative Commons Attribution (CC BY) license (http://creativecommons.org/licenses/by/4.0/).
Share and Cite
MDPI and ACS Style
Melo, I.B.; Torres, J.P.N. Economic Sustainability Study of São Miguel Island in the Azores Using Photovoltaic Panels and Wind Turbines. Sustainability 2019, 11, 4782. https://0-doi-org.brum.beds.ac.uk/10.3390/su11174782
AMA Style
Melo IB, Torres JPN. Economic Sustainability Study of São Miguel Island in the Azores Using Photovoltaic Panels and Wind Turbines. Sustainability. 2019; 11(17):4782. https://0-doi-org.brum.beds.ac.uk/10.3390/su11174782
Chicago/Turabian StyleMelo, Inês Boga, and João Paulo N. Torres. 2019. "Economic Sustainability Study of São Miguel Island in the Azores Using Photovoltaic Panels and Wind Turbines" Sustainability 11, no. 17: 4782. https://0-doi-org.brum.beds.ac.uk/10.3390/su11174782
Note that from the first issue of 2016, this journal uses article numbers instead of page numbers. See further details here.