Article

Does Participation in Agricultural Cooperatives Affect Farm Sustainability? Empirical Evidence from Taiwan

1
School of Economics and Management, Fuzhou University of International Studies and Trade, Fuzhou 350202, China
2
Department of Leisure and Recreation Management, Taipei City University of Science and Technology, Taipei 112, Taiwan
3
Department of Agricultural Economics, National Taiwan University, Taipei 10617, Taiwan
4
Department of Urban Industrial Management and Marketing, University of Taipei City, Taipei 11153, Taiwan
*
Author to whom correspondence should be addressed.
Sustainability 2019, 11(18), 4987; https://0-doi-org.brum.beds.ac.uk/10.3390/su11184987
Submission received: 21 July 2019 / Revised: 19 August 2019 / Accepted: 8 September 2019 / Published: 12 September 2019
(This article belongs to the Section Sustainable Agriculture)

Abstract

:
Recent research has highlighted the importance of agricultural cooperatives on farm production. Although the consensus from the literature suggests that participating in these organizations significantly affects farm production, there is inconclusive evidence on whether this effect is positive or negative. Moreover, previous studies solely focus on the magnitude of this effect and fail to explain the mechanism behind it. This study contributes to this knowledge gap by estimating the impact of agricultural cooperatives on farm profits. To do this, we apply the causal mediation analysis to explain the potential mechanism behind this relationship. Using a nationally representative survey of farm households from Taiwan in 2013, we find that participating in cooperatives increases farm profits. Furthermore, this effect is more pronounced for producers with higher profits. Concerning the mechanism, we find that the use of food labels accounts for approximately 15 to 28% of the total effect of cooperative participation on farm profits.

1. Introduction

Agricultural cooperatives are essential organizations for farm households in both developed and developing markets and have been perceived by policymakers as important institutions that increase economic welfare. In 2017, the U.S. Department of Agriculture reported that 1871 cooperatives with nearly 2 million members were responsible for $197 billion in sales [1]. Similarly, rural villages in Africa reported having at least one local agricultural cooperative [2]. One principal reason for the widespread ubiquity of these institutions is attributable to their impacts on farm profits. Agricultural cooperatives are structured to assist farmers in marketing their products and disseminating invaluable knowledge, services, and technologies [3]. Moreover, organized farm producers can access greater bargaining power and enjoy economies of scale in logistics and marketing by collectively pooling their resources [4]. Thus, cooperatives play an integral role in the long-run sustainability of the agri-food value chain by potentially increasing the financial viability and solvency of farms.
One of the primary channels through which cooperative membership can increase farm profits involves minimizing information asymmetries [4]. In many countries, a critical function of cooperatives includes facilitating the adoption of food safety certifications and labels amongst farmers. Snider et al. [5] found that cooperatives encourage the adoption of voluntary certifications in the Costa Rican coffee industry through non-financial incentives, such as the teaching of farm management practices. Jin and Zhou [6] observe that vegetable cooperatives (based on size, perception of standard, reputation, and expected cost) are more likely to adopt food safety and quality standards in China. Generally, cooperatives function as mediators between certification parties and producers [5]. This business dynamic allows farmers to comply with these otherwise inaccessible standards due to human capital, financial, and labor market constraints.
Prior empirical studies have extensively analyzed the effects of agricultural cooperatives on farm performance. Ito et al. [7] evaluate the distributional impacts of cooperatives and finds that membership increases the incomes of watermelon farmers in rural China. These findings are consistent with more recent studies such as Hoken and Su [8], where rice cooperatives positively impacted net incomes. Ma and Abdulai [9] estimate the endogenous switching regression model to account for endogeneity and conclude that cooperatives enhanced the yields, net returns, and household income of apple farmers, also in China. Other scholarly articles generally reported beneficial impacts of cooperative membership on socioeconomic indicators such as income and poverty in Kenya, Rwanda, and Ethiopia [10,11,12].
Conversely, agricultural cooperatives are associated with inequitable or suboptimal outcomes due to the heterogeneous effects of these institutions. In many markets, smallholders can disproportionately gain from cooperative membership, as these organizations allow them to overcome production and marketing barriers that are not present for larger farms [7,8,9]. However, Shumeta and D’Haese [13] find that while the average coffee farmer in Ethiopia did not benefit from cooperative membership across incomes, yields, or prices, larger farms did observe increased levels of farm performance, consistent with Verhofstadt and Maertens [11]. Similarly, Xu et al. [14] find that cooperatives can negatively impact certain aspects of the social capital that vegetable farmers possess in China, subsequently impacting their economic performance.
Given that these conflicting results have implications on the capability of cooperatives to enhance farm performance, the objective of our study is to answer the following two questions. (1) What is the impact of agricultural cooperatives on farm profit? (2) What is the mechanism behind these evident effects? To answer these questions, we conduct our empirical analysis in two parts. The first part begins by examining the determinants of cooperative membership using the binary logit model and estimating the average and distributional effects with the treatment effect model proposed by Cattaneo [15]. The second part empirically assesses how cooperative membership affects farm profitability using the causal mediation analysis.
Our findings demonstrate that participation in cooperatives increases farm profits and that this effect is more pronounced at higher ends of the profit distribution. To explain the mechanism behind these results, we focus on one of the vital services provided by cooperatives in Taiwan: the adoption of food label certifications. We show that cooperatives increase farm profits by facilitating the use of food labels amongst producers.
We contribute to this extensive literature in several ways. First, the majority of previous studies examining the relationship between cooperatives and farm profits uses data from developing countries [7,8,9,10,11,12,13]. In their review of the literature, Grashuis and Su [4] note that it is unknown whether cooperatives positively impact farm profits in developed markets since market failures are sparse. Our study uses a nationally representative survey of farm households in Taiwan, providing evidence on this relationship in a high-income industrialized country. Most of the prior studies are also constrained by the fact that they use a small-scaled random survey data with only a few hundred observations [7,8,9,10,11,12,13]. Our dataset, with what we believe are some of the largest sample sizes in the literature, is nationally representative and allows us to evaluate the impact of agricultural cooperatives at a larger scale.
Second, we consider the effect of cooperatives on producers in multiple sectors of the agricultural industry, including rice, fruit, vegetable, livestock, and other commodity farmers. Much of the literature studies farmers producing only one specific crop, such as watermelon, banana, and coffee [7,10,12,13]. However, agricultural cooperatives exhibit substantial differences in business and operational structures depending on both the commodity and geography. Thus, the number of conclusions that can be drawn from prior studies is limited due to the considerable variation that exists in cooperatives across products and locations. Our study includes farmers producing a variety of different commodities, allowing us to draw broader conclusions about cooperatives and farm profitability.
Finally, we provide insight into the mechanism behind the evident effect of agricultural cooperatives by applying the causal mediation analysis, which represents an empirical departure from prior relevant studies. While much of the literature has employed the propensity score matching technique, one notorious shortcoming of these specifications is their inability to explain why cooperatives impact farm performance. The causal mediation analysis distinguishes between the direct and indirect effects of agricultural cooperatives, allowing us to identify how these institutions affect farm profitability. To the best of our knowledge, we are the first to apply the mediation analysis to the topic of farm profitability.
The remainder of this paper is organized as follows. The next section provides background on agricultural cooperatives in Taiwan. We then follow with a description of the data used in this study. Next, we present the econometric model and empirical results. Finally, we conclude with a discussion of policy implications and summary.

2. Background of the Agricultural Cooperatives and the Food Label Certification System in Taiwan

Agriculture is an important sector of the Taiwanese economy, with production totaling 6.9 million tons per year on roughly 799,000 hectares of arable land accounting for nearly 2% of GDP [16,17]. The average yearly production of each agricultural commodity and their respective size of cultivation are rice: 1,732,000 tons, 271,000 hectares; coarse grain: 492,000 tons, 70,000 hectares; special crops: 601,000 tons, 32,000 hectares; fruits: 2.7 million tons, 185,000 hectares; vegetables: 2,823,000 tons, 146,000 hectares; floriculture: 2,923,000 tons, 146,000 hectares; and pasture grass: 944,000 tons, 15,000 hectares [16].
Taiwan has an extensive history of depending on cooperatives to mitigate agricultural problems. Since their establishment in 1900, agricultural cooperatives (also known as farmers’ associations) have served as multi-purpose groups that assist producers with their farming, financial, and marketing concerns [18]. Specifically, the primary functions that these institutions supply include marketing, agricultural extension, credit, insurance, and information services [19].
Farmers’ associations in Taiwan are segregated into three distinct levels: provincial (2), city (21), and township (280) organizations [19]. Recent government official data from the National Farmers’ Association shows that farmers’ associations have 903,061 associated members and 2191 groups producing an assortment of commodities such as rice, fruits, vegetables, and livestock [20]. Cooperatives at the township level are composed of smaller units known as agricultural affair teams, with one for each village [19]. The National Farmers’ Association legally recognizes agricultural affair teams, and they serve as a bridge between the establishment and its members. They also disseminate information and serve as mediating parties during elections. City associations provide supervision and technical assistance to townships while provincial associations audit, train, and coordinate all lower units [19].
An essential function of farmers’ associations is their assistance in facilitating the adoption of food labels. This support is especially important in Taiwan, where many farmers would be unable to attain these certifications as they are older, less educated, and engage in off-farm labor. In 2004, the Council of Agriculture (COA) launched the Taiwan Good Agricultural Practices (TGAP) produce labeling system to improve the safety and quality of fruits, vegetables, and other commodities [21,22]. The TGAP functions as both an inspection and certification program that establishes sanitary management practices and transparent financial and sourcing records [21]. Generally speaking, TGAP involves both food traceability and eco-labeling systems [21]. All certified TGAP products carry certification insignia for quick identification and are guaranteed to be safe and of high-quality by the COA.
The TGAP system is the most significant food traceability program in Taiwan. Accordingly, the Council of Agriculture (COA) developed the TGAP system to follow international standards such as the Global Food Safety Initiatives (GFSI), and has encouraged participation amongst producers [23]. Recent official statistics show that the number of certified TGAP entities (either individuals or groups) has increased from 1100 in 2008 to 10,069 in 2019. Amongst these entities, they are categorized as agricultural (8834), aquaculture (719), livestock (258), poultry (124), and processed products (134) producers [23]. Opting in to the TGAP system involves additional costs and commitments from producers. Each applicant is required to pay an application fee, which varies with the type of agricultural commodity being produced [21]. Furthermore, complying with the regulations of the TGAP generates internal tolls on producers. For example, farmers are required to document production information such as seed varieties, harvesting, processing, transportation, and storage methods that are unlikely to have otherwise been recorded [21].
However, producers have many incentives to partake in the TGAP system. The COA has undertaken several initiatives to promote these labeled products, including adopting double packaging standards to supply produce auction markets in major cities and unique displays in supermarkets for product distinguishability [22]. As of December 2010, the total annual trading volume of TGAP goods was 17,660 metric tons, with a roughly 20% higher trading price compared to non-certified produce [22]. These price differentials suggest that producers can benefit from the retail premiums generated through the TGAP system.

3. Data

The dataset used in this study was drawn from the 2013 Main Farm Households Survey (MFHS) in Taiwan [24]. This survey selects farm households whose annual gross income from agriculture is more than NTD $200,000, meaning that this dataset consists of full-time farmers [24]. In this survey, 10,000 farms were chosen using a sampling weight method to ensure that the selected farms are representative of the overall farm population in Taiwan. Each selected farm was then interviewed face-to-face by officers of the local farm station. In general, the information contained in the dataset includes farm household and farm production characteristics. After deleting observations with missing values, the sample used in our empirical analysis consists of 9946 family farms. To begin, we define a continuous variable for farm profitability as the revenue from selling farm products minus the cost of farm inputs. We also create a binary variable to indicate whether a farm used food labels on their products. Similar to the empirical specifications of prior studies, we generate several categories of explanatory variables based on the literature studying cooperatives and farm performance [8,14]. These variables include age, gender, and educational attainment of the farm operator. Another continuous variable accounting for farming experience is also specified. With respect to family structures, a continuous variable was defined to account for the total number of family members in each household. The size of farmland is also captured with another continuous variable. Farms are also categorized into different sectors depending on the product that they produce, such as rice, vegetables, fruit, livestock, and other crops. Finally, we control for regional heterogeneity by using four geographic dummy variables.
Detailed definitions and sample statistics of all explanatory variables are presented in Table 1. As shown in Table 1, 3853 (39%) farm operators are members of agricultural cooperatives. This number reflects the significance of farmers’ associations in Taiwan, as many farmers are smallholders who rely on these unions for vital agricultural and financial services. Summary statistics also suggest that farms participating in cooperatives are more profitable and more likely to use food labels. On average, farmers who engage with these associations observe farm profits of NTD $0.911 million and 32.2% of them use food labels. Non-participants have farm profits of NTD $0.536 million, and only 2.9% of them use food labels. Similarly, farmers that are members of cooperatives have larger farms. The average farm size of participants is 1.95 hectares, compared to their counterparts who cultivate 1.53 hectares of farmland. Participants also have a higher ratio of household members working on the farm and tend to produce fruit.

4. Econometric Model

4.1. The Treatment Effect Model

The first part of our empirical analysis estimates the effect of participating in agricultural cooperatives on farm profit. We apply the treatment effect model proposed by Cattaneo [15]. The estimation of the model proceeds in the following two steps. First, we calculate the probability of participating in cooperatives using the binary logit model. If we define a discrete choice variable (j) whose value is 1 for farms participating in cooperatives (=0 otherwise), then the probability of cooperative participation is specified as:
p = exp ( X β j ) j = 0 1 exp ( X β j ) ,   j = 0 , 1
where p is the probability of the farm participating in cooperatives, X is a vector of explanatory variables associated with farm profit, and β j are the estimated parameters. Consistent estimates are obtained using the full-information maximum likelihood estimation method (MLE). With consistent estimates of the model, we can then calculate the predicted probability of cooperative participation.
The second step estimates the farm profit equation. Assuming Yj is farm profits, Dj is an indicator denoting whether a farm participates in cooperatives, and X is a vector of covariates, then the farm profit equation can be specified as:
Y = α + β 1 X + γ × D j + ε
where α ,   β 1 ,   γ are the estimated parameters, and ε is the random error term. In Equation (2), the inverse probability 1/p is used as the sampling weight. Thus, parameter γ forms the average treatment effect of the farm participating in agricultural cooperatives (see Cattaneo [15] for more technical details of the model).

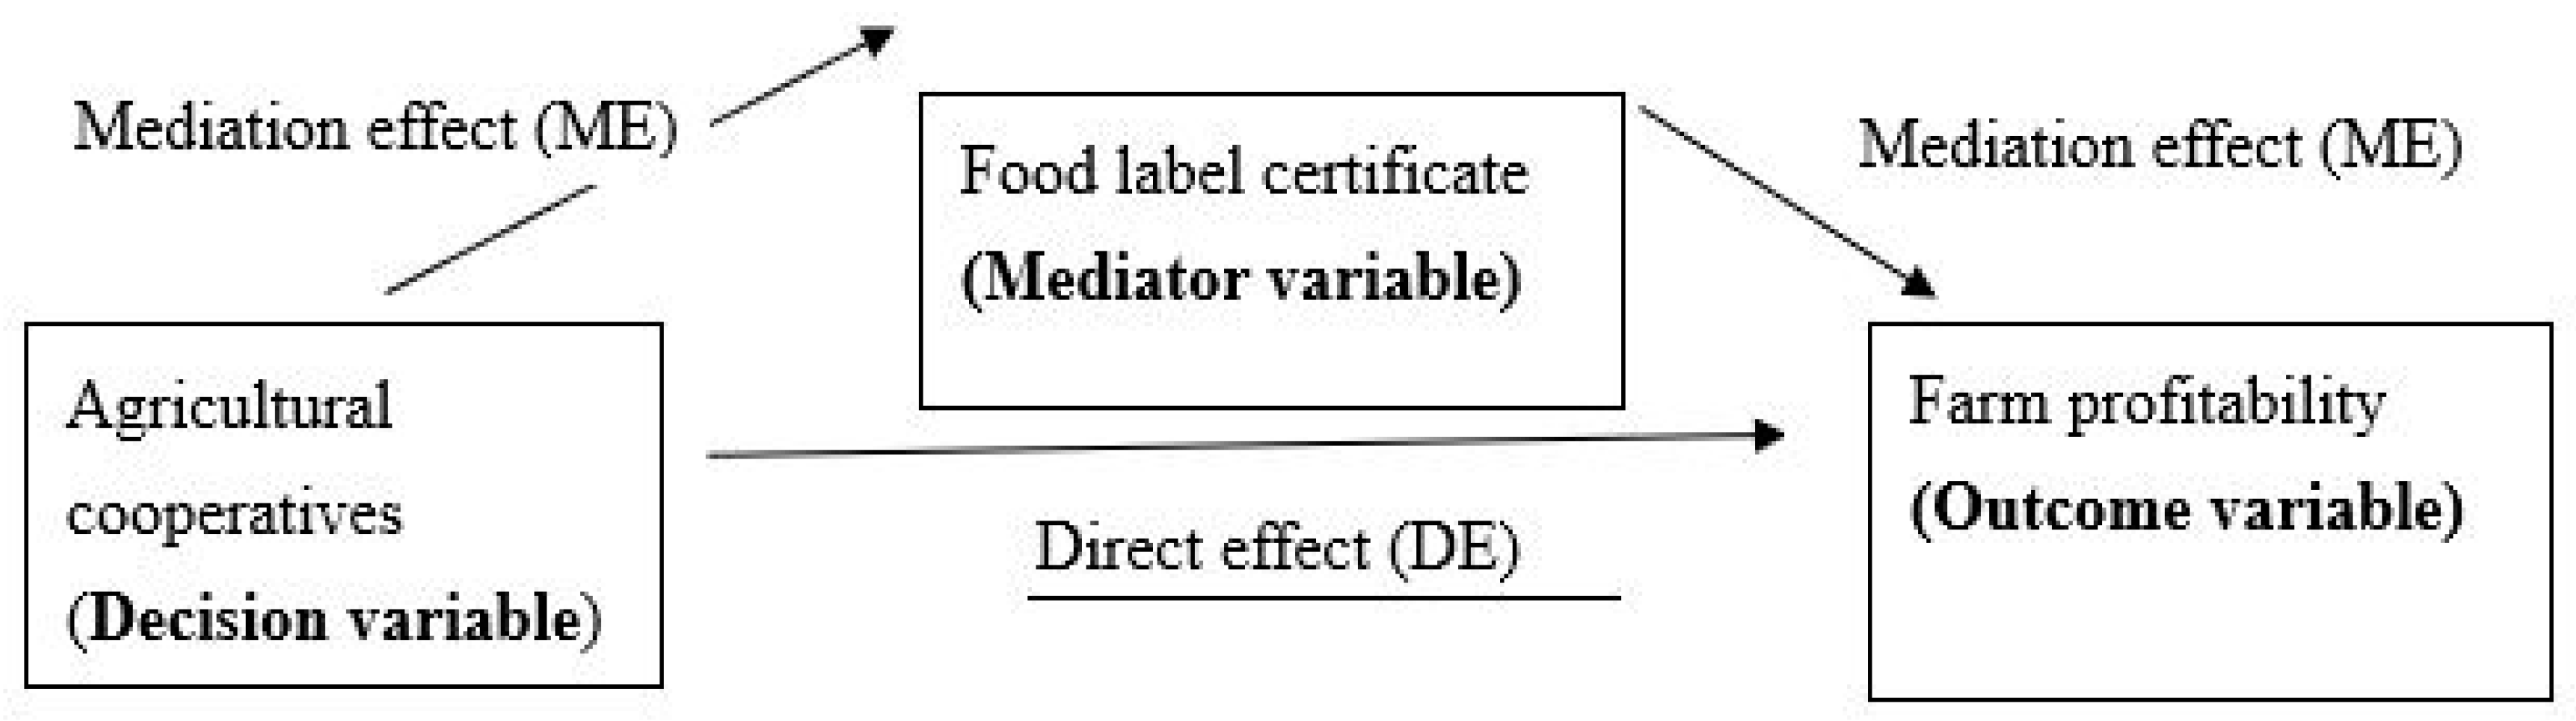
4.2. The Causal Mediation Analysis

Given the evident treatment effects of cooperative participation on farm profits, our next question is to discuss the potential pathway or mediator responsible for this effect. To provide insight into this question, we use the causal mediation analysis proposed by Imai et al. [25]. This empirical strategy identifies the causal process in which a treatment variable affects an outcome of interest through an intermediate variable (or mediator) that lies on the pathway between the treatment and outcome variables. Thus, the causal mediation analysis allows us to decompose the total average effect as the sum of the indirect (mediation) and direct effect. The indirect (mediation) effect represents the hypothesized causal mechanism through which the intermediate variable impacts the outcome, while the direct effect accounts for all other mechanisms [25]. In this study, the treatment variable is the participation in cooperatives, while the outcome is farm profitability. The intermediate variable is the use of food labels on farm products. Figure 1 depicts the structure of the mediation model, identifying the two channels through which cooperative participation can impact farm profits.
We use food label certifications as the mediator variable based on the literature examining the role of agricultural cooperatives in the adoption of voluntary standards, in addition to data considerations. Prior research has shown that cooperatives increase the probability of producers engaging in both specialty markets and certifications. For example, Wollni and Zeller [26] find that Costa Rican coffee cooperatives positively affect the likelihood that a farmer chooses to grow specialty coffee by 24% and received prices by USD $0.09/lb. Similarly, Pinto et al. [27] note that cooperatives and producer associations increase the accessibility of socioenvironmental certifications for small and medium coffee producers in Brazil, compared to individual certifications. Our analysis examines food label certifications because of the empirical evidence demonstrating that cooperatives reduce information asymmetries, as many producers are unable to apply these practices without this support [5]. Thus, using food label certifications as the mediator variable allows us to quantify one of the principal ways through which cooperatives can affect their members.
Next, we formally introduce the causal mediation analysis proposed by Imai et al. [25]. Let M(D) denote the potential value of using food labels for the participating farm with D = 0 or 1. Letting Y denote farm profit, the total treatment effect can be expressed as TE = Δ Y ( 1 , M ( 1 ) ) Δ Y   ( 0 , M ( 0 ) ) . The indirect (mediation) effect is defined as ME = Δ Y ( D ,   M ( 1 ) ) Δ Y ( D , M ( 0 ) ) for D = 0, 1. The indirect effect equation represents the difference in farm profit if there is a change in the use of food labels from the value under the control condition (M(0)) to the value under the treatment condition (M(1)), holding participation in cooperatives as constant. By keeping the treatment as constant and only varying the mediator, we can eliminate all other causal variables and isolate the hypothesized mechanism. If the treatment does not influence the mediator, then M(1) = M(0) and the causal mediation effects will equal zero.
Similarly, the direct effects for farm i can be defined as φ ( D ) Δ Y i ( 1 ,   M ( D ) ) Δ Y i ( 0 ,   M ( D ) ) for D = 0, 1. The direct effect equation represents the difference in outcome if there is a change in treatment status from D = 0 to D = 1, holding the mediator value as constant. In summary, the direct and indirect (mediation) effects sum to the total causal effect of cooperatives. We follow this method proposed by Imai et al. [25] to calculate the total treatment, mediation, and direct effects, respectively. We then report the mediation and direct effects as a percentage of the total treatment effect.

5. Empirical Results

5.1. The Determinants of Cooperative Participation

The results of the binary logit model are reported in Table 2. Along with the estimated coefficients, the marginal effects that measure the change per unit in the explanatory variables on the probability of cooperative participation are also shown. As seen in Table 2, socio-demographic, farm production, and family characteristics are significantly associated with the likelihood of engaging in agricultural cooperatives.
With respect to human capital, the results indicate that a one-year increase in the age of the farm operator decreases the likelihood of participation in cooperatives by 0.5 percentage points, ceteris paribus. This finding differs from Fischer and Qaim [10] and Mojo et al. [12], likely because older farmers in Taiwan are less educated than their younger counterparts. There are also differences in engagement based on gender, as male farm operators are more likely to be members of cooperatives by 7.7 percentage points. While prior studies have not found gender bias in cooperative membership, one explanation is that the preceding literature focuses on crops such as banana and coffee, which are particularly accessible for females [10,12]. The educational attainment of the farm operator is also a significant variable. Results show that farm operators who have finished senior high school are 5.9 percentage points more likely to be members of cooperatives compared to their counterparts with only primary education, consistent with Verhofstadt and Maertens [11], and Mojo et al. [12]. Farmers with greater levels of educational attainment are more likely to be aware of the potential benefits of cooperatives.
Farm production and family characteristics also impact the decision to engage with cooperatives. A one additional hectare increase in the size of farmland increase the propensity of engagement by 1.9 percentage points, ceteris paribus. This finding is in line with the literature, as farmers who are better-off have more resources to dedicate towards becoming a member [7,9,10,13]. As expected, having more household members working on the farm also increases cooperative membership, since these farms have a larger labor force [9,11]. Differences in participation across farm types are also observable. Compared to livestock farms, producers growing rice, vegetables, and other crops are less likely to engage with cooperatives by 18.8, 6.2, and 5.1 percentage points, respectively. The magnitude of the effects are approximately equal to 49, 16, and 13 percent when these values are evaluated at the sample average of the participation rate in agricultural cooperatives (see Table 1). Finally, regional disparities are also found to impact cooperative membership. Farms in the west, east, and southern portions of Taiwan are less likely to participate in cooperatives compared to those in the north by 12.6, 12.5, and 17.5 percentage points, respectively. The magnitude of the effects are approximately equal to 32, 32, and 45 percent when these values are evaluated at the sample average of the participation rate in agricultural cooperatives.

5.2. Results of the Treatment Effect and Mediation Analysis

Based on estimates of the binary logit model, we calculated the probability of each farm engaging with cooperatives. Next, we use the inverse probability as the sampling weight to estimate the farm profit equation. The estimation results of the treatment effect model are summarized in Panel A of Table 3. We calculate both the mean and quantiles of the farm profit distribution. Our results show that members of cooperatives receive higher farm profits of NTD $0.162 million compared to non-participants. However, the treatment effects are heterogeneous as they become more pronounced at the upper ends of the profit distribution. These findings are in accordance with the ones found in Verhofstadt and Maertens [11] and Shumeta and D’Haese [13]. Compared to non-participants, farms that engage with cooperatives have higher profits of NTD $0.059, $0.113, and $0.229 million at the 0.25, 0.5, and 0.75 quantiles of the farm profit distribution, respectively.
One particular reason for these findings is that larger farms are more likely and capable of adopting food label certifications due to their ability to create economies of scale. These production advantages are especially important for cooperative membership, as many of these organizations establish entry barriers such as minimum land and labor force requirements [7,8,28]. Additionally, larger farms usually receive more assistance from cooperatives. For example, Snider et al. [5] note that cooperatives prefer to certify larger farms to maximize output while reducing the number of issued certifications. Therefore, the effect of agricultural cooperatives on farm profit is more pronounced amongst larger farms. The decomposition of the treatment effects into the indirect (mediation) and the direct effect are reported in Panel B of Table 3. At the mean level of farm profit, the mediation and direct effect account for 14.6% and 85.4% of the total treatment effect, respectively. That is, the use of food labels can explain approximately 15% of the total effects of participating in agricultural cooperatives on farm profits. These findings are robust across the entire distribution of farm profit. For example, at the 0.75 percentile, the mediation effect accounts for 28.5% of the total effect.

5.3. Discussion and Policy Implications

The findings of this study explain several patterns related to agricultural cooperatives and food labels for a significant number of markets. Many agricultural authorities and international organizations have provided legal frameworks and financial subsidies to support the establishment of cooperatives to alleviate farm performance concerns [29]. Our results indicate that cooperatives increase farm profitability and that an important mechanism behind this evident effect is the adoption of food labels by producers.
Our results have policy implications that are particularly important for farms in developed countries. Agricultural authorities in industrialized countries have been increasingly concerned with decreasing farm profits due to the fluctuating price dynamics that are present in agriculture [30]. In Taiwan, the Council of Agriculture (COA) and the democratically-elected Legislative Yuan (parliament) are actively trying to increase farm profitability since nearly 5% of the labor force is employed in agriculture [17]. We show that cooperatives can enhance farm performance in these precise markets, even though they are viewed as a more salient organization for developing markets since cooperatives support farmers in accessing agronomic inputs, financial capital, and markets [4]. For example, organizations such as the Ghana Cooperative Council (GCC) and the Indian Farmers Fertilizer Cooperative (IFFCO) are crucial for agricultural development as members of the International Cooperatives Alliance [31]. Our findings suggest that in countries where these barriers are less significant, agricultural authorities should still foster the growth and development of these institutions and encourage farmers to engage with them.
This analysis also suggests that governments can increase farm performance by facilitating the adoption of food labels amongst producers. In many regions, the process of applying for specialty certifications and labels is extensive. For example, to receive the TGAP insignia for their products, Taiwanese farmers must navigate a lengthy procedure that includes a paid application, written review, site audit, production inspection, and additional verification.
Cooperatives support farmers applying for food certifications and labels across two primary dimensions. First, cooperatives provide technical assistance in managing the human resource costs associated with these standards, such as farm visits, training, and recordkeeping [5]. Second, cooperatives subsidize many of the economic burdens instigated by these optional practices, including application fees and the hiring of employees [5]. An additional policy implication of our results suggests that authorities should establish educational and technical assistance programs that ease the strain of obtaining food certifications and labels. These initiatives would continue to facilitate the adoption of these voluntary practices amongst cooperatives and non-member farmers.
Given these findings, our results suggest that policymakers should encourage agricultural cooperatives to continually reduce information asymmetries. For example, because farmers are often older and less educated, cooperatives can establish outreach activities to visit farms and provide them with relevant information. One example of a successful model includes the Almería Agricultural Cooperatives in Southwest Spain [32]. These cooperatives function as a market and non-market coordination mechanism for both individuals and local institutions, such as contributing to knowledge systems related to farm labor and employing agricultural technicians to reduce the usage of pesticides [32]. Similarly, many food certifications also require environmentally friendly production practices, such as organic farming. Agricultural cooperatives and policymakers can work in tandem to provide relevant information such as where to purchase seeds and which agronomic inputs should be used on farm production. Finally, we provide additional evidence justifying the long-run sustainability of agricultural cooperatives. Recent literature has studied the enduring survivability of these organizations based on institutional theories, organizational adaptions, and social capital [33,34,35]. We argue that farm profitability is an especially useful proxy for sustainability, as it is a static indicator that considers both revenues and costs for producers. A straightforward policy implication of our results suggests that agricultural authorities should support cooperatives and the adoption of food certifications and labels to ensure the longevity of farms.

6. Conclusions

This paper studies the effect of agricultural cooperatives on farm profitability. While there is a substantial amount of literature on this topic, our study makes several contributions to the research. First, we used a large nationally representative sample of farm households producing multiple types of agricultural commodities. Second, we examined the impact of cooperatives using data from a high-income industrialized country. And finally, we estimated the causal mediation analysis and identified the mechanism behind these treatment effects. Our findings have shown that participating in cooperatives increases farm profits and that this effect is more pronounced at the upper ends of the profit distribution. Furthermore, profit differentials across participants and non-participants of cooperatives are indirectly attributable to the adoption of food label certifications.
These findings have two main policy implications. We show that agricultural authorities should facilitate the development and participation in cooperatives based on their impact on farm profitability. Additionally, policymakers should establish programs that promote the adoption of food label certifications amongst cooperative members and their non-member counterparts.
Some limitations of our study include the fact that we are only able to empirically identify one intermediate variable through which cooperatives affect farm profitability based on the information in our dataset. Further research could apply similar estimation strategies and identify other mediators that impact farm performance, such as subsidy programs for the land purchases of beginning farmers. Similarly, future research could use panel data to examine the long-term effect of agricultural cooperatives on farm profits and farm sustainability. Our study also has the limitation of only using a single indicator of farm performance. Future research examining the relationship between agricultural cooperatives, the adoption of voluntary practices, and farm performance would be insightful.

Author Contributions

Each author has equal contribution to the manuscript in term of data collection, model estimation and writing.

Funding

This research received no external funding.

Acknowledgments

The authors would like to thank the Council of Agriculture for making the individual farm level data available. Brian Lee would like to acknowledge the sponsorship of Fulbright Taiwan (Foundation for Scholarly Exchange).

Conflicts of Interest

The authors declare no conflict of interest.

References

  1. Wadsworth, J.; Coleman, C. Agricultural Cooperative Statistics; Service Report 81; USDA Rural Development: Washington, DC, USA, 2017. [Google Scholar]
  2. Francesconi, N.; Wouterse, F. A New Generation of Cooperatives for Africa; CIAT Policy Brief No. 37; Centro Internacional de Agricultura Tropical: Cali, Colombia, 2017. [Google Scholar]
  3. Ortmann, G.F.; King, R.P. Agricultural Cooperatives I: History, Theory and Problems. Agrekon 2007, 46, 18–46. [Google Scholar] [CrossRef]
  4. Grashuis, J.; Su, Y. A Review of the Empirical Literature on Farmer Cooperatives: Performance, Ownership and Governance, Finance, and Member Attitude. Ann. Public Coop. Econ. 2019, 90, 77–102. [Google Scholar] [CrossRef]
  5. Snider, A.; Gutiérrez, I.; Sibelet, N.; Faure, G. Small farmer cooperatives and voluntary coffee certifications: Rewarding progressive farmers of engendering widespread change in Costa Rica? Food Policy 2017, 69, 231–242. [Google Scholar] [CrossRef]
  6. Jin, S.; Zhou, J. Adoption of food safety and quality standards by China’s agricultural cooperatives. Food Control 2011, 22, 204–208. [Google Scholar] [CrossRef]
  7. Ito, J.; Bao, Z.; Su, Q. Distributional effects of agricultural cooperatives in China: Exclusion of smallholders and potential gains on participation. Food Policy 2012, 37, 700–709. [Google Scholar] [CrossRef]
  8. Hoken, H.; Su, Q. Measuring the effect of agricultural cooperatives on household income: Case study of a rice-producing cooperative in China. Agribusiness 2018, 34, 831–846. [Google Scholar] [CrossRef]
  9. Ma, W.; Abdulai, A. Does cooperative membership improve household welfare? Evidence from apple farmers in China. Food Policy 2016, 58, 94–102. [Google Scholar] [CrossRef]
  10. Fischer, E.; Qaim, M. Linking Smallholders to Markets: Determinants and Impacts of Farmer Collective Action in Kenya. World Dev. 2012, 40, 1255–1268. [Google Scholar] [CrossRef] [Green Version]
  11. Verhofstadt, E.; Maertens, M. Can Agricultural Cooperatives Reduce Poverty? Heterogeneous Impact of Cooperative Membership on Farmers’ Welfare in Rwanda. Appl. Econ. Perspect. Policy 2015, 37, 86–106. [Google Scholar] [CrossRef]
  12. Mojo, D.; Fischer, C.; Degefa, T. The determinants and economic impacts of membership in coffee farmer cooperatives: Recent evidence from rural Ethiopia. J. Rural Stud. 2017, 50, 84–94. [Google Scholar] [CrossRef]
  13. Shumeta, Z.; D’Haese, M. Do coffee cooperatives benefit farmers? An exploration of heterogeneous impact of coffee cooperative membership in Southwest Ethiopia. Int. Food Agribus. Manag. Rev. 2016, 19, 37–52. [Google Scholar] [CrossRef]
  14. Xu, Y.; Liang, Q.; Huang, Z. Benefits and pitfalls of social capital for farmer cooperatives: Evidence from China. Int. Food Agribus. Manag. Rev. 2018, 21, 1137–1152. [Google Scholar] [CrossRef]
  15. Cattaneo, M.D. Efficient semiparametric estimation of multi-valued treatment effects under ignorability. J. Econom. 2010, 155, 138–154. [Google Scholar] [CrossRef]
  16. Agriculture and Food Agency, Council of Agriculture. Available online: https://www.afa.gov.tw/eng/index.php?code=list&flag=detail&ids=474&article_id=3734 (accessed on 10 September 2019).
  17. National Development Council, Executive Yuan. 2018 Taiwan Statistical Data Book; National Development Council, Executive Yuan, Republic of China (Taiwan): Taipei, Taiwan, 2018. [Google Scholar]
  18. Mao, Y.K.; Schive, C. Agricultural and Industrial Development in Taiwan. In Agriculture on the Road to Industrialization; Johns Hopkins University Press: Baltimore, MD, USA, 1995; pp. 23–66. [Google Scholar]
  19. Lin, D. Agricultural Cooperatives in Taiwan. In Proceedings of the FFTC-NACF International Seminar on Agricultural Cooperatives in Asia: Innovations and Opportunities in the 21st Century, Seoul, Korea, 11–15 September 2006. [Google Scholar]
  20. Annual Report of Agricultural Associations; National Farmers’ Associations: Taipei, Taiwan, 2019.
  21. Chang, H.-H. Does the use of eco-labels affect income distribution and income inequality of aquaculture producers in Taiwan? Ecol. Econ. 2012, 80, 101–108. [Google Scholar] [CrossRef]
  22. Annual Report of the Council of Agriculture; Council of Agriculture, Executive Yuan: Taipei, Taiwan, 2011; p. 79.
  23. Liu, C.-C. Food Safety and Traceability of Agricultural Products; Food and Fertilizer Technology Center for the Asian and Pacific Region: Taipei, Taiwan, 2019. [Google Scholar]
  24. Council of Agriculture, Executive Yuan. 2013 Main Farm Households Survey; Council of Agriculture, Executive Yuan, Republic of China (Taiwan): Taipei, Taiwan, 2013. [Google Scholar]
  25. Imai, K.; Keele, L.; Tingley, D.; Yamamoto, T. Unpacking the Black Box of Causality: Learning about Causal Mechanisms from Experimental and Observational Studies. Am. Polit. Sci. Rev. 2011, 105, 765–789. [Google Scholar] [CrossRef]
  26. Wollni, M.; Zeller, M. Do farmers benefit from participating in specialty markets and cooperatives? The case of coffee marketing in Costa Rica. Agric. Econ. 2007, 37, 243–248. [Google Scholar] [CrossRef]
  27. Pinto, L.F.G.; Gardner, T.; McDermott, C.L.; Ayub, K.O.L. Group certification supports an increase in the diversity of sustainable agriculture network–rainforest alliance certified coffee producers in Brazil. Ecol. Econ. 2014, 107, 59–64. [Google Scholar] [CrossRef]
  28. Lingohr, S. Rural Households, Dragon Heads and Associations: A Case Study of Sweet Potato Processing in Sichuan Province. China Q. 2007, 192, 898–914. [Google Scholar] [CrossRef]
  29. Iliopoulos, C. Public Policy Support for Agricultural Cooperatives: An Organizational Economics Approach. Ann. Public Coop. Econ. 2013, 84, 241–252. [Google Scholar] [CrossRef]
  30. Patrick, K.; Kuhns, R.; Borchers, A. Recent Trends in U.S. Farm Income, Wealth, and Financial Health. Choices 2016, 31, 1–8. [Google Scholar]
  31. International Cooperatives Alliance. Available online: https://www.ica.coop/en (accessed on 10 September 2019).
  32. Giagnocavo, C.; Galdeano-Gómez, E.; Pérez-Mesa, J. Cooperative Longevity and Sustainable Development in a Family Farming System. Sustainability 2018, 10, 2198. [Google Scholar] [CrossRef]
  33. Bijman, J. Exploring the Sustainability of the Cooperative Model in Dairy: The Case of the Netherlands. Sustainability 2018, 10, 2498. [Google Scholar] [CrossRef]
  34. Grashuis, J. An Exploratory Study of Cooperative Survival: Strategic Adaptation to External Developments. Sustainability 2018, 10, 652. [Google Scholar] [CrossRef]
  35. Yu, L.; Nilsson, J. Social Capital and Financial Capital in Chinese Cooperatives. Sustainability 2019, 11, 2415. [Google Scholar] [CrossRef]
Figure 1. Structure of the mediation analysis.
Sustainability 11 04987 g001
Table 1. Sample statistics of the selected variables.
All SampleD_AC = 1D_AC = 0
VariableDefinition MeanS.DMeanS.DMeanS.D
D_ACIf participated in agricultural cooperatives (=1).0.387 0.487 1 0 0 0
ProfitProfit of farm production (NT$ 1 million).0.681 1.698 0.911 2.448 0.536 0.929
LabelIf using any food label of farm products (=1).0.142 0.349 0.322 0.467 0.029 0.168
AgeAge of the farmer operator (year).57.2610.9056.6610.5257.6411.13
MaleIf a male farm operator (=1).0.894 0.308 0.915 0.279 0.880 0.325
Edu_primaryIf the farmer has a primary education (=1).0.379 0.485 0.347 0.476 0.399 0.490
Edu_juniorIf the farmer finished junior high school (=1).0.274 0.446 0.279 0.449 0.271 0.445
Edu_seniorIf the farmer finished senior high school (=1).0.288 0.453 0.319 0.466 0.268 0.443
Edu_collIf the farmer has a college degree or higher education (=1).0.059 0.236 0.055 0.227 0.062 0.241
HHSIZENumber of persons living in the farm household.2.528 1.035 2.652 1.120 2.449 0.969
HHSIZE_farmRatio of household members working on the farm.0.720 0.326 0.768 0.307 0.689 0.334
Farm sizeThe size of farmland (hectare).1.690 2.328 1.950 2.811 1.525 1.944
ExperienceFarming experience of the farm operator (year).29.27 14.70 29.62 14.28 29.05 14.96
RiceIf a rice farm (=1).0.116 0.321 0.066 0.249 0.148 0.355
VegetableIf a vegetable farm (=1).0.275 0.446 0.245 0.430 0.294 0.455
FruitIf a fruit farm (=1).0.421 0.494 0.502 0.500 0.369 0.483
OthercropIf producing other crops (=1).0.126 0.332 0.126 0.332 0.126 0.332
LivestockIf a livestock farm (=1).0.062 0.242 0.060 0.238 0.063 0.244
NorthIf located in northern area (=1).0.116 0.320 0.142 0.349 0.099 0.299
WestIf located in western area (=1).0.482 0.500 0.496 0.500 0.473 0.499
EastIf located in eastern area (=1).0.072 0.258 0.070 0.255 0.073 0.260
SouthIf located in southern area (=1).0.331 0.470 0.292 0.455 0.355 0.479
NNumber of farm households9946 3853 6093
Table 2. Estimation of the participation equation to agricultural cooperatives.
VariableCoefficientS.EMarginal Effect
Age−0.020 ***0.003 −0.005
Male0.341 ***0.074 0.077
Edu_junior0.107 *0.063 0.025
Edu_senior0.248 ***0.070 0.059
Edu_coll0.012 0.109 0.003
HHSIZE0.191 ***0.022 0.045
Farm size0.081 ***0.011 0.019
HHSIZE_farm0.732 ***0.073 0.172
Experience0.017 ***0.002 0.004
Rice−0.904 ***0.116 −0.188
Vegetable−0.270 ***0.096 −0.062
Fruit0.303 ***0.092 0.071
Othercrop−0.220 **0.106 −0.051
West−0.539 ***0.071 −0.126
East−0.576 ***0.106 −0.125
South−0.779 ***0.075 −0.175
Constant−0.775 ***0.222 --
Log-likelihood−6247
Pseudo R20.059
N9946
Note: The binary logit model is estimated. ***, **, * indicate significance at the 1%, 5% and 10% level, respectively.
Table 3. Estimation results of the treatment effects and the mediation analysis.
Panel A. Estimation of the treatment effect
Mean EffectQuantile Effect
0.250.50.75
EstimateS.EEstimateS.EEstimateS.EEstimateS.E
ATE0.162 ***0.052 0.059 ***0.009 0.113 ***0.019 0.229 ***0.037
Panel B. Decomposition results of the mediation analysis
Estimate Estimate Estimate Estimate
Mediation Effect (ME)14.6%*** 24.8%***25.5%***28.5%***
Direct Effect (DE)85.4%*** 75.2%***74.5%***71.5%***
Note: Standard errors of the effects are calculated using the bootstrap method with 500 replications. ***, **, * indicate significance at the 1%, 5% and 10% level, respectively.

