Characterization of Territorial Spatial Agglomeration Based on POI Data: A Case Study of Ningbo City, China

1
Department of Land Management, Zhejiang University, Hangzhou 310058, China
2
Wuhan Land Use and Urban Spatial Planning Research Center, Wuhan 430014, China
*
Author to whom correspondence should be addressed.
Sustainability 2019, 11(18), 5083; https://0-doi-org.brum.beds.ac.uk/10.3390/su11185083
Submission received: 12 August 2019
/
Revised: 9 September 2019
/
Accepted: 12 September 2019
/
Published: 17 September 2019
Abstract
:Territorial space is a valuable resource, and it is the home on which human beings depend for their survival and development. However, due to disorder, excessive and decentralized development, resource constraints are tightening, ecological environment deterioration, regional development imbalance and other prominent problems. Agglomeration development has become the strategic choice of territorial space development in China. Therefore, understanding the agglomeration characteristics of territorial space is helpful for local governments to carry out territorial spatial planning. Based on POI (point of interest) data, the method of spatial point pattern analysis is used to characterize the territorial spatial agglomeration in Ningbo city. We found that the elliptic center of Ningbo’s territorial space is distributed in Haisu district. The whole trend is along the “northwest to southeast” direction, and there is a significant directionality. The entire territorial space presents spatial agglomeration, and the agglomeration characteristics of the commercial space are more significant. Moreover, there is a spatial scale effect on the agglomeration of territorial space, which changes with the geographical distance attenuation and presents an inverted “U” structure. With Sanjiangkou as the core, the agglomeration hotspots of all levels distribute in a gradient manner, and the spatial differentiation of “center-periphery” is obvious. The characteristics of its spatial distribution are “river-oriented” and “sea-oriented”. In conclusion, the locking effect of a single center is still significantly higher than the evacuation “magnetic force” of multiple centers in Ningbo city. In the future, we should effectively disperse the densely clustered areas in the central urban area, and focus on cultivating peripheral sub-centers/groups to enhance the positive interaction between multiple centers.
1. Introduction
Territorial space is a valuable resource, and it is the home on which human beings depend for their survival and development [1]. The development and utilization of territorial space is a double-edged sword: Although it effectively supports the rapid development of the national economy and social progress, there are also some outstanding problems of great importance that must be solved—such as the sharp decline of cultivated land, ecological damage, environmental pollution, low efficiency of territorial space utilization, and uncoordinated development of urban and rural areas. For a country, especially a large country, choosing the strategy of territorial space development is an important proposition for development and prosperity [2]. In a period of rapid industrialization and urbanization and rapid change of spatial structure, it is particularly important to adhere to the scientific orientation of the territorial space development. Therefore, agglomeration development has become the strategic choice of territorial space development in China. In 2017, the State Council promulgated the National Territorial Planning Outline (2016–2030), which made a comprehensive and systematic deployment for the development, protection and renovation of China’s territorial space. For the first time, it clearly put forward “focusing on agglomeration development, encouraging conditional areas to take the lead in development, giving full play to agglomeration benefits, and improving the radiation-driven ability to the surrounding areas” [3]. Agglomeration development will be the leading way of territorial space development in China for a long time in the future. Therefore, considering issues related to territorial spatial agglomeration under the space governance system, it has important practical significance for the construction of the pattern of territorial space development with moderate, intensive and sustainable use.
Agglomeration is a common phenomenon of economic activities for a long time in the word. The spatial agglomeration of industry is the most prominent geographical feature of economic activities [4]. A large number of empirical studies mainly focus on manufacturing industry [5,6,7], but some scholars have noticed the impact of spatial agglomeration on the service industry [8]. In addition, the relationship between industrial agglomeration and environmental pollution has also aroused scholars’ interest [9]. In recent years, people are more and more interested in the phenomenon of economic geographical concentration. In Europe, more than 50% of the European population accounts for only 4% of its land area and two-thirds of its GDP [10]. How to explain the agglomeration of economic activities will be a challenge. Previous studies have shown that agglomeration is not only attributed to the first natural factor alone, but also to the second natural factor, namely, human agglomeration economy [11]. For example, when the urban population changes exogenously, road density will improve the efficiency of agglomeration [12]. The future development of urbanization is to enhance the agglomeration through the integration of cities and towns, but the research on understanding the role of agglomeration and decentralization in urban growth is still very limited [13].
Since the 18th National Congress of the Communist Party of China, the optimization of the development pattern of territorial space has become the primary task of ecological civilization construction. How to optimize it becomes a difficult problem to be solved urgently [14,15,16], but mostly based on qualitative research focusing on coping strategies. With the idea of the spatial structure of “production, life and ecology”, the research results are increasing gradually, which is highlighted in such aspects as functional zoning [17], quantitative identification and features [18,19], classification evaluation [20], and evaluation of the suitability of territorial space development [21]. A small number of scholars also pay attention to the efficiency and quality of territorial space [22,23]. However, the research on territorial spatial agglomeration is very limited. Some scholars have discussed the spatial pattern of urban land use, mostly using the landscape index combined with the spatial statistics method to explore the agglomeration characteristics of urban green space, urban construction land, etc. [24,25]. There are also scholars who have made relevant evaluation studies on the degree of territorial spatial agglomeration from the connotation, dynamic mechanism and evaluation system, but the explanation of the characteristics of territorial spatial agglomeration is relatively insufficient [26].
In the age of big data, the emergence of big data on the Internet not only changes people’s work and life, but also brings great challenges and opportunities to the academic community [27]. Big data has gradually become an important way for scholars in various fields to carry out research [28]. A point of interest (POI) is a kind of spatial point data representing real geographic entities in the form of large data that contains attribute information, such as name, category, longitude, latitude, and address [29]. POIs of the urban space based on distribution patterns and density have become an important breakthrough point in the fine urban spatial analysis [30]. At present, POI data have been widely used in urban functional area identification [31], boundary delimitation of built-up areas [29], spatial structure [32,33] and industrial layout [34,35]. Compared with the traditional data, POI data have good timeliness and objectivity; has a higher spatial resolution; intuitively and effectively reflects the density of urban construction, the degree of industrial agglomeration, and so on. It not only keeps a high degree of conformity with the current situation of construction, but also helps to improve the research accuracy. [36]. The essence of territorial spatial agglomeration is to gather population, industry and towns. Therefore, high density is the most basic characteristic, which can be described by the spatial distribution difference of POI points. However, empirical work on characteristics of territorial spatial agglomeration by using POI data is sparse.
In 2016, the State Council promulgated the Development Planning of Urban Agglomeration in the Yangtze River Delta, which clearly defined the goal of building a world-class urban agglomeration with global influence, and proposed to speed up the construction of the Ningbo metropolitan area and raise it to a higher strategic level. Under the background of the integration of the Yangtze River Delta, Ningbo city, as an important node, will have positive or negative effects on the development of urban agglomeration, due to its agglomeration and diffusion effects. Therefore, it is urgent to promote the overall coordination of Ningbo city, strengthen the polar core function of the central city, and comprehensively improve the urban competitiveness.
Based on POI data and taking Ningbo city as the research area, with the help of Crimestat 3.3 (Ned Levine and Associates, Houston, TX, USA) and ArcGIS 10.1 (ESRI, Redlands, CA, USA) software. This paper comprehensively uses the method of spatial point pattern analysis to describe the characteristics of territorial spatial agglomeration on the aspects of distribution pattern, agglomeration degree, spatial scale, and agglomeration hotspots. In order to provide precise suggestions for optimizing the pattern of territorial space and related policies and indicators.
2. Data and Methods
2.1. Study Area
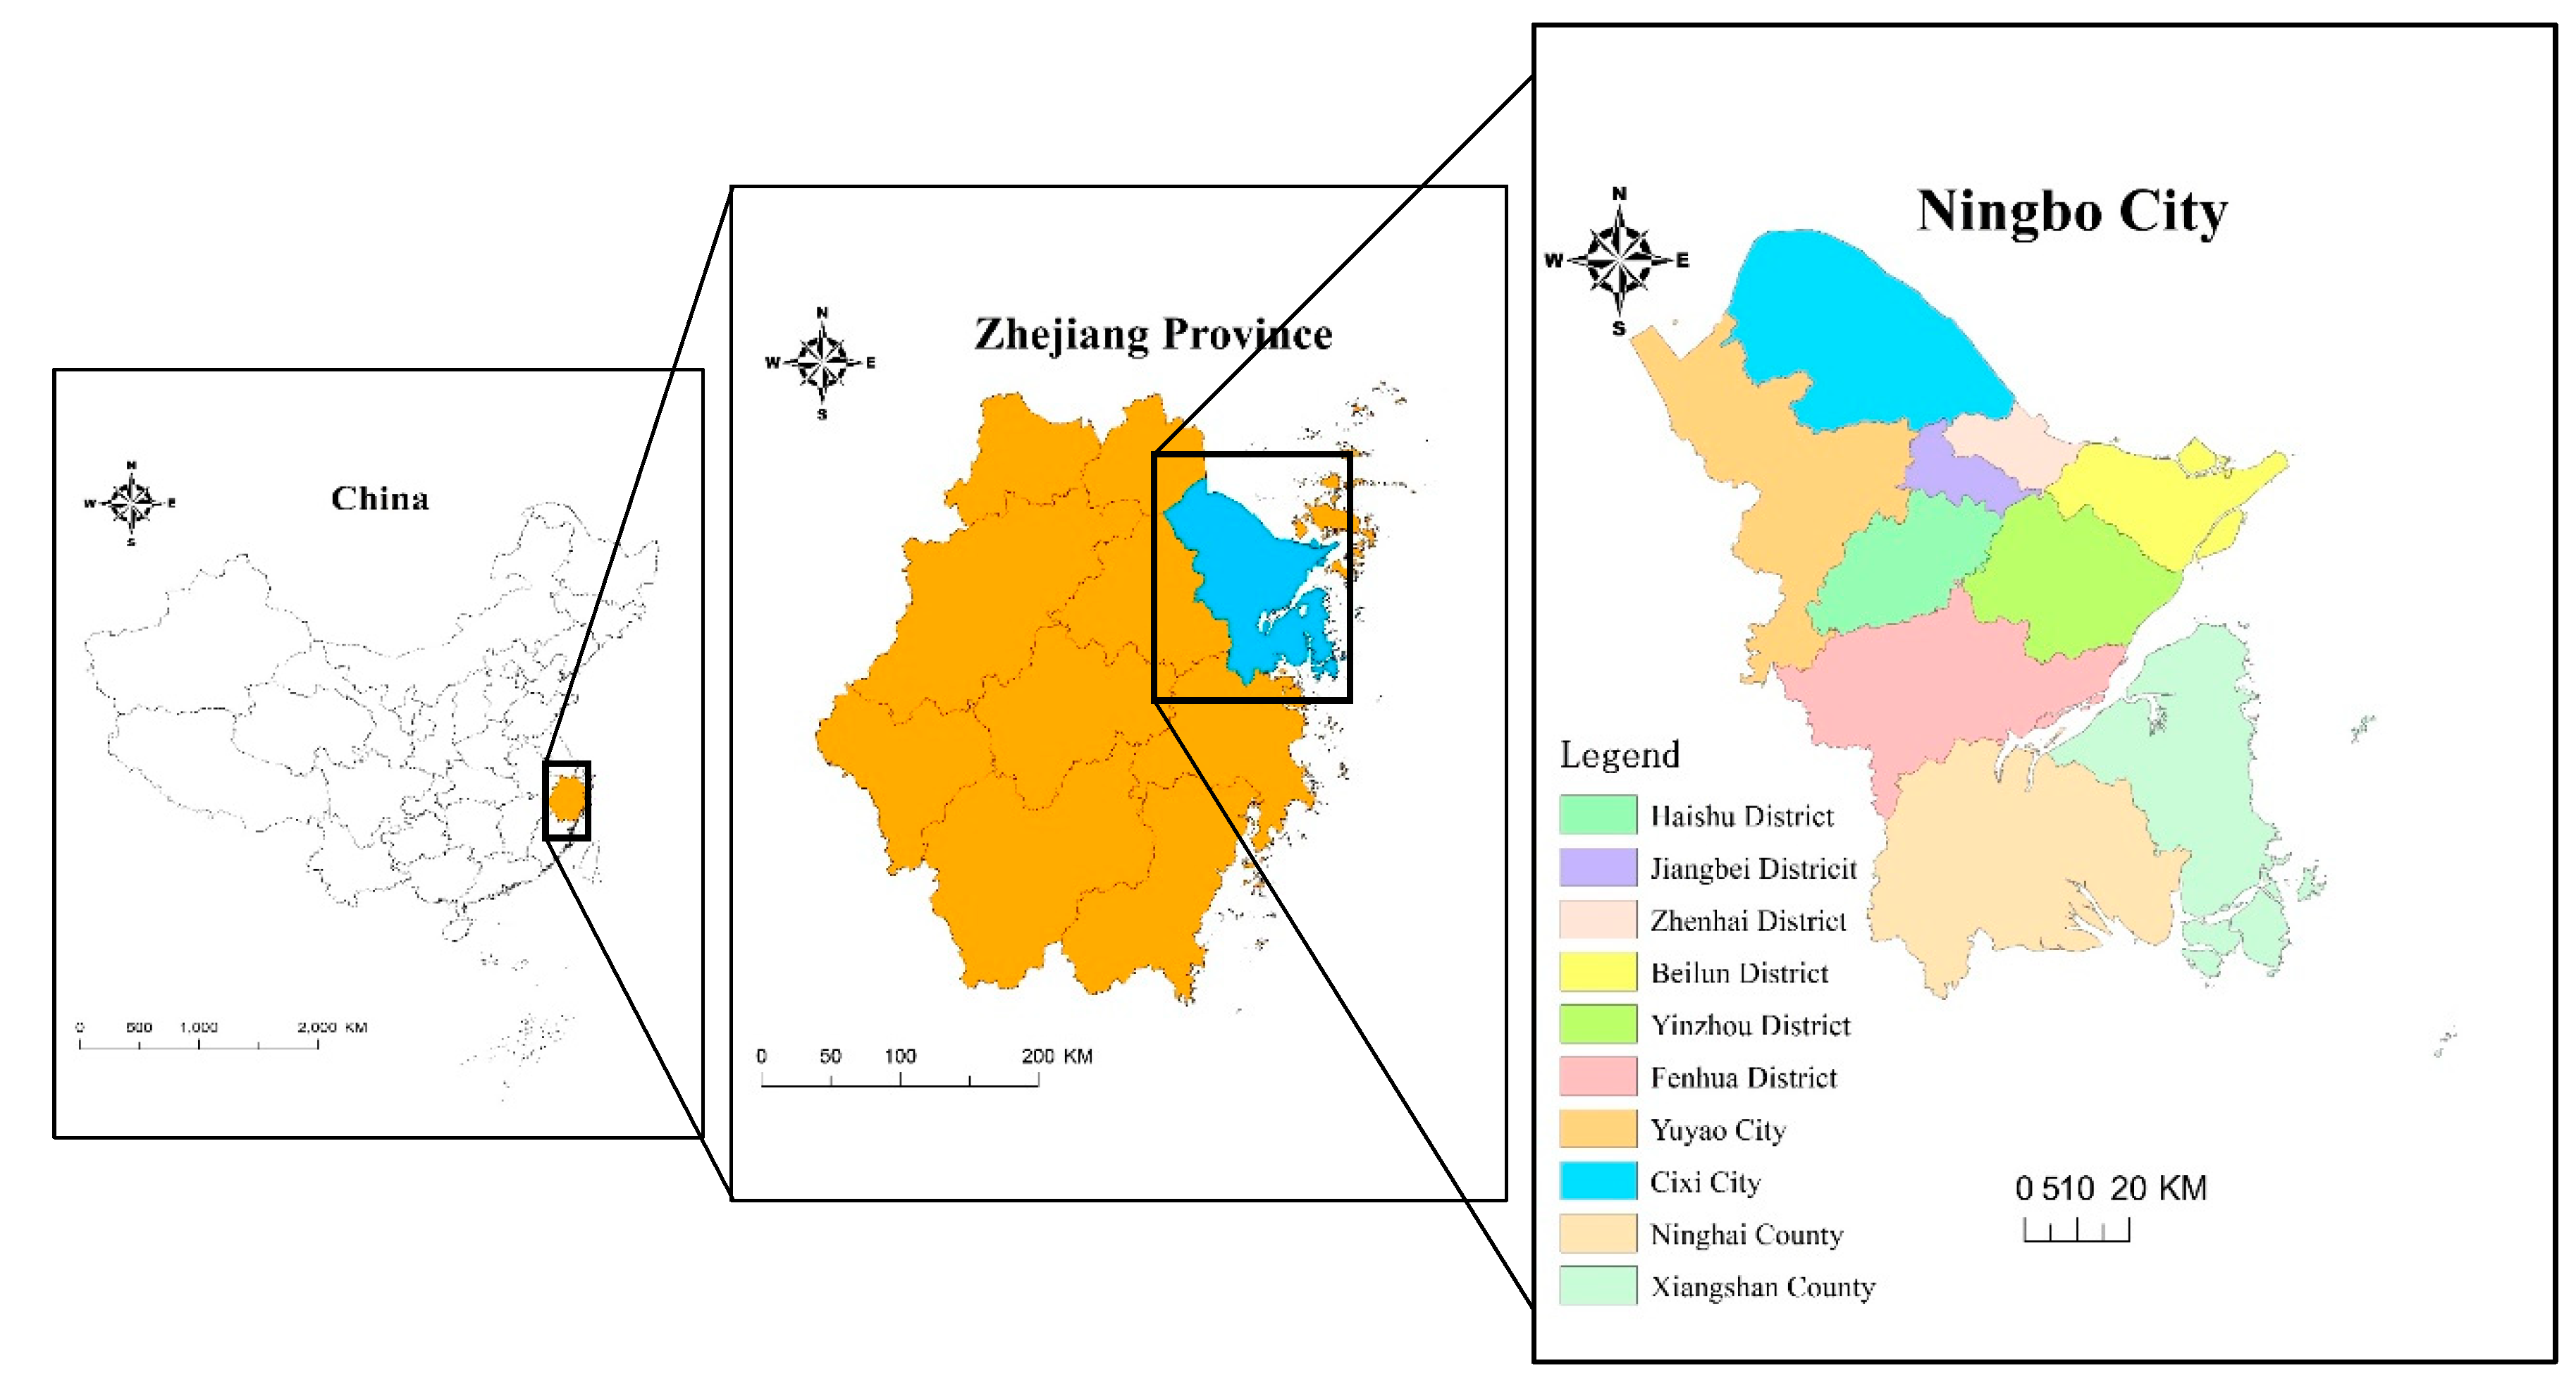
Ningbo is located at the intersection of the “T”-type structures in the north and south of China and the Yangtze River. It has convenient internal and external radiation and obvious location advantages (Figure 1). The land area of the city is 9816 km2, the sea area is 9758 km2, and the total length of the coastline is 1594 km. It has ten counties (cities and districts) under its jurisdiction, which are the six districts of Haishu, Jiangbei, Zhenhai, Beilun, Yinzhou and Fenghua; two county-level cities of Yuyao and Cixi; and two counties of Ninghai and Xiangshan. By 2018, the permanent population of the city was 8.22 million, and the urban population was 5.98 million, with an urbanization rate of 72.9%. Its GDP of the region reached 1074.6 billion yuan ($162.4 billion), making it one of the cities with a GDP of one trillion yuan ($151 billion). According to the permanent population, the per capita GDP is 132,603 yuan ($20,038).
According to the survey of land use status in 2016, the total scale of urban and rural construction land in Ningbo is 1429.77 km2, accounting for 14.7% of the total land area. Among them, the scale of urban construction land is 807.94 km2, and that of rural residential land is 621.83 km2. As a regional, central city in the south wing of the Yangtze River Delta, Ningbo’s division of labor functions mainly to give play to the advantages of the port, promote the development of the Ningbo metropolitan area, and build the foundation of the international port city, advanced manufacturing industry and modern logistics industry. In order to adapt to the development of the new era, the Ningbo 2049 Urban Development Strategic Plan put forward the ideal spatial pattern of “one core and two sub-centers, Sanjiang, Sanwan, and Grand Garden”, and gradually realizes the leap from the “Sanjiang era” to the “Sanwan era” to optimize and expand the urban spatial pattern.
2.2. Data Sources
POI data in this article are obtained from the Baidu map open platform through the network data crawler tool, and the acquisition time is March 2017. In view of the fact that this paper focuses on the distribution pattern and characteristics of the territorial space in Ningbo, the original data is initially cleaned and reclassified. According to the principles of universality, consistency and publicity of POI classification [37], referring to the Standard of Urban Land Classification and Planning Construction Land (GB50137-2011), and this paper divides 82,453 POI data into the following five categories: Residential space, commercial space, industrial space, public service space, and urban open space (Table 1).
2.3. Research Method
2.3.1. Standard Deviational Ellipse
Standard deviational ellipse (SDE) is mainly used to summarize the spatial characteristics of the following geographical elements: Central trend, discrete trend and direction trend [38]. The central trend of the elements is represented by the average central coordinate of the SDE. The dispersion degree of the elements is expressed by the ellipse area and short axis. The short axis represents the range of element distribution. The azimuth angle reflects the main trend direction of its distribution (i.e. the angle of clockwise rotation from due north direction to the major axis of the ellipse). The greater the difference between the values of the long and short axes is, the more obvious the directivity of the elements.
When the elements have a normal spatial distribution (that is, they are the densest at the center and gradually sparse when they are close to the periphery), a range of standard deviations can include the centroids of the input elements, which account for approximately 68% of the total. The two standard deviation ranges will include approximately 95% of the total elements, while the three standard deviation ranges will cover the centroids of approximately 99% of the total elements.
The coordinates of the feature set are (,), (,) …, (,); then the direction angle of the SDE is calculated as follows [39]:
The standard deviations of the long and short axes are and .
where and are the differences between the mean center coordinates x, y and the feature coordinates , respectively.
2.3.2. Nearest Neighbor Index
Nearest neighbor index (NNI) is the ratio of the actual nearest neighbor average distance () of the elements in the study area to the theoretical average distance () of the random distribution model (Form 4). When NNI = 1, that is, = , the elements analyzed are uniformly distributed. When NNI < 1, that is, < , the elements analyzed are aggregately distributed. When NNI > 1, that is, > , the elements analyzed are distributed [40].
Among them, n is the number of elements, is the distance between elements i and its nearest neighbor, and A is the area of the study area.
2.3.3. Ripley’s K Function
There are differences in the distribution patterns of point elements in different spatial scales. Ripley’s K function is an effective tool for analyzing the distribution characteristics of point elements in arbitrary scales that counts the number of point elements according to the search range of a certain radius distance, representing the average number of point elements in the range d and the density of point elements in the region under the display. The ratio of degree is as follows [40]:
Among the variables, n is the number of elements, A is the area of study area, and represents the distance between elements i and j in the range of d distance.
Besag [41] proposed replacing L(d) with k(d) and a making linear transformation of k(d) with the square root to keep the variance stable. The transformed formula is as follows:
Under the assumption of random distribution, the expected value of is 0; L(d) > 0 indicates that the elements are clustered, and L(d) < 0 indicates that the elements are dispersed. To determine the significance of the L(d) function, the Monte Carlo method is used to estimate the confidence interval of the L(d) statistic, i.e., the upper and lower envelope traces. If the actual L(d) value is above the upper trace, the elements are spatially clustered. If the actual L(d) value is between the upper and lower envelope trace, the elements are randomly distributed. If the actual L(d) value is below the track of the subcontract, the elements are uniformly distributed in space. At this point, the maximum value deviating from the confidence interval is L(d) peak value, and the corresponding distance range of d is the spatial scale.
In this paper, the confidence of Ripley’s K function is 90%.
2.3.4. Kernel Density Estimation
Kernel density estimation (KDE) is used to calculate the density of elements in their surrounding areas. It takes the position of a specific point as the central point. The density at the center of the point is the highest, and decreases gradually with distance. The density at the limit distance (h) is 0. The specific attenuation mode is determined by the kernel density function. The attribute value of the central point is the sum of the density integrals in the whole threshold range. By calculating each element point in the region according to the same method and superimposing the density at the same location, the distribution density of elements in the whole region can be obtained [40].
Suppose ,, …, is an independent sample of the same distribution extracted from a population with a distribution density function f, and if f is estimated to be f(x), at point x, the formula is as follows:
where, is the kernel function, h > 0 is the bandwidth, and is the distance from the estimated point x to the sample .
Relevant studies show that the choice of bandwidth h has a key impact on the results of kernel density estimation. Different bandwidth values will lead to different smoothness of the surface of the analysis results [42]. According to the actual study area, after debugging for the bandwidth many times, 3.5 km is finally selected as the bandwidth. This bandwidth size can intuitively show the efficiency and level of territorial spatial agglomeration in Ningbo and explore the internal characteristics of the spatial system.
3. Results Analysis
3.1. Distribution Pattern of Territorial Space Based on the SDE Method
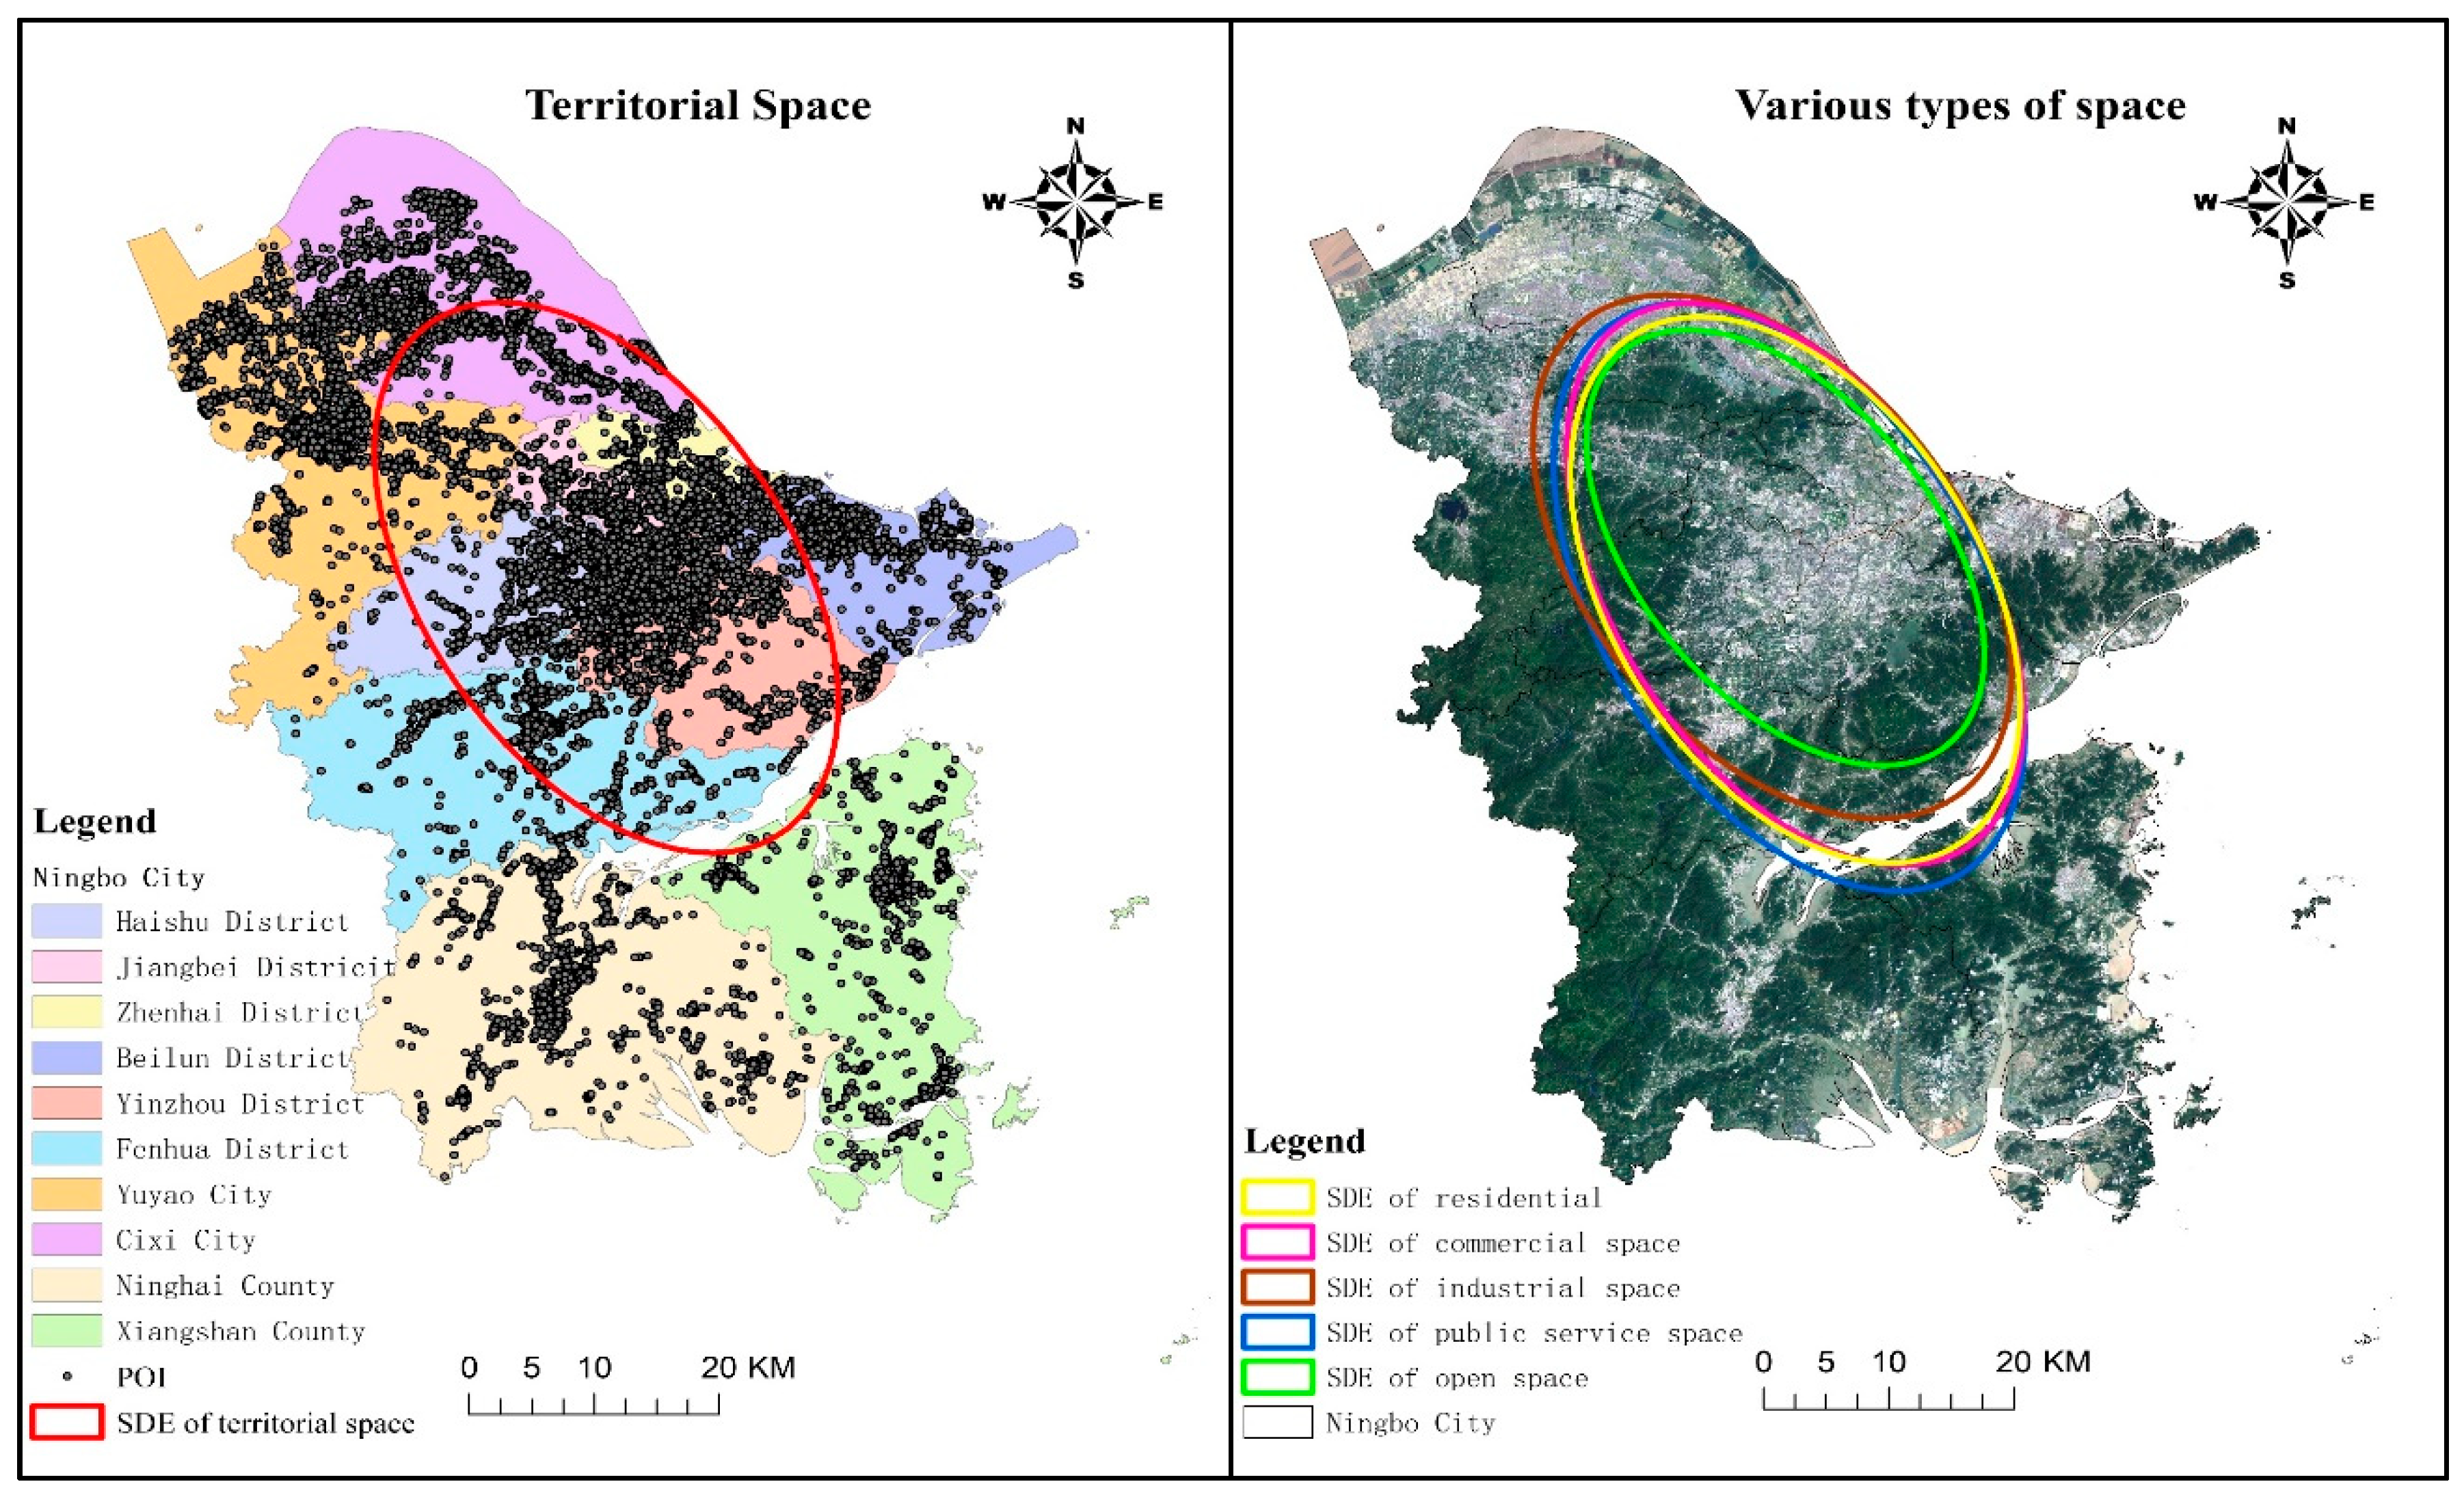
In this paper, the SDE method is used to describe the distribution pattern of Ningbo’s territorial space of the centrality, spreading range and direction trend. The analysis results show that (Figure 2), the elliptic center of territorial space in Ningbo is located in Haisu district, near the Sanjiangkou. The ellipse covers 3189 km2 of the land area, accounting for 32.49% of Ningbo’s land area. The distribution of the ellipse center is obviously northward. The long half-axis of the SDE is 4.2 km, the short half-axis is 2.41 km, and the azimuth angle is 149.34°, which has a significant orientation. The overall distribution pattern of territorial space is characterized by “dense middle and sparse edge”, and the distribution trend is along the “northwest to southeast” direction. This also reflects that the radiation function of the large cities in Shanghai and Hangzhou in the northwest has a traction effect on the development of territorial space in Ningbo. Specifically, the centrality, spreading range, and direction of the SDE of residential and commercial space are all consistent with the overall characteristics of the territorial space, and develop in the direction of northwest to southeast. The distribution center of the SDE of industrial space is obviously northward, and the direction of spatial development is closer to the city of Yuyao and Cixi. The oblateness of the long and short axes of the SDE in public service space is the largest, and its spreading range is the largest. The SDE of urban open space has the smallest oblateness of long and short axes, the smallest spreading range and the weaker directionality.
3.2. Characteristics of Territorial Spatial Agglomeration Based on NNI
The NNI was used to explore the characteristics of the spatial distribution of territorial space in Ningbo. In Table 2, the NNI of the overall territorial space is less than 1, and it passed the significance test of 1% confidence level. The distribution of territorial space in Ningbo is the trend of spatial agglomeration. The NNI of different types of space is also less than 1. By comparison, the NNI of commercial space is the smallest, which indicates that the agglomeration of commercial space is the strongest. The commercial service industry has a strong agglomeration economic effect, which is influenced by its own profit purpose and population demand. Therefore, the spatial distribution shows a significant agglomeration trend. The NNIs of residential, industrial and public service spaces are 0.24, 0.23 and 0.27, respectively, with the agglomeration degree in the middle. The NNI of urban open space is relatively large, showing a general trend of agglomeration. The main reason is that parks and squares in Ningbo are mainly concentrated in urban built-up areas, the allocation of urban open space is still limited, and the scope of space services is relatively large.
3.3. Spatial Scale Effect of Territorial Spatial Agglomeration Based on Ripley’s K Function
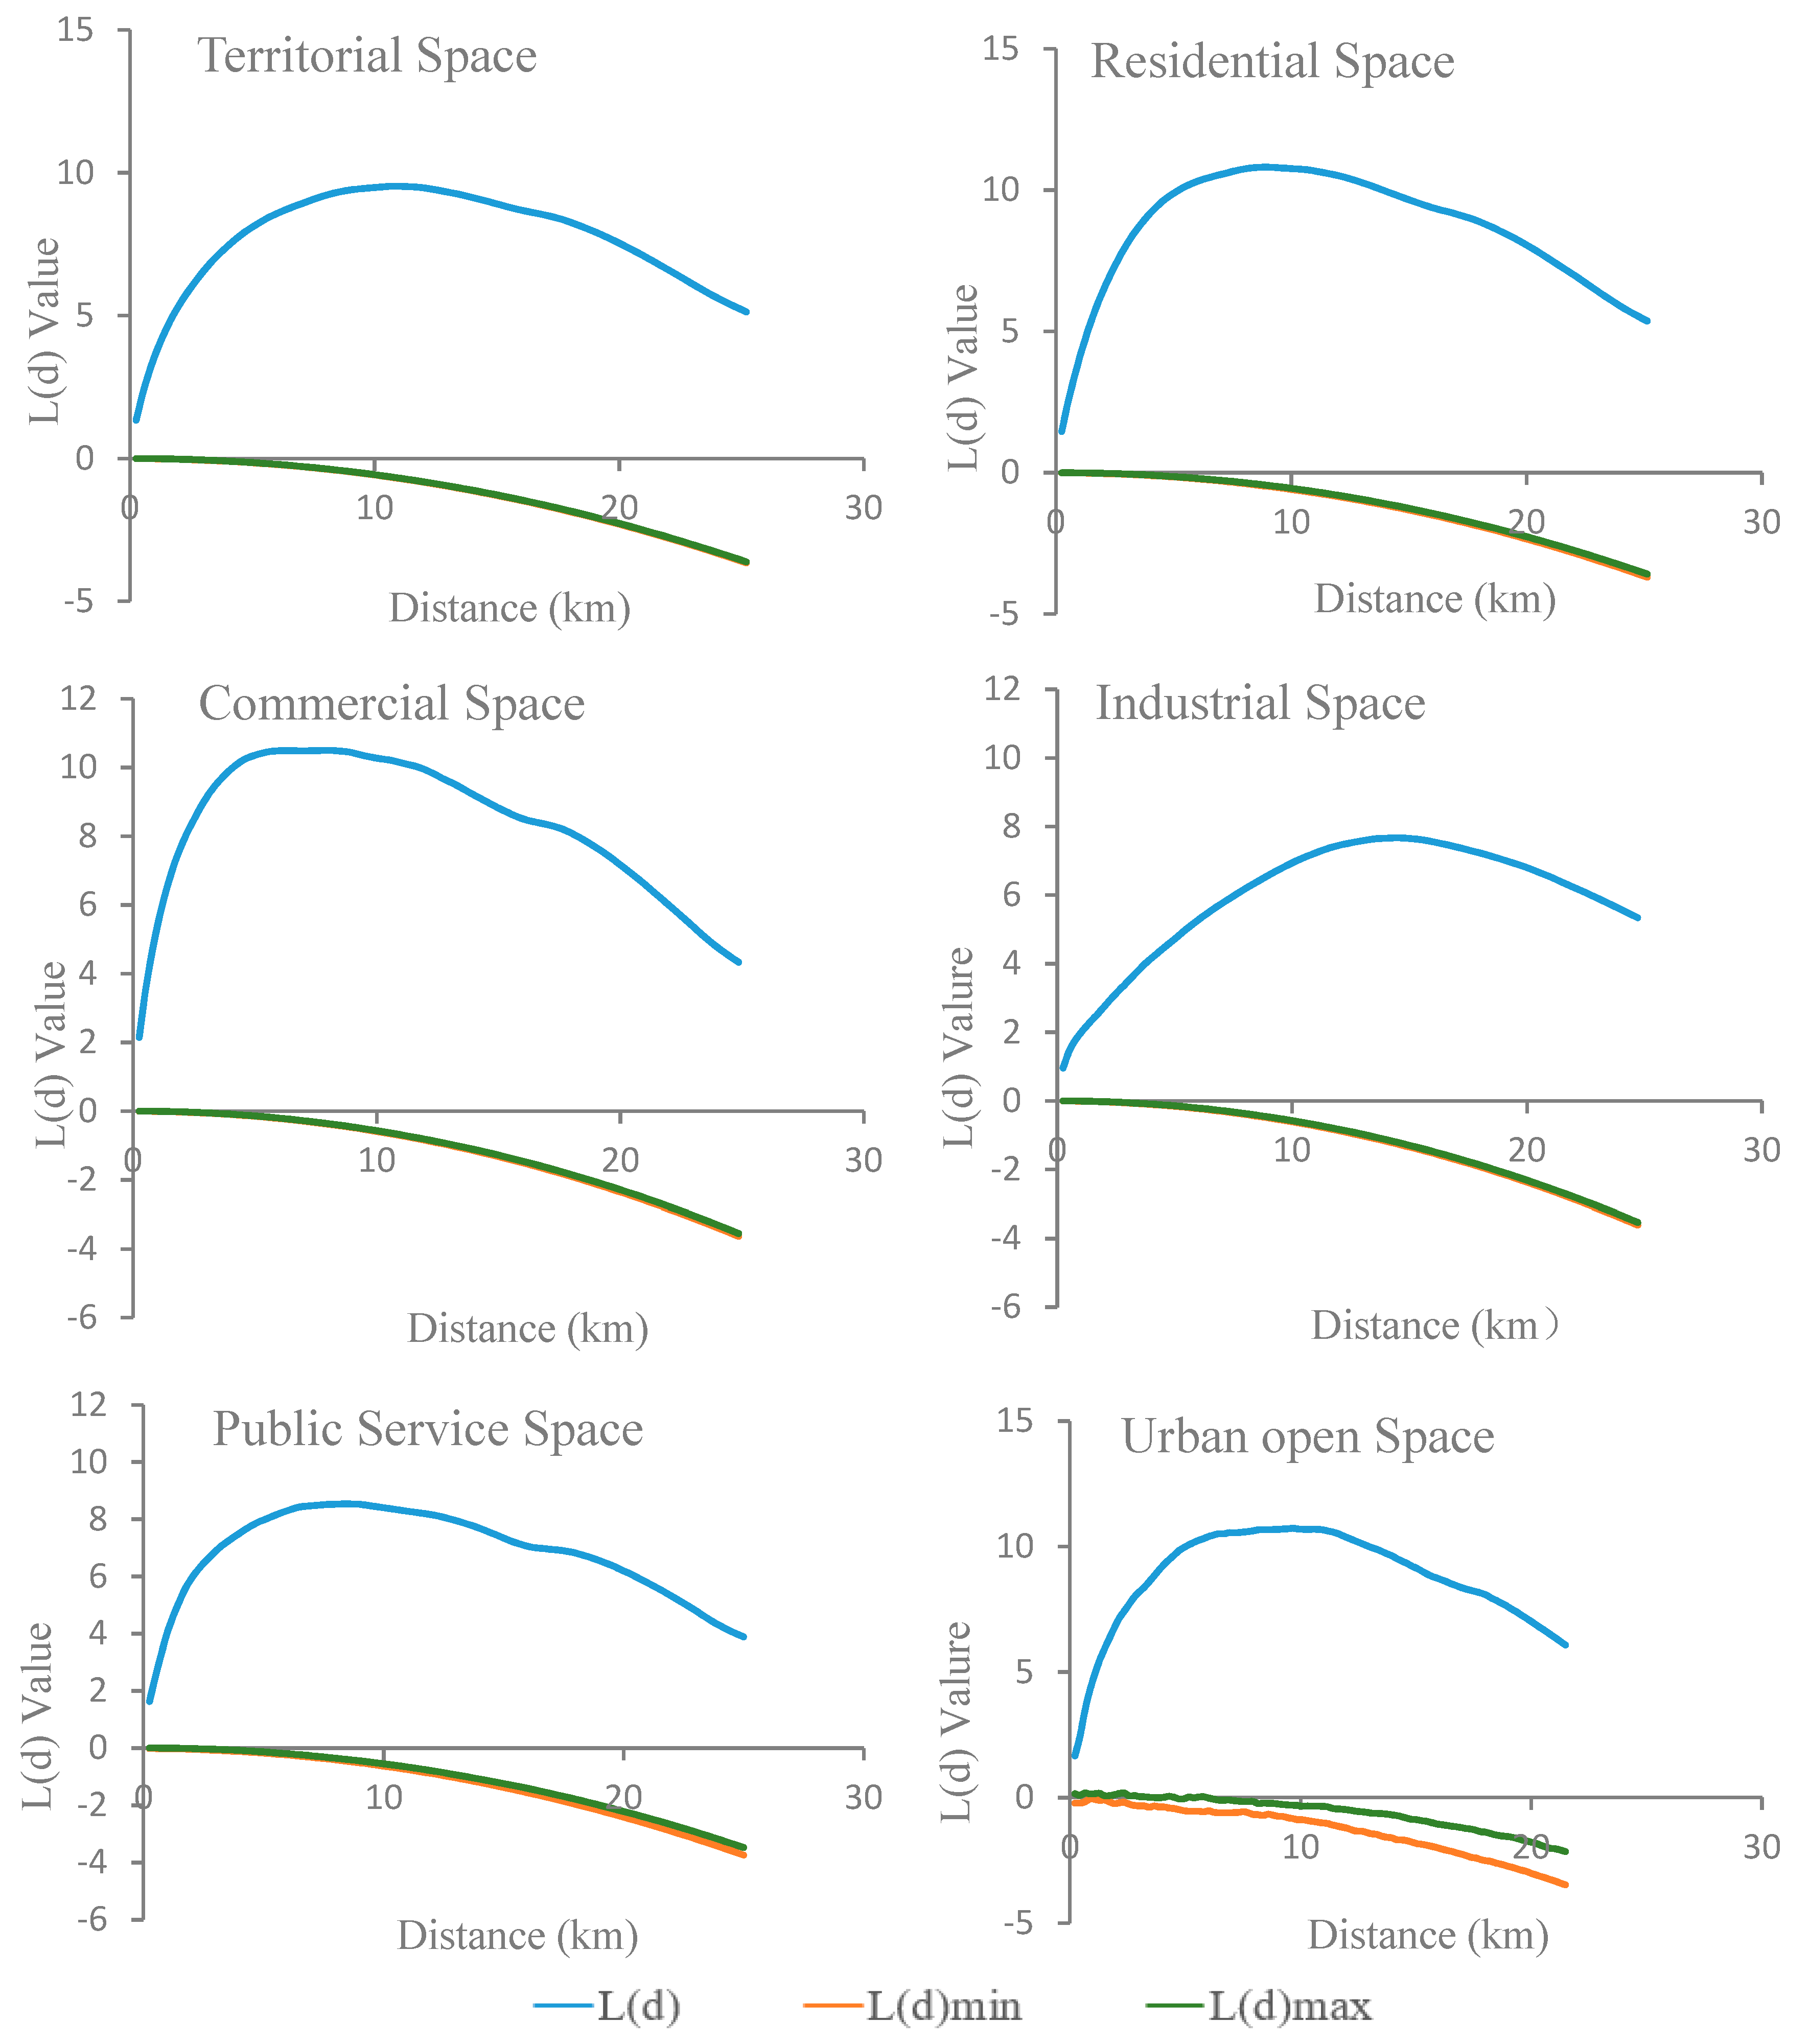
Whether the intensity of territorial spatial agglomeration in Ningbo will be affected by the spatial scale effect, this paper uses Ripley’s K function to verify it. The results are shown in Figure 3. The L(d) curve of the territorial space in Ningbo is located above the envelope, and the L(d) value is greater than 0 among 0–12 distance units. It has significant characteristics of spatial agglomeration, and the L(d) peak value increases first and then decreases with the change of geographical distance. The L(d) curve of each type of space shows an inverted “U” structure with a rise and fall, and the agglomeration trend is consistent with the overall territorial space. However, the spatial scales and corresponding L(d) peak values of different types of spatial agglomeration are significantly different. The L(d) peak values of residential space, commercial space, industrial space, public service space and urban open space appear at 8.99 km, 7.67 km, 14.33 km, 8.54 km and 9.67 km respectively. Among them, the spatial scale of commercial space agglomeration is the smallest. Commercial space is expected to have a higher rent, so the range of location selection is always in the nearest place to the city center; while industrial space is agglomerated in a larger space, and the range of location selection is the largest.
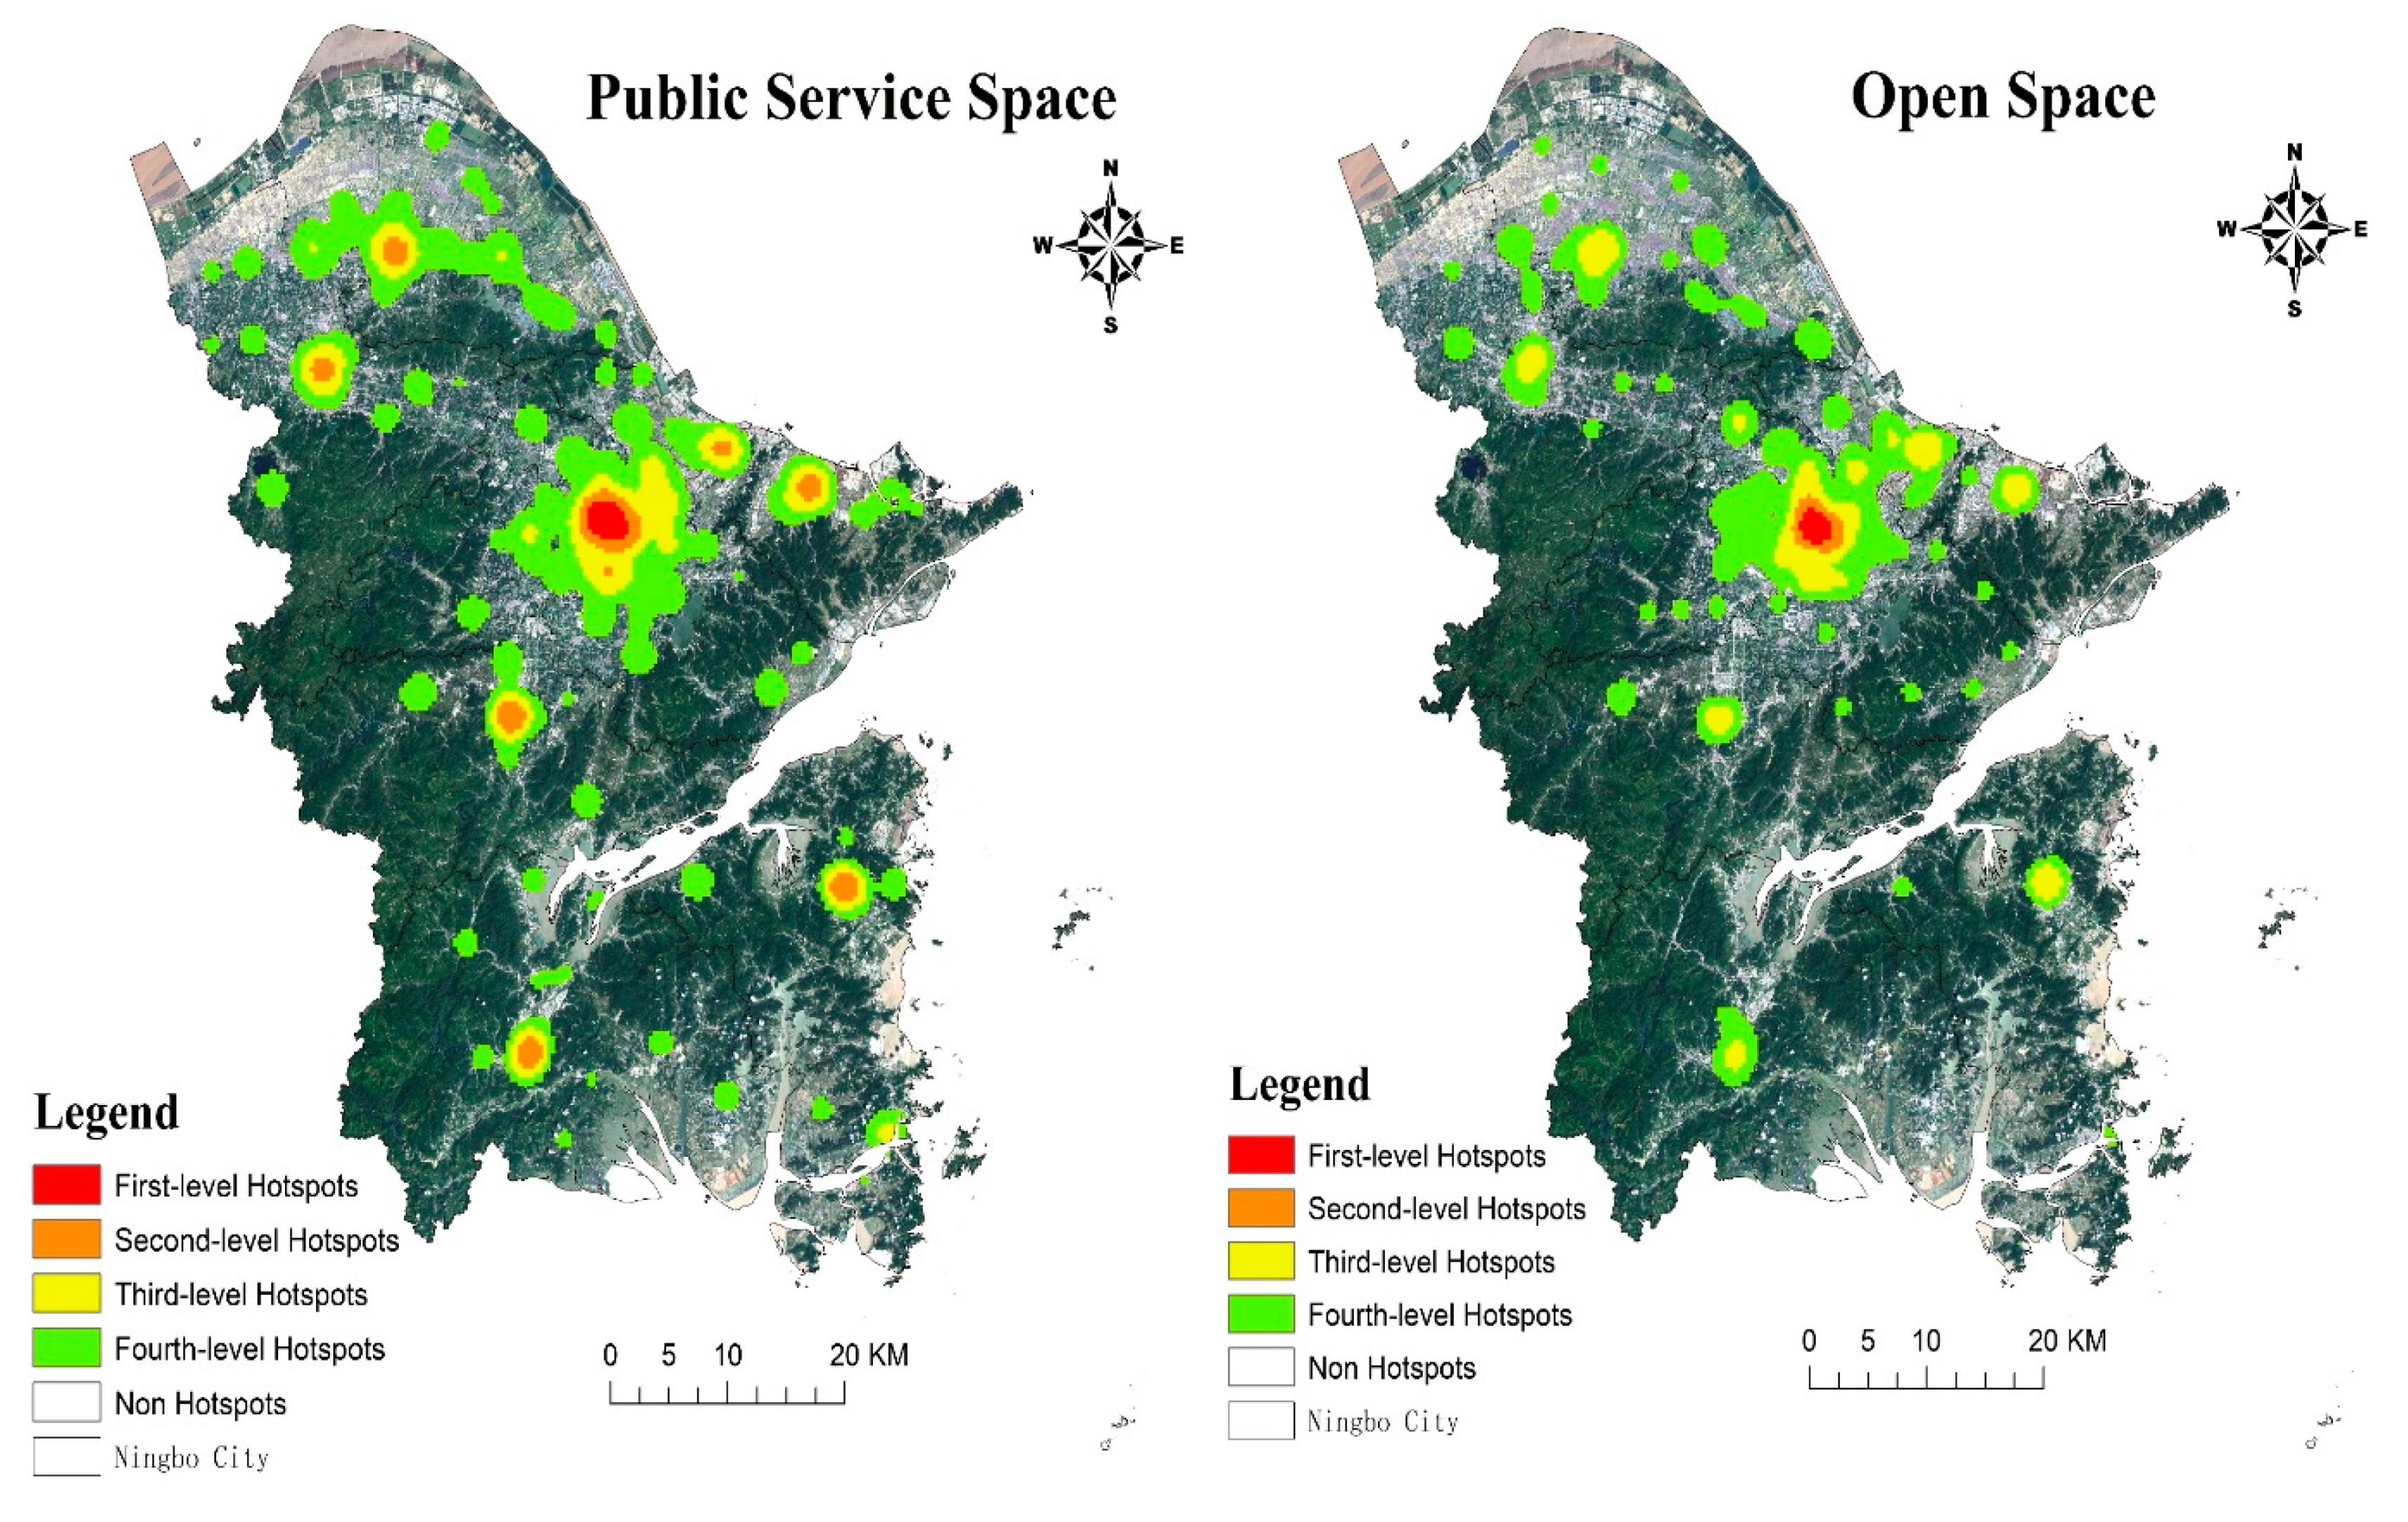
3.4. Hotspots Identification of Territorial Spatial Agglomeration Based on KDE
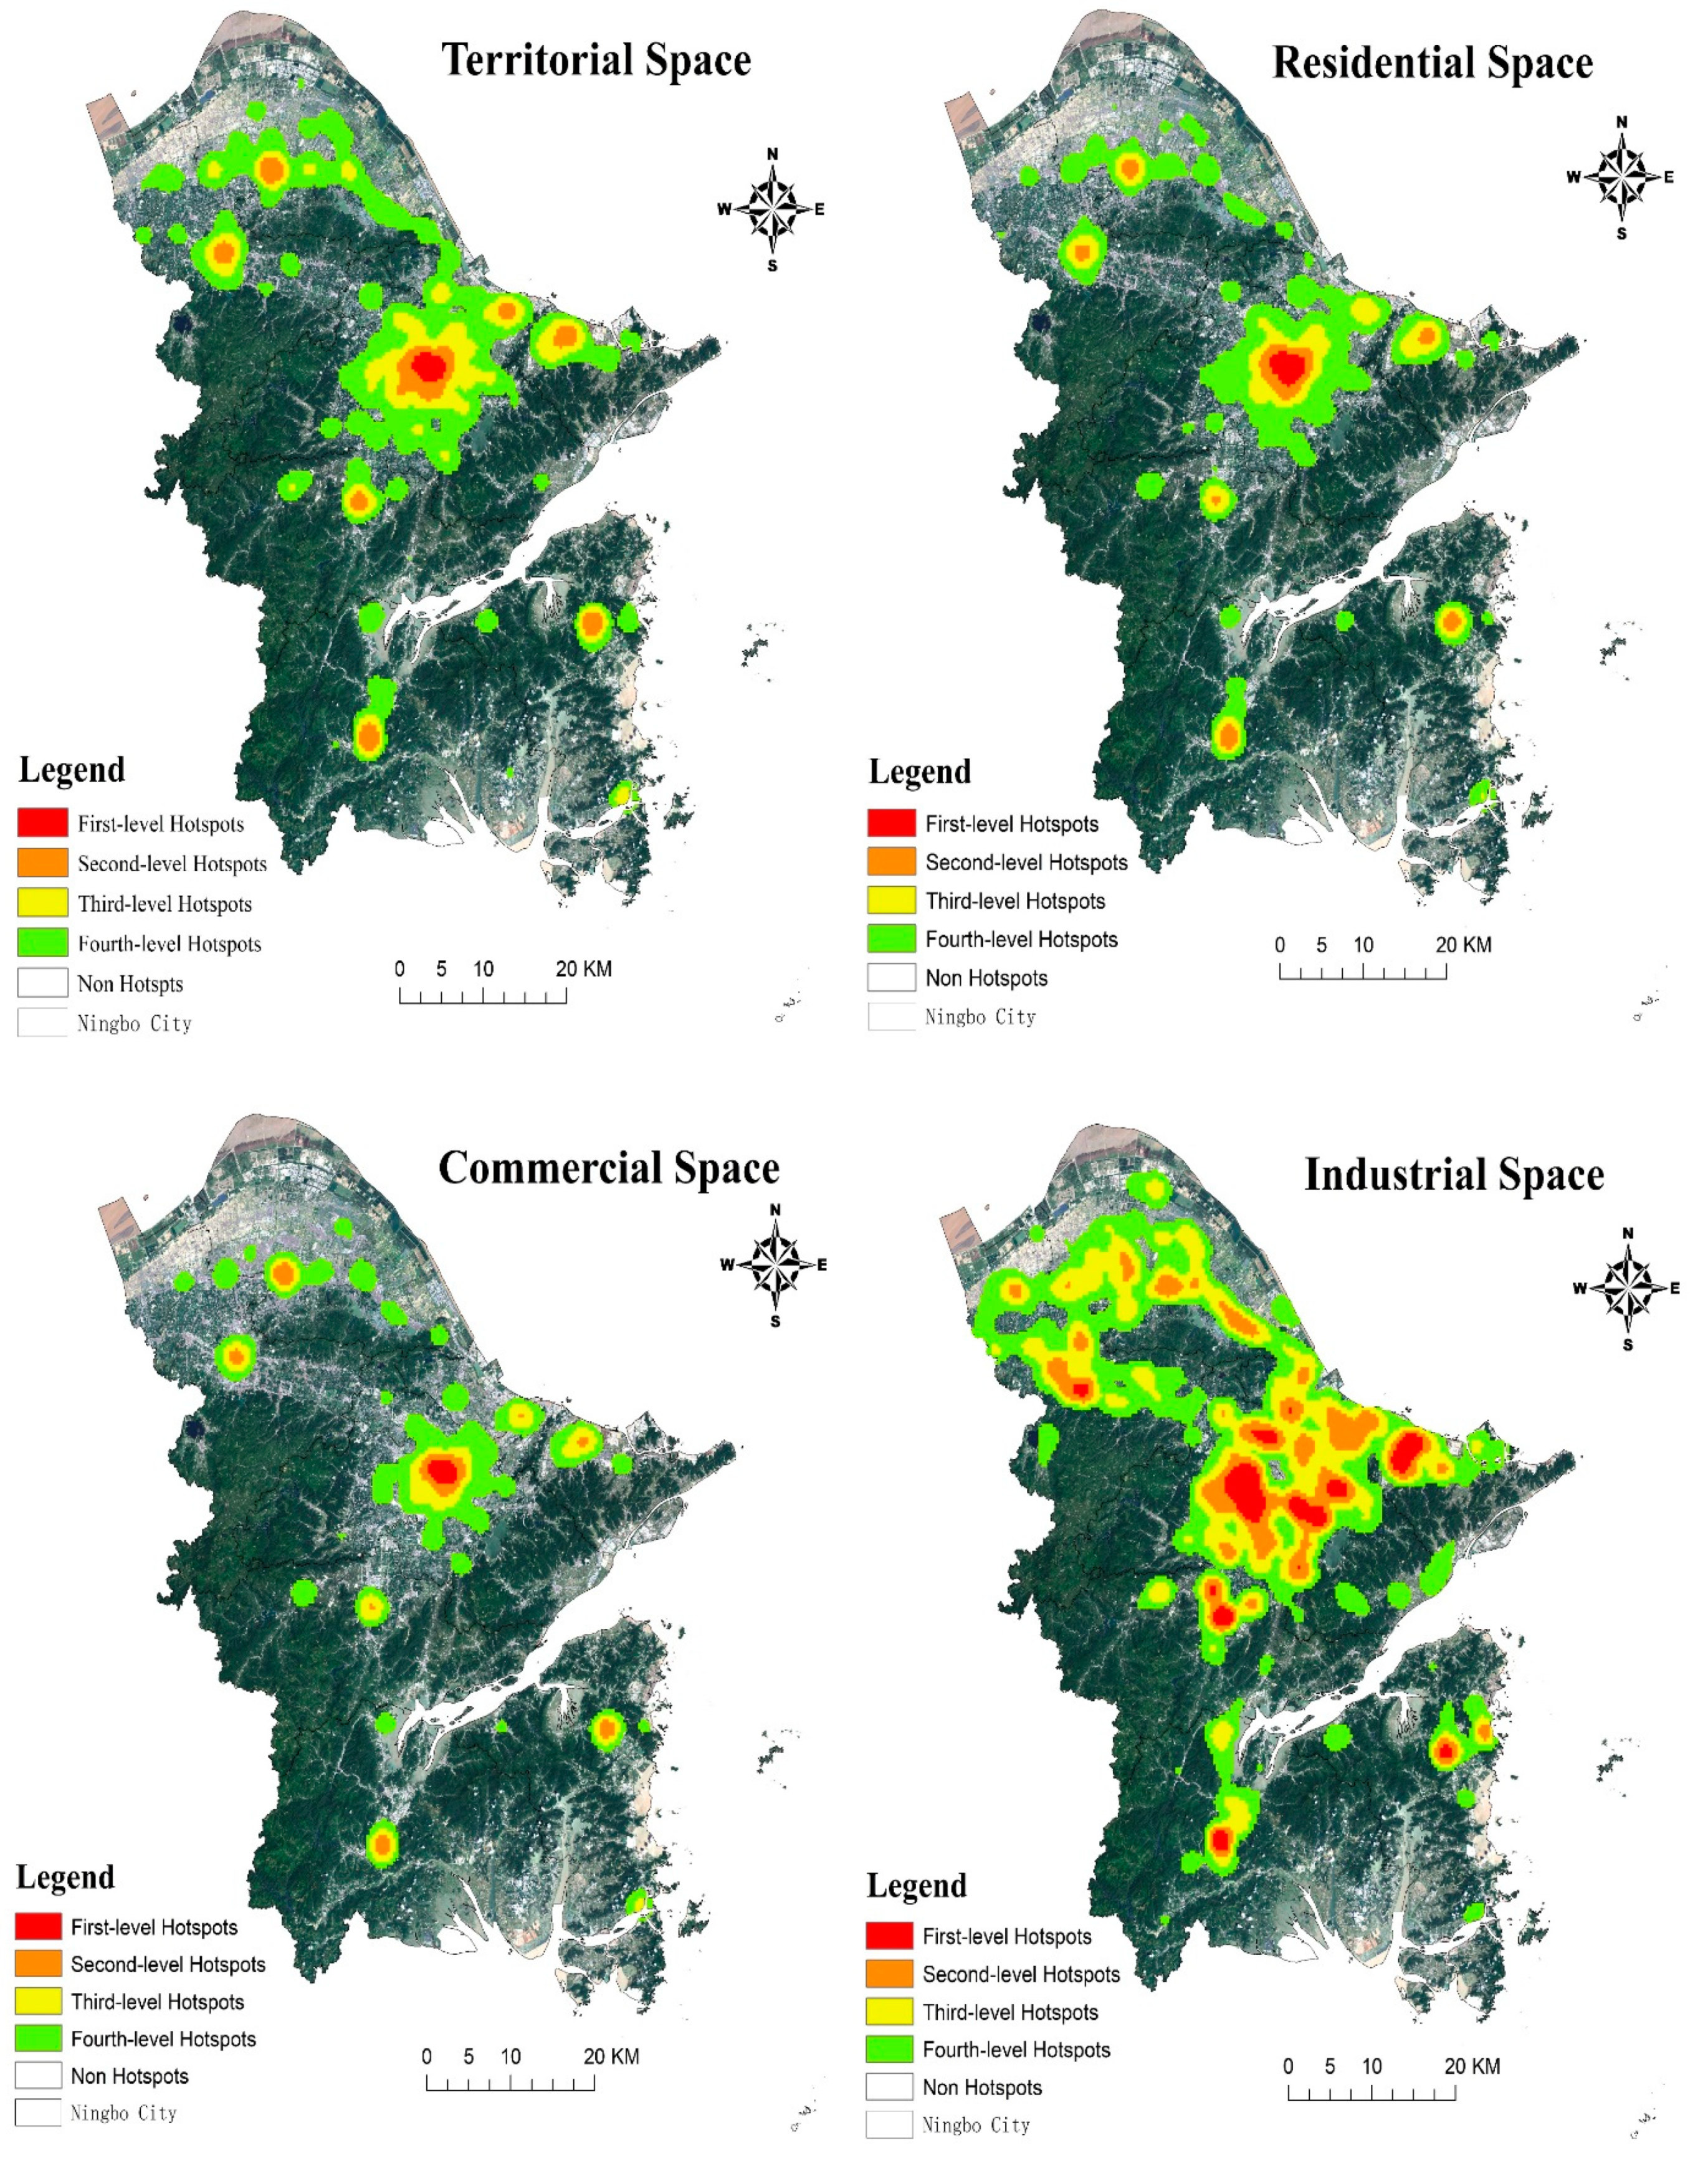
In this paper, the KDE method is further applied, and superimposes remote sensing image map (image time is 24 August 2016) to identify the spatial distribution pattern of territorial spatial agglomeration hotspots in Ningbo. The KDE is classified by the natural discontinuous point method (Jenks). The higher the density value, the higher the level of territorial spatial agglomeration, and vice versa. Finally, it is divided into four levels of agglomeration hotspots, and the results are shown in Figure 4. The first-level agglomeration hotspots are concentrated in the central area of Sanjiangkou. The specific distribution ranges from Jiangxia, Gulou, Yuehu Street in Haishu District, Zhongma Street in Jiangbei District, Baizhang, Baihe, Dongsheng and Minghou Street in Yinzhou District. The second-level agglomeration hotspots are distributed in the outskirts of Sanjiangkou, Zhaobaoshan Street in Zhenhai District, Xindan Street in Beilun District, Manping and Yuelin Street in Fenghua District, and the main urban and central towns in suburban counties and cities. The spatial distribution of third-level agglomeration hotspots is characterized by “large agglomeration and small dispersion”, not only on the edge of the second-level agglomeration hotspots, but also in Zhenhai, Yinzhou, Fenghua, Cixi and Xiangshan. The four-level agglomeration hotspots have a wide distribution range. Except for the Fenghua District, there are contiguous distributions in other areas; an axial agglomeration zone is formed between Zhenhai District and Cixi City. Overall, the level of agglomeration is decreasing with the increase of geographical distance with Sanjiangkou as the center, showing a clear law of distance attenuation. The distribution characteristics are “river-oriented” and “sea-oriented”. From this, we can see that the locking effect of a single center is still significantly higher than the evacuation “magnetic force” of multiple centers in Ningbo city.
In terms of classification, the distribution of agglomeration hotspots in residential space and commercial space is consistent with the overall distribution pattern of territorial space. The agglomeration hotspots in all levels still spread out as the core of Sanjiangkou, showing an obvious “central-periphery” distribution. The first-level agglomeration hotspots of industrial space are mainly concentrated in the periphery of Sanjiangkou, while the other-level agglomeration hotspots are concentrated in the city center, Yuyao and Cixi, respectively. Moreover, there are two axial agglomeration zones between Yuyao, Cixi and the central city. At the same time, the fourth-level agglomeration hotspots are scattered in the Cixi Binhai Economic Development Zone and the Zhangzhou Economic Development Zone. The overall distribution of agglomeration hotspots in public service space and open space is characterized by “large agglomeration and large dispersion”, with the core of Sanjiangkou in a patchy agglomeration and scattered in each county and urban area.
4. Discussion
4.1. Comparisons with Traditional Research
The concept of land and space combines the two concepts of “territorial” and “space”, with the dual attributes of “resources” and “space” [43]. In the past, land use research survey data and socio-economic data were mostly used in territorial space research [44,45], which paid more attention to the resource attributes of territorial space, but neglected its spatial attributes. In this study, based on multi-type POI data, and the method of SDE, NNI, Ripley’s K function and KDE were used to explore the characteristics of spatial distribution, agglomeration degree, spatial scale effect and agglomeration hotspot distribution of Ningbo. The research results show that the multi-method comprehensive analysis based on big data can better describe the spatial attributes of territorial resources utilization. Taking Ningbo as an example, the empirical study objectively and comprehensively shows the agglomeration characteristics of Ningbo’s territorial space, which provides indispensable reference information for the territorial space planning that the city is preparing.
4.2. Agglomeration Promotes Regional Coordinated Development
The city is the focal point of the regional economy and the regional center. The main driving force for urban development is the function of the city to provide products and services to areas outside the urban area [46]. In essence, the territorial spatial agglomeration is to strengthen the regional core functions of cities and central towns through the agglomeration of economic benefits and economies of scale, to exert its market and radiation functions, to promote the economic development of the surrounding countryside, and to give full play to the unique advantages of each place. Then promote regional coordinated development [2]. According to the study, from the perspective of the metropolitan area, it reveals the economic ties between the central suburbs of Ningbo, including Yuyao, Cixi, Ninghai and Xiangshan, and highlights the status of the city’s central urban area and the scope of space construction. In order to avoid the phenomenon of industrial structure convergence, market segmentation, resource competition and mutual restriction on development, we should pay attention to the reasonable division of labor among counties and urban areas, establish and improve the regional urban system through regional coordination and overall planning.
4.3. Differentiation of Agglomeration Effect under Spatial Competition
Different from agricultural land use, location factor is crucial to urban land use, and the spatial competition of urban land use is particularly fierce. In addition, the area factor has a relatively weak limiting effect on urban land use, which amplifies the difference of spatial agglomeration effect of urban land use to some extent. Furthermore, it is not difficult to infer that the spatial competitiveness is positively correlated with the degree of agglomeration based on the law that the land rent level of various types of urban land decreases with the distance [47]. Specifically, commercial space is the most sensitive to location, with the strongest spatial competitiveness, and the degree of agglomeration is significantly higher than other types of territorial space. As a supplement to residents’ life, the urban open space has the weakest spatial competitiveness and the lowest degree of agglomeration. Compared with urban open space, public service space has a greater impact on urban development. A large amount of infrastructure construction investment by the municipal government helps to improve its spatial competitiveness [48], which makes the concentration of public service space slightly higher than that of urban open space. Industrial space and residential space have little difference in agglomeration degree, which is between commercial space and public service space. It should be noted that the agglomeration degree of industrial space is slightly higher than that of residential space. This may be because Ningbo’s industry is developed, the government pays more attention to industrial land, and the superposition effect of various preferential policies has made the industrial space location advantage prominent, and the agglomeration effect is relatively better. This is where Ningbo is doing better than other industrial cities [49,50]. Of course, this also reflects that the residential space pattern related to the basic quality of residents’ life of the city needs to be optimized to increase the degree of concentration further.
4.4. Limitations and Future Research
The study of territorial spatial agglomeration is the basis for optimizing the pattern of territorial space and enhancing the overall competitiveness of the country. Based on POI data and point pattern spatial analysis, this paper can better reflect the characteristics of territorial spatial agglomeration, but there are still some limitations, which need to be further studied. Firstly, territorial space is a complex giant system, and its pattern is a dynamic process of evolution with specific temporal and spatial attributes. Its shape and state show different characteristics in space-time scale [51]. In this paper, only the cross-section data is used to analyze the agglomeration characteristics of the territorial space, which fails to comprehensively and systematically reflect the dynamic evolution process of territorial spatial agglomeration pattern. Secondly, the analysis of the characteristics of territorial spatial agglomeration in this paper is more of a result study than a discussion of its causes, that is, the analysis of the influencing mechanism of territorial spatial agglomeration. In the future research on the mechanism of agglomeration, it is inevitable to explain the two main causes of agglomeration: The first nature (geography) and the second nature (human agglomeration economy) [52,53].
5. Conclusions
It can be seen from the above studies that the spatial distribution pattern, agglomeration degree, spatial scale and agglomeration hotspot distribution of territorial space in Ningbo have the following characteristics:
- The overall distribution pattern of the territorial space is characterized by “dense middle and sparse edge”. The distribution trend is along the “northwest to southeast” direction, with significant directionality, and the spatial distribution of each type is quite different. The SDE of residential and commercial space is more consistent with the overall appearance of territorial space. The distribution center of SDE of industrial space is obviously northward, and the spreading range of SDE in public service space is the largest, while the urban open space is on the contrary.
- The results of NNI show that the entire territorial space presents spatial agglomeration, and the agglomeration characteristics of the commercial space are more significant. Moreover, the spatial distribution of residential, industrial and public service space is relatively agglomerative, while the agglomeration degree of the Urban open space is relatively weak.
- Ripley’s K function analysis verifies that there was scale effect in territorial spatial agglomeration, with the decline of the geographical distance, and the trend of territorial spatial agglomeration presents an inverted “U” structure. However, the spatial scale and corresponding L(d) peak value of different types of spatial agglomeration are significantly different. Commercial space is expected to have a higher rent, so the spatial scale of commercial spatial agglomeration is the smallest; while industrial space is agglomerated in a larger space, and the range of location selection is also the largest.
- The distribution of agglomeration hotspots in Ningbo is spread from the core of Sanjiangkou to the periphery. The spatial distribution of hotspots at different levels shows obvious distance attenuation rule. The overall distribution characteristics are “river-oriented” and “sea-oriented”, and the locking effect of a single center is still significantly higher than the evacuation “magnetic force” of multiple centers in Ningbo city. It is worth noting that the agglomeration hotspots of industrial space are mainly distributed in a concentrated contiguous pattern around Sanjiangkou, two axial agglomeration hotspots are formed between Yuyao, Cixi and the central city. In the future, we should effectively disperse the densely clustered areas in the central urban area, and focus on cultivating peripheral sub-centers/groups to enhance the positive interaction between multiple centers.
Author Contributions
C.H. conceived this study and wrote the original manuscript. Y.J. (Yuqiu Jia) contributed analysis tools. Y.J. (Yaya Jin) contributed to the resource. W.L. reviewed and edited the pater. All authors have read and approved the final manuscript.
Funding
This research was funded by the Special Research Projects of Liberal Arts at Zhejiang University (126000-541903/063).
Conflicts of Interest
The authors declare no conflict of interest.
References
- National Main Functional Area Planning—Building an Efficient, Coordinated and Sustainable Land and Space Development Pattern. Available online: http://www.gov.cn/zhengce/content/2011-06/08/content_1441.htm (accessed on 8 June 2011).
- Yu, F.; Zhang, L.J.; Ma, Y.H.; Fu, R. Strategic Options for Chinese National Land Space Development: Agglomeration Development and Regional Development. Land Res. 2014, 50–56. [Google Scholar]
- National Territory Planning Outline (2016–2030). Available online: http://www.gov.cn/zhengce/content/2017-02/04/content_5165309.htm (accessed on 4 February 2017).
- Krugman, P. Increasing Returns and Economic Geography. J. Polit. Econ. 1991, 99, 483–499. [Google Scholar] [CrossRef]
- Fan, C.C.; Scott, A.J. Industrial Agglomeration and Development: A Survey of Spatial Economic Issues in East Asia and a Statistical Analysis of Chinese Regions. Econ. Geog. 2003, 79, 295–319. [Google Scholar] [CrossRef]
- Cainelli, G.; Iacobucci, D.; Morganti, E. Spatial agglomeration and business groups: New evidence from Italian industrial districts. Reg. Stud. 2006, 40, 507–518. [Google Scholar] [CrossRef] [Green Version]
- Vogiatzoglou, K.; Tskeris, T. Spatial Agglomeration of Manufacturing in Greece: Sectoral Patterns and Determinants. Eur. Plan. Stud. 2013, 21, 1853–1872. [Google Scholar] [CrossRef]
- Majewska, J. Inter-regional agglomeration effects in tourism in Poland. Tourism. Geog. 2015, 17, 408–436. [Google Scholar] [CrossRef]
- Shen, N.; Zhao, Y.Q.; Wang, Q.W. Diversified Agglomeration, Specialized Agglomeration, and Emission Reduction Effect—A Nonlinear Test Based on Chinese City Data. Sustainability 2018, 10, 2002. [Google Scholar] [CrossRef]
- European Commission. First Report on Economic and Social Cohesion; Office for Official Publications of European Communities: Luxembourg, 1996.
- Chasco, C.; Lopez, A.; Guillain, R. The Influence of Geography on the Spatial Agglomeration of Production in the European Union. Spat. Econ. Anal. 2012, 7, 247–263. [Google Scholar] [CrossRef] [Green Version]
- Gerritse, M.; Arribas-Bel, D. Concrete agglomeration benefits: Do roads improve urban connections or just attract more people? Reg. Stud. 2017, 52, 1134–1149. [Google Scholar] [CrossRef]
- Ruhiiga, T.M. Growth of Urban Agglomeration Nodes in Eastern Africa. J. Hum. Ecol. 2013, 41, 237–246. [Google Scholar] [CrossRef]
- Ouyang, H. Further Optimizing the Policy Direction of Territorial Spatial Development Pattern. Sci. Macro Man 2012, 35–37, 43. [Google Scholar] [CrossRef]
- Fan, J.; Zhou, K.; Chen, D. Innovation and Practice of Economic Geography for Optimizing Spatial Development Pattern in Construction of Ecological Civilization. Econ. Georg. 2012, 33, 1–8. [Google Scholar]
- Fan, J. Theoretical Innovation in Optimization of Protection and Development of China’s Territorial Space and Coping Strategy of 13th Five-Year Plan. Bull. China Acad. Sci. 2016, 31, 1–12. [Google Scholar]
- Jin, G.; Wang, Z.Q.; Yao, X.W.; Yang, J. Concept and Methods for Spatial Zoning. China Land Sci. 2013, 27, 48–53. [Google Scholar]
- Nian, P.H.; Cai, Y.M.; Zhang, W.X.; Ma, S.F.; Zhuang, L. Geographic Entity Division and Functions Identification Oriented Comprehensive Regionalization. Econ. Georg. 2014, 34, 7–14. [Google Scholar]
- Xu, L.; Dong, J.; Li, L.; Zhang, J. Characteristics and Optimization of Geographical Space in Urban Agglomeration in the Middle Reaches of the Yangtze River Based on the Function Zoning. Econ. Georg. 2017, 37, 76–83. [Google Scholar]
- Liu, J.L.; Liu, Y.S.; Li, Y.R. Classification evaluation and spatial-temporal analysis of “production-living-ecological” spaces in China. Acta Geogr. Sin. 2017, 72, 1290–1304. [Google Scholar]
- Wu, Y.J.; Yang, Y.Z.; Yang, L.; Zhang, C.; You, Z. Land spatial development and suitability for city construction based on ecological-livinFg-industrial space—Take Ningbo City as an example. Resour. Sci. 2016, 38, 2072–2081. [Google Scholar]
- Li, T.; Liao, H.P.; Pan, Z.; Li, J.; Yang, W.; Pan, M.H. Evaluation of Efficiency Differentiation in Land Spatial Development and Utilization of Major Functional Areas Based on DEA Model—A Case Study of Chongqing City. Econ. Georg. 2015, 35, 157–164. [Google Scholar]
- Li, Q.Y.; Fang, C.L.; Wang, S.J. Evaluation of Territorial Utilization Quality in China: Based on the Aspect of Production-Living-Ecological Space. Areal Res. Dev. 2016, 35, 163–169. [Google Scholar]
- Zhou, Y.G.; Guo, Z.D. GIS-based study on spatial structure of urban greenbelt landscapes: Taking Ningbo City as an example. Acta Ecol. Sin. 2003, 23, 901–907. [Google Scholar]
- Lv, X.F.; Wang, Y.L.; Feng, J.; Wu, J.S. Spatial Concentration Characteristics of Urban Land Use along Highways in Rapidly Urbanized Region of Shenzhen. Acta Geogr. Sin. 2008, 63, 845–855. [Google Scholar]
- Wu, Y.Y. The Dynamic Mechanism and Evaluation of Land Spatial Agglomeration Development—A Case Study of Wenzhou City; Zhejiang University: Hangzhou, China, 2017. [Google Scholar]
- Wang, Y.Z.; Jin, X.L.; Chen, X.Q. Network Big Data: Present and Future. Chin. J. Comp. 2013, 36, 1125–1138. [Google Scholar] [CrossRef]
- Niu, F.Q.; Liu, W.D. Identifying the Hierarchical Regional Spatial Structure Using Internet Big Data. J. Geo-Inf. Sci. 2016, 18, 719–726. [Google Scholar]
- Xu, Z.N.; Gao, X.L. A novel method for identifying the boundary of urban built-up areas with POI data. Acta Geogr. Sin. 2016, 71, 928–939. [Google Scholar]
- Yu, W.H.; Ai, T.H. The Visualization and Analysis of POI Features under Network Space Supported by Kernel Density Estimation. Acta Geogr. Cart. Sin. 2015, 44, 82–90. [Google Scholar]
- Chi, J.; Jiao, L.M.; Dong, T.; Gu, Y.Y.; Ma, Y.L. Quantitative Identification and Visualization of Urban Functional Area Based on POI. J. Geom. 2016, 41, 68–73. [Google Scholar]
- Guo, J.; Lv, Y.Q.; Shen, T.Y. Urban Spatial Structure Based on Point Pattern Analysis—Taking Beijing Metropolitan Area as a Case. Econ. Georg. 2015, 35, 68–74, 97. [Google Scholar]
- Zhang, J.Q.; Chen, X.D.; Xiu, C.L. Study on the Measurement of Urban Sprawl based on the POI Data: A Case of Shenyang City, China. China Land Sci. 2019, 33, 93–102. [Google Scholar]
- Chen, W.S.; Liu, L.; Liang, Y.T. Retail center recognition and spatial aggregating feature analysis of retail formats in Guangzhou based on POI data. Geog. Res. 2016, 35, 703–716. [Google Scholar]
- Xue, B.; Xiao, X.; Li, J.Z.; Jiang, L.; Xie, X. POI-Based Analysis on Retail’s Spatial Hot Blocks at a City Level: A Case Study of Shenyang, China. Econ. Georg. 2018, 38, 36–43. [Google Scholar]
- Duan, Y.M.; Liu, Y.; Liu, X.H.; Wang, H.L. Identification of Polycentric Urban Structure of Central Chongqing Using Points of Interest Big Data. J. Nat. Resour. 2018, 33, 788–800. [Google Scholar]
- Zhang, L. Research on POI Classification Standard. Bull. Sur. Map. 2012, 82–84. [Google Scholar]
- Lefever, D.W. Measuring geographic concentration by means of the standard deviational ellipse. Am. J. Sociol. 1926, 32, 88–94. [Google Scholar] [CrossRef]
- Zhao, L.; Zhao, Z.Q. Projecting the Spatial Variation of Economic Based on the Specific Ellipses in China. Sci. Geog. Sin. 2014, 34, 979–986. [Google Scholar]
- Wang, J.F.; Liao, Y.L.; Liu, X. Spatial Data Analysis Course; Science Press: Beijing, China, 2010; pp. 1–2. [Google Scholar]
- Besag, J. Contribution to the discussion of Dr. Ripley’s paper. J. R. Stat. Soc. 1977, 39, 93–195. [Google Scholar]
- Heidenreich, N.B.; Schindler, A.; Sperlich, S. Bandwidth selection for kernel density estimation: A review of fully automatic selectors. AStA 2013, 97, 403–433. [Google Scholar] [CrossRef]
- Lin, J.; Liu, S.X.; Liu, S.Y. Region-Element Coordination: The Critical Issue Concerning the Construction of the System for Developing and Protecting Territorial Space. China Land Sci. 2018, 32, 1–7. [Google Scholar]
- Fu, J.; Tan, X.J.; Gong, P.; Zhang, R.J. Spatial Structure and Its Future Order of National Land-use According to Major Function Oriented Zoning in Beijing. China J. Pop. Resour. Environ. 2011, 21, 20–27. [Google Scholar]
- Sun, J.W.; Nian, M. The evolution of the Spatial Pattern of Land Development since the Establishment of the P. R. China: A perspective of regional economic changes. Dongyue Tri. 2011, 32, 30–36. [Google Scholar]
- Liu, W.D.; Peng, J. Sustainable Development of Urbanization in China. Sci. Technol. Rev. 1997, 58–61. [Google Scholar]
- Ding, C.R. Urban Spatial Planning: Theory, Method and Practice; Higher Education Press: Beijing, China, 2007; pp. 50–51. [Google Scholar]
- Zhan, D.S.; Zhang, W.Z.; Dang, Y.X.; Yu, X.F.; Wu, Q.Q. Spatial Clustering Analysis of Public Service Facilities in Beijing. Econ. Georg. 2018, 38, 76–82. [Google Scholar]
- Qin, Z.Q.; Guo, W.J. The Spatial Agglomeration Evolution of Coal Industries and Its Driving Mechanism in Shanxi Province. Acta Geogr. Sin. 2018, 38, 1535–1542. [Google Scholar]
- Jiang, Q.O.; Sun, S.Y.; Wang, C.L.; Shao, Y.Q.; Wang, M.L.; Nie, C.J. Study on characteristics of spatial agglomeration and spatial correlation of industrial land in Jiayuguan city. Trans. Chin. Soc. Agric. Eng. 2018, 34, 274–282. [Google Scholar]
- Lin, Y.L.; Zhao, J.S.; Zhang, M.; Chen, G.P. Identification of Territory Space Pattern and Spatial-temporal Evolution Analysis of Urban Agglomeration in Central Yunnan. Trans. Chin. Soc. Agric. Eng. 2019, 50, 176–191. [Google Scholar]
- Krugman, P. First nature, second nature, and metropolitan location. J. Reg. Sci. 1993, 33, 129–144. [Google Scholar] [CrossRef]
- Nugent, W. Nature’s Metropolis: Chicago and the Great West, by William Cronon. J. Econ. His. 1992, 52, 530–540. [Google Scholar]
Figure 1.
Location of Ningbo city.

Figure 2.
Standard deviational ellipse (SDE) of territorial spatial distribution in Ningbo city.

Figure 3.
Ripley’s K function of territorial spatial distribution in Ningbo city.

Figure 4.
Kernel density estimation (KDE) of territorial spatial distribution in Ningbo city.


Table 1.
Classification of point of interest (POI) data in Ningbo city.
| Territorial Space Categories | Types of POI Contained | Quantity (pcs) | Proportion (%) |
|---|---|---|---|
| Residential Space | Residential district and supporting living service facilities, such as kindergarten, nursery, health station, convenience shop, catering, post and telecommunications office, neighborhood committee, etc. | 15593 | 18.91 |
| Commercial Space | (1) Commercial category: Retail, wholesale market, catering, hotel; (2) Business category: Financial insurance, business building; (3) Entertainment category: Theatre, cinema, Internet café, etc. | 37504 | 45.49 |
| Industrial Space | Manufacturing companies, factories, industrial parks | 24840 | 30.13 |
| Public service Space | (1) Administrative office: Party and government organs, social organizations, institutions, etc.; (2) Educational and scientific research: Institutions of higher learning, technical secondary schools, primary and secondary schools, scientific research institutions, etc.; (3) Medical services: Medical, health, epidemic prevention, rehabilitation and first aid facilities, etc.; (4) Sports facilities: Stadiums, swimming venues, all kinds of stadiums, etc. | 4277 | 5.19 |
| Urban open space | Park, square | 239 | 0.29 |
| Total | Residential, commercial, industrial, public service and urban open space | 82453 | 100.00 |
Table 2.
Nearest neighbor index (NNI) of territorial spatial distribution in Ningbo city.
| Territorial Space Categories | Sample Size (pcs) | Average Distance of Observation (m) | Expected Average Distance (m) | Nearest Neighbor Index (NNI) | Z Test Value | p Value | Spatial Distribution Types |
|---|---|---|---|---|---|---|---|
| Residential Space | 15593 | 117.57 | 480.73 | 0.24 | −180.47 | 0.00 | Comparative agglomeration |
| Commercial Space | 37504 | 36.88 | 306.46 | 0.12 | −325.9 | 0.00 | Significant agglomeration |
| Industrial Space | 24840 | 86.63 | 369.05 | 0.23 | −230.74 | 0.00 | Comparative agglomeration |
| Public service Space | 4277 | 240.48 | 905.64 | 0.27 | −91.89 | 0.00 | Comparative agglomeration |
| Urban open space | 239 | 1516.73 | 2994.93 | 0.51 | −14.6 | 0.00 | General agglomeration |
| Total | 82453 | 42.79 | 209.2 | 0.2 | −436.97 | 0.00 | Comparative agglomeration |
© 2019 by the authors. Licensee MDPI, Basel, Switzerland. This article is an open access article distributed under the terms and conditions of the Creative Commons Attribution (CC BY) license (http://creativecommons.org/licenses/by/4.0/).
Share and Cite
MDPI and ACS Style
Hu, C.; Liu, W.; Jia, Y.; Jin, Y. Characterization of Territorial Spatial Agglomeration Based on POI Data: A Case Study of Ningbo City, China. Sustainability 2019, 11, 5083. https://0-doi-org.brum.beds.ac.uk/10.3390/su11185083
AMA Style
Hu C, Liu W, Jia Y, Jin Y. Characterization of Territorial Spatial Agglomeration Based on POI Data: A Case Study of Ningbo City, China. Sustainability. 2019; 11(18):5083. https://0-doi-org.brum.beds.ac.uk/10.3390/su11185083
Chicago/Turabian StyleHu, Changhui, Weidong Liu, Yuqiu Jia, and Yaya Jin. 2019. "Characterization of Territorial Spatial Agglomeration Based on POI Data: A Case Study of Ningbo City, China" Sustainability 11, no. 18: 5083. https://0-doi-org.brum.beds.ac.uk/10.3390/su11185083
Note that from the first issue of 2016, this journal uses article numbers instead of page numbers. See further details here.