Effects of Severe Water Stress on Maize Growth Processes in the Field


1
College of Water Resources and Architectural Engineering, Northwest A&F University, Yangling 712100, Shaanxi Province, China
2
Department of Watershed Sciences, Utah State University, Logan, UT 84322, USA
3
Key Laboratory of Agricultural Soil and Water Engineering in Arid and Semi-arid Areas, Ministry of Education, Northwest A&F University, Yangling 712100, Shaanxi Province, China
*
Author to whom correspondence should be addressed.
Sustainability 2019, 11(18), 5086; https://0-doi-org.brum.beds.ac.uk/10.3390/su11185086
Submission received: 13 August 2019
/
Revised: 10 September 2019
/
Accepted: 14 September 2019
/
Published: 17 September 2019
(This article belongs to the Special Issue Sustainable Irrigation Strategies for Improving Crop Water Productivity)
Abstract
:In this study, we investigated the effects of water stress on the growth and yield of summer maize (Zea mays L.) over four phenological stages: Seedling, jointing, heading, and grain-filling. Water stress treatments were applied during each of these four stages in a water-controlled field in the Guanzhong Plain, China between 2013 and 2016. We found that severe water stress during the seedling stage had a greater effect on the growth and development of maize than stress applied during the other three stages. Water stress led to lower leaf area index (LAI) and biomass owing to reduced intercepted photosynthetically active radiation (IPAR) and radiation-use efficiency (RUE). These effects extended to the reproductive stage and eventually reduced the unit kernel weight and yield. In addition, the chlorophyll content in the leaf remained lower, even though irrigation was applied partially or fully after the seedling stage. Severe and prolonged water stress in maize plants during the seedling stage may damage the structure of the photosynthetic membrane, resulting in lower chlorophyll content, and therefore RUE, than those in the plants that did not experience water stress at the seedling stage. Maize plants with such damage did not show a meaningful recovery even when irrigation levels during the rest of the growth period were the same as those applied to the plants not subjected to water stress. The results of our field experiments suggest that an unrecoverable yield loss could occur if summer maize were exposed to severe and extended water stress events during the seedling stage.
1. Introduction
Maize is one of the most important food grains and bio-energy crops [1,2], with an average harvested area of 157 million ha and production of 781 Mt from 2000 to 2014 [3]. Maize can be produced at annual precipitation levels as low as 200 mm [4] and in recent years, maize cultivation has been gradually extended to arid and semi-arid areas, which represent a substantial proportion of land resources. This shift has helped resolve food security issues in countries with limited water resources, such as China [5].
However, the uneven spatiotemporal distribution and shortage of water resources have limited maize production in arid and semi-arid areas to date [6,7,8,9,10,11,12,13]. Insufficient available soil water weakens the metabolic activity of maize, reduces its biomass accumulation, and decreases its photosynthetic rate by reducing the chlorophyll content in leaves, eventually leading to a decrease in maize yield [14,15,16,17,18,19,20]. Several studies have shown that the timing and intensity of soil water stress are critical for maize growth [21,22,23,24]. A strong water stress during the vegetative growth stage could seriously inhibit the growth and leaf area of maize plants and decrease the yield [21,25]. However, the maize with light water stress during the early vegetative growth and late grain-filling stages showed a certain level of water stress tolerance due to the low water demand of maize during these stages [26,27,28,29,30]. Therefore, a high maize yield could be achieved through full irrigation at the flowering stage, even if the soil water content is sub-optimal during the vegetative growth and grain-filling stages [31]. Thus, an improved understanding of water stress on maize growth is essential to soil water and crop management.
Many studies have explored the effects of water stress on the growth and development of maize [21,25,26,27,28,29,30]. Most of them neglect the influence of water stress during the seedling stage on the young maize growth and final yield. Understanding such an influence is important to maize yield predictions, which is the focus of this study.
In this study, we used multi-year field experiments to gain an in-depth and quantitative understanding of how water stress affects maize growth and development. Our main objective was to explore the effects of severe water stress (no water supply) during different growth stages on maize growth and development. We emphasized the influence of water stress during the seedling stage on maize growth and analyzed the mechanism of those effects. A field site located in central China was selected for this study. However, it was very difficult to conduct multiple-site field experiments under different soil water conditions. Therefore, we accounted for the site-dependence of our experiments to the minimum extent possible by controlling soil water through scheduled irrigation and sheltered rainwater.
2. Materials and Methods
2.1. Experiment Overview
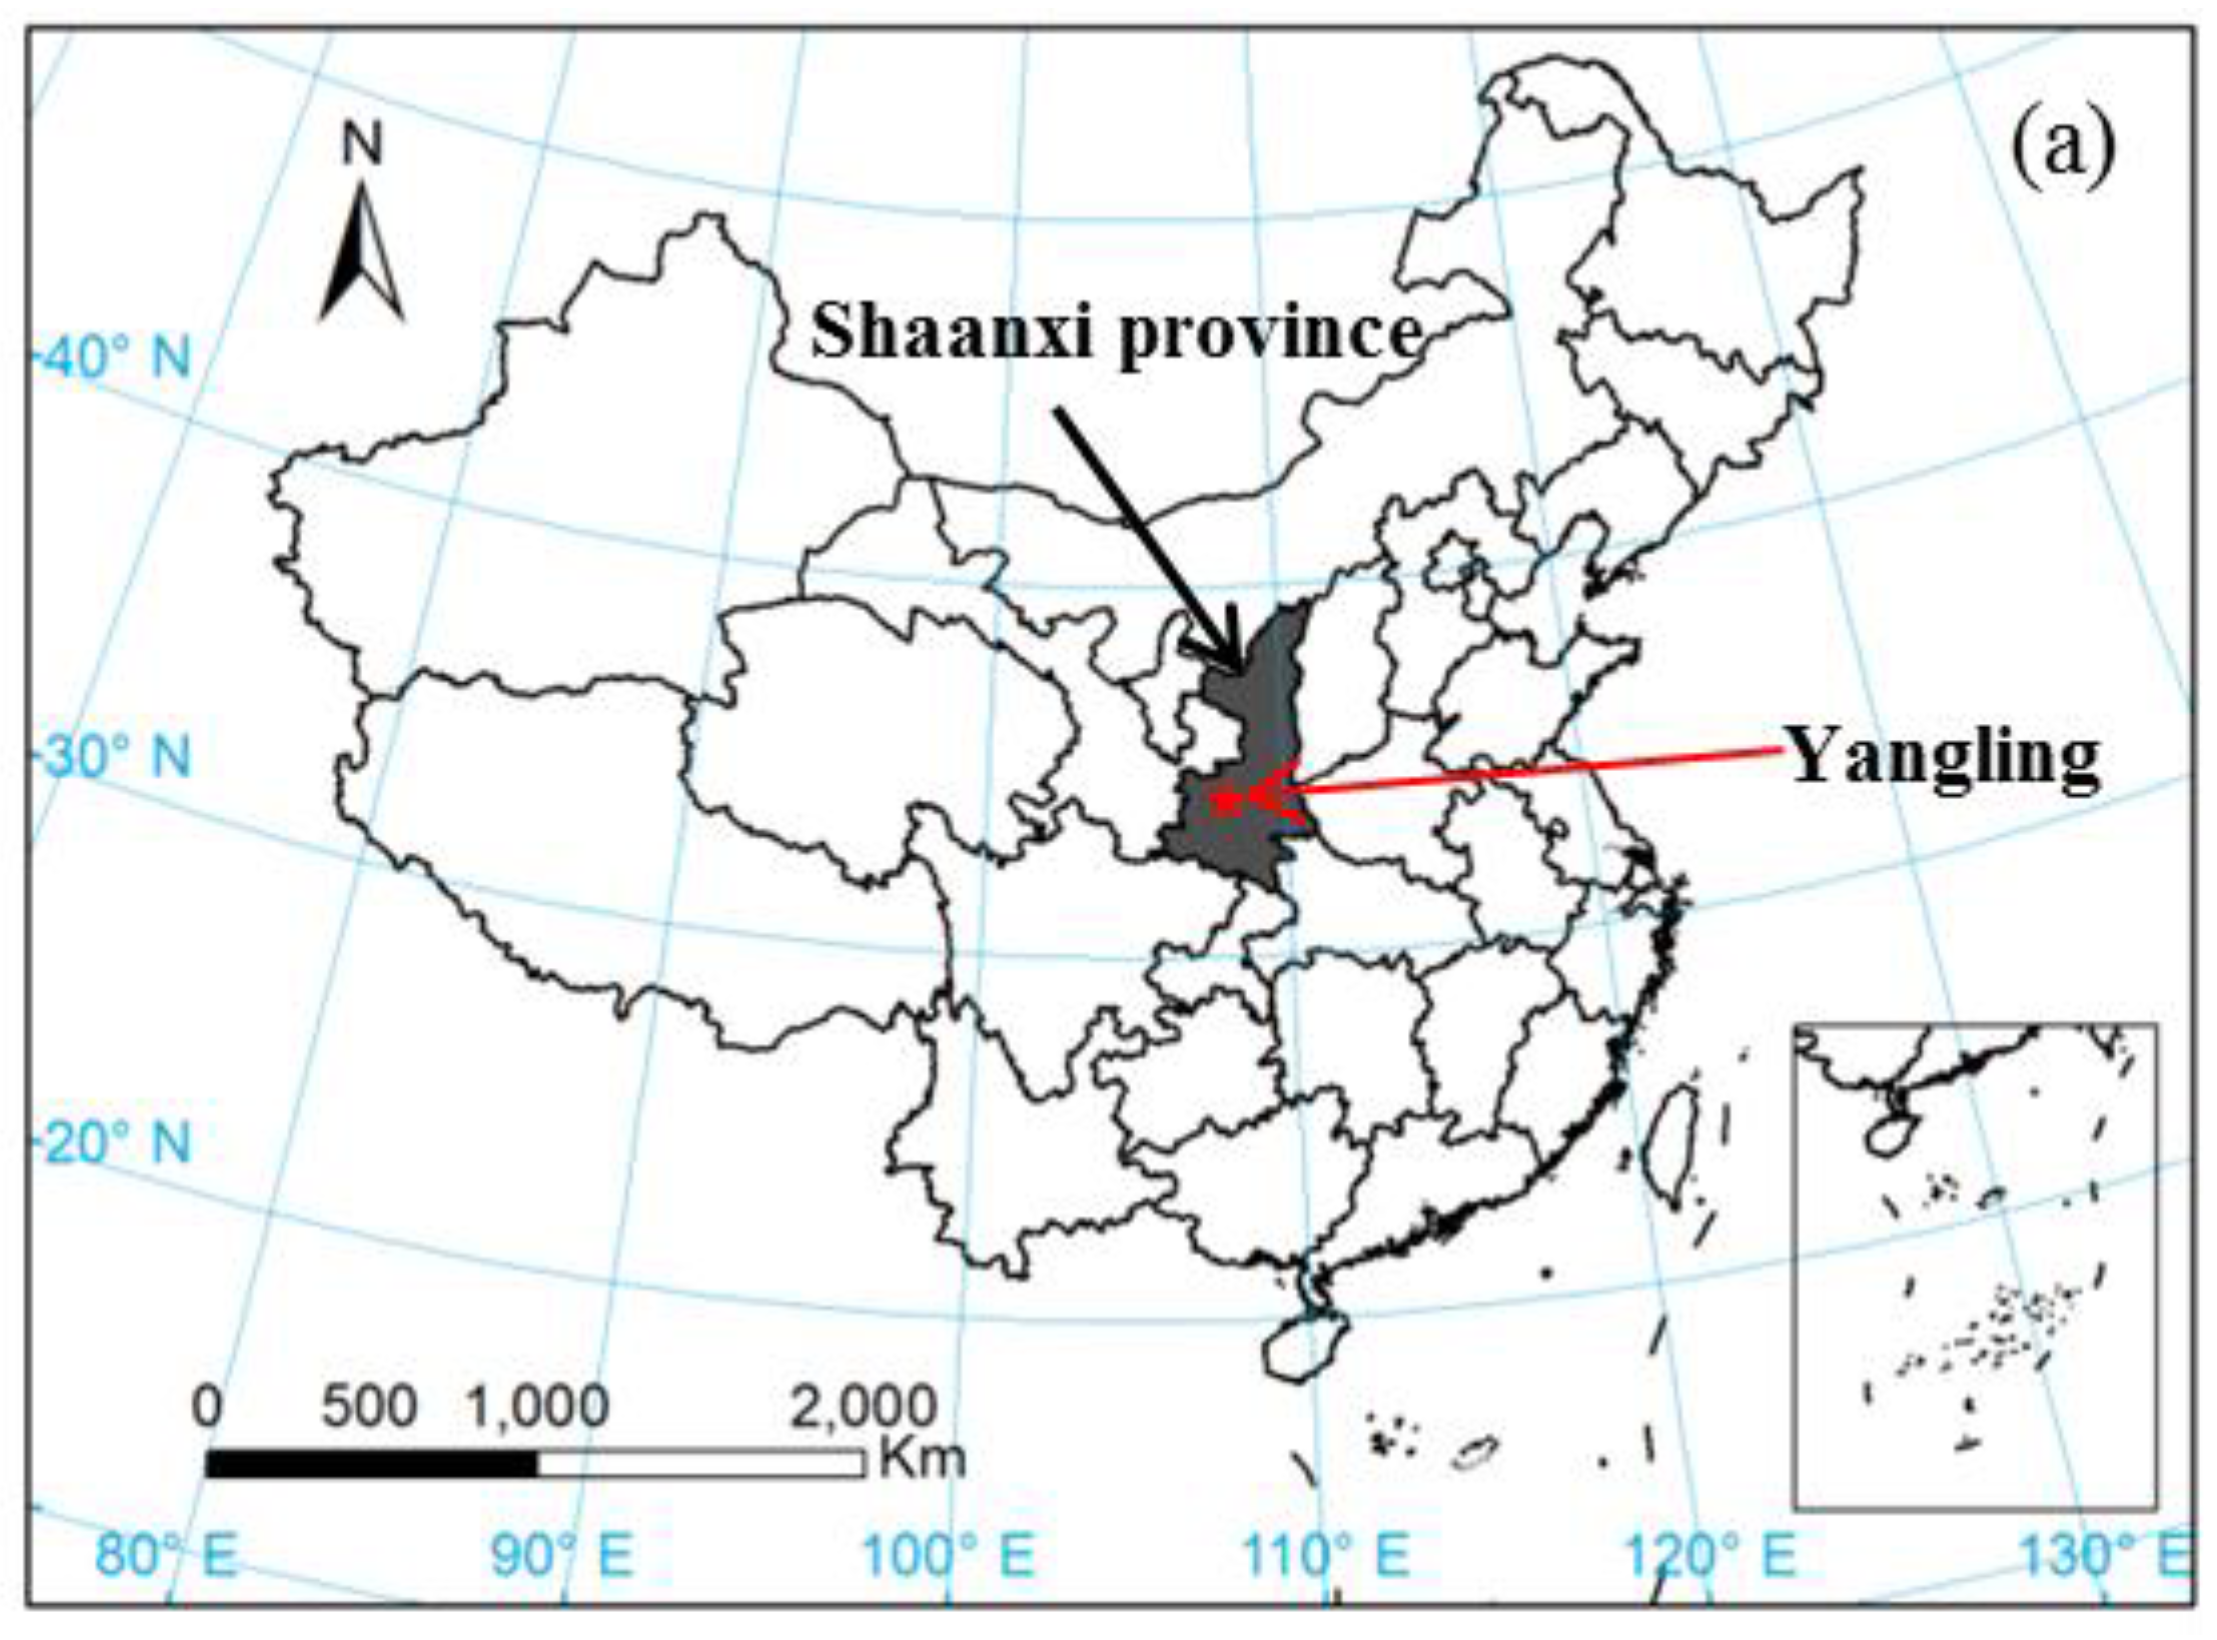
A set of field experiments focused on rainfed summer maize (Zea mays L.) were carried out from 2013 to 2016 in Yangling, Shaanxi (34°17′ N, 108°04′ E, elevation 506 m a.s.l. Figure 1). The sowing area was 10 m2 in each of the field plots. The field capacity and wilting point in the top 1 m of the soil were 0.26 and 0.12 cm3 cm−3, respectively, and the average bulk density of the soil was 1.31 g cm−3. A 1.5 m deep polyethylene plastic isolation layer was placed between the plots, to prevent the lateral flow of water between the plots. To control the amount of water applied to the plots, a movable transparent plastic shelter overarching the field was used to prevent rainwater entering the field, as shown in Figure 1. Thus, the shelter was opened on sunny days and closed on rainy days.
The seeds of ZhenDan-958—the maize cultivar most commonly planted in the study area because of its adaptation to the local environmental conditions—were sown manually in each plot in an east-to-west direction. The plant spacing was 30 cm, row spacing was 50 cm, and the sowing depth was 5 cm. Every plot was fertilized with 210 kg hm−2 nitrogen (urea) and 160 kg hm−2 P2O5 before sowing. The planting, seedling emergence, and harvesting dates for the four seasons are shown in Table 1.
With these field settings, we conducted field experiments with different levels of irrigation to investigate the effect of soil water on the growth of maize. By sheltering the experimental field from rainwater, the soil water was largely controlled based on the irrigation levels. The whole growth season of maize was divided into four stages: Seedling (from emergence to the eighth leaf), jointing (from the eighth leaf to silking), heading (from silking to milk), and grain-filling (milk to physiological maturity). These growth stages were determined according to the physiological and morphological features of the maize based on the Hanway standard [32]. As aforementioned, this study focused on rainfed summer maize. The rain intensities were represented with different levels of irrigation in the rest of the text. One experiment was carried out with full irrigation (FullIRR) as a control treatment, where the maize was irrigated during all four stages, with an irrigation level of 110 mm at each stage. This level of irrigation represented the 75% percentile of the monthly precipitation during the growth period (June to September) based on data from the period of 1954 to 2007 and provided sufficient water for the growth of maize without stress (shown in Section 3.3). Two irrigation water levels were set with 110 mm and 70 mm of water in water stress treatments, these two values represented the 75% and 25% percentiles, respectively, of the monthly precipitation for the growth period based on the precipitation data described previously. To generate meaningful water stress for a certain phenological stage, maize received no irrigation during this stage but was irrigated during the other three stages with 70 or 110 mm of water. Each of the above treatments was repeated three times, and plots were conducted in the field based on split-plot design. The former level was used for a low irrigation (LowIRR) treatment and the latter for a high irrigation (HighIRR) treatment. The complete irrigation management is shown in Table 2. For the FullIRR treatment, we irrigated the plots with 80 mm of water before planting to ensure the absence of water stress during the initial growth stage. In the LowIRR and HighIRR treatments, we irrigated about 40 mm of water before planting to ensure maize emergence, and the initial soil moistures were either close to or lower than the threshold below which water stress occurred (shown in Section 3.3). When no irrigation was applied during the seedling stage, sufficient water stress was generated from low initial soil moistures for the LowIRR and HighIRR treatments (shown in Section 3.3).
2.2. Experiments
2.2.1. Phenology
Phenology, in this instance, refers to the various growth stages of crop plants, such as emergence, silking, and maturity. Understanding the phenology can inform field agricultural management. We observed the exact dates of emergence, the eighth leaf, silking, maturity, and harvest during the 2013 and 2014 growing seasons. The grain filling dates were not included because it was difficult to accurately observe in the field.
2.2.2. Soil Moisture
In the present study, the soil moisture was measured every 20 cm from the surface to a depth of 1 m (five soil layers in total) for each plot at about 10-day intervals. These values were used to calculate the effects of water stress on maize growth. We adopted the following equation recommended by the Food and Agriculture Organization [33] to quantify water stress (Ks) for the maize planted in our study field:
where, TAW is total available soil water in the root zone (mm), Dr is root zone depletion (mm), SAW is soil available water (mm), RAW is readily available water (mm), p as 0.55 is a constant specifically for maize, θt, θFC, and θWP are the soil water content, field capacity, and wilting point in the top 1 m of the soil, respectively, and Zr is the soil depth (1 m in this study). We used Ks1 and Ks2 to represent different water stress factors: Ks1 is the water stress factor during a maize growth stage with no irrigation, Ks2 is the water stress factor during the rest of the stages with irrigation water.
2.2.3. LAI and Aboveground Biomass
The leaf area and aboveground biomass of maize plants were measured at the same time intervals. In each plot, two maize plants with an average appearance were selected for measurements of the length (from the leaf collar to the leaf tip) and width (the maximum) of each green leaf, which were subsequently used to calculate the leaf area and leaf area index (LAI) based on the following equations [34]:
where, A is the area of a single leaf (cm2), L is the length from the leaf collar to the leaf tip (cm), W is the maximum leaf width (cm), 0.75 is a leaf area regression coefficient that is related to leaf shape, n is the total number of leaves in the sampled plant, D is plant density (m−2), and 10,000 is the factor used to convert from square-meters to square-centimeters.
Three plants with an average appearance for each treatment were cut and dried in the oven at 105 °C for 30 min. Thereafter, the temperature of the oven was adjusted to 75 °C, and plants were kept at that temperature until a constant weight was reached. The final weight was recorded as the weight of the dry matter. The aboveground biomass of maize was estimated as single-plant dry matter multiplied by planting density. In addition, the plants in a unit area (1 m2) located in the middle of each plot were harvested to measure canopy height, unit kernel weight, kernels per spike, and yield. Final yield was estimated for the whole plot (kg ha−1) with density, because the plant density was even across all plots.
2.2.4. IPAR and RUE
The intercepted photosynthetically active radiation (IPAR) was calculated based on LAI, as shown in Equation (6) [35] and the required data were collected from a nearby meteorological station (within a distance of ~200 m).
where, Rs is the daily total incoming solar radiation (MJ m−2 d−1), 0.5 is the ratio between PAR and Rs, and 0.65 is the light extinction coefficient of maize [36].
The radiation use efficiency (RUE) was calculated as the slope between the total accumulated aboveground biomass and the quantity of cumulative IPAR [37]. These data and maize-related variables were used to quantitatively investigate and understand the effects of water stress on maize growth.
2.2.5. Evapotranspiration (ET), the Irrigation Water-Use Efficiency (IWUE), the Water-Use Efficiency (WUE), and the Crop Response Factor (ky)
ET from each plot was calculated using the soil water balance equation for individual growth stages and the growth season as follows:
where SD is the soil water depletion (mm), which was calculated as the difference between soil water content values at the beginning and end of each period for a soil depth of 1 m. P is the precipitation (mm), which was zero because the experiment was controlled by a rain shelter. I is for the irrigation water amount (mm). R is the runoff (mm), and it was set to zero because the experimental plots were surrounded with dikes. D is the drainage (mm) below the root zone, and it was assumed to be zero, since almost no water drainage below a soil depth of 1.2 m was observed from measurements taken to a soil depth of 1.5 m. IWUE for each treatment was calculated using grain yield and total irrigation water as follows:
where IWUE is the irrigation water-use efficiency (kg m−3), GY is the grain yield (kg m−2), and I is the total irrigation water (m). WUE can be written as follows:
Seasonal values of the yield response factor (ky) for each deficit irrigation treatment was determined using the following equation:
where ky is the yield response factor, GYi and ETi is the grain yield and total ET for the irrigation level i, and GYm and ETm is the maximum grain yield and maximum total ET for an individual year, which were from FullIRR in this study.
2.3. Statistical Analyses
In this study, the effects of all the nine irrigation treatments on the observed variables were evaluated using the one-way analysis of variance (ANOVA) as the irrigation water is the main factor. We applied Duncan’s new multiple range test to calculate the least significant difference (LSD) between the means of each observed variable with different treatments when the F-values of ANOVA were significant. In all cases, differences were deemed to be significant if the p-value was less than 0.05.
3. Results
3.1. Weather Condition Analysis
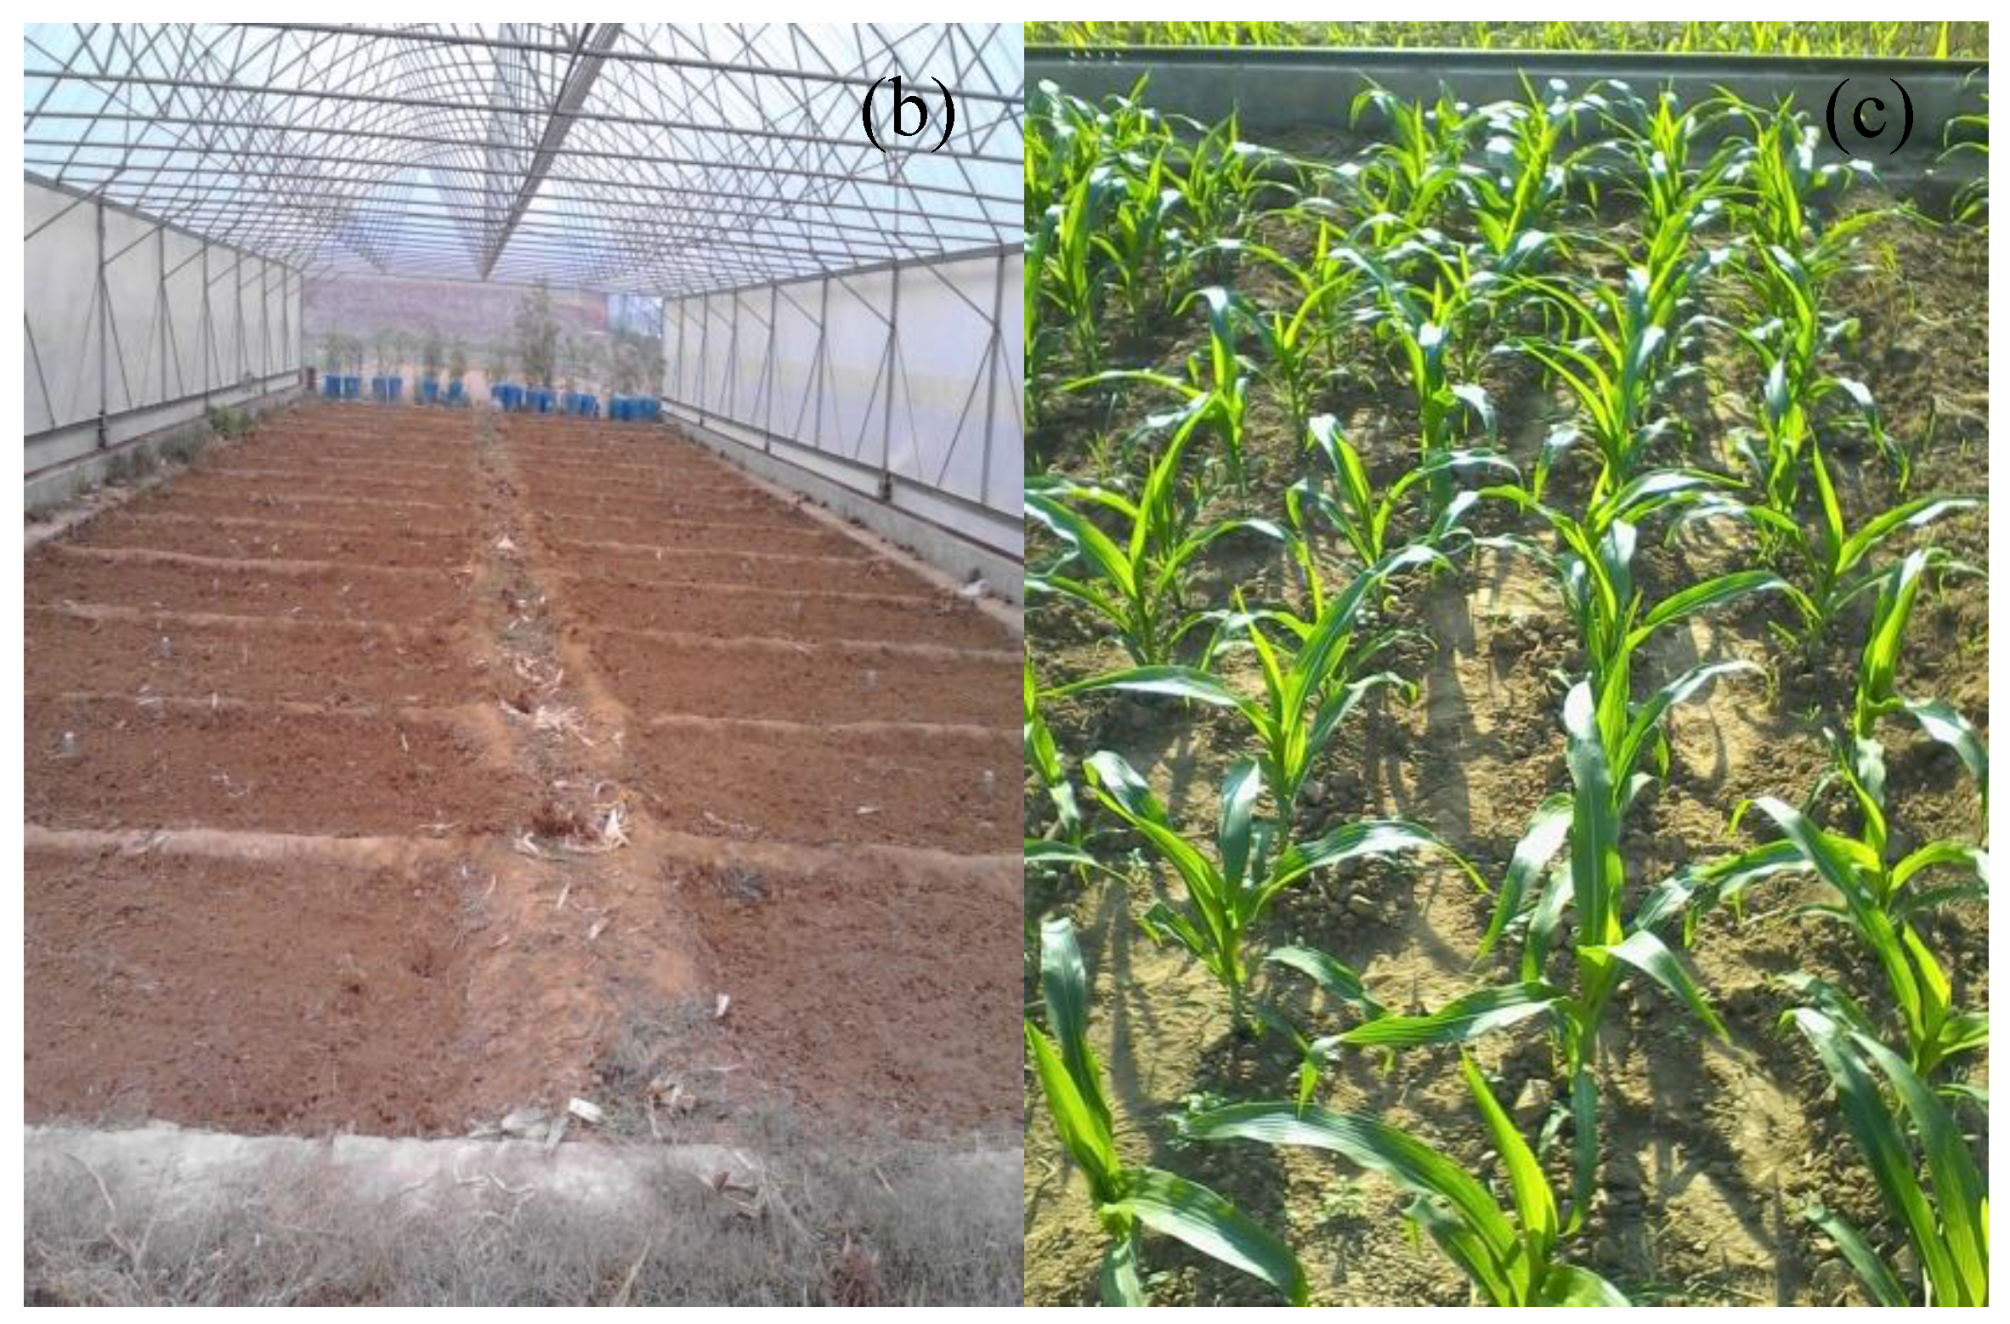
The mean air temperatures during the growing season (June–September) were 25.4 °C in 2013, 24.4 °C in 2014, 24.1 °C in 2015, and 26.0 °C in 2016, which were 1.7 °C, 0.7 °C, 0.4 °C, and 2.3 °C higher, respectively, than the historical average temperature, where the historical average was calculated based on temperature data for the period 1983–2012. The mean air temperature during each of the growth stages over the four seasons is shown in Figure 2a. The temperature was lower by 1.6 °C during the seedling stage in 2015 than that in the other three periods, whereas the temperature in the jointing stage in 2014 was 3.0 °C higher than that in 2013 and 2.1 °C higher than that in 2015 and 2016. The temperature during the heading stages in 2016 was approximately 1.6 °C, 4.3 °C, and 3.2 °C higher than those in 2013, 2014, and 2015, respectively. Moreover, during the grain-filling stages, the temperature in 2016 and 2013 was approximately 2.3 °C and 1.6 °C higher than those in 2014 and 2015, respectively. The relative humidity during each of the growth stages over the four seasons is shown in Figure 2b. There is a little difference in relative humidity during seedling and heading stages over the four seasons. The relative humidity values for the jointing stage in 2013 and 2016 were about 11% and 5% higher than those in 2014 and 2015, respectively. In 2014, the relative humidity for the grain filling stage was around 16% higher than those for the other three stages. These differences in air temperature between the different maize growth periods were expected to affect maize development through evapotranspiration and water stress, thus providing an understanding of yield variations under similar water management conditions [38,39,40].
3.2. Effects of Different Irrigation Treatments on Maize Growth
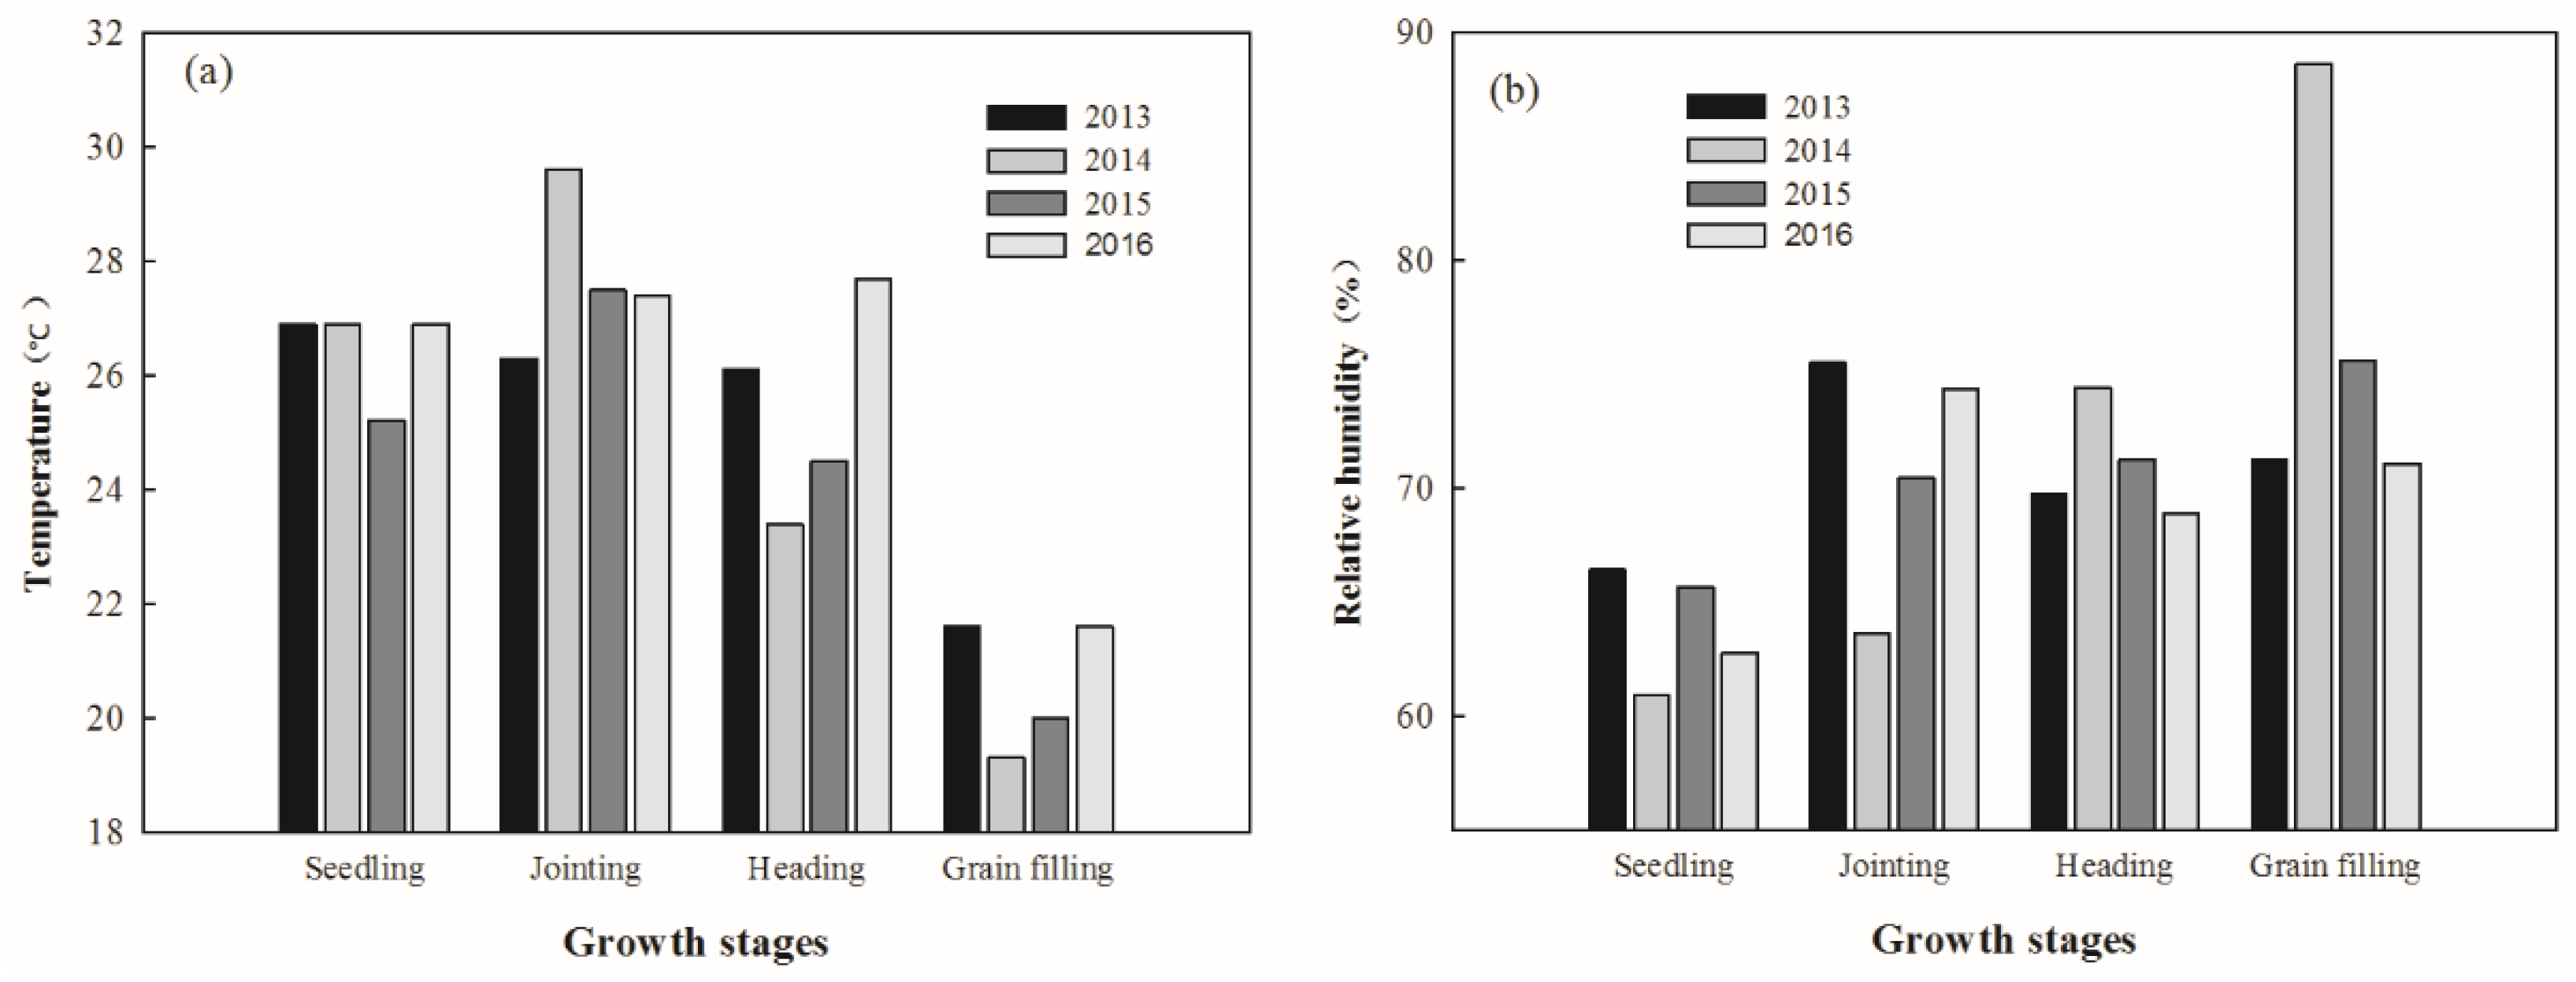
Different treatments had different water conditions, resulting in different growth processes of the maize. Table 3 shows that there was no water stress in the FullIRR treatment because the water stress factor equaled one. It also can be seen that the maize under the HighIRR treatments experienced water stress during the stage with no irrigation and did not experience water stress during stages with high irrigation based on the stress factors that the Ks1 was always less than one and the Ks2 was equal to one, respectively. What is more, the values of Ks1 and Ks2 were always less than one in the LowIRR treatments, which indicated that the maize experienced water stress during the whole growth period. The maximum LAI, canopy height, biomass, unit kernel weight, kernels per spike, and yield were highest in FullIRR treatment during all treatments, while water stress during different growth stages has different effects on those variables. Table 3 shows that water stress reduces the leaf area, canopy height, number of the kernels per spike, and the unit kernel weight during the seedling, jointing, heading, and grain-filling stages, respectively. Maize plants subjected to the FullIRR treatment produced the highest yield with a weight of 7768 kg ha−1, whereas the lowest yield (3573 kg ha−1) occurred in the LowIRR plants when no irrigation was applied at the seedling stage. In the HighIRR treatment, the lowest yield with a weight of 4945 kg ha−1 was also seen when water stress occurred during the seedling stage. From this table, we can see that the yield was reduced the most by water stress occurring during the seedling stage. The measured ranges of the LAI and biomass with all treatments for our study periods are shown in Figure 3. This figure gives us a general picture of the variations of our measurements under different environmental conditions. We can see that the LAIs and biomasses were most remarkably reduced by water stress occurring during the seedling stage.
Different irrigation treatments have different values of ET, IWUE, WUE, and ky as shown in Table 4. The total ET values of different treatments were very close to the total irrigation except for LowIRR for the seedling stage where ET was lower than irrigation by about 15 mm. During each growth stage, ET in the treatment without irrigation was about 60% lower than that in other treatments with irrigation. The differences of IWUE under different irrigation treatments were not significant, and the maize plants subjected to GFS with the LowIRR treatment produced the highest IWUE with 2.07 kg m−3, while the lowest value (1.35 kg m−3) occurred in SDS with HighIRR. The WUE pattern was very similar to that of IWUE. Although the differences of ky under different irrigation groups were not significant, there were significant differences among different treatments. For example, the ky was equal to 1.47 with SDS under the HighIRR treatment, while it was 0.79 with HDS under the same irrigation treatment. This was because the yield with SDS under the HighIRR treatment lost about 1300 kg ha−1 more than that with HDS at the same irrigation level. The values of ky calculated in this study were consistent with those in Çakir [21]. It was seen that the influence of water stress during the seedling stage was important to maize growth and yield.
3.3. Water Stress on Maize
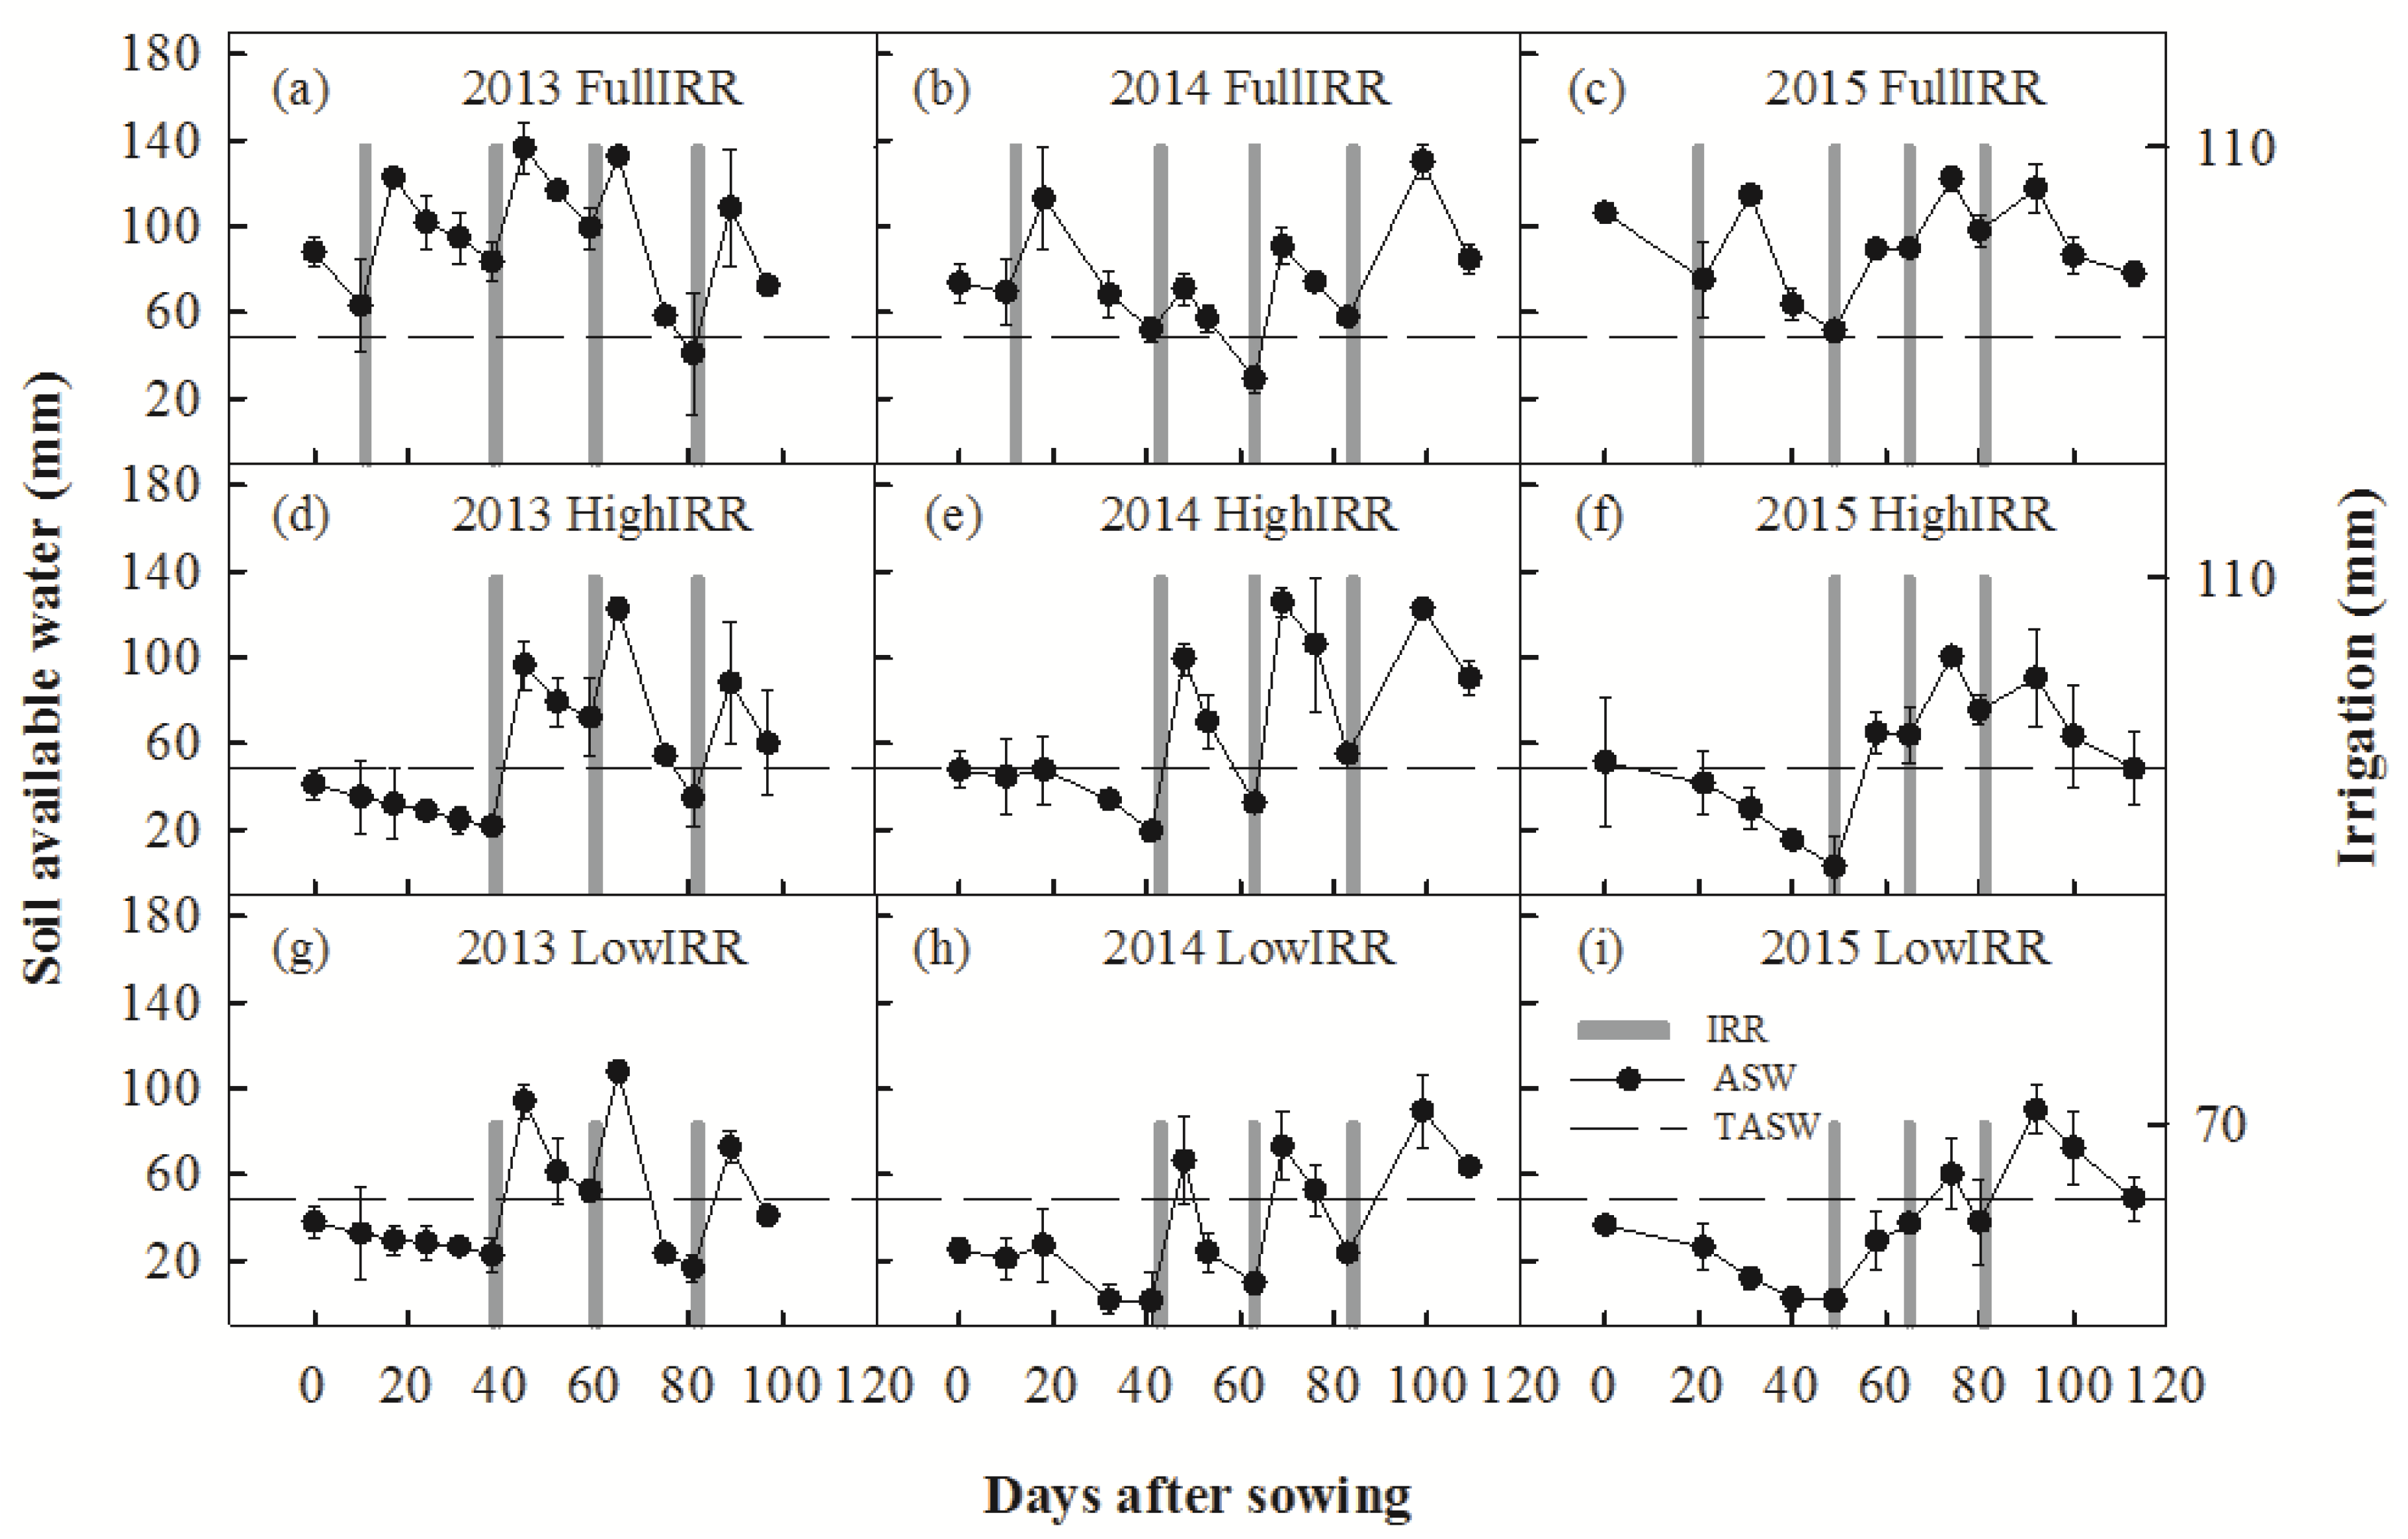
Water stress conditions were not present during most of the study period in the FullIRR treatment (Figure 4a–c), and the most significant water stress event occurred during the seedling stage in both LowIRR and HighIRR treatments when no irrigation was applied. Irrigation was applied three times in those two treatments approximately 40, 62, and 82 days after sowing (DAS) in 2013, 2014, and 2015, respectively, which were the approximate start dates of the jointing, heading, and grain-filling stages. After the application of the first irrigation, water stress in the LowIRR treatment occurred more often and was more severe than in the HighIRR treatment due to the lower level of irrigation. In the HighIRR and FullIRR treatments, very weak water stress occurred at around 81 DAS in 2013 (Figure 4d,g) and 62 DAS in 2014 (Figure 4e,h). Such weak stress was most likely related to the positive air temperature anomalies, which were 3.8 °C and 3.1 °C above the climatology (the average over 1983–2012) 10 days before 81 DAS in 2013 and 62 DAS in 2014, respectively.
3.4. Maize Developmental Stages
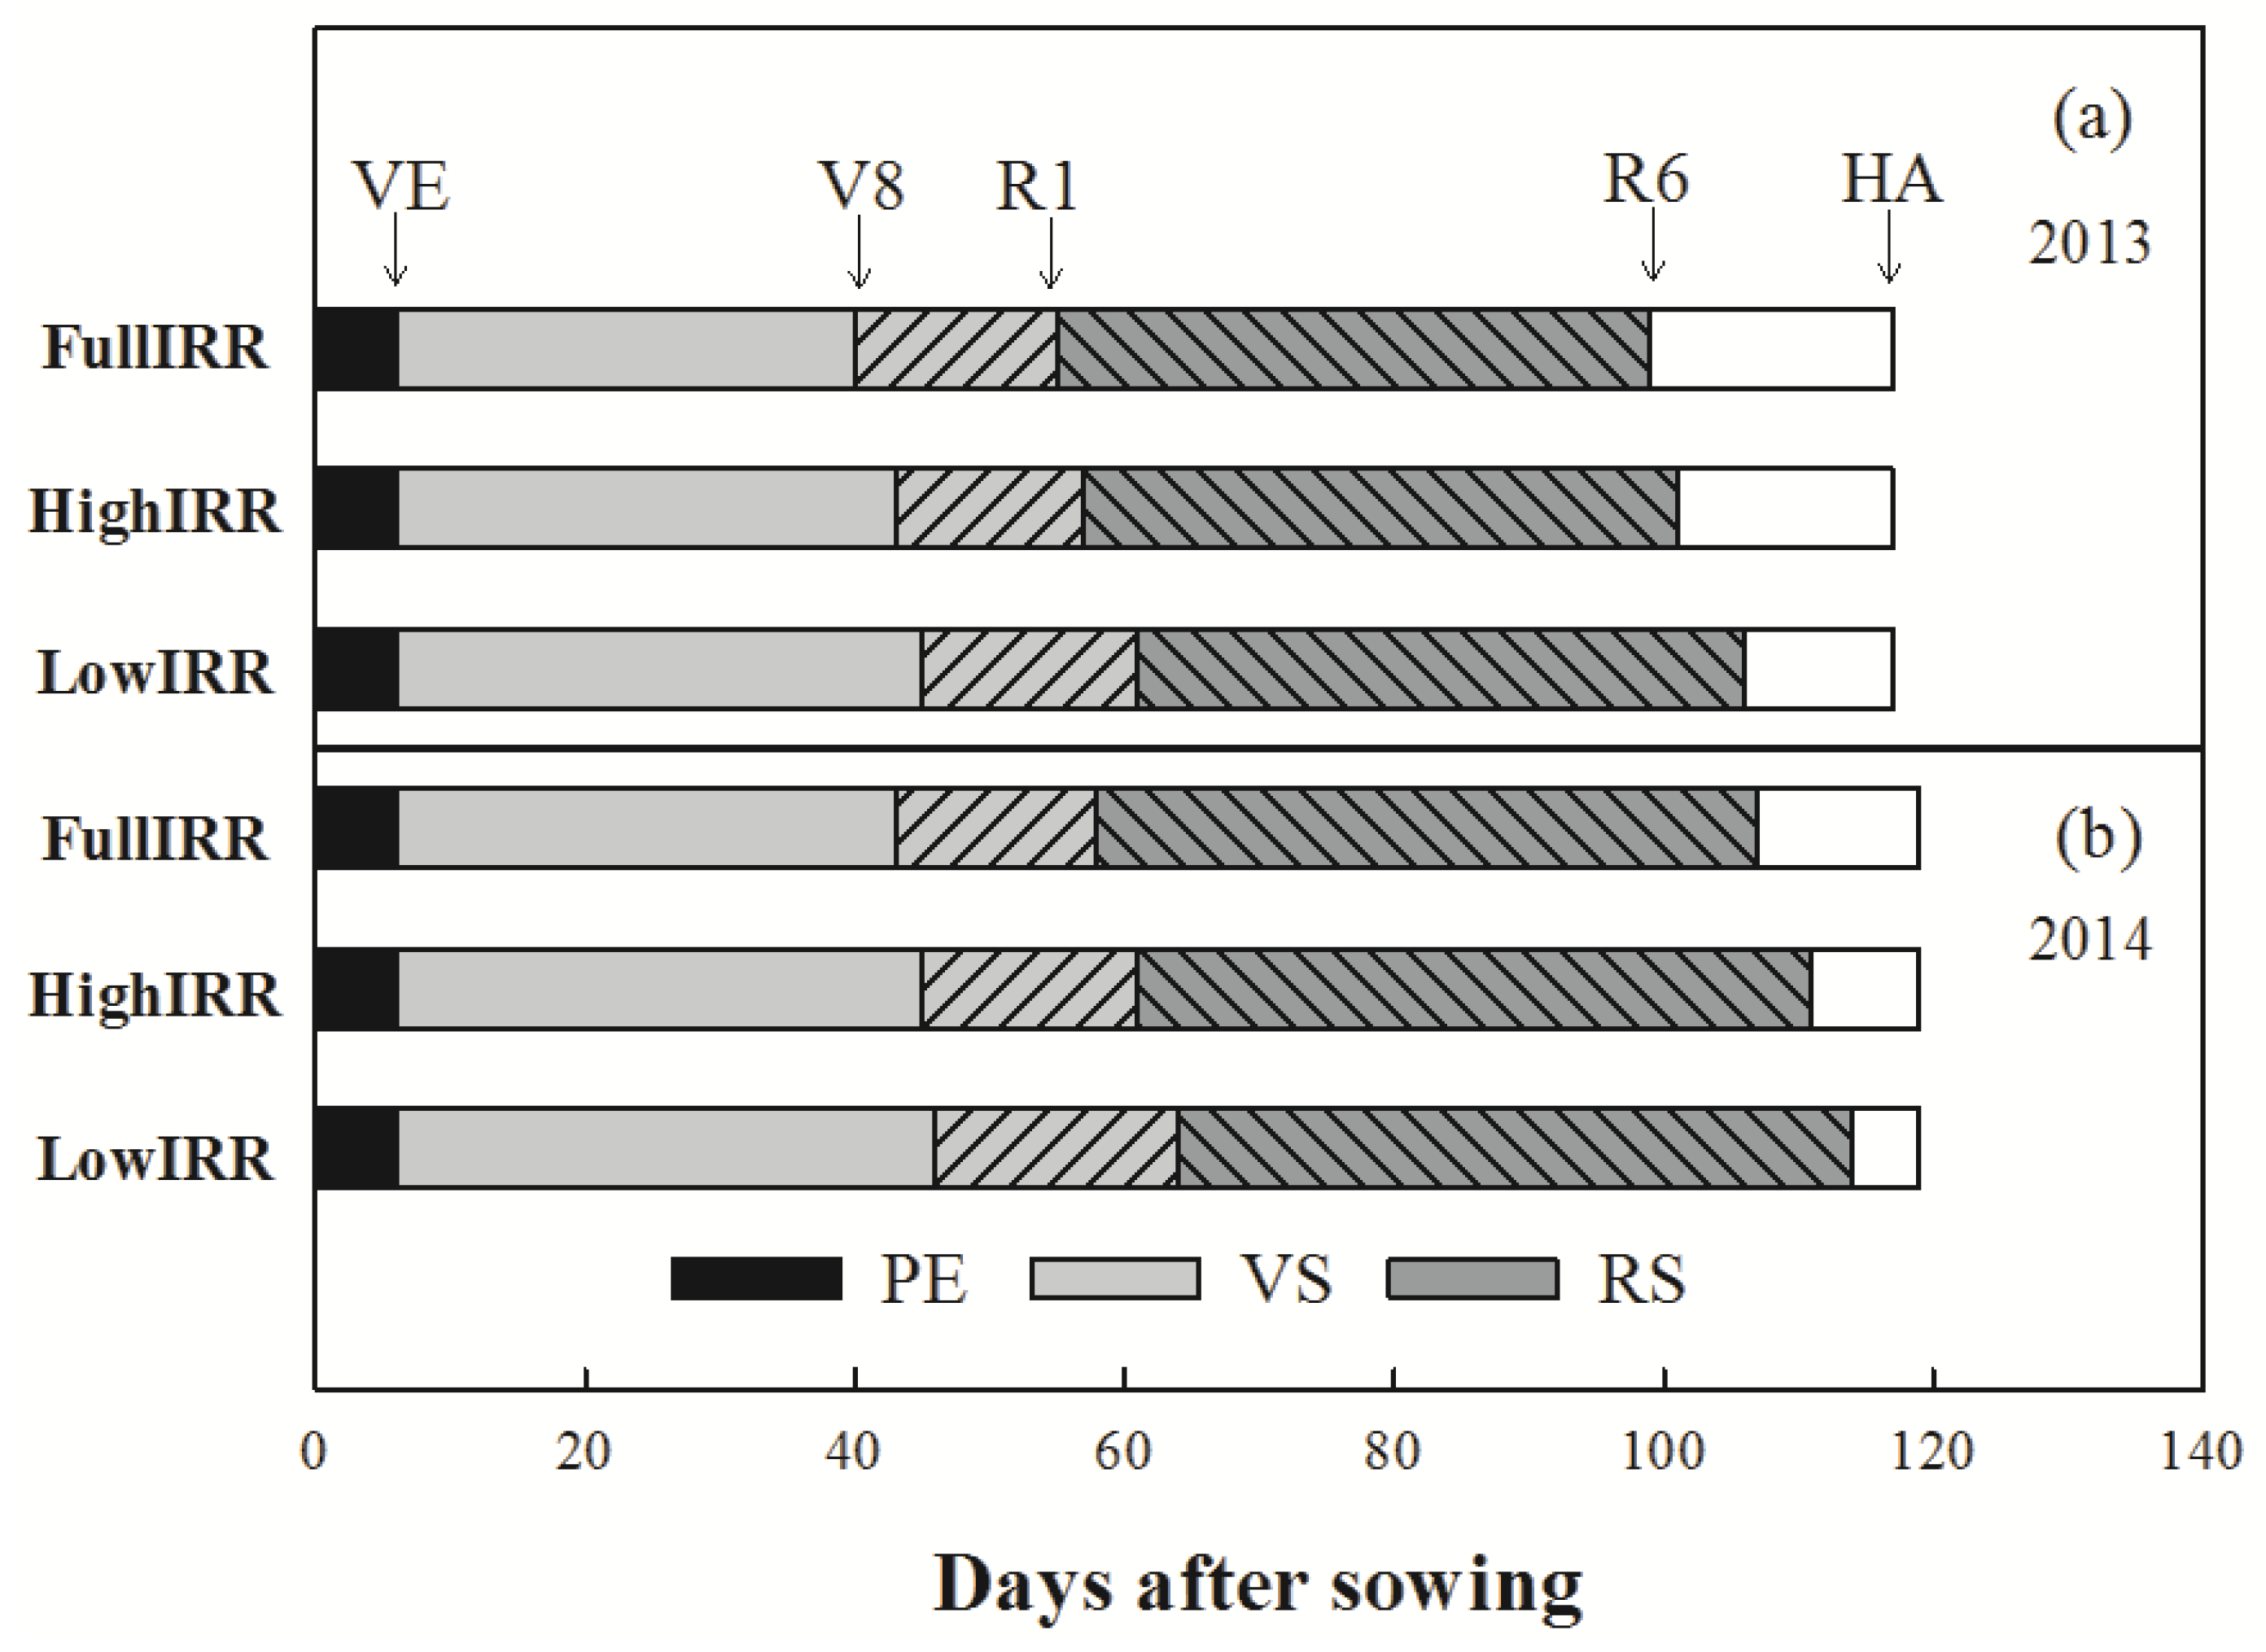
The emergence dates were the same for all three treatments (6 DAS) for which complete phenological data were available during 2013 and 2014, whereas the other phenological processes differed significantly among the treatments (Figure 5). Each of the remaining three growth stages occurred earlier in 2013 than in 2014 owing to higher air temperature (approximately 3 °C) during these stages. Compared with the start dates of the eighth leaf and silking in the FullIRR treatment, these two phenological stages were delayed by three to six days in both years in the LowIRR and HighIRR treatments and started the latest in the LowIRR treatment. Water stress delayed the silking and maturity date, as also observed in previous studies [41,42,43]. Cell and tissue expansions are sensitive processes to water in plants, and water stress can reduce expansion through reduced turgor pressure [7]. A similar effect of water stress on cell division was also observed by Hsiao [7]. Further, water stress delays leaf tip emergence and reduces leaf expansion in maize [17,43,44]. Thus, the delayed silking date and reduced LAI by water stress result in grain yield losses [42]. With the temperatures becoming lower over time in the later growing stages of maize, this delay may affect the grain-filling process of maize, as it is a thermophilic crop, and quantification of such an effect needs additional experiments that were not included in this study.
3.5. LAI and Aboveground Biomass
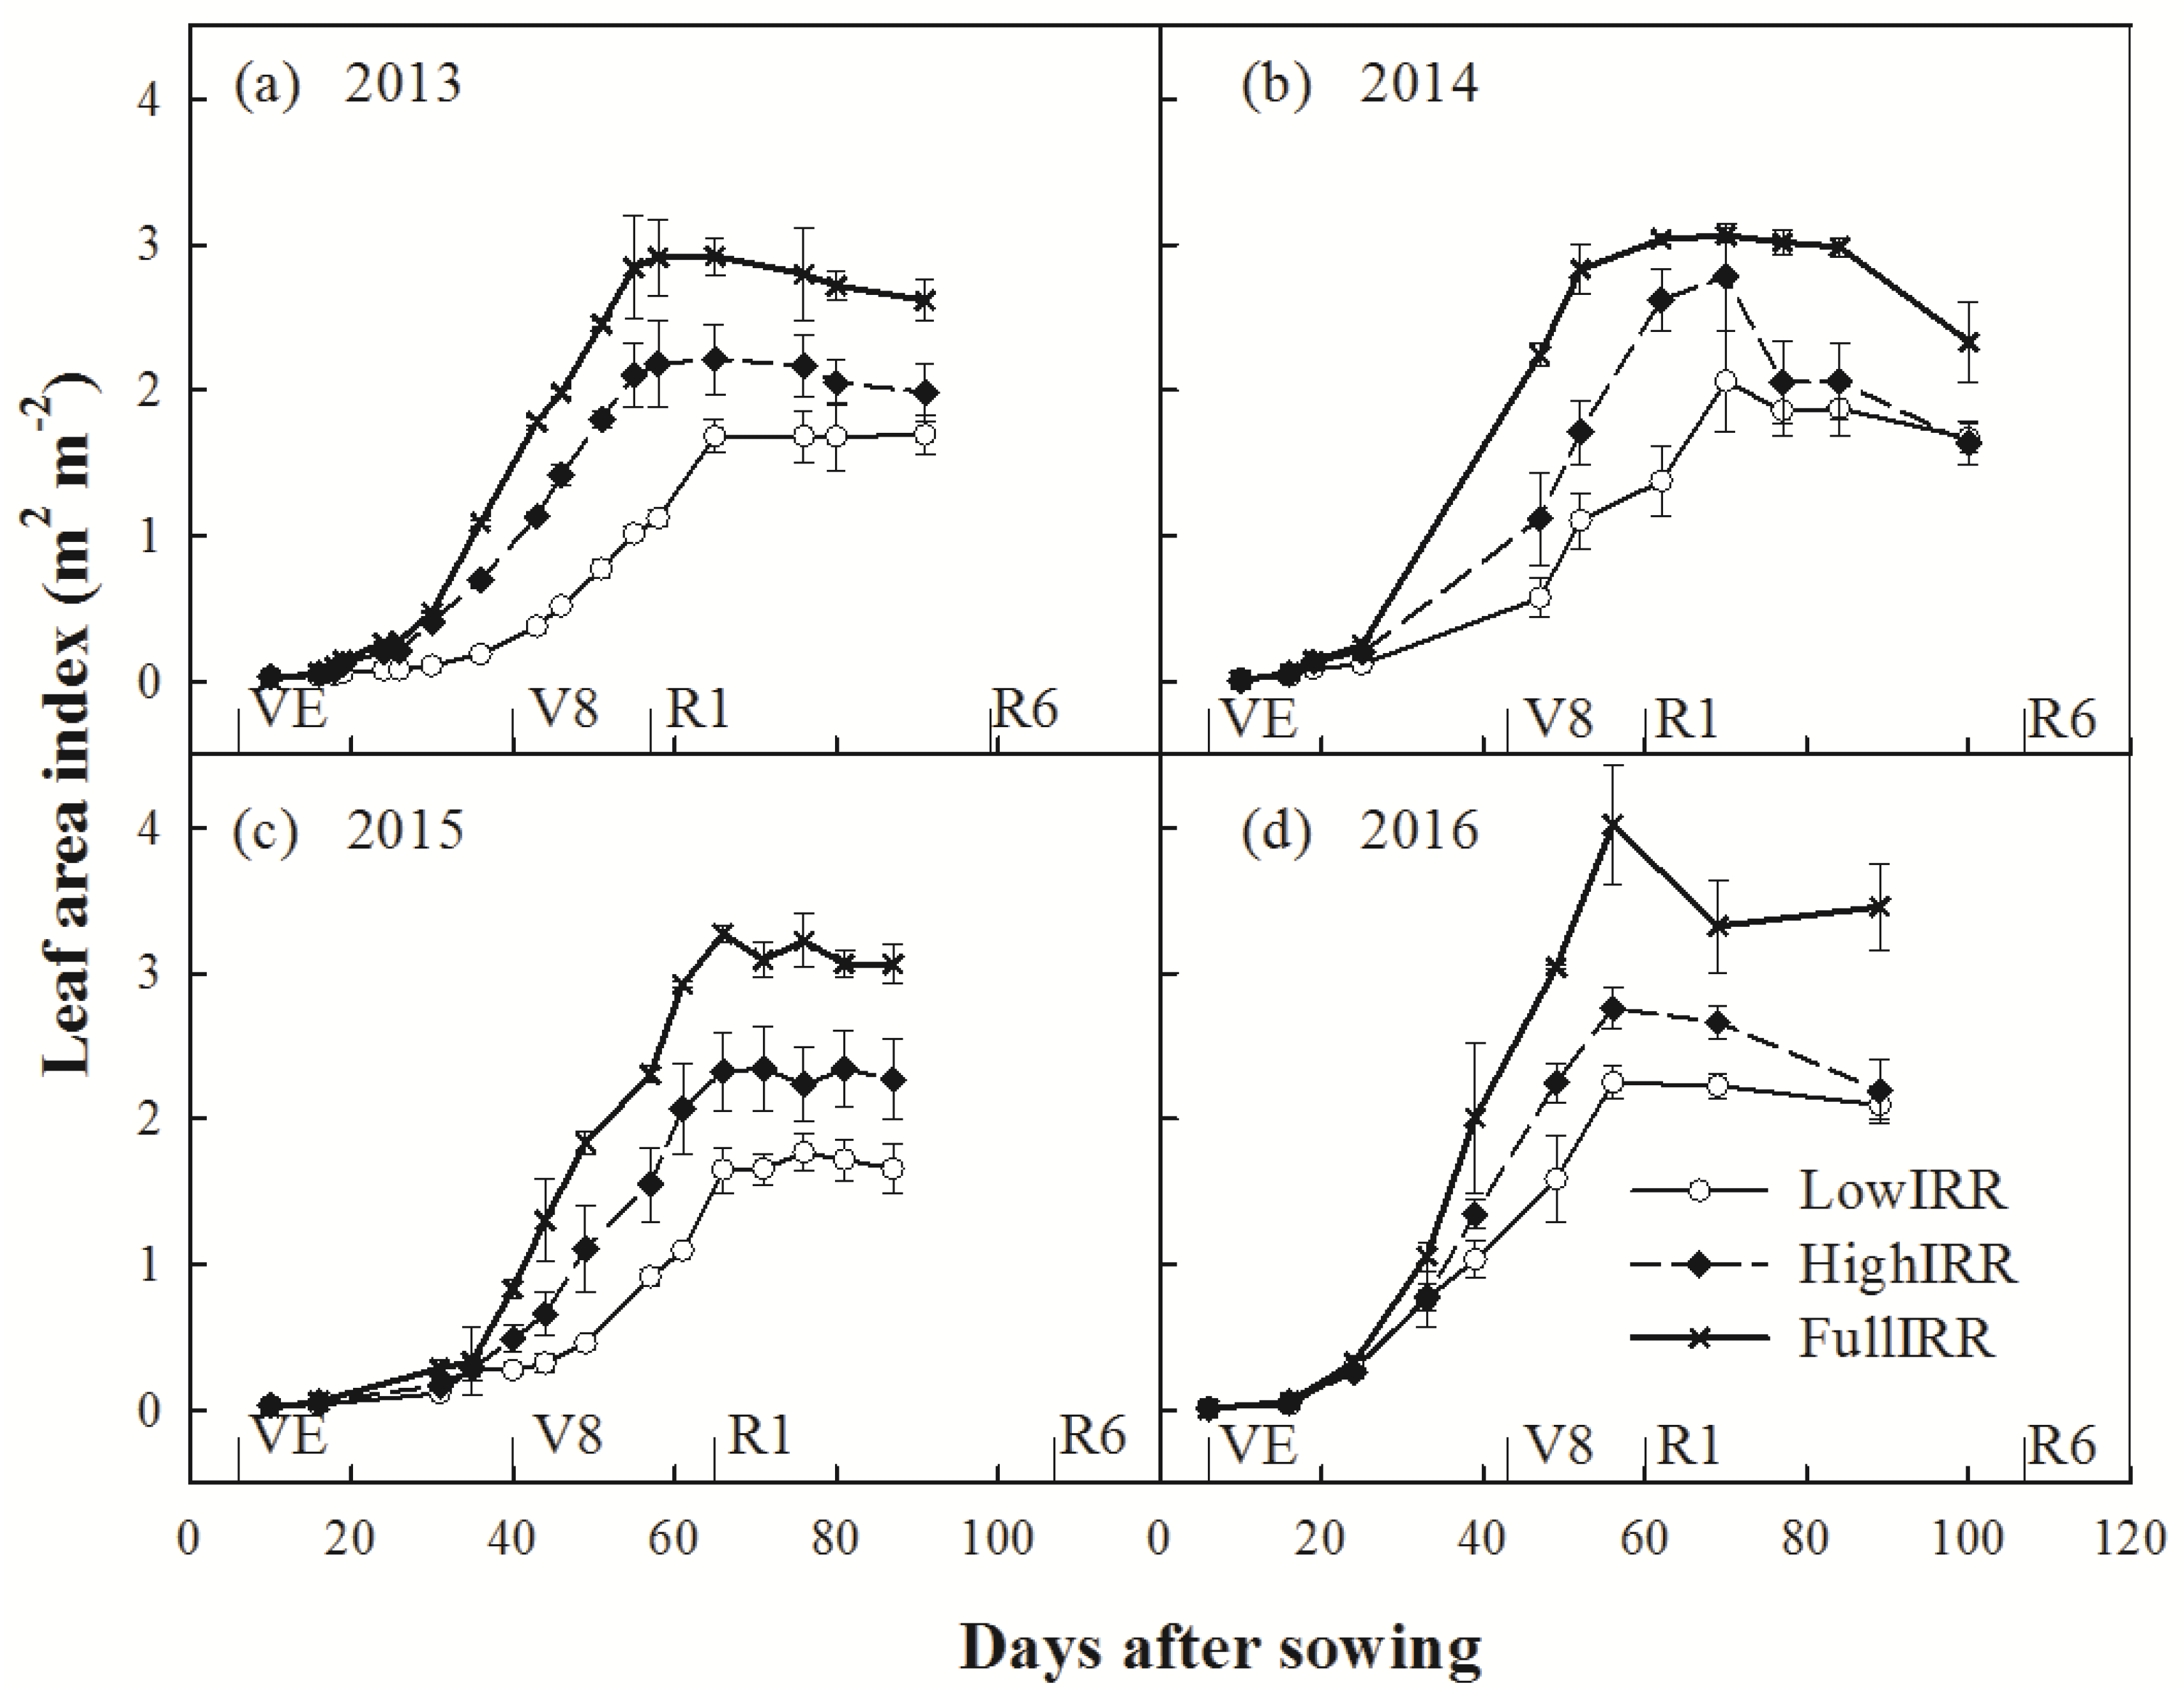
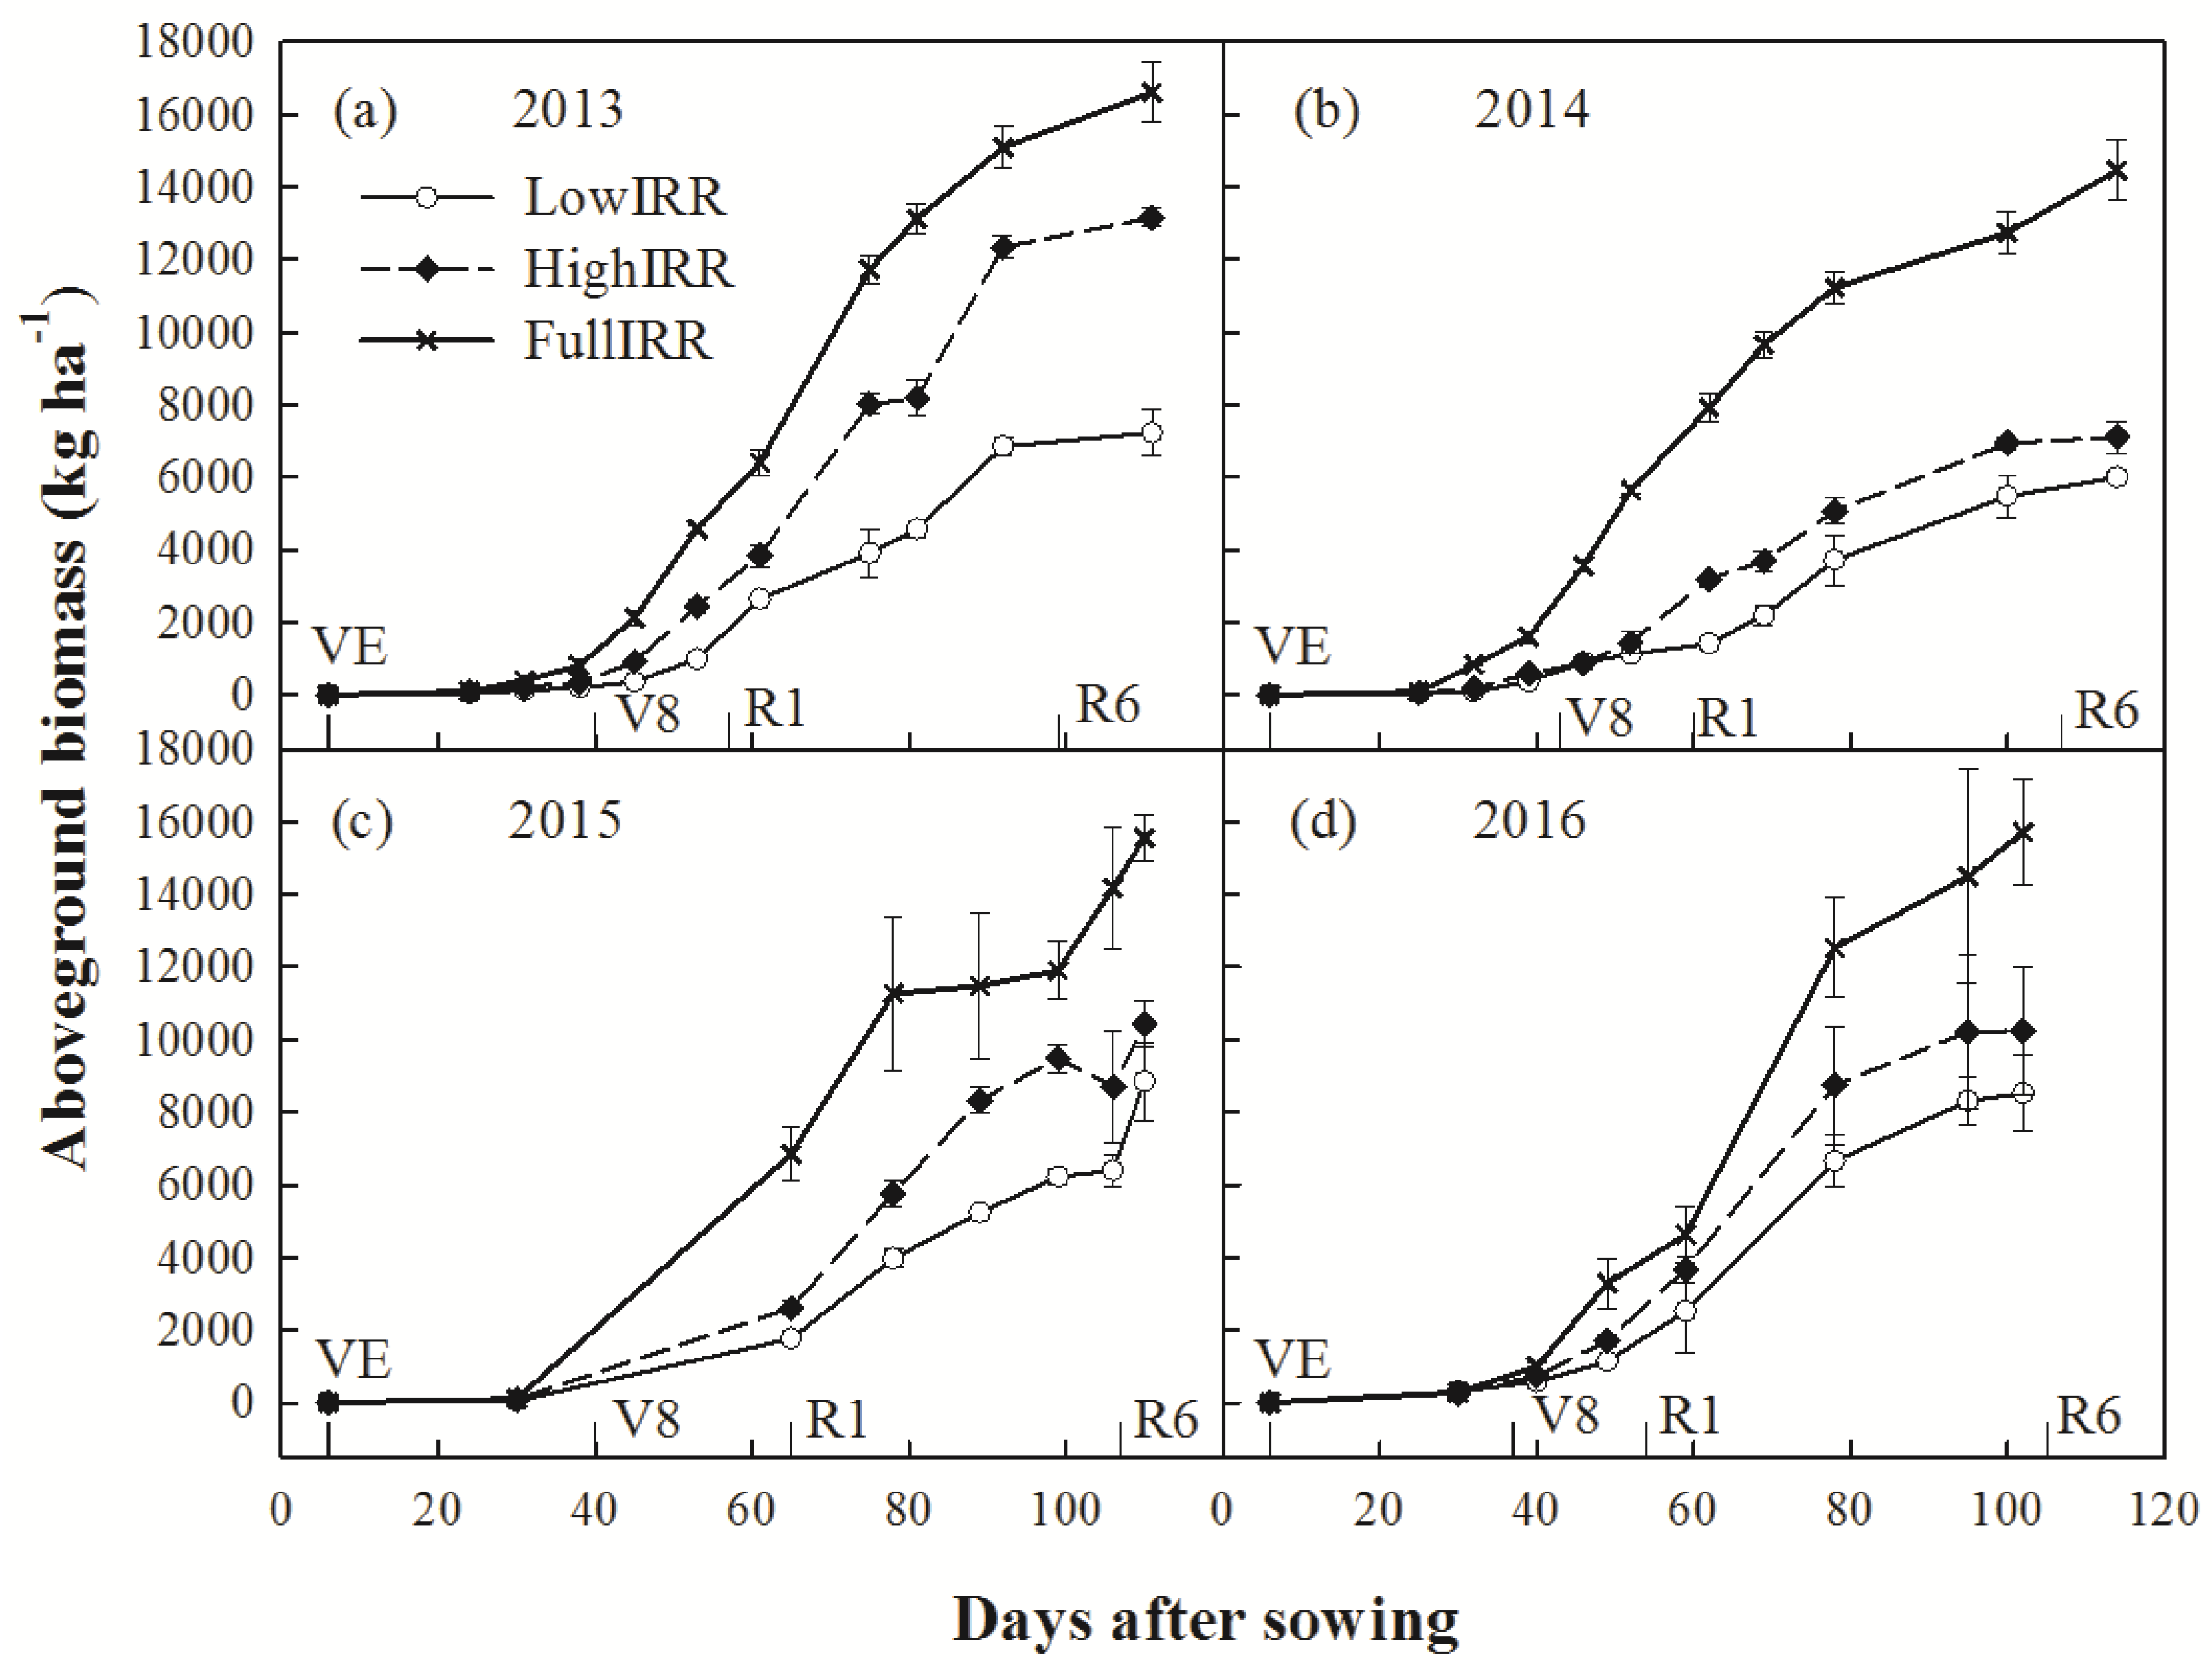
We examined how water stress affected the LAI and biomass of the maize in the three treatments. The differences in LAI and biomass among the three treatments were not significant at the seedling stage (Figure 6 and Figure 7). The FullIRR treatment generated the highest LAI and biomass values, whereas the lowest values were found in the LowIRR treatment. The maximum LAI and final biomass were 3.3 and 15,585 kg ha−1 for the FullIRR and 1.9 and 7649 kg ha−1 for the LowIRR treatments, respectively. The divergence of these two variables in the LowIRR treatment from those in the FullIRR treatment started from the eighth leaf stage due to severe water stress in the LowIRR treatment.
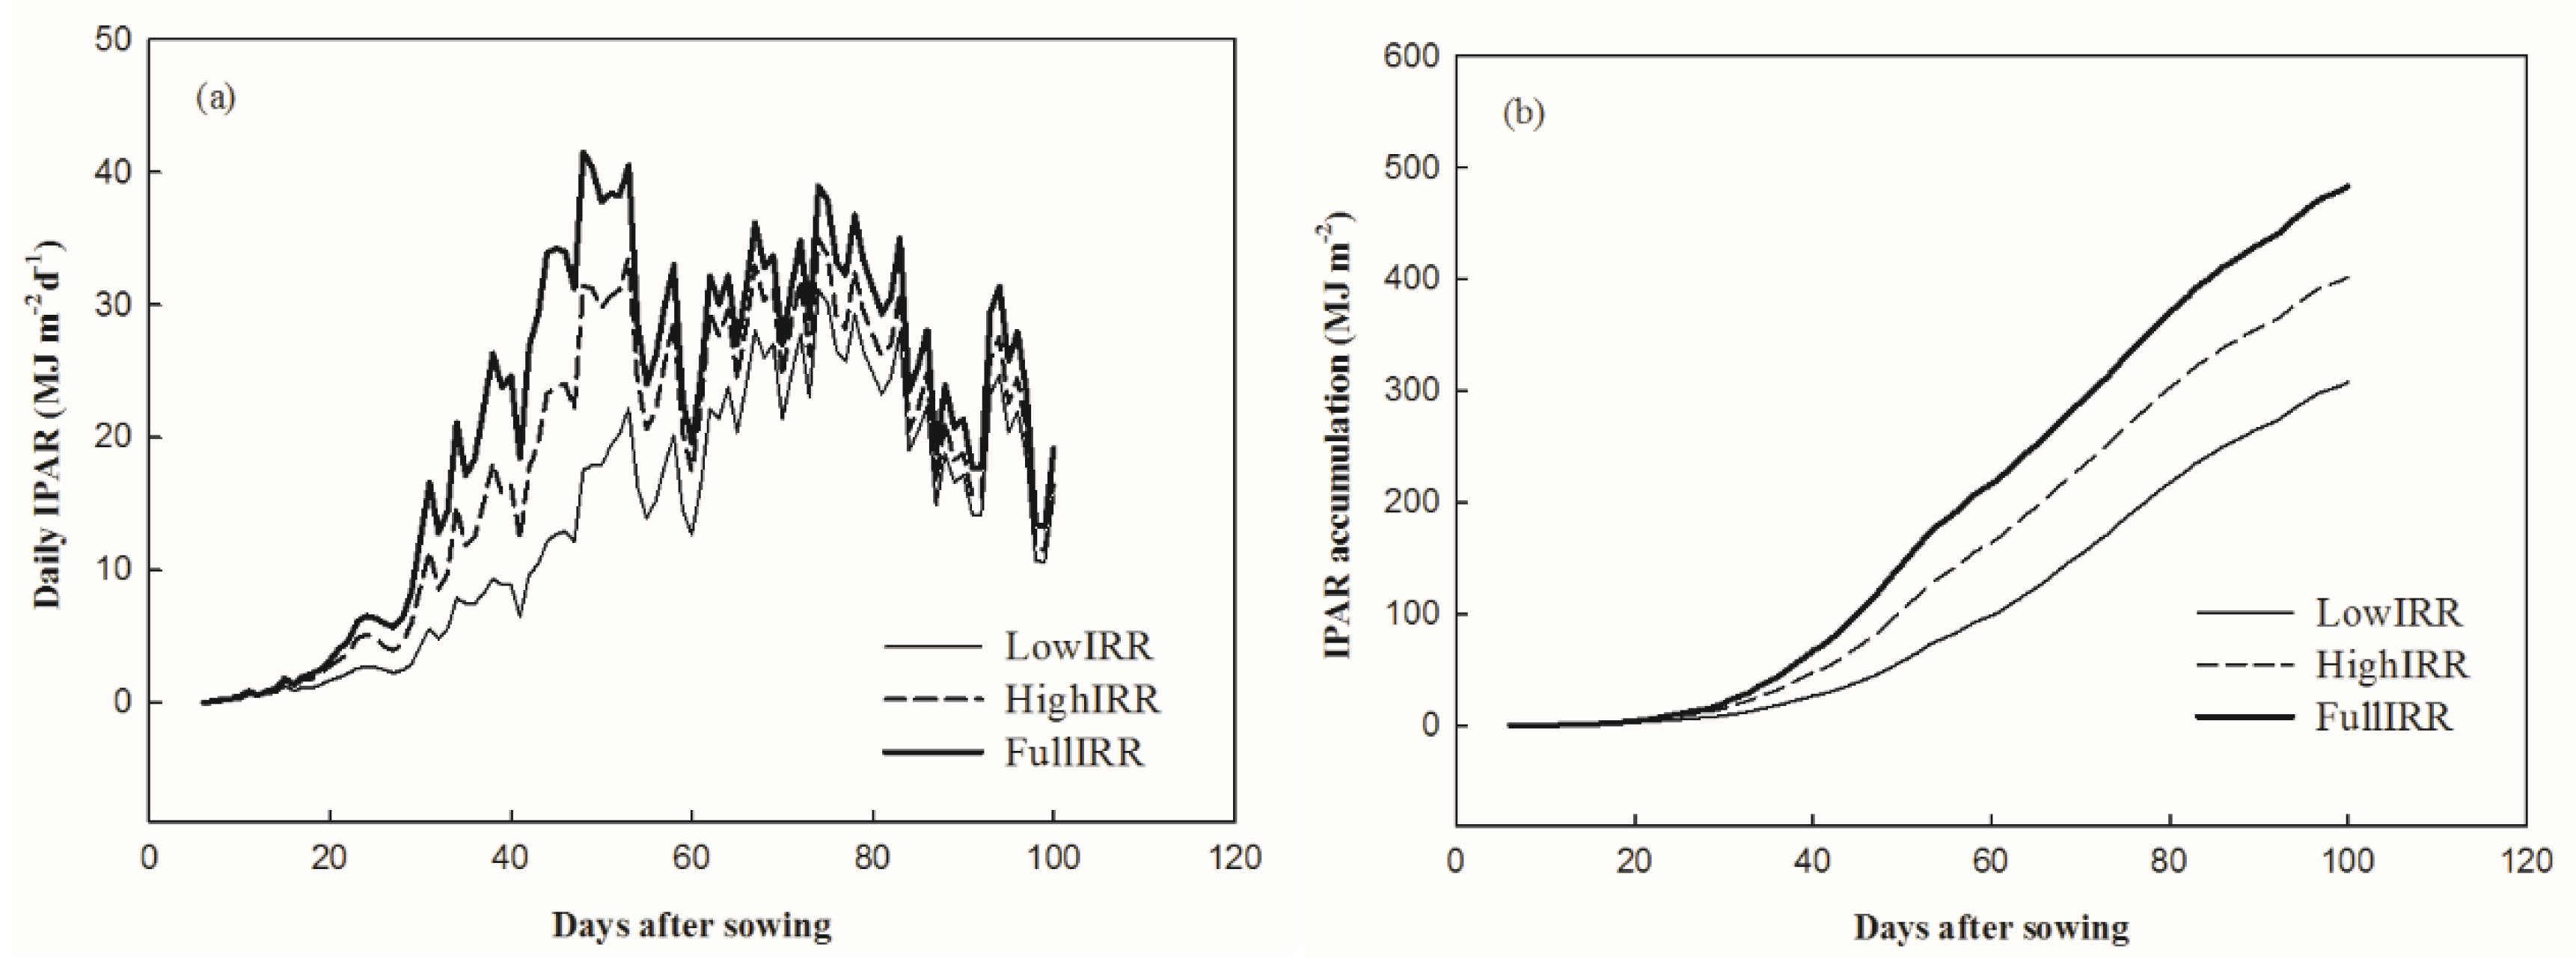
The remarkable differences in LAI and biomass between the FullIRR and HighIRR treatment were found to start at the eighth leaf stage, although the level of irrigation at this stage was the same for both treatments, and water stress was almost eliminated in the HighIRR treatment (Figure 4d–f). Such differences may be related to the photosynthetic processes that are closely associated with leaf and whole biomass growth. Total aboveground biomass accumulation is mainly related to the quantity of IPAR by the canopy and the efficiency of radiation conversion to dry matter through photosynthesis [45,46,47,48]. The daily and accumulated IPAR values (Figure 8) were the lowest under the LowIRR treatment, whereas those in FullIRR were the highest, and those in HighIRR were intermediate. The differences in daily IPAR among the three treatments were large for most of the first half of the growth period and became smaller when the LAIs approached their maximum values (Figure 8a). This was because the leaves overlapped with each other when the LAIs were high, and the leaf areas that received solar radiation were close among the three treatments, although the absolute values of the LAIs were quite different. Overall, water stress resulted in lower IPAR in all three treatments (Figure 8) and decreased photosynthesis, leading to the formation of maize smaller leaves in LowIRR and HighIRR treatments.
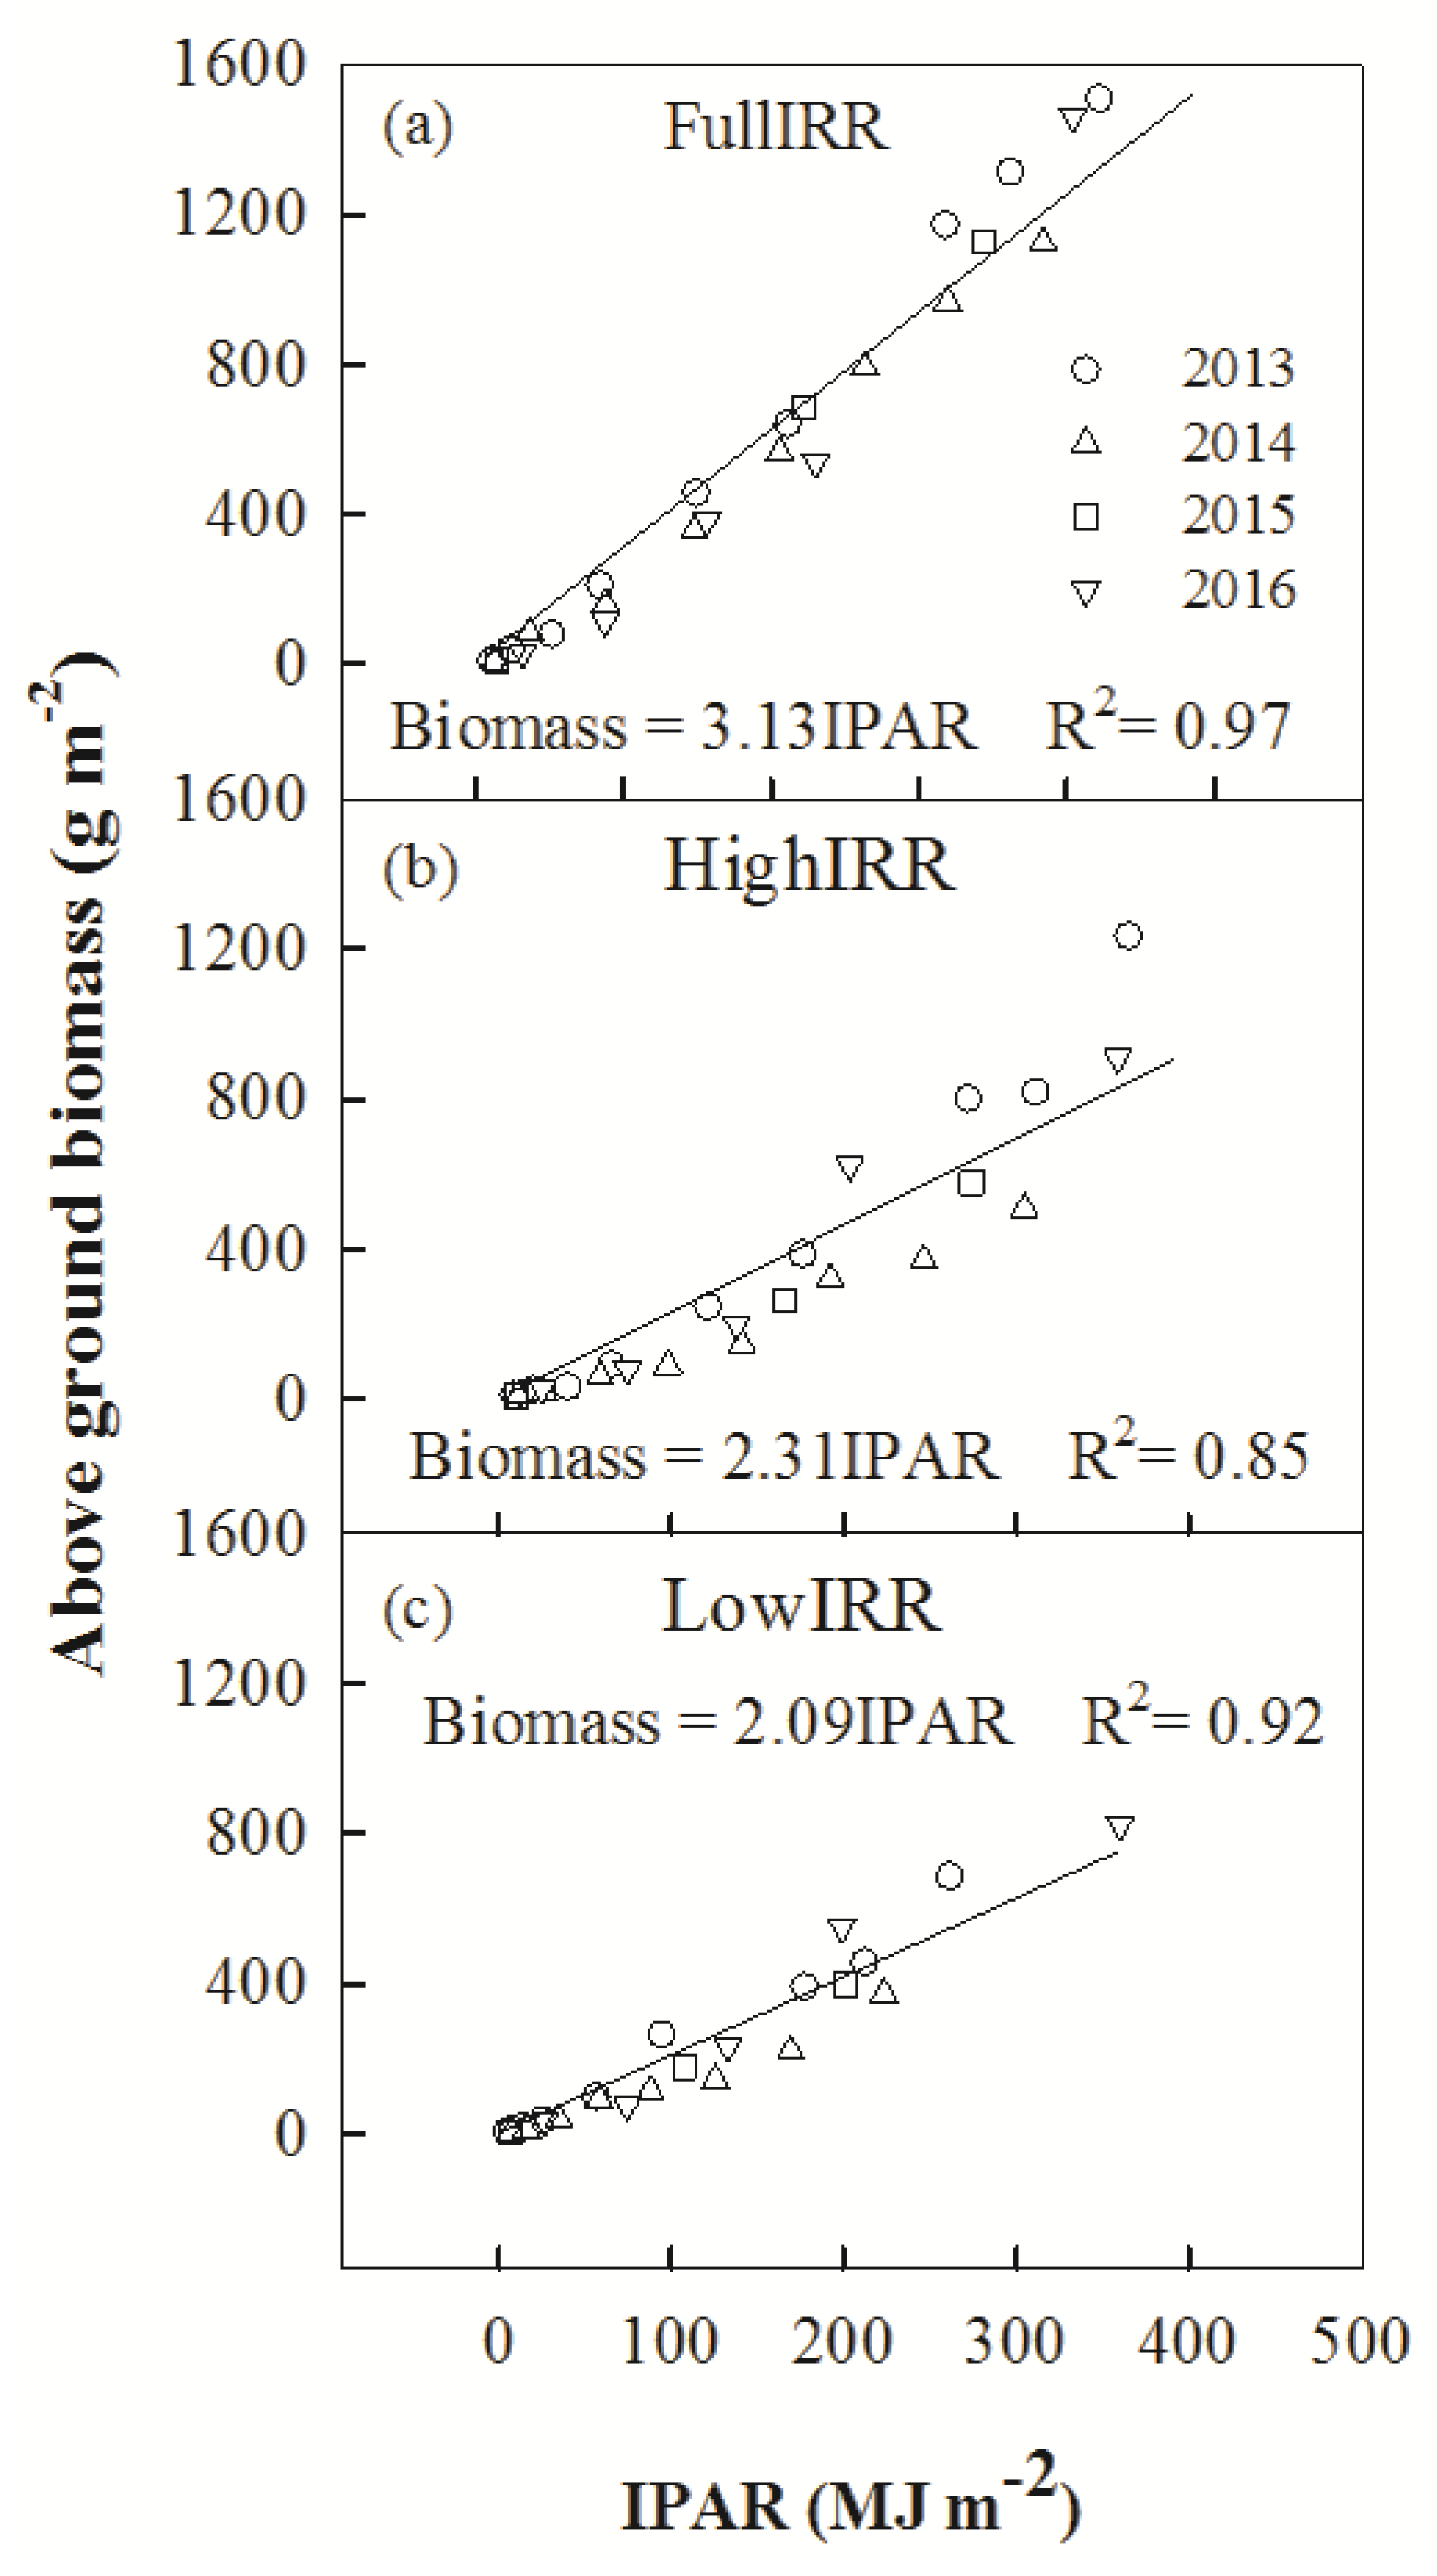
The slope of the plot of aboveground biomass versus IPAR provided an estimated of RUE based on the data for the period 2013–2016 (Figure 9). Estimates of RUE within the same treatment did not differ among years, so all IPAR and biomass data were pooled to obtain a single estimate of RUE for each treatment for all years. The estimated RUE with FullIRR was 3.13 g MJ−1, which was below the potential RUE of maize estimated from previous studies (3.39 to 4.1 g MJ−1) [49,50,51]. Such differences may be caused by differences in the maize cultivars and their growing environment. In our experiments with FullIRR, it is very likely that the maize plants did not grow under optimal conditions, resulting in lower RUE than that observed in some of these previously published studies. The estimated RUE values with HighIRR and LowIRR were 2.31 and 2.09 g MJ−1, respectively, which were lowered largely by the water stress.
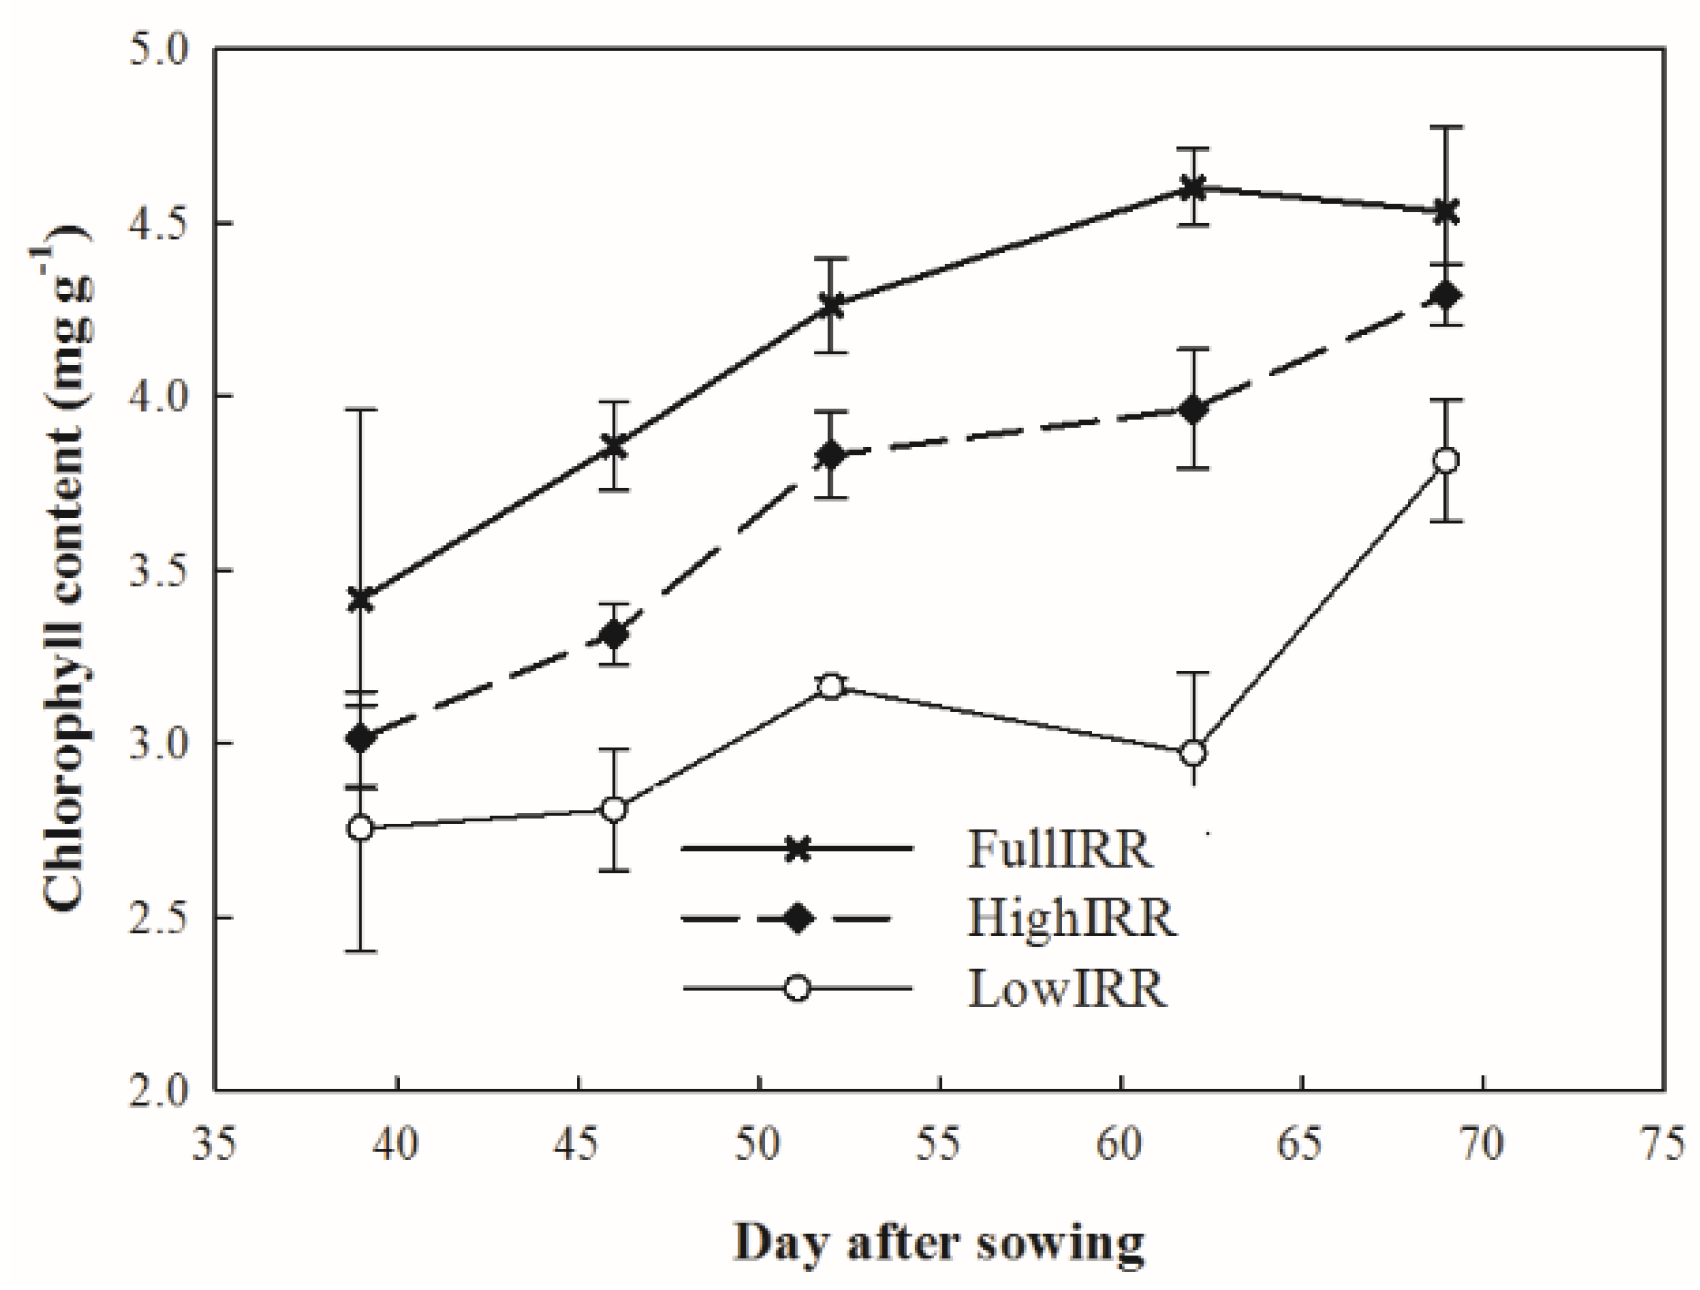
Thus, water stress significantly reduced the RUE of maize, which is also reported in the literature [52,53]. This could be related to the chlorophyll content in the leaf. Our observations indicated that the chlorophyll content in the leaf for the 2014 maize growth season decreased from FullIRR to LowIRR (Figure 10). Moreover, previous studies indicated that chlorophyll content decreased under severe and prolonged water stress conditions, leading to a reduced rate of photosynthesis [54,55,56]. Interestingly, the chlorophyll content of leaves from the HighIRR treatment remained lower than that of leaves from the FullIRR treatment after the seedling stage, although the maize plants in both treatments were irrigated with the same amount of water after the seedling stage, and water stress seldom occurred in the HighIRR treatment. Some studies have shown that prolonged water stress can lead to irreversible structural damage to the photosynthetic membrane in the leaf [57,58,59], thereby decreasing the rate of photosynthesis. This could explain the observed results for the HighIRR treatment. The cell membrane in the leaf may have been permanently damaged by the long period of water stress during the seedling stage (approximately 40 days), leading to a lower photosynthetic rate over the entire maize growth period than that in the FullIRR treatment.
3.6. Grain Yield and Unit Kernel Weight
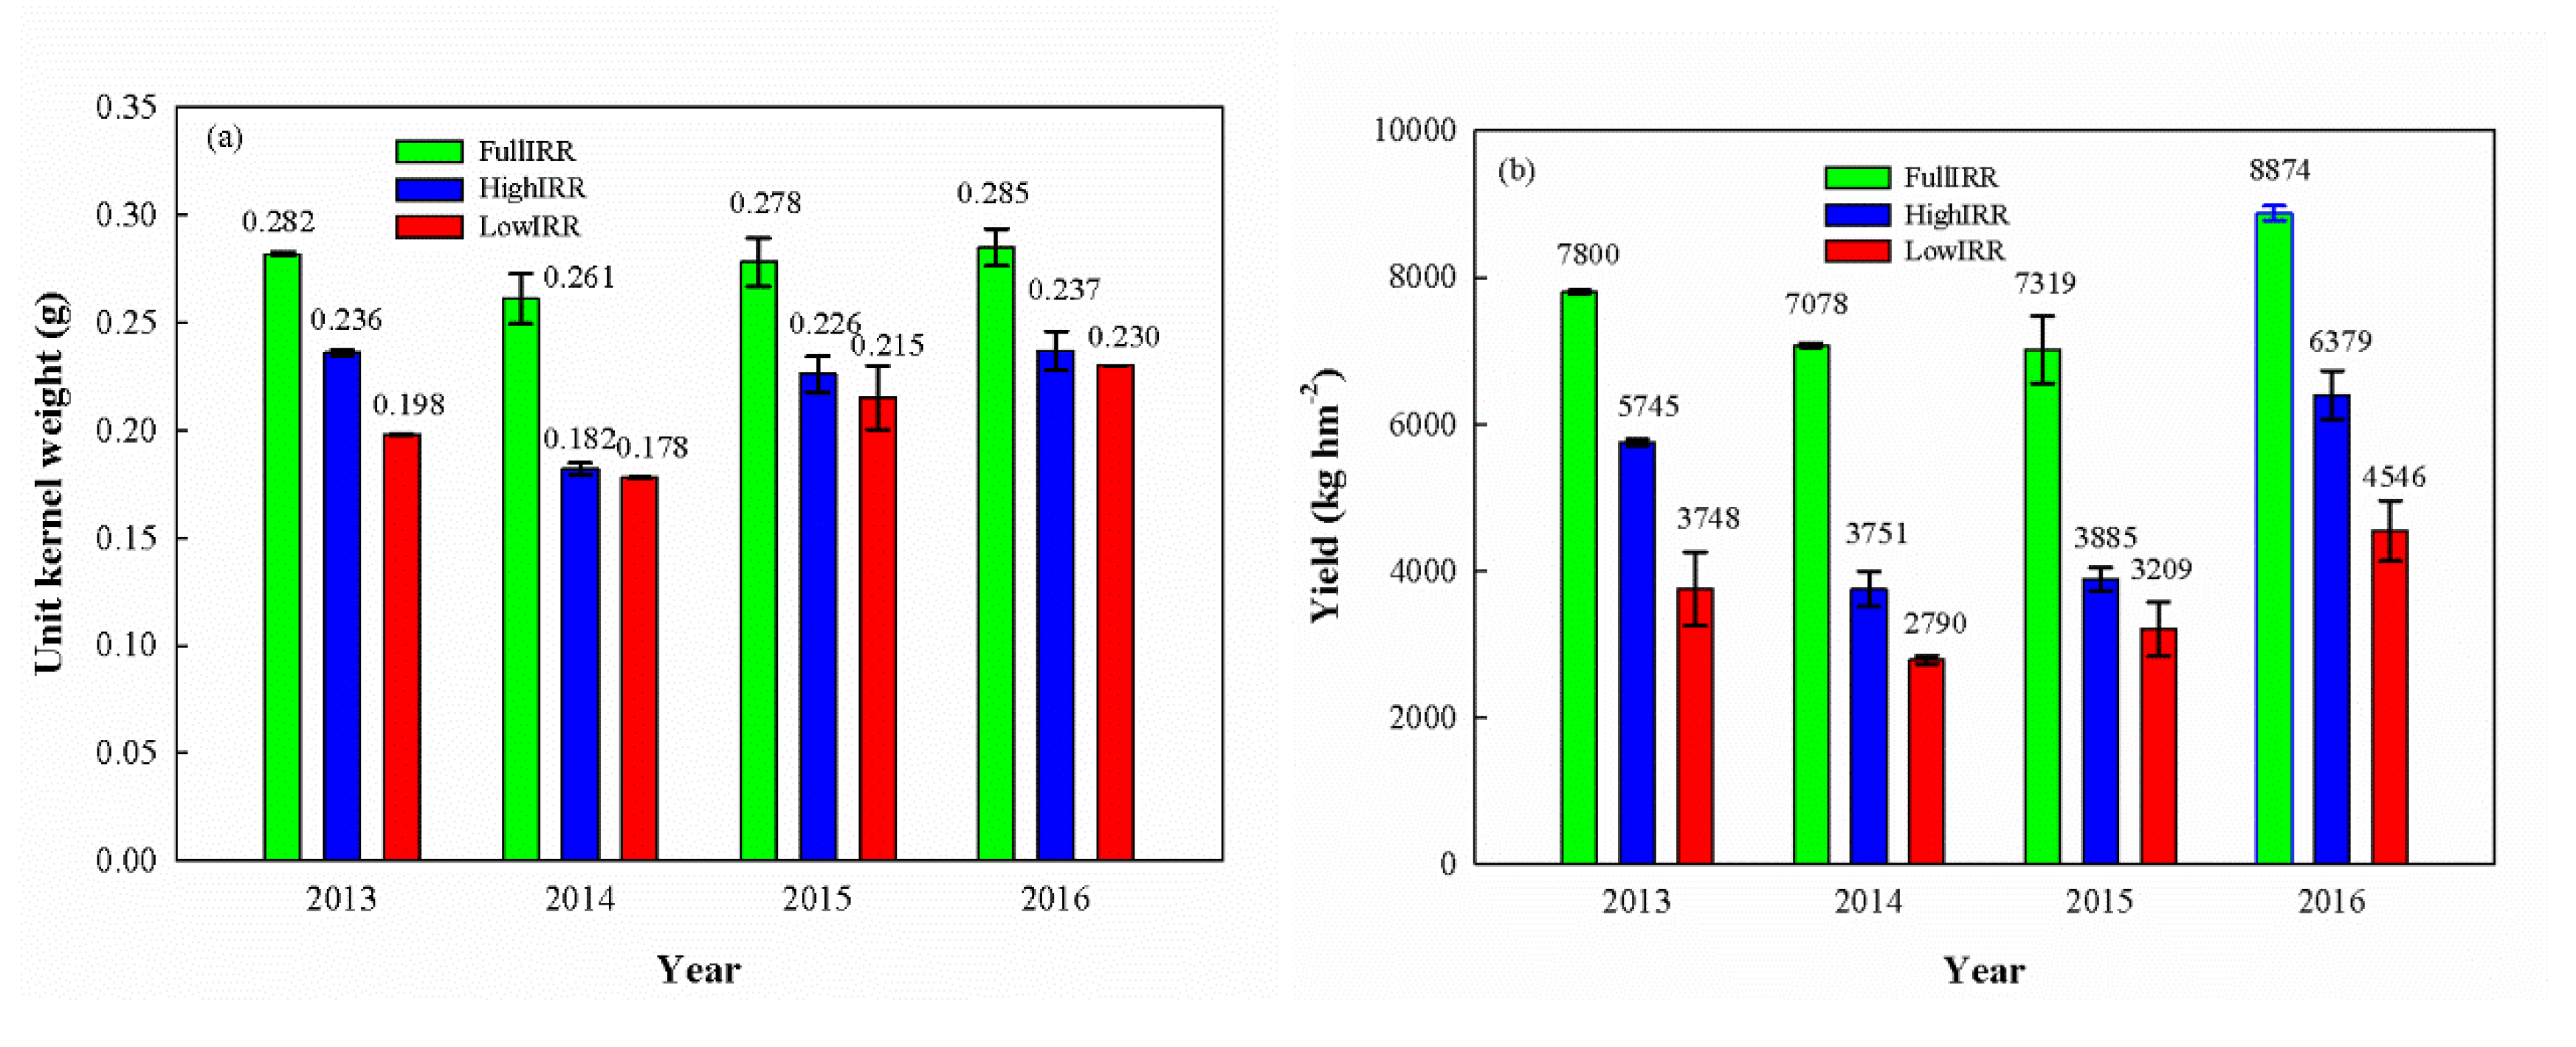
Water stress can reduce the unit kernel weight, and thus, the total yield of maize (Figure 11). The unite kernel weight, and yield in the LowIRR and HighIRR treatments were significantly lower than those in the FullIRR treatment. The water stress in our field experiments was the most severe during the seedling stage, but its effects continued throughout the reproductive growth stage, ultimately lowering the unit kernel weight and yield. In all our field tests, the FullIRR treatment in 2016 produced the highest values of unit kernel weight and yield, resulting from the highest average temperature during the maize growth period among the four years of the study (26.0 °C in 2016 versus 25.4 °C in 2013, 24.4 °C in 2014, and 24.1 °C in 2015). However, the LowIRR treatment in 2014 resulted in the lowest values of unit kernel weight and yield owing to the effect of the longest and the most severe water stress.
4. Conclusions
Field experiments conducted over four consecutive crop-growing seasons revealed that water stress during the seedling stage had a strong effect on maize growth and development, leading to lower LAI and biomass through reduced IPAR and RUE. These effects continued in the reproductive stage, thereby reducing the unit kernel weight and yield. In addition, the chlorophyll content of the leaf remained lower in plants, resulting from the water stress during the seedling stage, even when irrigation was resumed afterwards. Severe and prolonged water stress during the seedling stage may damage the structure of the photosynthetic membrane, resulting in lower chlorophyll content and RUE. In our experiments, the maize plants with such damage did not show a meaningful recovery even when the irrigation levels during the rest of the growth period were the same as those for the FullIRR treatment. Overall, these results suggest that an unrecoverable yield loss could occur if summer maize were exposed to severe and extended water stress during the seedling stage.
Our results showed that the young maize plant at the seedling stage was strongly affected by severe water stress. Such adverse effects persistently extended to the rest of the maize growth stages. These effects caused the smaller chlorophyll content in the maize plant under severe and prolonged water stress conditions, resulting in lower radiation-use efficiency. Our results further showed the aboveground biomass and yields significantly decreased. These findings are different from most previous studies that point out the most significant rate of yield and dry weight loss due to water stress during the heading stage. A further study is needed to quantify an intensity of water stress on the seedling stage of summer maize that could significantly reduce the yield.
Author Contributions
L.S. conducted the experiment, performed the analysis, and drafted the manuscript; J.J. interpreted the results, supervised the research, and edited the paper; J.H. designed the experiment and contributed ideas during analysis and interpretation.
Funding
This research was funded by the National Natural Science Foundation of China (No. 41571030), L.S. was also supported by the National Key R&D Program of China on monitoring, early warning, and prevention of major natural disasters (No. 2018YFC150703). The study was partially supported by the National Natural Science Foundation of China projects No. 91637209 and No. 91737306. J.J. was partially supported by Utah Agricultural Experiment Station.
Acknowledgments
The authors thank Ning Yao and Chao Zhang in Northwest A&F University for their help with observations.
Conflicts of Interest
The authors declare no conflict of interest.
References
- Ammani, A.A.; Ja’Afaru, A.K.; Aliyu, J.A.; Arab, A.I. Climate Change and Maize Production: Empirical Evidence from Kaduna State, Nigeria. J. Agric. Ext. 2012, 16, 1–8. [Google Scholar] [CrossRef]
- Bassu, S.; Brisson, N.; Durand, J.-L.; Boote, K.; Lizaso, J.; Jones, J.W.; Rosenzweig, C.; Ruane, A.C.; Adam, M.; Baron, C.; et al. How do various maize crop models vary in their responses to climate change factors? Glob. Chang. Boil. 2014, 20, 2301–2320. [Google Scholar] [CrossRef] [PubMed]
- Ramirez-Cabral, N.Y.Z.; Kumar, L.; Shabani, F. Global alterations in areas of suitability for maize production from climate change and using a mechanistic species distribution model (CLIMEX). Sci. Rep. 2017, 7, 5910. [Google Scholar] [CrossRef] [PubMed]
- Jones, P.G.; Thornton, P.K. The potential impacts of climate change on maize production in Africa and Latin America in 2055. Glob. Environ. Chang. 2003, 13, 51–59. [Google Scholar] [CrossRef]
- Shan, L.; Deng, X.; Kang, S. Current situation and perspective of agricultural water used in semiarid area of China. J. Hydraul. Eng. 2002, 27–31. [Google Scholar] [CrossRef]
- Bradford, K.J.; Hsiao, T.C. Physiological Responses to Moderate Water Stress. Physiol. Plant Ecol. II 1982, 12, 263–324. [Google Scholar]
- Hsiao, T.C. Plant Responses to Water Stress. Annu. Rev. Plant Physiol. 1973, 24, 519–570. [Google Scholar] [CrossRef]
- Kramer, P.J. Water stress and plant growth. Agron. J. 1963, 55, 31–35. [Google Scholar] [CrossRef]
- Liu, S.; Mo, X.; Lin, Z.; Xu, Y.; Ji, J.; Wen, G.; Richey, J. Crop yield responses to climate change in the Huang-Huai-Hai Plain of China. Agric. Water Manag. 2010, 97, 1195–1209. [Google Scholar] [CrossRef]
- Ren, X.; Zhang, P.; Chen, X.; Guo, J.; Jia, Z. Effect of Different Mulches under Rainfall Concentration System on Corn Production in the Semi-arid Areas of the Loess Plateau. Sci. Rep. 2016, 6, 19019. [Google Scholar] [CrossRef]
- Ritchie, J.T. Soil water balance and plant water stress. In Understanding Options for Agricultural Production; Springer: Berlin/Heidelberg, Germany, 1998; pp. 41–54. [Google Scholar] [CrossRef]
- Song, L.; Zhang, C. Changing Features of Precipitation over Nothwest China During the 20th Century. J. Glaciol. Geocryol. 2003, 25, 143–148. [Google Scholar] [CrossRef]
- Tezara, W.; Mitchell, V.J.; Driscoll, S.D.; Lawlor, D.W. Water stress inhibits plant photosynthesis by decreasing coupling factor and ATP. Nature 1999, 401, 914–917. [Google Scholar] [CrossRef]
- Bu, L.; Zhang, R.; Chang, Y.; Xue, J.; Han, M. Response of photosynthetic characteristics to water stress of maize leaf in seeding. Acta Ecol. Sin. 2010, 30, 1184–1191. [Google Scholar] [CrossRef]
- Chang, J.; Yang, D.; Tan, W.; Yueshang, L.U. Effects of water stress on maize leaf photosynthesis. J. Northeast Agric. Univ. 2008, 39, 1–5. [Google Scholar] [CrossRef]
- Chaves, M.M.; Pereira, J.S.; Maroco, J.; Rodrigues, M.L.; Ricardo, C.P.P.; Osório, M.L.; Carvalho, I.; Faria, T.; Pinheiro, C. How Plants Cope with Water Stress in the Field. Photosynthesis and Growth. Ann. Bot. 2002, 89, 907–916. [Google Scholar] [CrossRef]
- Nesmith, D.S.; Ritchie, J.T. Short-and Long-Term Responses of Corn to a Pre-Anthesis Soil Water Deficit. Agron. J. 1992, 84, 107–113. [Google Scholar] [CrossRef]
- Ge, T.; Sui, F.; Bai, L.; Lu, Y.-Y.; Zhou, G. Effects of Different Soil Water Content on the Photosynthetic Character and Pod Yields of Summer Maize. J. Shanghai Jiaotong Univ. 2005, 23, 143–147. [Google Scholar]
- Zhang, W.; Shen, X. Effects of water stress and rewatering on photosynthetic rate of maize leaf. Acta Agric. Boreall Sin. 1994, 44–47. [Google Scholar] [CrossRef]
- Zhang, Z.P.; Hua, Q.I.; Zhang, Y.; Sun, S.X.; Yang, G.H. Effects of water stress on photosynthetic rate and water use efficiency of maize. Acta Agric. Boreali Sin. 2009, 24, 155–158. [Google Scholar] [CrossRef]
- Çakir, R. Effect of water stress at different development stages on vegetative and reproductive growth of corn. Field Crop. Res. 2004, 89, 1–16. [Google Scholar] [CrossRef]
- Chaves, M.M.; Marôco, J.P.; Pereira, J.S.; Chaves, M.M. Understanding plant responses to drought—From genes to the whole plant. Funct. Plant Boil. 2003, 30, 239–264. [Google Scholar] [CrossRef]
- Ge, T.; Sui, F.; Bai, L.; Tong, C.; Sun, N. Effects of water stress on growth, biomass partitioning, and water-use efficiency in summer maize (Zea mays L.) throughout the growth cycle. Acta Physiol. Plant. 2012, 34, 1043–1053. [Google Scholar] [CrossRef]
- He, J.; Wen, R.; Tian, S.; Su, Y.; He, X.; Su, Y.; Cheng, W.; Huang, K.; Zhang, S. Effects of drought stress and re-watering on growth and yield of various maize varieties at tasseling stage. J. South. Agric. 2017. [Google Scholar] [CrossRef]
- Salvador, R.J. Proposed standard system of nomenclature for maize grain filling events and concepts. Maydica 1995, 40, 141–146. [Google Scholar]
- Ding, D.; Cai, H.; Wang, J.; Zhang, X. A study on compensative growth of maize under regulated deficit irrigation. Agric. Res. Arid Areas 2006, 3, 64–67. [Google Scholar] [CrossRef]
- Doorenbos, J.; Kassam, A.H.; Bentvelsen, C.; Uittenbogaard, G. Yield response to water [Near East]. Nat Mater. 1978. [Google Scholar] [CrossRef]
- Kang, S.; Shi, W.; Zhang, J. An improved water-use efficiency for maize grown under regulated deficit irrigation. Field Crop. Res. 2000, 67, 207–214. [Google Scholar] [CrossRef]
- Kirda, C. Deficit Irrigation Scheduling Based on Plant Growth Stages Showing Water Stress Tolerance; Water Reports 2002; Food and Agricultural Organization of the United Nations, Deficit Irrigation Practices: Rome, Italy, 2002; Volume 22. [Google Scholar]
- Tariq, J.; Usman, K. Regulated deficit irrigation scheduling of maize crop. Sarhad J. Agric. 2009, 25, 441–450. [Google Scholar]
- Igbadun, H.E.; Tarimo, A.K.; Salim, B.A.; Mahoo, H.F. Evaluation of selected crop water production functions for an irrigated maize crop. Agric. Water Manag. 2007, 94, 1–10. [Google Scholar] [CrossRef]
- Hanway, J.J. How a Corn Plant Develops; Iowa State University Digital Press: Ames, IA, USA, 1966. [Google Scholar]
- Allen, R.G.; Pereira, L.S.; Raes, D.; Smith, M. Crop Evapotranspiration-Guidelines for Computing Crop Water Requirements-FAO Irrigation and Drainage Paper 56; FAO: Rome, Italy, 1998; Volume 300, p. D05109. [Google Scholar]
- McKee, G.W. A Coefficient for Computing Leaf Area in Hybrid Corn1. Agron. J. 1964, 56, 240. [Google Scholar] [CrossRef]
- Brown, D.M. CERES-Maize: A Simulation Model of Maize Growth and Development; Jones, C.A., Kiniry, J.R., Eds.; Texas A & M University Press: College Station, TX, USA, 1986. [Google Scholar]
- Monteith, J. Light Interception and Radiative Exchange in Crop Stands; Physiol Aspects Crop Yield Proc Symp 1969, acsesspublicati, (physiologicalas); Agronomy—Faculty Publications: Lincoln, NE, USA, 1969. [Google Scholar]
- Monteith, J.L. Solar Radiation and Productivity in Tropical Ecosystems. J. Appl. Ecol. 1972, 9, 747. [Google Scholar] [CrossRef] [Green Version]
- Andresen, J.A.; Alagarswamy, G.; Rotz, C.A.; Ritchie, J.T.; LeBaron, A.W. Weather Impacts on Maize, Soybean, and Alfalfa Production in the Great Lakes Region, 1895–1996. Agron. J. 2001, 93, 1059. [Google Scholar] [CrossRef]
- Bu, L.-D.; Liu, J.-L.; Zhu, L.; Luo, S.-S.; Chen, X.-P.; Li, S.-Q.; Hill, R.L.; Zhao, Y. The effects of mulching on maize growth, yield and water use in a semi-arid region. Agric. Water Manag. 2013, 123, 71–78. [Google Scholar] [CrossRef]
- Muchow, R.C.; Sinclair, T.R.; Bennett, J.M. Temperature and Solar Radiation Effects on Potential Maize Yield across Locations. Agron. J. 1990, 82, 338–343. [Google Scholar] [CrossRef]
- Farré, I.; Faci, J.M. Comparative response of maize (Zea mays L.) and sorghum (Sorghum bicolor L. Moench) to deficit irrigation in a Mediterranean environment. Agric. Water Manag. 2006, 83, 135–143. [Google Scholar] [CrossRef]
- Kefale, D.; Ranamukhaarachchi, S. Response of maize varieties to drought stress at different phenological stages in Ethiopia. Trop. Sci. 2004, 44, 61–66. [Google Scholar] [CrossRef]
- Traoré, S.B.; Carlson, R.E.; Pilcher, C.D.; Rice, M.E. Bt and Non-Bt Maize Growth and Development as Affected by Temperature and Drought Stress. Agron. J. 2000, 92, 1027. [Google Scholar] [CrossRef]
- Abrecht, D.; Carberry, P. The influence of water deficit prior to tassel initiation on maize growth, development and yield. Field Crop. Res. 1993, 31, 55–69. [Google Scholar] [CrossRef]
- Boote, K.J.; Loomis, R.S.; Norman, J.M.; Arkebauer, T.J. Predicting Canopy Photosynthesis and Light-Use Efficiency from Leaf Characteristics. Yield Gains Major US Field Crops 1991, 75–94. [Google Scholar] [CrossRef]
- Kiniry, J.; Jones, C.; O’Toole, J.; Blanchet, R.; Cabelguenne, M.; Spanel, D. Radiation-use efficiency in biomass accumulation prior to grain-filling for five grain-crop species. Field Crop. Res. 1989, 20, 51–64. [Google Scholar] [CrossRef]
- Monteith, J.L.; Moss, C.J. Climate and the efficiency of crop production in britain. Philos. Trans. R. Soc. Lond. 1977, 281, 277–294. [Google Scholar] [CrossRef]
- Sinclair, T.R.; Muchow, R.C. Radiation use efficiency. Adv. Agron. 1999, 65, 215–265. [Google Scholar] [CrossRef]
- Lindquist, J.L.; Arkebauer, T.J.; Walters, D.T.; Cassman, K.G.; Dobermann, A. Maize Radiation Use Efficiency under Optimal Growth Conditions. Agron. J. 2005, 97, 72. [Google Scholar] [CrossRef]
- Loomis, R.; Amthor, J. Yield Potential, Plant Assimilatory Capacity, and Metabolic Efficiencies. Crop. Sci. 1999, 39, 1584. [Google Scholar] [CrossRef]
- Otegui, M.; Andrade, F.; Suero, E. Growth, water use, and kernel abortion of maize subjected to drought at silking. Field Crop. Res. 1995, 40, 87–94. [Google Scholar] [CrossRef]
- Earl, H.J.; Davis, R.F. Effect of drought stress on leaf and whole canopy radiation use efficiency and yield of maize. Agron. J. 1992, 95, 688–696. [Google Scholar] [CrossRef]
- Stone, P.J.; Wilson, D.R.; Reid, J.B.; Gillespie, R.N.; Stone, P.J.; Wilson, D.R.; Reid, J.B.; Gillespie, R.N. Water deficit effects on sweet corn. I. Water use, radiation use efficiency, growth, and yield. Crop Pasture Sci. 2001, 52, 103–113. [Google Scholar] [CrossRef]
- Alaei, Y.; Khabiri, E. Effects of two biologic fertilizers containing amino acids on leaf chlorophyll index in bread wheat cultivars in greenhouse. Medienwiss. Rez. Rev. 2012, 2, 1333–1336. [Google Scholar]
- Castrillo, M.; Calcagno, A.M. Effects of water stress and re watering on ribulose-1,5-bis-phosphate carboxylase activity, chlorophyll and protein contents in two cultivars of tomato. J. Hortic. Sci. 1989, 64, 717–724. [Google Scholar] [CrossRef]
- Fani, E. Changes chlorophyll b in response to drought stress in alfalfa (vs. Nick Urban) in climatic conditions of the south west Iran. Am. J. Biochem. Biotechnol. 2012, 1, 107–110. [Google Scholar]
- Anjum, S.A.; Xie, X.; Wang, L.; Saleem, M.F.; Man, C.; Lei, W. Morphological, physiological and biochemical responses of plants to drought stress. Afr. J. Agric. Res. 2011, 6, 2026–2032. [Google Scholar] [CrossRef]
- Cornic, G.; Massacci, A. Leaf photosynthesis under drought stress. In Photosynthesis and the Environment; Springer: Berlin/Heidelberg, Germany, 1996; pp. 347–366. [Google Scholar] [CrossRef]
- Farooq, M.; Wahid, A.; Lee, D.-J. Exogenously applied polyamines increase drought tolerance of rice by improving leaf water status, photosynthesis and membrane properties. Acta Physiol. Plant. 2009, 31, 937–945. [Google Scholar] [CrossRef]
Figure 1.
(a) Yangling, Shaanxi, China, the study location, (b) the field and the plastic shelter, (c) maize plants growing in a plot.
Figure 1.
(a) Yangling, Shaanxi, China, the study location, (b) the field and the plastic shelter, (c) maize plants growing in a plot.


Figure 2.
The temperature (a) and relative humidity (b) during the different growth stages of summer maize in 2013, 2014, 2015, and 2016 at the experimental site.
Figure 2.
The temperature (a) and relative humidity (b) during the different growth stages of summer maize in 2013, 2014, 2015, and 2016 at the experimental site.

Figure 3.
The measured ranges of the LAI (a,b,c) and aboveground biomass (d,e,f) of the summer maize with water stress during different maize growth stages and FullIRR for our study periods. FullIRR is for full irrigation (a,d), HighIRR is for high irrigation (b,e), and LowIRR is for low irrigation (c,f). SDS is for the seedling stage stress, JTS is for the jointing stage stress, HDS is for the heading stage stress, and GFS is for the grain-filling stage stress.

Figure 4.
Available soil water storage of the top 1 m of the soil layer of the experimental field cultivated with summer maize under water stress at seedling stage and FullIRR treatments during three crop seasons of 2013 (a,d,g), 2014 (b,e,h), and 2015 (c,f,i) (data for 2016 are not shown because they are incomplete). The bar represents the irrigation (IRR), the solid line with dots represents available soil water storage (ASW), and the dashed line represents the threshold available soil water (TASW) below which symptoms of water stress occurs.

Figure 5.
Duration of different growth stages of summer maize in the crop season of 2013 (a) and 2014 (b), (data for 2015 and 2016 are not shown because they are incomplete). The letters VE, V8, R1, R6, and HA represent the dates of seedling emergence, eighth leaf, silking, maturity, and harvest, respectively. PE is the pre-emergence stage, i.e., the time from sowing date until emergence, VS is the vegetative stage, i.e., the time from seedling emergence until silking, RS is the reproductive stage, i.e., the time from silking until the attainment of physiological maturity.

Figure 6.
Leaf area index of summer maize under water stress during seedling stage and FullIRR treatments in the crop seasons of 2013 (a), 2014 (b), 2015 (c), and 2016 (d). The bold line with a cross represents full irrigation (FullIRR), dashed line with a solid circle represents high irrigation (HighIRR), and solid line with an open circle represents low irrigation (LowIRR). The letters VE, V8, R1, and R6 represent the dates of seedling emergence, eighth leaf, silking, and maturity, respectively.

Figure 7.
Aboveground biomass of summer maize under water stress during seedling stage and FullIRR treatments in the crop seasons of 2013 (a), 2014 (b), 2015 (c), and 2016 (d). The bold line with a cross represents full irrigation (FullIRR), dashed line with a solid circle represents high irrigation (HighIRR), and solid line with an open circle represents low irrigation (LowIRR). The letters VE, V8, R1, and R6 represent the dates of seedling emergence, eighth leaf, silking, and maturity, respectively.

Figure 8.
The average change in the daily (a) and accumulative (b) IPAR of summer maize subjected to LowIRR, HighIRR, and FullIRR treatments in the growing seasons of 2013 to 2016.
Figure 8.
The average change in the daily (a) and accumulative (b) IPAR of summer maize subjected to LowIRR, HighIRR, and FullIRR treatments in the growing seasons of 2013 to 2016.

Figure 9.
Cumulative maize aboveground biomass as a function of cumulative intercepted photosynthetically active radiation (IPAR) for FullIRR (a), HighIRR (b), and LowIRR (c) treatments.
Figure 9.
Cumulative maize aboveground biomass as a function of cumulative intercepted photosynthetically active radiation (IPAR) for FullIRR (a), HighIRR (b), and LowIRR (c) treatments.

Figure 10.
The chlorophyll content of the leaves of maize plants subjected to the FullIRR, HighIRR, and LowIRR treatments in the growing season in 2014.
Figure 10.
The chlorophyll content of the leaves of maize plants subjected to the FullIRR, HighIRR, and LowIRR treatments in the growing season in 2014.

Figure 11.
The unit kernel weight (a) and yield (b) of the summer maize with LowIRR, HighIRR, and FullIRR treatments during the growing seasons of 2013, 2014, 2015, and 2016.
Figure 11.
The unit kernel weight (a) and yield (b) of the summer maize with LowIRR, HighIRR, and FullIRR treatments during the growing seasons of 2013, 2014, 2015, and 2016.


Table 1.
Field management times for the four growing seasons.
| Season | Time | ||
|---|---|---|---|
| Planting | Emergence | Harvest | |
| 2013 | June 12 | June 18 | October 7 |
| 2014 | June 12 | June 18 | October 10 |
| 2015 | June 11 | June 16 | October 3 |
| 2016 | June 13 | June 19 | September 27 |
Table 2.
The irrigation management during field experiments conducted from 2013 to 2016 during the growth season of maize. FullIRR is full irrigation, HighIRR is high irrigation, and LowIRR is low irrigation. SDS is for the seedling stage stress, JTS is for the jointing stage stress, HDS is for the heading stage stress, and GFS is for the grain-filling stage stress.
| Treatments | Growth Stages | Total Irrigation Water (mm) | ||||
|---|---|---|---|---|---|---|
| Seedling | Jointing | Heading | Grain Filling | |||
| FullIRR | 110 | 110 | 110 | 110 | 440 | |
| HighIRR | SDS | 0 | 110 | 110 | 110 | 330 |
| JTS | 110 | 0 | 110 | 110 | 330 | |
| HDS | 110 | 110 | 0 | 110 | 330 | |
| GFS | 110 | 110 | 110 | 0 | 330 | |
| LowIRR | SDS | 0 | 70 | 70 | 70 | 210 |
| JTS | 70 | 0 | 70 | 70 | 210 | |
| HDS | 70 | 70 | 0 | 70 | 210 | |
| GFS | 70 | 70 | 70 | 0 | 210 | |
Table 3.
Water stress factors and variables of maize growth under water stress during different maize growth stages and FullIRR. SDS is for the seedling stage stress, JTS is for the jointing stage stress, HDS is for the heading stage stress, and GFS is for the grain-filling stage stress.
Table 3.
Water stress factors and variables of maize growth under water stress during different maize growth stages and FullIRR. SDS is for the seedling stage stress, JTS is for the jointing stage stress, HDS is for the heading stage stress, and GFS is for the grain-filling stage stress.
| Treatments | Ks1 | Ks2 | LAImax | Canopy Height (cm) | Biomass (kg/ha) | Unit Kernel Weight (g) | Kernels Per Spike | Yield (kg/ha) | |
|---|---|---|---|---|---|---|---|---|---|
| FullIRR | 1.00 | 3.4 a | 216 | 17,353 a | 0.277 a | 544 a | 7768 a | ||
| HighIRR | SDS | 0.63 | 1.00 | 2.5 cd | 195 | 10,664 bc | 0.221 cd | 433 c | 4945 d |
| JTS | 0.71 | 1.00 | 3.0 ab | 193 | 12,591 bc | 0.245 bc | 462 b | 5588 c | |
| HDS | 0.49 | 1.00 | 3.1 ab | 211 | 14,276 ab | 0.255 ab | 458 b | 6212 b | |
| GFS | 0.53 | 1.00 | 3.0 ab | 205 | 14,193 ab | 0.238 bc | 485 a | 5822 b | |
| LowIRR | SDS | 0.33 | 0.92 | 2.1 d | 172 | 8678 d | 0.205 d | 368 d | 3573 f |
| JTS | 0.25 | 0.95 | 2.7 bc | 162 | 9145 cd | 0.224 bcd | 366 d | 3868 e | |
| HDS | 0.53 | 0.62 | 2.7 bc | 184 | 10,071 c | 0.240 b | 374 cd | 4455 de | |
| GFS | 0.48 | 0.65 | 2.7 bc | 185 | 10,711 bc | 0.221 bcd | 456 b | 4676 de | |
| F values (ANOVA) | -- | -- | 2.32 * | 2.18 | 6.09 * | 5.83 * | 3.63 * | 7.31 * | |
Note: The data were averaged over four seasons (2013 to 2016). Values followed by different letters within one column are significantly different (p < 0.05) by least significant differences of Duncan’s new multiple range test. The sign * behind F-values of ANOVA in the bottom row indicates that the difference of the variable in the column between different irrigation groups is significant with p < 0.05. LAImax represented the maximum value of leaf area index.
Table 4.
ET, IWUE, WUE, and ky under water stress during different maize growth stages and FullIRR.
| Treatments | ET in Each Growth Stage (mm) | Total ET (mm) | IWUE (kg m−3) | WUE (kg m−3) | ky | ||||
|---|---|---|---|---|---|---|---|---|---|
| Seedling | Jointing | Heading | Grain Filling | ||||||
| FullIRR | 125 a | 113 a | 112 a | 98 a | 448 a | 1.68 | 1.65 | -- | |
| HighIRR | SDS | 39 de | 74 b | 119 a | 95 a | 326 b | 1.35 | 1.37 | 1.47 |
| JTS | 123 a | 40 cd | 89 ab | 83 a | 336 b | 1.61 | 1.58 | 1.11 | |
| HDS | 115 a | 106 a | 49 b | 64 ab | 334 b | 1.83 | 1.81 | 0.79 | |
| GFS | 107 ab | 112 a | 111 a | 19 c | 350 b | 1.65 | 1.56 | 1.30 | |
| LowIRR | SDS | 27 e | 48 bcd | 75 ab | 46 b | 196 c | 1.55 | 1.65 | 1.00 |
| JTS | 74 bcd | 32 d | 51 b | 47 b | 203 c | 1.62 | 1.67 | 0.98 | |
| HDS | 77 bc | 69 bc | 30 b | 40 b | 216 c | 2.04 | 1.99 | 0.82 | |
| GFS | 66 cd | 67 bc | 76 ab | 15 c | 224 c | 2.07 | 1.97 | 0.85 | |
| F values (ANOVA) | 9.95 * | 10.88 * | 3.01 * | 7.35 * | 45.5 * | 1.69 | 1.37 | 1.38 | |
Note: The data were averaged over the 2013, 2014, and 2015 seasons (2016 is not included because the soil data for that year are incomplete). Values followed by different letters within one column are significantly different (p < 0.05) by least significant differences of Duncan’s new multiple range test. The sign * behind F-values of ANOVA in the bottom row indicates that the difference of the variable in the column between different irrigation groups is significant with p < 0.05.
© 2019 by the authors. Licensee MDPI, Basel, Switzerland. This article is an open access article distributed under the terms and conditions of the Creative Commons Attribution (CC BY) license (http://creativecommons.org/licenses/by/4.0/).
Share and Cite
MDPI and ACS Style
Song, L.; Jin, J.; He, J. Effects of Severe Water Stress on Maize Growth Processes in the Field. Sustainability 2019, 11, 5086. https://0-doi-org.brum.beds.ac.uk/10.3390/su11185086
AMA Style
Song L, Jin J, He J. Effects of Severe Water Stress on Maize Growth Processes in the Field. Sustainability. 2019; 11(18):5086. https://0-doi-org.brum.beds.ac.uk/10.3390/su11185086
Chicago/Turabian StyleSong, Libing, Jiming Jin, and Jianqiang He. 2019. "Effects of Severe Water Stress on Maize Growth Processes in the Field" Sustainability 11, no. 18: 5086. https://0-doi-org.brum.beds.ac.uk/10.3390/su11185086
Note that from the first issue of 2016, this journal uses article numbers instead of page numbers. See further details here.