Article

A Sustainable, Regional Agricultural Development Measurement System Based on Dissipative Structure Theory and the Entropy Weight Method: A Case Study in Chengdu, China

1
Business School, Sichuan University, Chengdu 610064, China
2
Chinese Studies Center, Sichuan University, Chengdu 610065, China
*
Author to whom correspondence should be addressed.
Sustainability 2019, 11(19), 5313; https://0-doi-org.brum.beds.ac.uk/10.3390/su11195313
Submission received: 11 August 2019 / Revised: 15 September 2019 / Accepted: 24 September 2019 / Published: 26 September 2019
(This article belongs to the Collection Sustainable Development of Rural Areas and Agriculture)

Abstract

:
As a large agricultural nation, China attaches great importance to agricultural development, as sustainable, regional agricultural development affects the sustainable development of China. Taking Chengdu, Sichuan Province as an example, this paper selected indicators and data from the past 15 years from the Chengdu Statistical Yearbook and applied the dissipative structure theory to establish an evaluation system for sustainable, regional agricultural development based on five main factors including economy, society, environment, education, and population. The entropy weight method was used to empower each indicator, and the changes in Chengdu’s sustainable agricultural development in the past 15 years were calculated. It was found that Chengdu’s sustainable agricultural development has been annually increasing, among which, economic and education subsystems had the greatest support for sustainable agricultural development. From 2003 to 2017, the entropy change of the total agricultural sustainable development system in Chengdu was negative, and the total entropy of the system gradually decreased. The sustainable agricultural development system in Chengdu has been developing towards a more orderly dynamic equilibrium state.

1. Introduction

As agriculture is an economic activity, a livelihood, and a provider of environmental services, it contributes significantly to a country’s development [1]. Sustainable development, a concept that emerged in the context of a growing awareness of an imminent ecological crisis, seems to have been one of the driving forces of world history in the period around the end of the 20th century [2]. For agricultural development to be sustainable, however, there needs to be a balance between the economy, the environment, and the society [3]. Because agriculture is the foundation of China’s national economy, the sustainable development of regional agriculture, which involves the interaction of many factors such as nature, the economy, society, population, and the environment, is fundamental to sustainable, regional development [4]. Since the reform and opening up, China has promulgated many policies to boost agricultural development, which have assisted in enhancing ecological construction, environmental protection, and agricultural resources. However, China’s agricultural development also faces enormous challenges. China has the largest population in the world. However, the per capita agricultural resources are not high; the overall level of economic development is weak; degradation is being experienced in the ecosystems, the soil, and the water; and there has been a significant increase in pollution. Thus, China needs to develop a more sustainable agricultural system, which is a complex problem that involves many factors such as the agricultural economy, agricultural technology, agricultural environment, and rural development, each of which are interrelated and constrained in a dynamic information feedback system [5]. Sustainable, regional agricultural development has become the focus of social attention and scholarly research in recent years. Therefore, to develop a sustainable agricultural system and to be able to predict development, formulate control strategies, and propose optimal combinations based on the characteristics of the region, it is necessary to fully understand the structural and interactive mechanisms [4]. Chengdu, as the core city in southwest China, is a developed agricultural city that has rich resources. However, the measurement system of sustainable, regional agricultural development in Chengdu has not been systematically studied. The main research question of this study is to analyze and measure the sustainable, regional agricultural development in Chengdu, provide theoretical support to comprehensively measure the sustainable development levels of agriculture in Chengdu, and give suggestions for the future development of agriculture in Chengdu.

2. Literature Review

2.1. Establishment of a Regional, Sustainable Development Assessment System

One of the key research directions for sustainable, regional agricultural development has been the construction of viable evaluation systems, which have generally consisted of three aspects including the economy, society, and the environment as well as their associated dimensions [6,7,8]. Lu [9] claimed that an agricultural evaluation system needed to fully reflect the economic, ecological, and social benefits of agriculture, and they established three subsystems: a rural economic system, a rural social system, and a rural resources and environmental system. Liu [4], however, suggested that an evaluation system should have four dimensions—food security, ecological stability, rural economic development, and regional internal balance—to fully reflect the quality and quantity of agricultural development. Cui [10] claimed that sustainable, regional agriculture development had five factors: the agricultural economy, the rural society, agricultural resources and the environment, agricultural production, and agricultural technology. Based on the interpretation of sustainable agricultural development in the Danbo Declaration, and combined with the agricultural development situation in Sichuan Province, Sun [11] proposed four basic abilities—survival and security, economic development, rural social progress, and agricultural and ecological environmental protection—to reflect the agricultural development in Sichuan Province. Wang [12] added a “resource subsystem” to the traditional “economy, society, and environment” subsystem. Gao [13] also added “environmental protection” to measure sustainability on the basis of the “economy, the society, and resources”, and Ittersum [14] added the “system” dimension. While Seghezzo believes that sustainability consists of place, permanence, and person [15], Piedra-Muñoz analyzes the impact of different aspects of sustainability on profitability and holds that sustainability dimensions include socio-economic variables and environmental innovation variables [16].
Based on the literature of these scholars, we provide a table (Table 1) to show the construction process of the index system of different dimensions in these documents.
Most of the previous sustainable agricultural development studies have only focused on the economic, social, and environmental aspects when establishing the subsystems, and they have generally ignored the potential impact of education. However, educational factors as well as the population play vital roles in urban economic development because they reflect the degree of social progress. As China has a very large population, it is at risk of resource shortages and environmental pollution; therefore, coordination of population and sustainable development is a key issue. As such, in this paper, to reflect sustainable agricultural regional development more accurately, an evaluation system is proposed and includes five factors: economy, society, environment, education, and population (as well as the associated interrelationships).

2.2. Research Methods

Liu [4] believes that comprehensive, innovative evaluation methods are needed when seeking to assess sustainable agricultural development at different stages in the past. Yu [17] adopted a DPSIR (drivers, pressures, state, impact, and response) intervention model to describe development of the sustainable agricultural system on the macro scale; Cao [18] used an expert opinion method and the analytic hierarchy process (AHP); and while Cui [10], Li [19], and Yuan [20] built evaluation systems based on different theories, all employed the entropy weight method to assign weights to and evaluate each index. Other studies have used a variety of different methods, such as data envelopment analysis (DEA) [11], the close value method [9], factor analysis [13], multicriteria decision analysis [21], Wroclaw taxonomic method [22], correlation analysis, multiple correspondence analysis [23], and technique for order preference by similarity to an ideal solution (TOPSIS) [19].
Even though the above-mentioned methods have been able to successfully evaluate sustainable agricultural development and measure subsystem coordination, in this paper, based on accurate and rigorous research results, a more objective entropy method is used to ensure that the evolutionary sustainable development process can be fully revealed. Therefore, this paper employed dissipative structure theory to establish a sustainable, regional agricultural development evaluation system, with the indexes being selected using entropy weights. In effect, the innovations of this paper are as follows.
(1)
To ensure a more scientific and comprehensive evaluation of the sustainable development of regional agriculture, a new model was proposed to evaluate the development of regional agriculture, which had five subsystems and associated subsystem indicators. Relevant past data were then interrogated, and the entropy change and weight of each index in each year were calculated to assess the sustainable development of the whole region.
(2)
Based on previous studies, this paper also proposed an education subsystem as part of sustainable agricultural development, with a focus on education changes and the number of people educated.
This paper synthesized influences from various factors and used the theory of dissipative structure to determine the specific evolutions in sustainable, regional agricultural development. Based on the factors that influenced entropy change, a targeted index system was established that measured the evolution of sustainable agricultural development in Chengdu over 15 years. As the entropy weight method was used to determine the indicator weights, it provided an objective view of sustainable agricultural development over time.

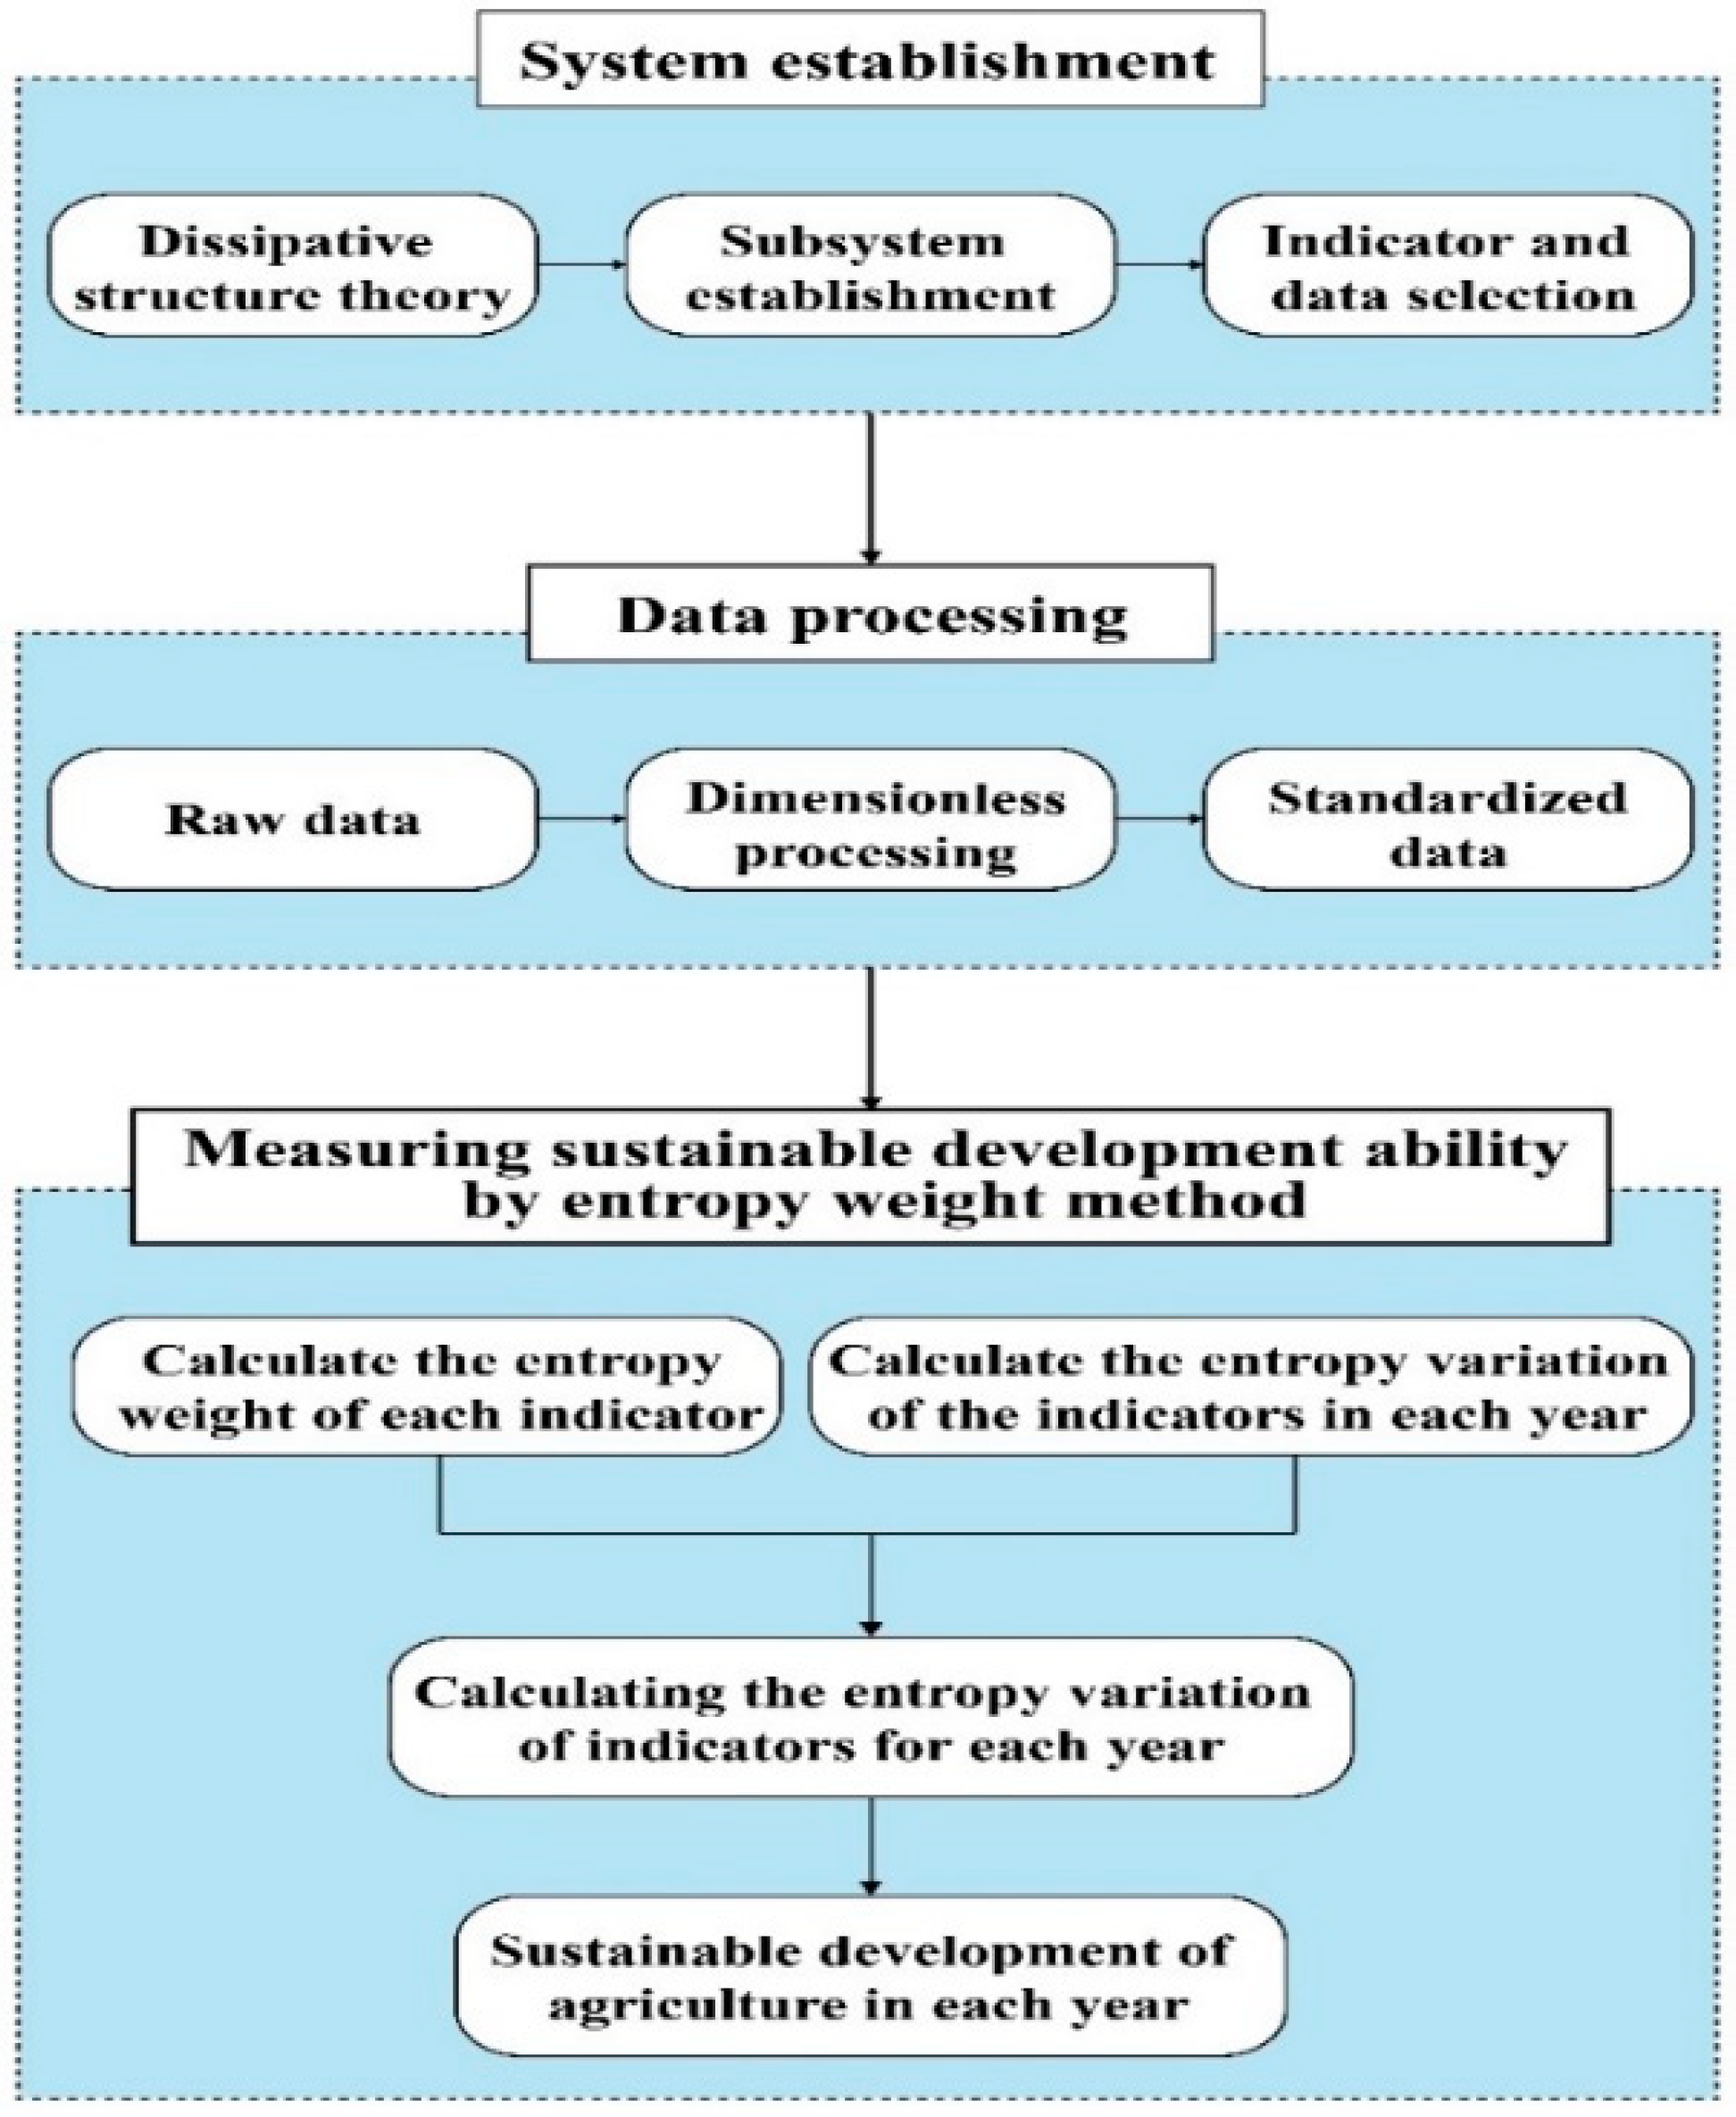
3. Introduction to the Dissipative Structure and Establishment of the Subsystems

3.1. Dissipative Structure Theory

Professor Prigogine, a Belgian scientist, first proposed dissipative structures to describe the ordered and disordered state of an object [24]. Dissipative theory claims that in a nonequilibrium system, the system exchanges material and energy with the outside world, and when these exchanges reach a certain degree, the system changes from the original disordered state to an ordered state in time and space, which is known as a dissipative mechanism.

3.2. Introduction to Dissipative Structure for Sustainable, Regional Agricultural Development

Sustainable, regional agricultural development has a dissipative structure that involves interactions between the economy, society, environment, education, and population. First, the sustainable agricultural development system is a large-scale, open system that is independent to a certain extent but continuously interacts with the outside world through its material, energy, and information flows. Second, when the system is in or near equilibrium, the matter and energy distributions in each system subsystem are uniform, but when in a nonequilibrium state, the subsystems are mutually constrained, related, and dependent. Therefore, the whole development system has “dynamic equilibrium” and an orderly structure. Third, the subsystems within the development system are independent of each other but interact and have nonlinear internal elements. Fourth, the internal factors and subsystems are affected by the external environment and change, which can lead to “fluctuations”.

3.3. Construction and Analysis of the Index System

The theory of dissipative structure states that as long as the negative entropy of a system increases through a constant exchange of various factors between itself and the outside, the total entropy of the system continues to decrease, and the whole system gradually develops in an orderly direction. The degree of order of the system is usually expressed in terms of “entropy changes” [25], with an entropy increase being defined as a spontaneous orderly to disorderly development process. Negative entropy, however, is the opposite; that is, because of the substance or energy exchanges between the system and the outside world, the system’s entropy decreases and develops in a more orderly direction. When analyzing sustainability, we should be aware of the fact that the concept of “sustainable development” is multidimensional [23]. Based on the theory of dissipative structure, and rational and scientific sustainable regional agricultural development system indicators that reflect the current situation in Chengdu, the index system constructed in this paper was composed of five subsystems—economy, society, environment, education, and population—for which specific indicators were selected based on the following logic.
As sustainable development of the economy refers to reasonable economic development, sustainable agricultural development plays a role in promoting sustainable economic growth. The relationship between economic growth and environmental quality has been a source of great controversy for quite a long time [26]. Under a sustainable development system, people protect natural resources, build an ecological society, and ensure ecological balance, which lowers input costs, encourages better crop growth, and ultimately improves crop output and efficiency. Therefore, annual per capita gross agricultural production value, per capita grain output, and the per capita disposable income of the rural residents in Chengdu were taken as the indicators to reflect whether the regional agricultural development economy was sustainable [19].
Social development should be people-centered, focused on improving people’s quality of life, and meeting their growing material and cultural requirements, while not threatening the survival and development capacity of future generations [27]. One of the goals of sustainable development is to guarantee overall societal progress. As economic growth cannot fully reflect this perspective, the social subsystem is focused on improving the quality of human life. Therefore, the social subsystem indicators selected in this paper were the urbanization rate and the per capita living area of rural residents [1,18].
Environmental sustainability refers to the maintenance of good environmental conditions to enable the development of agriculture and crop production while protecting the natural environment and effectively coordinating the relationship between humans and the environment. In the process of production, many chemical fertilizers and pesticides are applied, which leads to overexploitation of some agricultural resources and serious overdraft [19]. Thus, the environmental subsystem sustainability indicators [7,19,20] were pesticide use intensity, which gives us information regarding the toxic products released into the environment [7], agricultural fertilizer use intensity, and agricultural plastic film use intensity, as the use of pesticides, chemical fertilizers, and plastic film has a negative impact on the environment, can affect the production of crops and aggravate environmental pollution, and can even endanger social health. Therefore, the use of these three indicators can measure the degree of environmental pollution and environmental sustainability.
Educational programs have been regarded as essential elements for sustainable development [28]. The educational subsystem is established in this paper as part of the evaluation, as it is believed that sustainable development is a type of education. While sustainable development sees the “economy, society, and the environment” as the development goals, education plays an important role in each of these systems. Additionally, there is growing attention toward sustainability education as an important means for addressing environmental issues and accomplishing sustainability. The United Nations Educational, Social, and Cultural Organization (UNESCO) refers to education as a foundation for sustainable development as well as economic growth, peace, and responsible global citizenship [28]. Science and technology are important means to realize sustainable development of agriculture. Farmers in China have a low level of technology proficiency in applying it to agricultural production in practice. Influenced by the low cultural quality of peasants and challenged by illiteracy, the majority of peasants in China are skeptical with adopting science and technology in their agricultural practice in the first place. Unable to read and write also means they cannot effectively master knowledge and skills that can improve crop yields and efficiencies [29]. At present, China’s agriculture has entered a new stage of development. The pulling force of agricultural policy effectiveness has been greatly weakened. The decisive driving force of sustainable agricultural development will come from the development of agricultural science and technology. Only through agricultural science and technology can we revitalize agriculture. Upgrading agricultural science and technology is closely related to the level of culture and education in a region. Moreover, education and cultural level can improve the personnel management level and environmental protection awareness in the region. Three factors—universities, teachers, and students—are positively correlated with agricultural development; thus, it is necessary to consider the selection of indicators related to these three factors [30,31,32]. Therefore, to measure the cultural subsystem, education indicators were selected with the reasoning that when education is developed, the overall quality of the people is improved, which allows for increased economic development, environmental protection, and ultimately overall sustainable development. Indicators to measure the level of rural education have also appeared in previous papers [9].
Population has been used as a subsystem or indicator in sustainable agricultural development systems [1,12,19]. Academics generally believe that sustainable agricultural development is a complex system that covers the population, economy, resources, environment, and society [20]. The number, structure, and regional population density determines the healthy development of agriculture and also involves economic development. Therefore, the natural population growth rate was chosen as the index.
Following the principles of scientific soundness, completeness, rationality, operability, effectiveness, and comparability, the regional agricultural sustainable development system measurement index system was constructed from the five dimensions of economy, society, environment, education and population (Framework of ESEEP). On the basis of the dissipative structure theory and entropy change, the index and data system (based on the ESEEP framework) were established to assess sustainable, regional agricultural development from five aspects: economy, society, environment, education, and population (as shown in Table 2).

3.4. Document Data Sources

The data in this paper mainly came from three columns in the Chengdu Statistical Yearbook (2003–2018): “Comprehensive”, “Agriculture”, and “Science, Technology, Education, and Culture”.

4. Computational Steps and Analysis of Results

4.1. Basic Measurement Model Principles

The theory of dissipative structure states that as long as the negative entropy flow of a system increases through constant exchange between itself and the outside, the total entropy of the system continues to decrease, and the system gradually develops in an orderly direction. The degree of order of a system is usually expressed in terms of “entropy changes” [19], and the basic formula for dissipative structure theory is d S t o t a l = d S 1 + d S 2 , which is the sum of the entropy increase and the entropy flow. The theory of information entropy can be used to evaluate the sustainable development of regional agriculture and calculate the specific index information entropy and the annual information entropy. Index information entropy determines the weight of each index, which is then used to assess the changing sustainable regional agricultural development characteristics, with the annual information entropy describing the changing trends. A technical roadmap for measuring the sustainable development of regional agriculture is shown in Figure 1.

4.2. Specific Evaluation Procedures for the Entropy Weight Method

4.2.1. Analysis on the Sustainable Development Level of Agriculture

To evaluate the sustainable, regional agricultural development level of a region in m years, there are n evaluation indicators in the whole evaluation system, from which the original evaluation system matrix X is developed, of which X i j is the value for index j in the first year.
X = [ x 11 x 12 x 1 n x 21 x 22 x 2 n x m 1 x m 2 x m n ] .
The index weight W i is determined using index information entropy E i . First, the original index data are processed using a “0-1 standardization”, with the value being between [0, 1]. The original data is converted to a relative number Z i j . The formulas for the profit index are:
Z i j = X i j min ( X i j ) / max ( X i j ) min ( X i j ) .
The formulas for the cost indicators are:
Z i j = max ( X i j ) X i j / max ( X i j ) min ( X i j ) .
Second, the relative number Z i j is then subject to a data shift to prevent negative numbers occurring in the subsequent calculation. The formula for data translation is:
Y i j = Z i j + A ,
where A = 1. After the data shift, new data Y i j is obtained. The specific data are shown in Table 3.
Next, the entropy value e j and entropy weight w j for the selected index are calculated. The formula for entropy value e j is:
e j = k i = 1 m p i j   l n p i j ,
where, k = 1 / ln m , and p i j = Y i j / i = 1 m Y i j .
After calculating the entropy value e j , the weight of each index is determined by
w j = 1 e j / j = 1 n ( 1 e j ) .
The calculated weight w j of each index is shown in Table 4.
Finally, the standardized data p i j of each index obtained from the initial calculation are multiplied by the weight w j of each index, from which the entropy changes in each year for each subsystem are obtained. The specific calculation formula is as follows:
D i j = p i j j = 1 n w j .
The sustainable development level of agriculture in Chengdu D i j is shown in Table 5, the development levels of the agricultural subsystems are shown in Figure 2 and the sustainable development level of agriculture in Chengdu is shown in Figure 3.

4.2.2. Calculating Entropy Change of the Agricultural Sustainable Development System

In the process of system development, the entropy variance mainly comes from two parts: the increase of entropy generated in the internal operation of the system and the exchange of entropy between the system and the external environment. This paper analyzed the degree of orderly development and evolution trend of the agricultural sustainable development system through the annual entropy change. The calculation formula is as follows:
d S i = K j = 1 n q i j l n q i j ,     i = 1 , 2 , , m ,
where: q i j = Y i j j = 1 n Y i j , i = 1 , 2 , , m .
The calculated results of the system’s annual entropy changes are shown in Table 6.
The annual and total entropy changes of each subsystem are shown in Figure 4 and Figure 5 respectively.

4.3. Analysis of Results

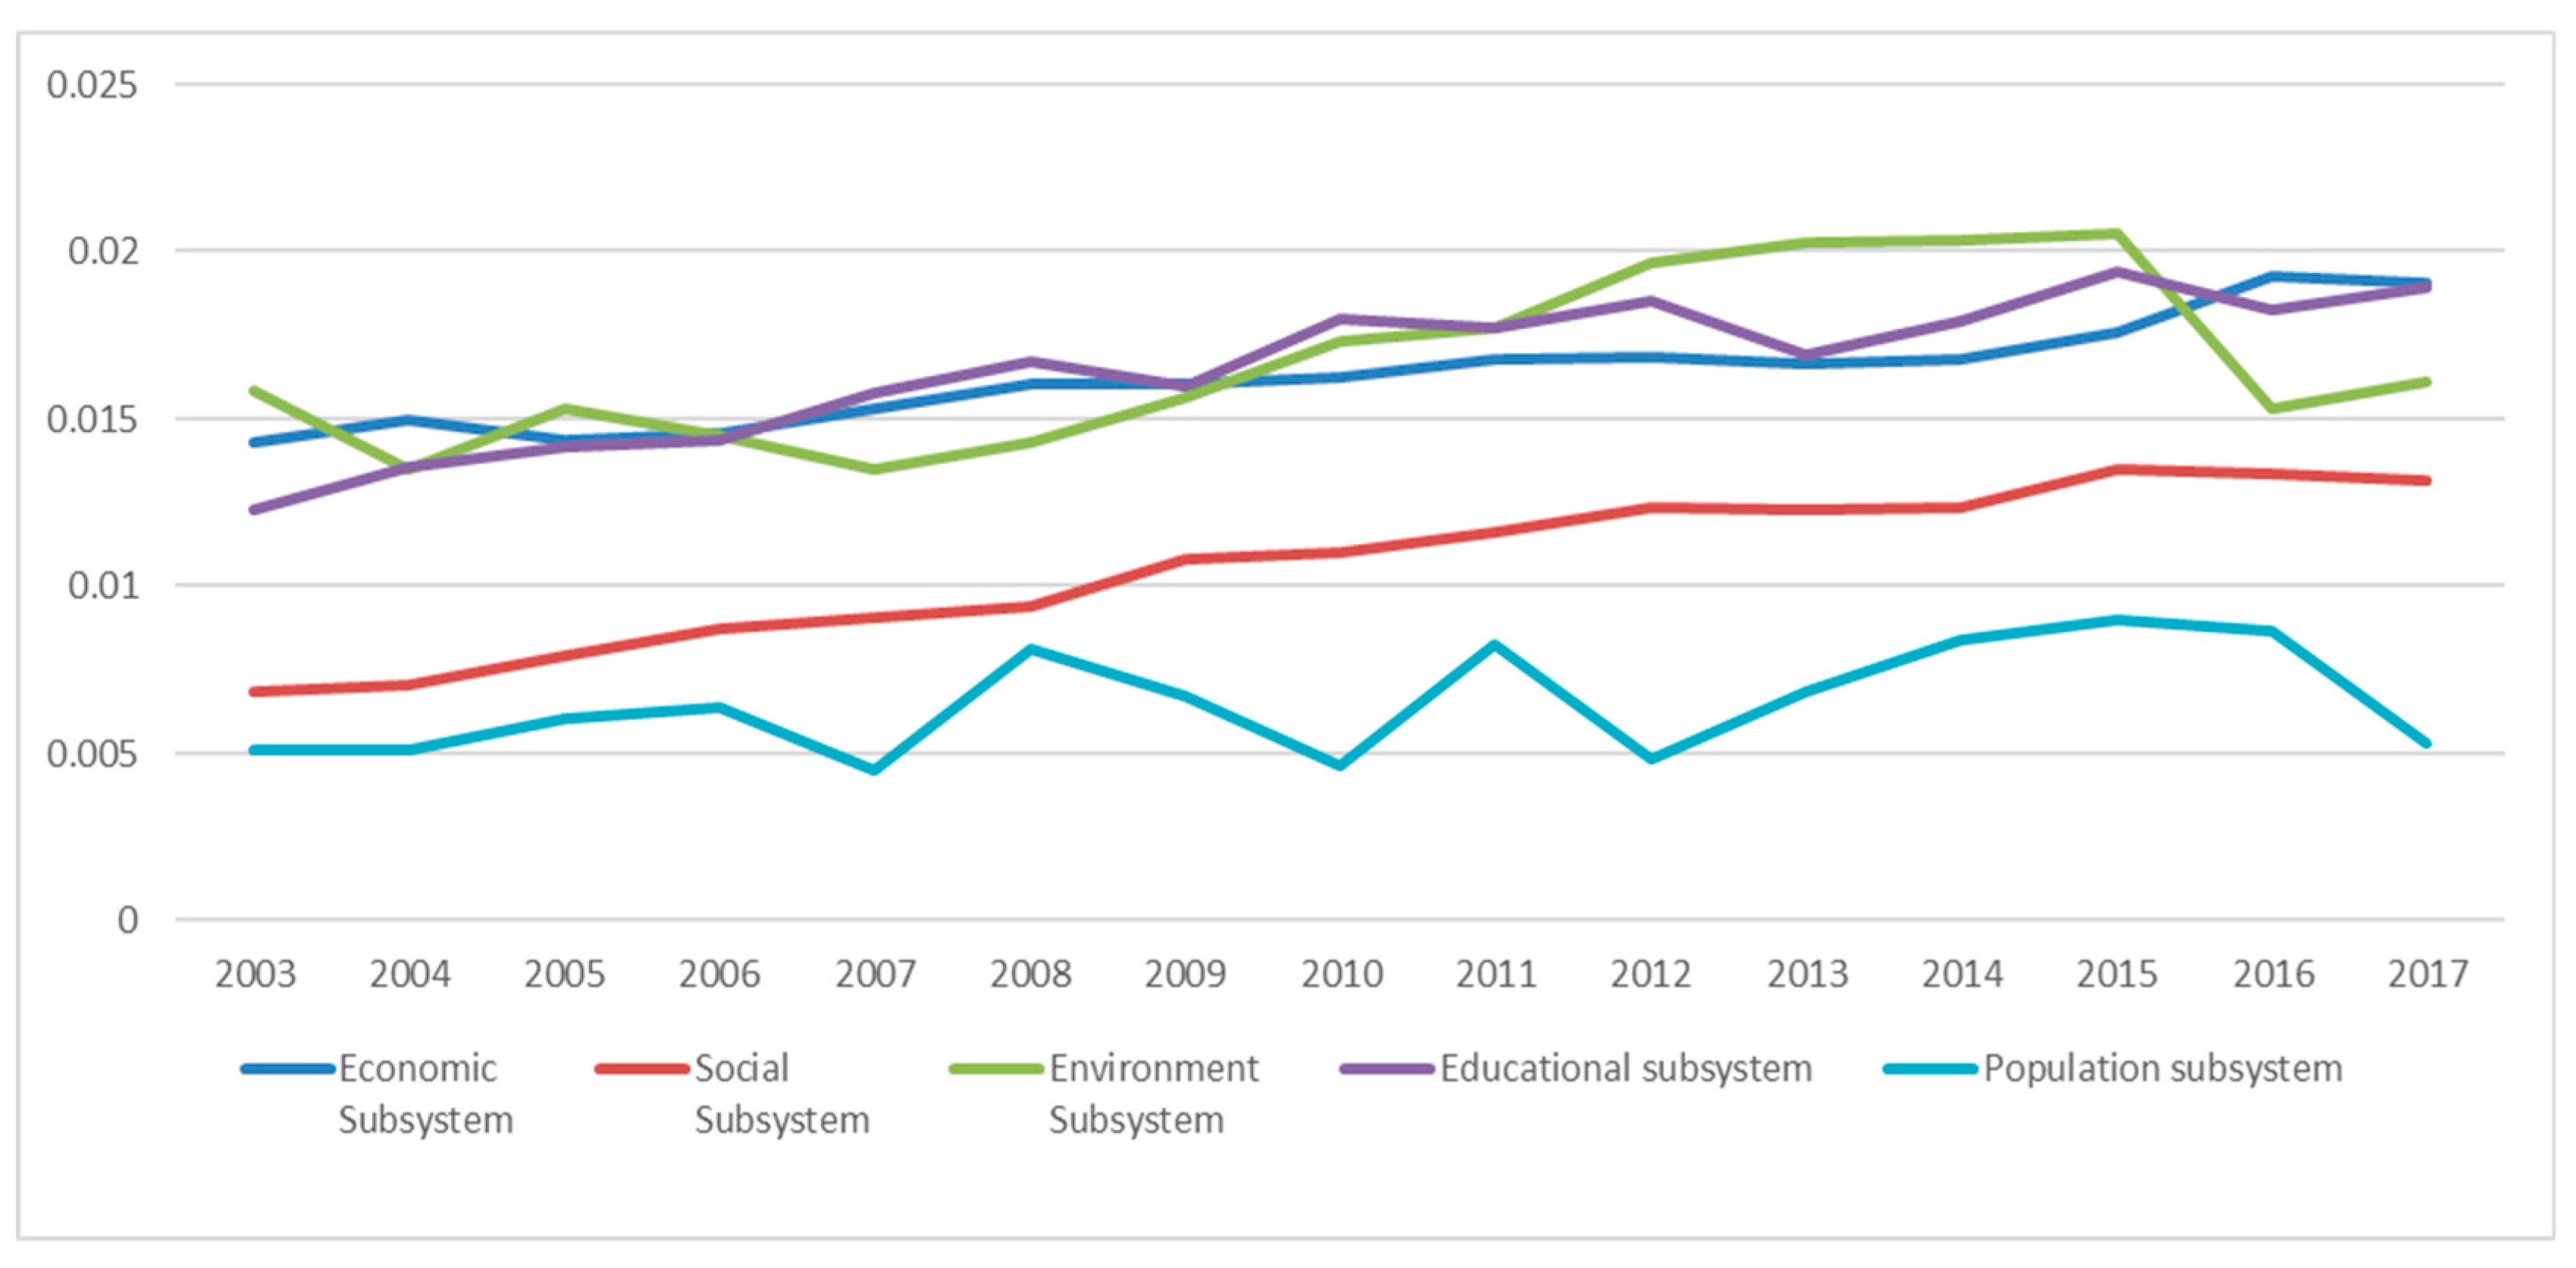
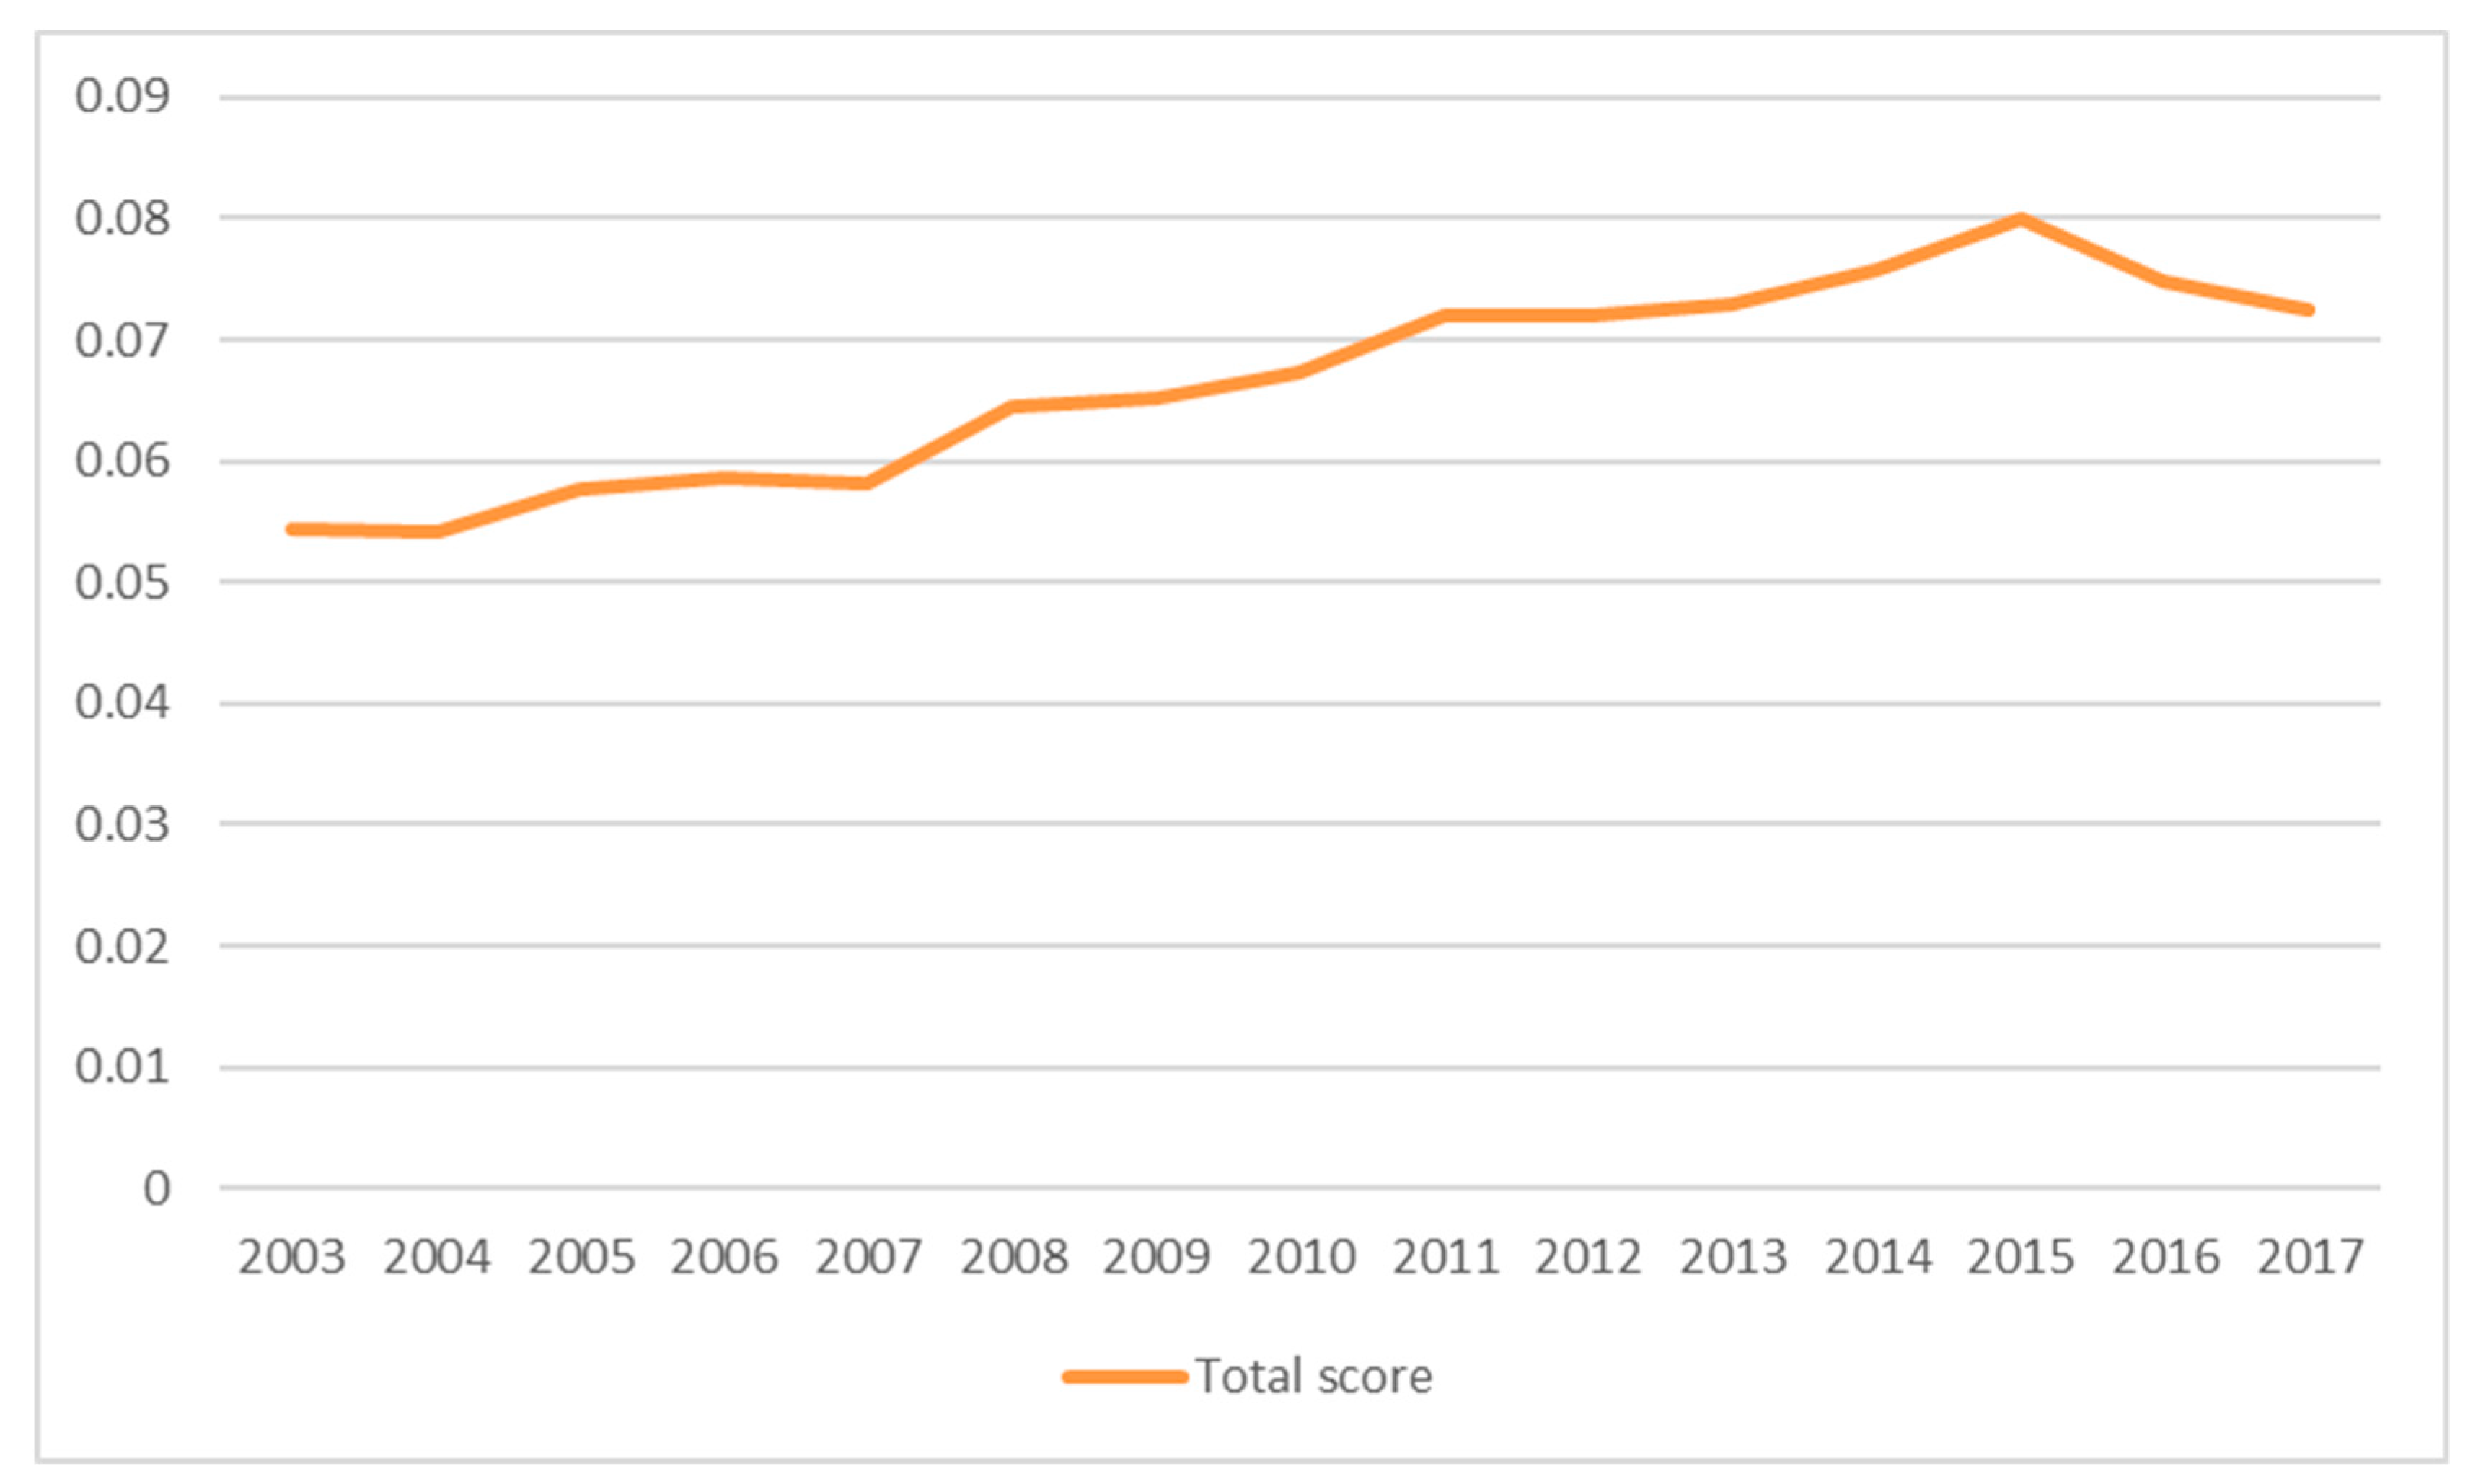
4.3.1. Analysis of the Overall Sustainable Agricultural Development in Chengdu

As shown in Table 5, Figure 2, and Figure 3, sustainable agricultural development in Chengdu was stable and has advanced. From 2003 to 2017, the total score of development level in Chengdu increased from 0.054341 to 0.072442 with an average annual growth rate of 2.07%. The development levels of the economic and education subsystems were ahead of the other subsystems in most years, which provides an important driving force for sustainable agricultural development in Chengdu. The economic, social, educational, and population subsystems also had obvious upward trends. The annual growth rates in the economic, social, environmental, educational, and population subsystems were, respectively, 2.09%, 4.78%, 0.10%, 3.14%, and 0.22%.
(1)
Economic Subsystem
The sustainability of the economic subsystem increased at an average annual growth rate of 2.09%. The per capita disposable income of the agricultural residents grew the fastest, at an average annual growth rate of 13.03%, followed by the per capita gross agricultural production (7.17%). The reason the economic subsystem as a whole did not have faster growth was possibly because of the per capita grain production, which, from 2003 to 2009, had little fluctuation or change, and after 2009, it went into a period of decline, especially in 2011 and 2015. Another reason could be that the natural population growth rate began to increase in 2011. Chengdu has a lot of economic policy support, such as a “Five-Year Plan” for Agricultural and Rural Economic Development. Such policies enable Chengdu to modernize agricultural development and build a well-off society at a high speed.
(2)
Social Subsystem
Sustainable development in the social subsystem had an average annual growth rate of 4.78%, which is the largest annual growth rate of the five subsystems. Chengdu has laid the foundations for increasing rural incomes, has focused on narrowing the income gap between urban and rural residents, and has improved rural living conditions. The per capita living area of rural residents continued to grow (2.50%). Innovative reforms in rural areas were also implemented, with urban and rural integration achieving some positive results, as reflected in the average annual urbanization growth rate of 1.60%. The rural development in Chengdu is rising, and the living standards of the rural population improved each year, laying a good foundation for rural societal development. In the Agricultural and Rural Economic Development Planning of 2017, the Chengdu Municipal Government will promote the growth of farmers’ income and constantly improve the level of rural construction.
(3)
Environmental Subsystem
The environmental subsystem rose in a fluctuating manner, and its annual average growth rate was the smallest among the five subsystems, with only 0.10% growth. However, the overall level of development in the past 15 years has risen, and the level of development from 2012 to 2015 was the fastest among the five subsystems. This indicates the development of green agriculture in Chengdu has been the focus for the government and has been well implemented in recent years. Although the use of pesticides (−0.81%) and agricultural fertilizer (−0.46%) decreased each year, the use of agricultural plastic film (3.81%) increased rapidly, causing instability in the overall development of the environmental subsystem. To solve this problem, in 2018, Sichuan Province implemented Regulations on Agricultural Eco−environmental Protection, which included supervision, dynamic detection and evaluation, and pollution prevention and control systems as well as a lower classification protection system for agricultural eco-environmental pollution.
(4)
Educational Subsystem
Educational subsystem development had an apparent upward trend, with an average annual growth rate of 3.14%. The education system in Chengdu improved each year, with the number of general colleges and universities increasing by nearly 100%, from 29 in 2004 to 56 in 2014, and an average annual growth rate of 4.81%, after which it remained steady from 2014 to 2017. The number of teachers and students in general institutions of higher learning increased significantly with respective average annual growth rates of 7.67% and 7.40%. However, the illiteracy or semi-illiteracy rates in the rural areas did not change significantly from 2004 to 2017. However, overall higher education development has risen rapidly, and many achievements have been made in strengthening education reform, standardizing school administrations, and improving public service education levels. Generally speaking, among the five subsystems, the development level of the education subsystem commanded the leading position. Chengdu’s education investment efficiency is high, and policy implementation is in place. By improving the overall quality of resources across the board, this makes the promotion and application of agricultural science and technology more efficient, which, in turn, provides and encourages more support for the sustainable development of agriculture.
(5)
Population Subsystem
The average annual growth rate in the population subsystem was 0.22% and was negative in 2007 and 2010. However, the population increased over the last 13 years, with rapid growth in 2014 (4.66%), 2015 (5.4%), and 2016 (5.0%). The reason for the slow entropy growth was that the natural population growth rate from 2003 to 2010 was low, and there were obvious changes in each year compared to the previous year.

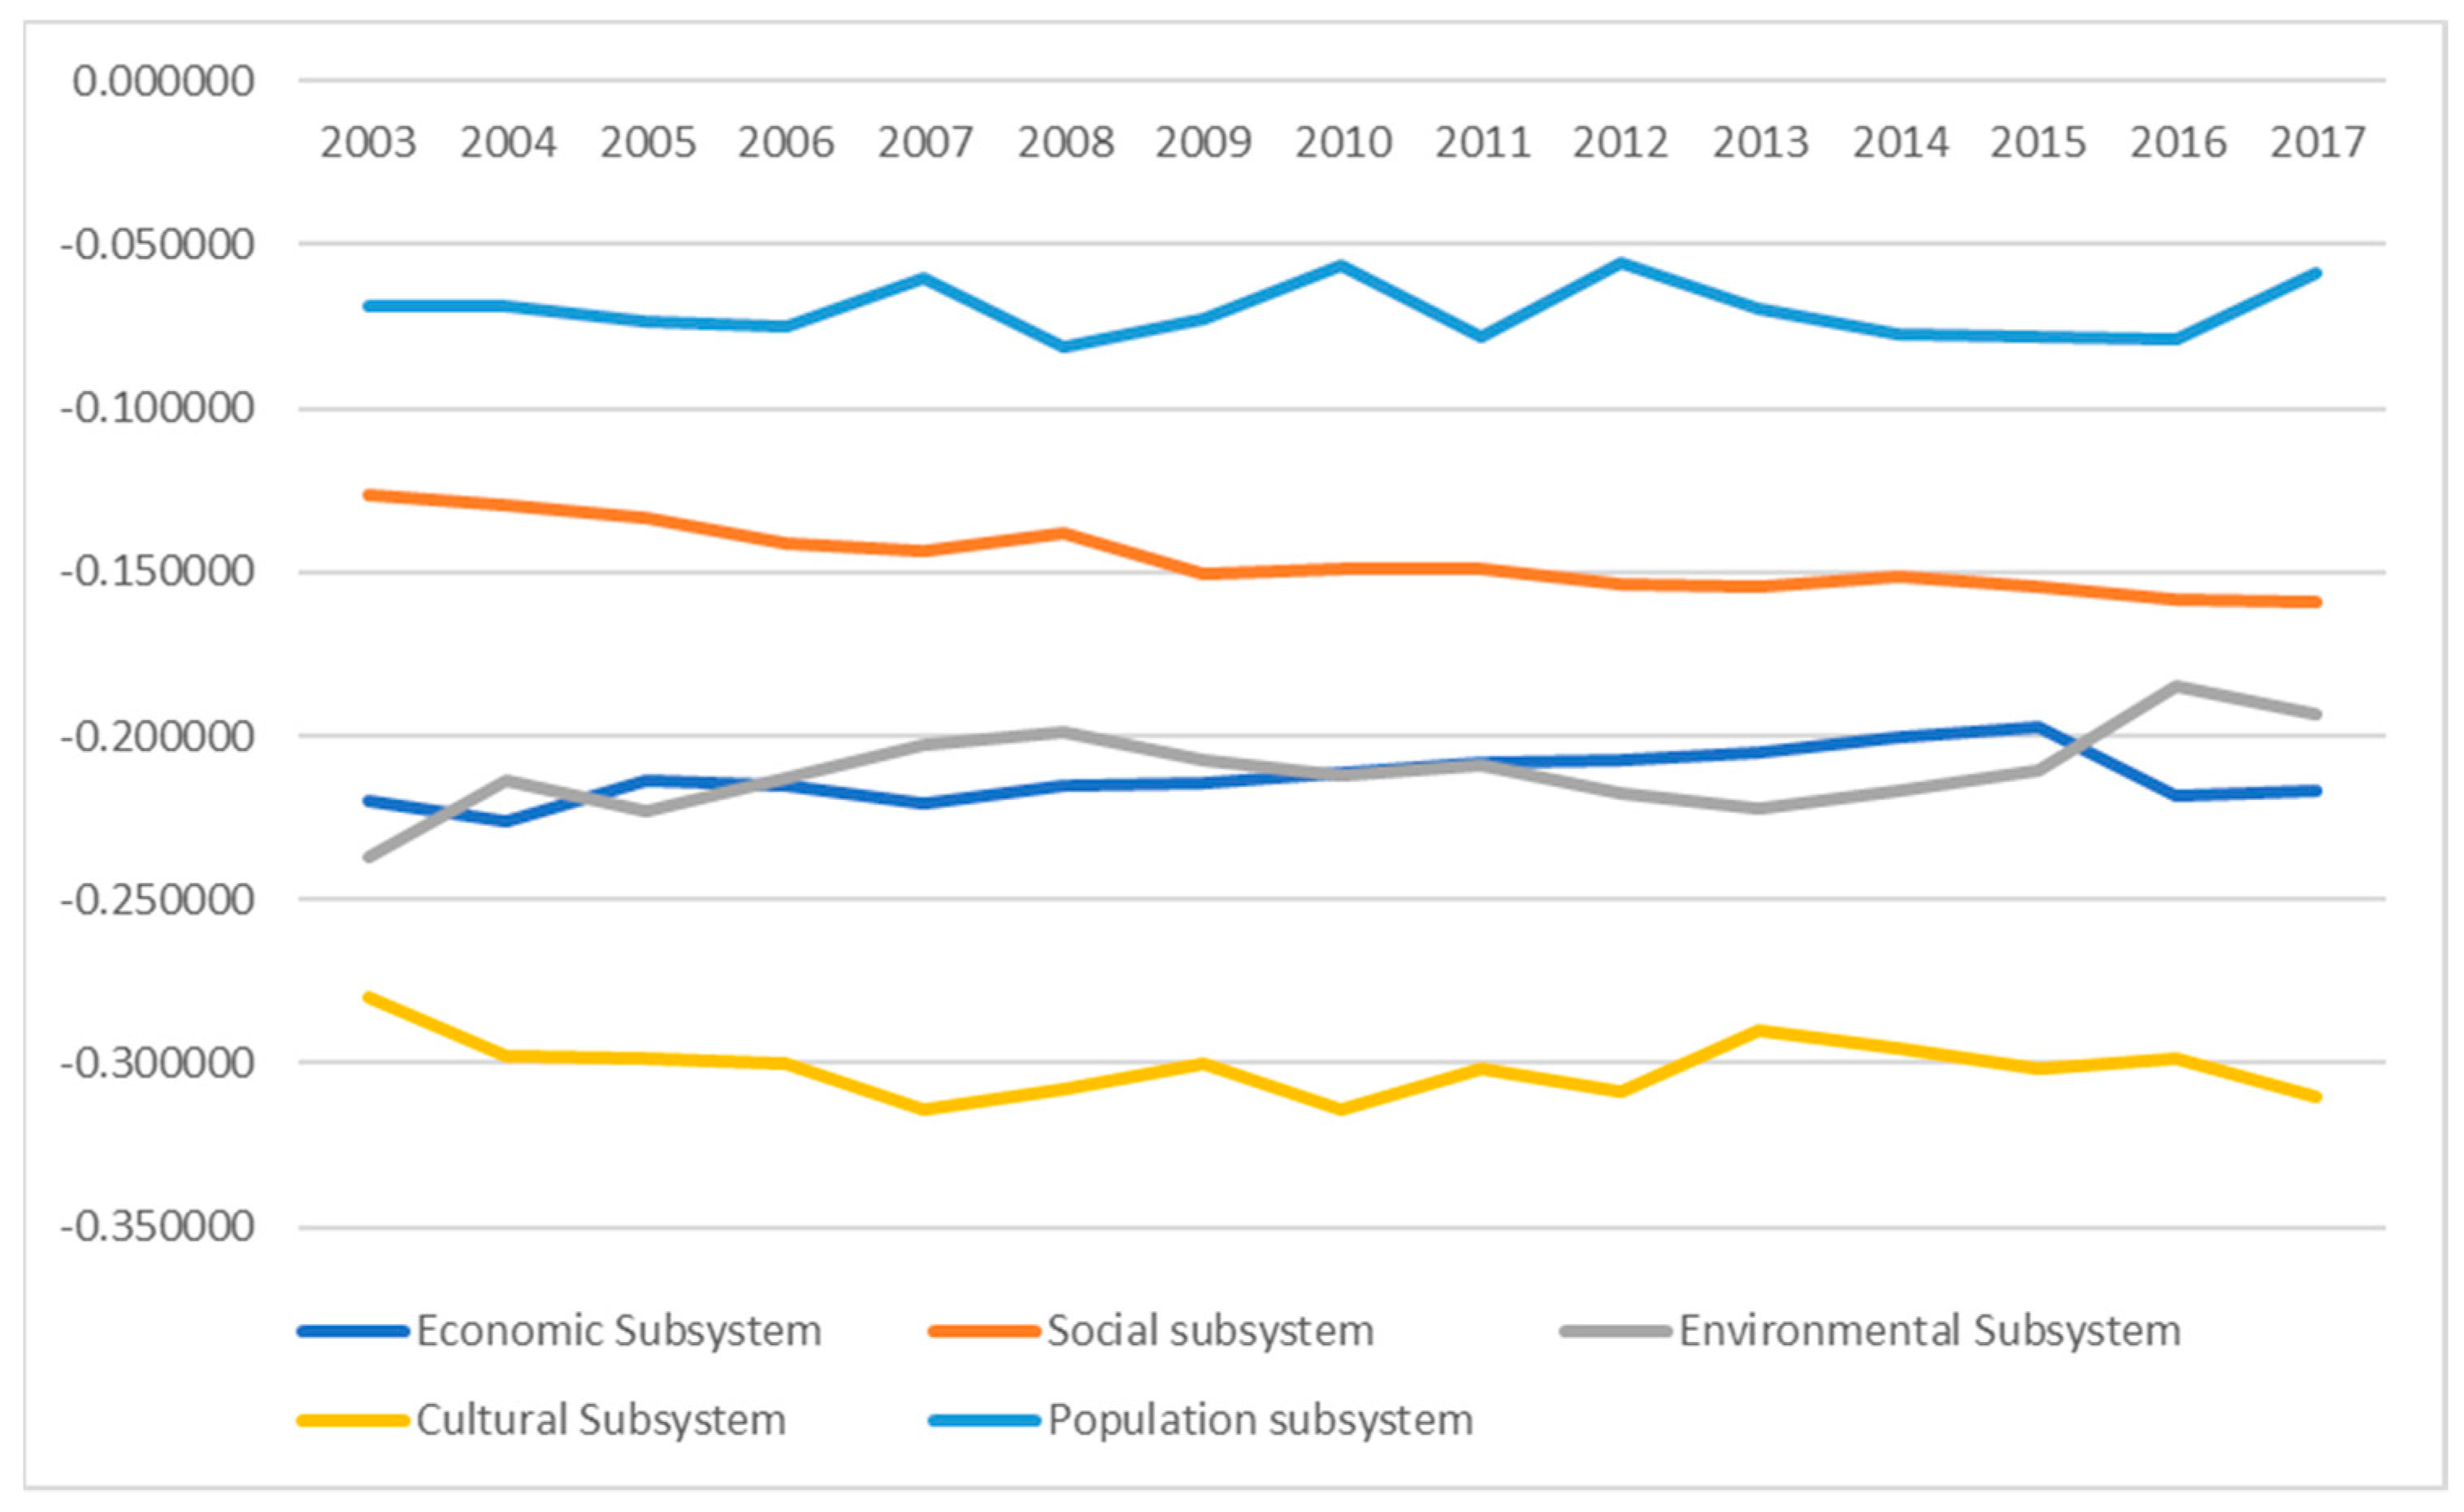
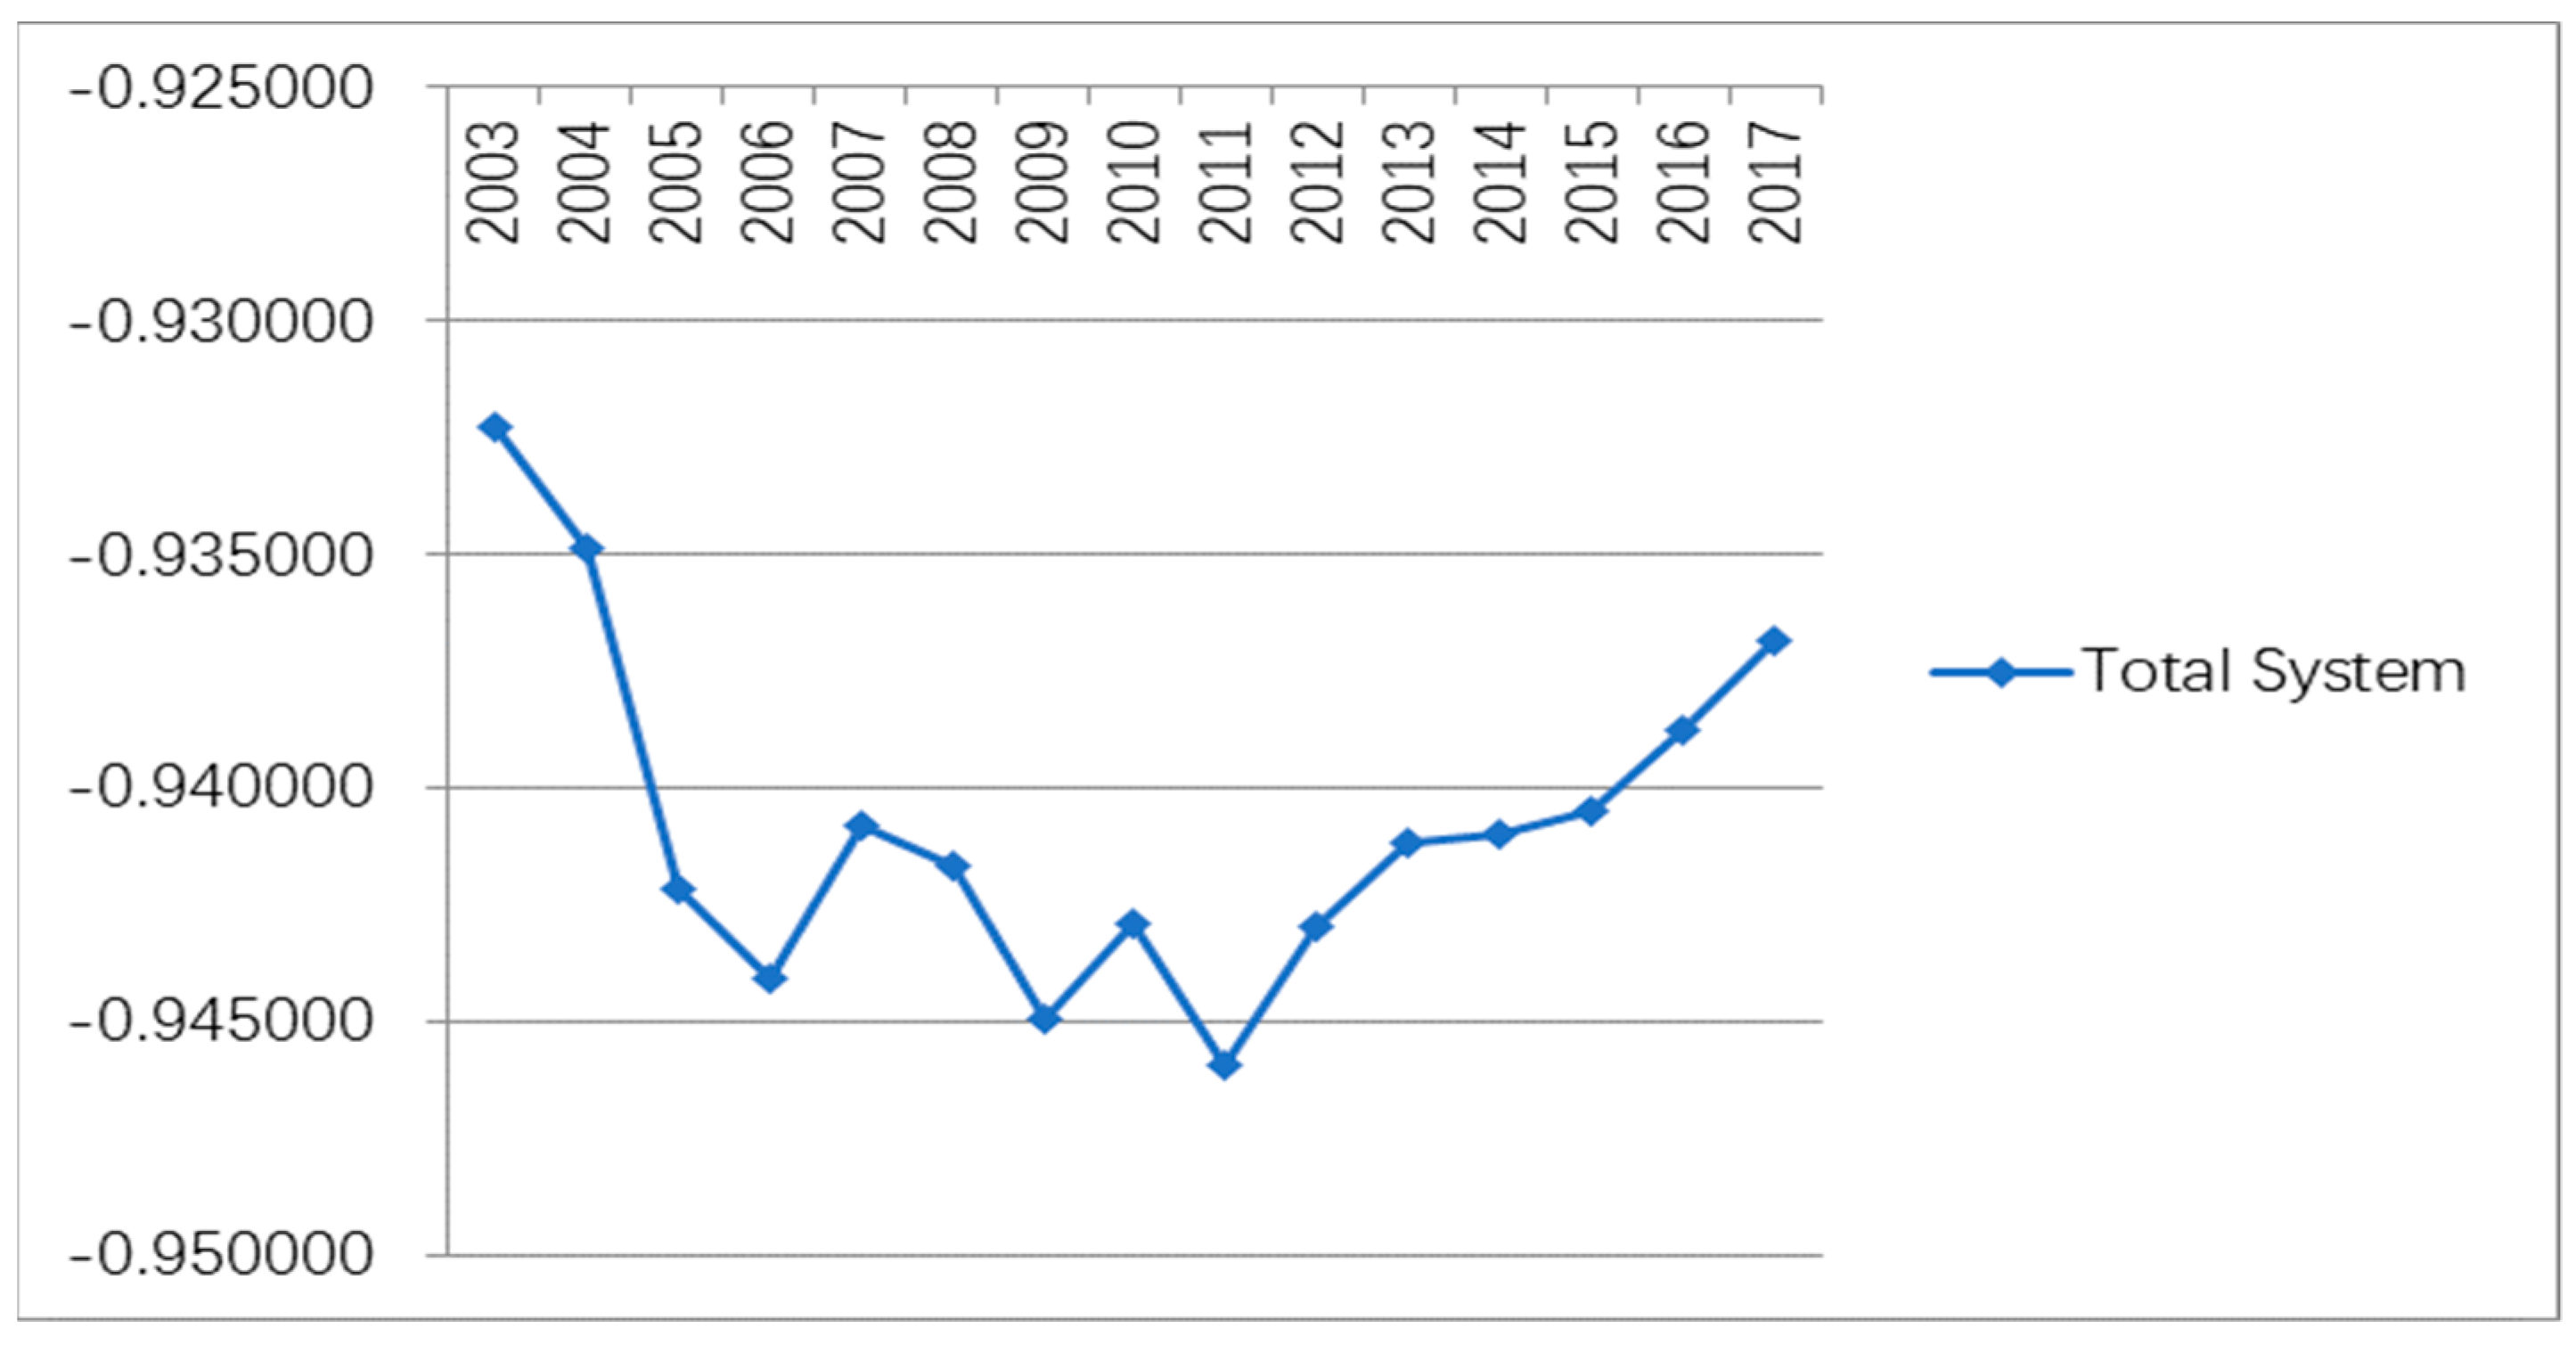
4.3.2. Analysis on the Degree of Order and Evolution Trend of the Agricultural Sustainable Development System

Based on the theory of dissipative structure, this paper analyzed the evolution trend and orderly development degree of the agricultural sustainable development system in Chengdu through the annual entropy change. Figure 4 and Figure 5 show the evolution trends and orderly degrees of the agricultural system and its subsystems intuitively.
Analysis of Figure 4 shows that, during 2003−2017, the change of entropy in each subsystem was negative, and the total entropy of the subsystem decreased by varying degrees. This indicates that the sustainable agricultural development system of Chengdu has developed, in general, in an orderly way. This has also shown that with the government’s attention to agriculture, Chengdu has achieved good results in the development of its subsystems. However, there were variances in the entropy changes of each subsystem. Entropy decelerations of social, environmental, economic, and educational subsystems were faster, and that of the population subsystem was slower. It is necessary to coordinate the development of each subsystem in the future.
Figure 5 shows that, from 2003 to 2017, the total entropy of the Chengdu agricultural sustainable development system was negative. The total entropy of the system decreased gradually. From 2011 to 2017, deceleration of the entropy slows down gradually. It shows that through continuous development and evolution, the sustainable agricultural development system in Chengdu has developed towards a more orderly state and gradually towards a dynamic and balanced state.

5. Conclusions

Based on the theory of dissipative structure, this paper established a sustainable agricultural development evaluation system for Chengdu with five subsystems—economy, society, environment, education, and population—and a measurement model using entropy weight theory. Finally, based on the data of the Chengdu Statistical Yearbook, the sustainable development level of agriculture in Chengdu from 2003 to 2017 was evaluated comprehensively. The following conclusions are drawn.
(1)
The sustainable regional agriculture development system in Chengdu has five main elements: the economy, the society, the environment, education, and population. As the sustainable regional agricultural development evolutionary process was found to have a dissipative structure, the theory of dissipative structure was deemed suitable for evaluation.
(2)
The overall development in Chengdu was found to increase each year; however, the development in each subsystem was different [20]. All in all, in terms of development speed, the education subsystem developed the fastest. This was followed by growth of the economy and population subsystems. The environment subsystem experienced the slowest growth. At the level of overall development, the economic subsystem took the lead. The education subsystem provides the foundation and has the most impact on supporting sustainable agriculture development. This was then followed by the environment subsystem, while the social and population subsystems occupied the lower end in the hierarchy.
(3)
Education was chosen as a key measure for progress and could be used as a new dimension in future evaluations. In future research, the cultural and educational levels as well as the population growth of the region could be taken as key dimensions in sustainable development assessments.
However, this study has some limitations. Sustainable development requires sustainability, coordination, and fairness. Therefore, while this paper focused on an analysis of the sustainability of agricultural development in Chengdu, there were no indicators for fairness. In addition, in establishing the dissipative structure of the subsystem, two new perspectives—cultural education and population growth—were included as subsystems; however, as there are many factors that impact sustainable agricultural development, five subsystems may be inadequate. These issues are to be further explored in future research.

Author Contributions

Conceptualization, S.L., Q.G. and S.Y.; methodology, S.L. and Q.G; validation, S.L. and Q.G; formal analysis, S.L. and Q.G; data curation, S.L.; writing—original draft preparation, S.L.; writing—review and editing, S.L., Q.G. and S.Y.; supervision, Q.G. and S.Y.

Funding

This research was funded by Central University Fundamental Research Project of Sichuan University (SKQY201644), National Social Science Foundation of China (15XJY011) and Philosophy and Social Science Project of Chengdu (2019L50). The APC was funded by Central University Fundamental Research Project of Sichuan University (SKQY201644).

Conflicts of Interest

The authors declare no conflicts of interest.

References

  1. Fallah-Alipour, S.; Mehrabi, B.H.; Zare, M.M.R.; Dariush, H. A Framework for Empirical Assessment of Agricultural Sustainability: The Case of Iran. Sustainability 2018, 10, 4823. [Google Scholar] [CrossRef]
  2. Du Pisani, J.A. Sustainable development—Historical Roots of the Concept. Environ. Sci. 2006, 3, 83–96. [Google Scholar] [CrossRef]
  3. Sun, Y.; Li, M. Comprehensive Study on Sustainable Development Ability of Agriculture in Sichuan Province. Rural Econ. 2008, 3, 55–57. [Google Scholar]
  4. Liu, H. Indicator System and Evaluation Method of Regional Agricultural Sustainable Development. Prog. Geogr. 1997, 2, 23–27. [Google Scholar]
  5. Zeng, B.; Hu, Y. Dynamic Model Simulation of Heilongjiang Agricultural Sustainable Development System. Chin. Agric. Sci. Bull. 2015, 31, 279–284. [Google Scholar]
  6. Van Cauwenbergh, N.; Biala, K.; Bielders, C.; Brouckaert, V.; Franchois, L.; Cidad, V.G.; Hermy, M.; Mathijs, E.; Muys, B.; Reijnders, J.; et al. SAFE—A Hierarchical Framework for Assessing the Sustainability of Agricultural Systems. Agric. Ecosyst. Environ. 2007, 120, 229–242. [Google Scholar] [CrossRef]
  7. Gómez-Limón, J.A.; Sanchez-Fernandez, G. Empirical Evaluation of Agricultural Sustainability Using Composite Indicators. Ecol. Econ. 2010, 69, 1062–1075. [Google Scholar] [CrossRef]
  8. Mili, S.; Martínez-Vega, J. Accounting for Regional Heterogeneity of Agricultural Sustainability in Spain. Sustainability 2019, 11, 299. [Google Scholar] [CrossRef]
  9. Lu, B.; Han, W. Sustainable Development Level in Rural China Based on Osculating Value Method. Asian Agric. Res. 2009, 1, 1–4. [Google Scholar]
  10. Cui, H.; Zhao, L.; Xue, Q. Systematic Analysis of Regional Agricultural Sustainable Development Based on Dissipative Structure Theory. Chin. J. Syst. Sci. 2005, 1, 60–65. [Google Scholar]
  11. Sun, Y. Assessment of Sustainable Agricultural Development Ability in Sichuan Province Based on DEA Method. Soft Sci. 2008, 2, 100–103. [Google Scholar]
  12. Wang, Q.; Yuan, X.; Zhang, J.; Gao, Y.; Hong, J.; Zuo, J.; Liu, W. Assessment of the Sustainable Development Capacity with the Entropy Weight Coefficient Method. Sustainability 2015, 7, 13542–13563. [Google Scholar] [CrossRef] [Green Version]
  13. Gao, P.; Liu, Y. Regional Assessment of Sustainable Development Ability of Agriculture in China. China Soft Sci. 2011, S1, 163–169. [Google Scholar]
  14. Van Ittersum, M.K.; Ewert, F.; Heckelei, T.; Jacques, W.; Johanna, A.O.; Erling, A.; Irina, B.; Floor, B.; Marcello, D.; Guillermo, F. Integrated Assessment of Agricultural Systems—A Component-Based Framework for the European Union (SEAMLESS). Agric. Syst. 2008, 96, 150–165. [Google Scholar] [CrossRef]
  15. Seghezzo, L. The Five Dimensions of Sustainability. Environ. Politics 2009, 18, 539–556. [Google Scholar] [CrossRef]
  16. Piedra-Muñoz, L.; Galdeano-Gómez, E.; Pérez-Mesa, J. Is Sustainability Compatible with Profitability? An Empirical Analysis on Family Farming Activity. Sustainability 2016, 8, 893. [Google Scholar] [CrossRef]
  17. Yu, B.; Lu, C. Macro-analysis of Agricultural Sustainable Development Based on DPSIR Conceptual Model. China Popul. Resour. Environ. 2004, 5, 70–74. [Google Scholar]
  18. Cao, Z. Establishment and Evaluation of Indicator System for Regional Agricultural Sustainable Development: A Case Study of Hengyang City. Econ. Geogr. 2012, 32, 113–116. [Google Scholar]
  19. Li, M.; Wang, J.; Chen, Y. Evaluation and Influencing Factors of Sustainable Development Capability of Agriculture in Countries along the Belt and Road Route. Sustainability 2019, 11, 2004. [Google Scholar] [CrossRef]
  20. Yuan, J.; Qi, C. Dynamic Evaluation of Sustainable Agricultural Development Ability in Hunan Province Based on Entropy Method. Resour. Environ. Yangtze Basin 2013, 22, 152–157. [Google Scholar]
  21. Sadok, W.; Angevin, F.; Bergez, J.É.; Bockstaller, C.; Colomb, B.; Guichard, L.; Reau, R.; DoréEmail, T. Ex ante Assessment of the Sustainability of Alternative Cropping Systems: Implications for Using Multi-Criteria Decision-Aid Methods. A Review. Agron. Sustain. Dev. 2008, 28, 163–174. [Google Scholar] [CrossRef]
  22. Agovino, M.; Casaccia, M.; Ciommi, M.; Ferrara, M.; Marchesano, K. Agriculture, Climate Change and Sustainability: The Case of EU-28. Ecol. Indic. 2018, 105, 525–543. [Google Scholar] [CrossRef]
  23. Sulewski, P.; Kłoczko-Gajewska, A.; Sroka, W. Relations Between Agri-Environmental, Economic and Social Dimensions of Farms’ Sustainability. Sustainability 2018, 10, 4629. [Google Scholar] [CrossRef]
  24. Prigogine, I.; Lefever, R. Theory of Dissipative Structures; Springer Fachmedien Wiesbaden GmbH: Stuttgart, Germany, 1973. [Google Scholar]
  25. Chen, L.; Tian, S.; Zhang, K. Measurement and Analysis of Ecological Security of Cultivated Land in Sichuan Province Based on Dissipative Structure Theory. Res. Soil Water Conserv. 2017, 24, 307–313. [Google Scholar]
  26. Kahuthu, A. Economic Growth and Environmental Degradation in a Global Context. Environ. Dev. Sustain. 2006, 8, 55–68. [Google Scholar] [CrossRef]
  27. Feng, N. The Connotation and Strategic Framework of China’s Social Sustainable Development. China Popul. Resour. Environ. 2001, S2, 31–32. [Google Scholar]
  28. Kinoshita, A.; Mori, K.; Rustiadi, E.; Muramatsu, S.; Kato, H. Effectiveness of Incorporating the Concept of City Sustainability into Sustainability Education Programs. Sustainability 2019, 11, 4736. [Google Scholar] [CrossRef]
  29. Wang, L.; Song, Y. The Impact of Peasants’ Quality on Agricultural Sustainable Development. Popul. Econ. 2004, 4, 1–5. [Google Scholar]
  30. Crawford, F. Agricultural Machinery Education in Turkey. Int. J. Eng. Educ. 2006, 13, 86–92. [Google Scholar]
  31. Hillison, J. The Role of the Agricultural Education Teacher Educator Yesterday, Today, And Tomorrow. J. Agric. Educ. 1998, 39, 1–7. [Google Scholar] [CrossRef]
  32. Kumar, A.; Kumar, V.A. Pedagogy in Higher Education of Agriculture. Procedia Soc. Behav. Sci. 2014, 152, 89–93. [Google Scholar] [CrossRef] [Green Version]
  33. Chengdu Statistical Bureau. Chengdu Statistical Yearbook; China Statistics Press: Beijing, China, 2003–2018.
Figure 1. Measurement model for the regional agricultural sustainable development system.
Sustainability 11 05313 g001
Figure 2. Sustainable development levels of agricultural subsystems.
Sustainability 11 05313 g002
Figure 3. Sustainable development level of agriculture in Chengdu.
Sustainability 11 05313 g003
Figure 4. Annual entropy variation of subsystems.
Sustainability 11 05313 g004
Figure 5. Total entropy change.
Sustainability 11 05313 g005
Table 1. The construction process of the indicator system.
Index SystemAuthorYear
Three Dimensions of IndicatorsBingfu Lu2009
José A. Gómez-Limón2010
Samir Mili2019
Four Dimensions of IndicatorsYanling Sun2008
Peng Gao2011
Zhiling Cao2012
Bei Zeng2015
Piotr Sulewski2018
Five Dimensions of IndicatorsHerui Cui2005
Jiuhe Yuan2013
Minjie Li2019
Five or more indicator dimensionsHui Liu1997
Siavash Fallah-Alipour2018
Table 2. Index and data system based on ESEEP framework.
Object LayerRule LayerIndicator LayerIndicator TypesData
Source
Sustainable Regional Agricultural
Development System
Economic
Subsystem (Ec)
Per capita gross agricultural production value (CNY/person) C11Profit index[33]
Per capita grain output (kg/person) C12Profit index[33]
Per capita affordable income of rural residents (CNY/person) C13Profit index[33]
Social
Subsystem (S)
Urbanization rate (%) C21Profit index[33]
Per capita living area of rural residents ( m 2 /person) C22Profit index[33]
Environment
subsystem (En)
Pesticide use (tonnes) C31Cost index[33]
Application of agricultural chemical fertilizer (10,000 tonnes) C32Cost index[33]
Agricultural plastic film usage (tonnes) C33Cost index[33]
Educational subsystem (C)Number of institutions of higher education C41Profit index[33]
Number of teachers in universities (10,000 people) C42Profit index[33]
Number of students in general institutions of higher learning (10,000 people) C43Profit index[33]
The illiteracy or semi-illiteracy rate in rural areas (%) C44Cost index[33]
Population subsystem (P)Natural population growth rate (‰) C51Profit index[33]
Table 3. Y i j after data shift.
YearEconomic
Subsystem
Social
Subsystem
Environment
Subsystem
Educational SubsystemPopulation Subsystem
C11C12C13C21C22C31C32C33C41C42C43C44C51
20031.0000001.9195711.0000001.0000001.0000001.2961061.0969162.0000001.0000001.0000000.0000001.8070181.140351
20041.0883122.0000001.0250561.0411721.0305051.0000001.0000001.7099161.1481481.1795670.1016061.8684211.140351
20051.1355841.7453081.0498711.1625961.1558511.3761941.0704851.7528501.3333331.3312690.3522351.5438601.350877
20061.1685711.7453081.0751071.2798331.2717691.2263041.1696041.4832831.4074071.5510840.4135861.2807021.421053
20071.3316881.7587131.1193901.3531051.2995011.0345331.0220261.6263301.4814811.5201240.4642931.7192981.000000
20081.4677921.7721181.1698011.4228891.3233501.2072011.0528631.6267101.4814811.5758510.5184831.9824561.807018
20091.4010391.7855231.2087361.5115141.6550191.2255691.3303961.5841571.4814811.6037150.5583511.6315791.491228
20101.4563641.7050941.2733881.5743201.6550191.3894201.6299561.4285711.7777781.6563470.6131222.0000001.035088
20111.6179221.5710461.3749321.6615491.7326681.5598821.5881061.4247721.7777781.6934980.6706021.8070181.842105
20121.6737661.4101881.4714291.7620381.8435941.6737691.9229071.3548631.8518521.8049540.7449201.8508771.070175
20131.6672731.2359251.5605961.8290301.7737101.8148421.9669601.3313071.8888891.9659440.7760791.0000001.528070
20141.7166231.1152821.6503031.8967201.7237941.9199121.9691631.2152362.0000001.9659440.8294951.2280701.870175
20151.8015581.0000001.8432971.9734821.9700502.0000002.0000001.1447572.0000001.9907120.8807821.7192982.000000
20161.9636361.2707771.8982761.9141662.0000001.6193981.3193831.0000002.0000002.0000000.9500681.2192981.929825
20172.0000001.0388742.0000002.0000001.8469221.7707571.3678411.0140582.0000001.9659441.0000001.4561401.175439
Table 4. Entropy index weight w j .
IndexC11C12C13C21C22C31C32C33C41C42C43C44C51
  w j 0.0719530.0780990.0945690.0791700.0802220.0751850.1126670.0618690.0689540.0598810.0574700.0620860.097875
Table 5. Sustainable development level of agriculture in Chengdu ( D i j ).
YearEconomic
Subsystem
Social
Subsystem
Environment
Subsystem
Educational SubsystemPopulation SubsystemTotal Score
20030.0142610.0068320.0158560.0122730.0051190.054341
20040.0149300.0070760.0135140.0135240.0051190.054164
20050.0143320.0079190.0152850.0141770.0060650.057778
20060.0145530.0087150.0145260.0143850.0063800.058559
20070.0153220.0090590.0135090.0157690.0044890.058149
20080.0160330.0093780.0142590.0167110.0081120.064493
20090.0160430.0108200.0156540.0159710.0066950.065183
20100.0162430.0110330.0173360.0180080.0046470.067267
20110.0167690.0115960.0176860.0177390.0082700.072060
20120.0168440.0123180.0196280.0185080.0048040.072102
20130.0166400.0123050.0202710.0168840.0068600.072960
20140.0167990.0123620.0203090.0179110.0083960.075777
20150.0175620.0134700.0205420.0193590.0089790.079911
20160.0192480.0133720.0152690.0182610.0086640.074814
20170.0190430.0131360.0160780.0189090.0052770.072442
Table 6. Annual entropy changes of subsystems.
YearEconomic
Subsystem
Social
Subsystem
Environment
Subsystem
Educational SubsystemPopulation SubsystemTotal Entropy Change
2003−0.219808–0.126665–0.236799–0.280159–0.068820–0.932251
2004−0.225763−0.129178−0.213545−0.297749−0.068628−0.934861
2005−0.213807−0.133469−0.223134−0.298393−0.073371−0.942175
2006−0.214970−0.141023−0.212849−0.299943−0.075305−0.944089
2007−0.220841−0.143234−0.202875−0.313967−0.059883−0.940800
2008−0.215327−0.138360−0.198903−0.307468−0.081622−0.941679
2009−0.214563−0.150652−0.207379−0.299684−0.072670−0.944948
2010−0.211444−0.149160−0.212207−0.313847−0.056231−0.942889
2011−0.208490−0.148758−0.208846−0.301698−0.078125−0.945917
2012−0.207540−0.153761−0.217851−0.308566−0.055257−0.942975
2013−0.205116−0.154111−0.222468−0.289752−0.069719−0.941165
2014−0.200488−0.151294−0.216833−0.295229−0.077169−0.941013
2015−0.196970−0.154248−0.210188−0.301293−0.077778−0.940478
2016−0.218016−0.158590−0.184657−0.298823−0.078651−0.938738
2017−0.216399−0.158853−0.193072−0.310104−0.058434−0.936862

