Article

Long-Term Electricity Supply and Demand Forecast (2018–2040): A LEAP Model Application towards a Sustainable Power Generation System in Ecuador

by
Luis Rivera-González
1,
David Bolonio
1,
Luis F. Mazadiego
1,* and
Robert Valencia-Chapi
2
1
Department of Energy and Fuels, Mining and Energy Engineering School, Universidad Politécnica de Madrid, 28003 Madrid, Spain
2
Department of Energy, Industrial Engineering School, Universidad Politécnica de Madrid, 28006 Madrid, Spain
*
Author to whom correspondence should be addressed.
Sustainability 2019, 11(19), 5316; https://0-doi-org.brum.beds.ac.uk/10.3390/su11195316
Submission received: 4 September 2019 / Revised: 24 September 2019 / Accepted: 24 September 2019 / Published: 26 September 2019
(This article belongs to the Special Issue Sustainable Energy Economics and Policy)

Abstract

:
This research assesses the Ecuadorian power generation system, estimating the electricity supply and demand forecast until 2040. For this purpose, three potential alternative scenarios were analyzed using the Long-range Energy Alternatives Planning (LEAP) System; S1: Business As Usual; S2: Power Generation Master Plan; and S3: Sustainable Power Generation System. The main goal of this study is to analyze the possible alternatives for electricity supply and demand, fuel consumption, and the future structure of the Ecuadorian power generation system to transform the current system based on petroleum fuels into a sustainable system that consumes natural gas, and progressively introduces renewable power generation plants such as solar, wind, biomass, and hydroelectric until 2040. According to the estimated results through the inclusion of sustainable energy policies, S3 scenario relative to S1 scenario could reduce the average CO2 equivalent (CO2e) emissions by 11.72%, the average production costs by 9.78%, and the average petroleum fuel consumption by 15.95%. Consequently, a correct energy transition contributes to the protection of the environment and public health and has a direct effect on economic savings for the state, which benefits to improve the citizen’s quality of life.

1. Introduction

Globally, electricity plays a vital role as a factor of economic growth and social welfare, in which it is essential to have accessible and reliable electricity at safe conditions, reasonable prices, and with the least possible damage to the environment, in other words, sustainable energy [1,2]. A sustainable electric sector is fundamental for good performance in the productive activities of any country. Thus, private organizations and public institutions from different countries have carried out numerous studies related to planning and modeling of electricity consumption [3], scenarios of electricity supply and demand [4,5,6,7], fossil fuel consumption in electricity generation industry [8], the sustainable power generation sector [9,10], electricity supply [11], performance evaluation and economic analysis of technologies [12,13], or promoting the consumption of sustainable resources such as natural gas [14]. In general, all these studies are a tiny sample of the importance that is given to this topic, designing future scenarios on the supply side to cover the electricity demand in all sectors.
Since 2007, Latin America has experienced a 2.8% average growth in the electricity demand each year until 2016. Peru and Ecuador have experienced, during the aforementioned period, the most significant increase with 6.6% and 6.1% respectively, and everything indicates that this trend continues [15], despite the fact that the per capita electricity consumption of these countries is among the lowest in the region, along with Paraguay, Colombia, Guyana, and Bolivia [16]. In the case of Ecuador, an example of a developing country, a large part of its economy is based on the exploitation and export of primary energy, which consists mainly of oil. Its oil production was around 200 million barrels and 550 million cubic meters of natural gas in 2017 [17,18].
Although the oil production in the country is significant, the production of secondary energy is deficient, predominantly refined petroleum products, in which only a quarter of the oil production goes through the country’s refineries, and the remainder is exported [19]. Consequently, this has caused the country to take advantage of petroleum byproducts together with its hydro potential to produce electricity [20,21]. Therefore, it is necessary to analyze the future behavior of the power generation system as a whole, considering its more critical factors as some subsidies and tariffs in fuels, which account for more than 90% of the household sector energy in Ecuador, mainly LPG for cooking and heating water [22].
Additionally, the population of Ecuador is smaller than the 15 most populated cities in the world [23], with 16,776,977 inhabitants in 2017 [24]. In this way, the forthcoming electricity demand will be directly linked to (a) population growth that produces an increase in consumption [3]; (b) increase in the nominal gross domestic product (MMUSD 104,296 in 2017 [25]), which corresponds to an annual average of 3.61% from 2006 to 2017 [19,20]; (c) five strategic mining projects: San Carlos Panantza, Río Blanco, Loma Larga, Mirador, Fruta del Norte [26]; (d) massive electric transport: the Quito Metro, Cuenca tram and freight train between Quito and Guayaquil [27]; (e) Yachay “Ciudad del Conocimiento” [28]; (f) construction and operation of The Pacific Refinery (RDP for its acronym in Spanish) [29]; and (g) the energy efficiency program for cooking (PEC for its acronym in Spanish) and heating water with electricity in the household sector [22,30].
In this context, this study proposes to analyze three different alternative scenarios using the Long-range Energy Alternatives Planning (LEAP) system, with the aim of converting the current structure of the thermal power generation system characterized by the consumption of petroleum fuels, into a sustainable system based on renewable energies (hydroelectric, wind, solar, biomass, biogas) and natural gas. The NGCC (natural gas combined-cycle) power plants would start operations looking to gasify the TPPs (thermal power plants) which is possible through two ways. The first action is to close as much as possible the TPPs that consume petroleum fuels (diesel, fuel oil, residue, and crude oil) and to close obsolete TPPs, for example, suppress TPPs with over 30 years in operation. The second action is to carry out modifications and technological upgrades in the internal combustion engines [10], steam turbines, and boilers that consume petroleum products in some TPPs to migrate towards the consumption of natural gas where is widely justified [31,32].
This research is designed for the Ecuador case, but this model could be applied to other countries that share similar characteristics, especially regarding their development condition, and natural and economic resources. Hence, this study offers valuable information on a potentially suitable solution towards a sustainable power generation system that needs to be reliable, economically profitable, and environmentally sustainable. This purpose fits within with the Sustainable Development Goals (SDGs) agreed upon by large nations under the United Nations Charter [33], which manifests the measures to achieve a better sustainable future for everyone, considering topics such as climate change, environmental degradation, and sustainable energy. The Goals consider the correct use of energy sources an essential target to improve by 2030.

2. Power Generation System Status of Ecuador

In the current status review of the power generation system of Ecuador, is included the structure of the system, the electricity supply and demand, and relevant information that will be considered in the design of the model is detailed below.

2.1. Ecuadorian Electricity Generation Structure

The power generation plants in Ecuador are divided into two groups: (a) Renewables, which correspond to energy sources such as wind, biomass, solar, biogas, and hydraulic, the latter the most important for its installed capacity and under expansion, and (b) Non-renewables, which are TPPs that consume petroleum fuels and correspond to turbo-gas, turbo-steam, and internal combustion engines (ICE) [34]. The total nominal power for 2017 (see Table 1) is divided into three types of companies controlled exclusively by the state, and belonging to the renewable and non-renewable groups. They are the following: (a) The Generators, which hold an enabling title and permit economic exploitation of one or more power generation plants of any type and that delivers its total or partial production at one or several points in the National Transmission System (SNT for its acronym in Spanish), in an isolated system or a distribution network; (b) The Distributors, who have an enabling title and who, by express mandate of the law, assumes the obligation to provide a public service of electric power to the final customers, within their area of service provision; and (c) The Self-Generators, which are dedicated to a productive or commercial activity, whose electricity generation is destined to its consumption and to produce electricity surpluses available for the public service [34].
As a consequence of a significant construction plan for electricity generation in the country, the installed capacity increased since 2007 from 4478 to 6005 MW in 2015. At the end of 2017, the hydroelectric installed power capacity was the most important in the country with 4516 MW. This variation happened particularly for the start-up of eight hydroelectric projects; the two most significant ones were Sopladora of 487 MW and Coca Codo Sinclair of 1500 MW [35]. The other renewables (wind, biomass, solar, and biogas) with an installed capacity of 199 MW, and the thermal was of 3321 MW of which 500 MW was from “Machala Power” that consumed natural gas, giving a total of 8036 MW [20]. Due to the current expansion of the power generation system, the renewable sources have surpassed non-renewable sources, going from 50.59% in 2005 to 58.68% in 2017, and with a forecast that will continue to increase in the future.

2.2. Analysis of Electricity Supply

In 2007, the total gross electricity generation (GEG) was 17,337 GWh; while in 2017 it was 28,033 GWh (see Table 2), that means an increase by 61.69% in 10 years for all types of sources of the power generation system in the country.
In 2017, the total GEG was not available for public service due to several factors such as (a) self-consumption in auxiliary systems by 1.53% of GEG; (b) self-consumption of electricity from companies related to the oil activities for production and exploration processes by 13.28% of GEG; (c) losses in transmission and distribution by 12.43% of GEG; and (d) exports that are viable for economic benefits and geographic location. It is worth mentioning that electricity coverage has increased significantly in the last 10 years, from 92.9% in 2006 to 99.5% in 2017 [20,34].
The TPPs consume refined petroleum products as an energy source. Table 3 shows the types of companies with their respective sources of fuel consumption in 2017 [20,34], which shows the high consumption of fuel oil and diesel around 40% of the total. In the case of total consumption of natural gas (24.62%), the free gas production of the “Amistad” field represents 59.71%, and the self-consumption of associated gas corresponds to 40.29% of the total oil production.
The consumption of fuel oil, diesel, and other petroleum fuels represent more than half of the total consumption (60.70%). In Ecuador, diesel is an imported product that represents 2557 kTOE (56.99%) of the total consumption, representing 4486 kTOE in 2017 [36]. Nowadays, importing diesel is mandatory for Ecuador, it is attributed to the reduced capacity of the refining park. Its production does not satisfy the demand in all sectors of the economy of the country, which makes it a vulnerable product to the incessant fluctuations of the oil price in the international market. However, a possible alternative is to increase the consumption of natural gas with the production of the reserves from the “Amistad” gas natural field (located offshore in Ecuador) to reduce the consumption of petroleum fuels, which are expensive for the country and whose by-products during the combustion are gases that contribute to global warming.

2.3. Analysis of Electricity Demand

In 2017, the total gross electricity demand was 28,033 GWh [34]. Thus, the gross electricity consumption per capita corresponded to 1670.91 kWh for that year, where it presented a slight increase of 1.68% concerning 2016 [36]. Table 4 shows the total net electricity demand [20], which grew significantly from 10,940 GWh in 2007 to 20,204 GWh in 2017 showing an increase of 84.68% with a net electricity consumption per capita of 1204.28 kWh. Between 2016 and 2017 there was an increase in electricity demand going from 18,867 GWh to 20,204 GWh, which represents 7.09% more, mainly due to the expansion of the industrial sector. Hence, the total net electricity demand is the total GEG less the electricity consumed by the auxiliary systems, less the losses in the transmission and distribution systems, and therefore it was 20,204 GWh.

2.4. Relevant Information for the LEAP Model

The national plan for electricity generation, transport, and distribution needs to cover all the electricity demand and promote renewable energies to become a sustainable system. In this way, electricity production has been planned from hydroelectric generation due to the theoretical hydroelectric potential of the country with around 90,976 MW [37]. In fact, in the 2013–2018 period, 16 hydroelectric projects with 2877 MW of nominal capacity have been developed. Furthermore, it has been necessary to rehabilitate old power plants and, to a lesser extent, to build new energy-efficient TPPs that consume fossil fuels, since their contribution is essential to provide the necessary energy stability during periods of water scarcity.
According to the development of TPPs, only the “Machala Power” is an NGCC power plant [38]. The natural gas needed to operate this power plant is obtained from the “Amistad” field, also called “Bloque 6”, which is a natural gas field operated by Petroamazonas EP. It is located offshore in the Pacific Ocean in the Gulf of Guayaquil, 65 km from Puerto Bolivar in Ecuador, and approximately 72 km from the natural gas treatment plant in the Bajo Alto town, where seven gas wells are currently in production [39]. Throughout 2018, the production of free natural gas has remained constant at around 763 tonnes of oil equivalent per day (TOE/day) (33 million standard cubic feet per day) [18]. According to the latest studies, the proven reserves of natural gas in the “Amistad” field are around 40,000 kTOE (1.7 trillion cubic feet) [40,41].
Once it is determined that the reserves assessments are correct, the natural gas of the Amistad field would help to substitute the consumption of diesel, fuel oil, residue and crude oil for electricity generation, which currently corresponds to 1277 kTOE per year. Hence, Ecuador has enough natural gas reserves to give the necessary time for building the essential infrastructure to continue with the total conversion towards a fully sustainable power generation system. At this time, it is crucial to consider natural gas as a backup of renewable energy sources according to the national reserves and the high efficiency that can be reached through NGCC technology [32].

3. Methodology

The Long-range Energy Alternatives Planning (LEAP) system is an integrated software tool used to perform energy policy analysis, which is a widely-used for energy policy planning, climate change assessment, and cost analysis in a defined period. It is done by designing alternative scenarios, where each one has its specific information. All these characteristics allow developing a demand energy analysis based on demographic and macroeconomic data of the study area [42].
Accordingly, for the demand analysis of the total energy consumption is defined through Equation (1):
E C i = A L i ( t )   ×   T E i ( t ) ,
where EC represents the total energy consumption for a specific sector i, AL is the activity level in percentage (%) of the social or economic activity sector i for which energy is consumed in the time t in years, and TE is the annual total final consumption of energy in GWh of the sector i, in the time t in years. Then, the result of the total energy consumption of the country is obtained by adding up the results of each demand sector [43].
According to the analysis for atmospheric polluting, the used method for emissions is per consumed energy unit for each fuel source based on the Technology and Environmental Database (TED). TED includes polluting emission factors proposed by the Intergovernmental Panel on Climate Change (IPCC) [44], where the polluting emissions are classified by default in a hierarchical form according to the energy demand by sectors of a system [42]. The pollutant emissions were analyzed with Equation (2):
P E = E C i j ( t ) × E F j k ( t ) ,
where EC is the total energy consumption of the sector i under fuel type j, and EF is the emission factor of pollutant type k under fuel type j, in the time t in years [45].

3.1. Ecuador’s LEAP Model Framework

In the 2018–2040 study period, the LEAP software system was used to analyze the long-term electricity supply and demand forecast, and where the statistical data from 2017 was included as the baseline year into LEAP. Although, there are similar studies mainly related with the assessment of electricity supply and demand forecast such as (a) the case of Maharashtra (India) developed by Kale and Pohekar (2014); (b) Pakistan´s electricity sector studied by Hussain et al. (2018); (c) Bangladesh´s case studied by Mondal, Boie, and Denich (2010) [46]; and the study of Panama´s electricity sector analyzed by McPherson and Karney (2014); the current study presents a significant difference: to introduce a massive consumption of natural gas in S2 and S3 to progressively transform the current electricity power generation system into a sustainable power system.
The S2 and S3 scenarios would be composed mostly by hydroelectric, other renewables (wind, solar, biomass, biogas) and NGCC power plants, and simultaneously, the TPPs that consume oil products (diesel, fuel oil, residual oil, and crude oil) will be progressively closing.
Apart from the three alternative proposed scenarios to evaluate the future structure and behavior of the Ecuadorian power generation system, this work also includes a summary of emissions analysis in CO2 equivalent (CO2e) units through TED [42], and an analysis of the electricity production cost.
Additionally, relevant input data was included from two previously published studies as a part of the baseline year data for the analysis of the three alternative scenarios where (i) Ponce-Jara et al. (2018) made a complete review of the Ecuadorian electric sector between 2007 and 2017 and discussed the different energy policies and their impact on the economy of the country, and (ii) Pinzón (2018) studied the dynamics between energy consumption and economic growth [47], where Ecuador seeks to achieve sustainable development by analyzing energy consumption and economic growth based on demand and dependence on petroleum products and their subsidies.
On the other hand, historical and statistical data about the power generation system developed by public organizations of the national government was included regarding (a) population growth and gross domestic product per capita [24]; (b) the report of “Scenarios of energy prospects for Ecuador in 2050” [48]; (c) Annual and Multiannual Statistics of the Ecuadorian Electricity Sector 2017 [34]; (d) The National Energy Balance 2017 [20]; (e) the reports “Electrification Master Plan 2016–2025” and “National Energy Efficiency Plan 2016–2035” [49].
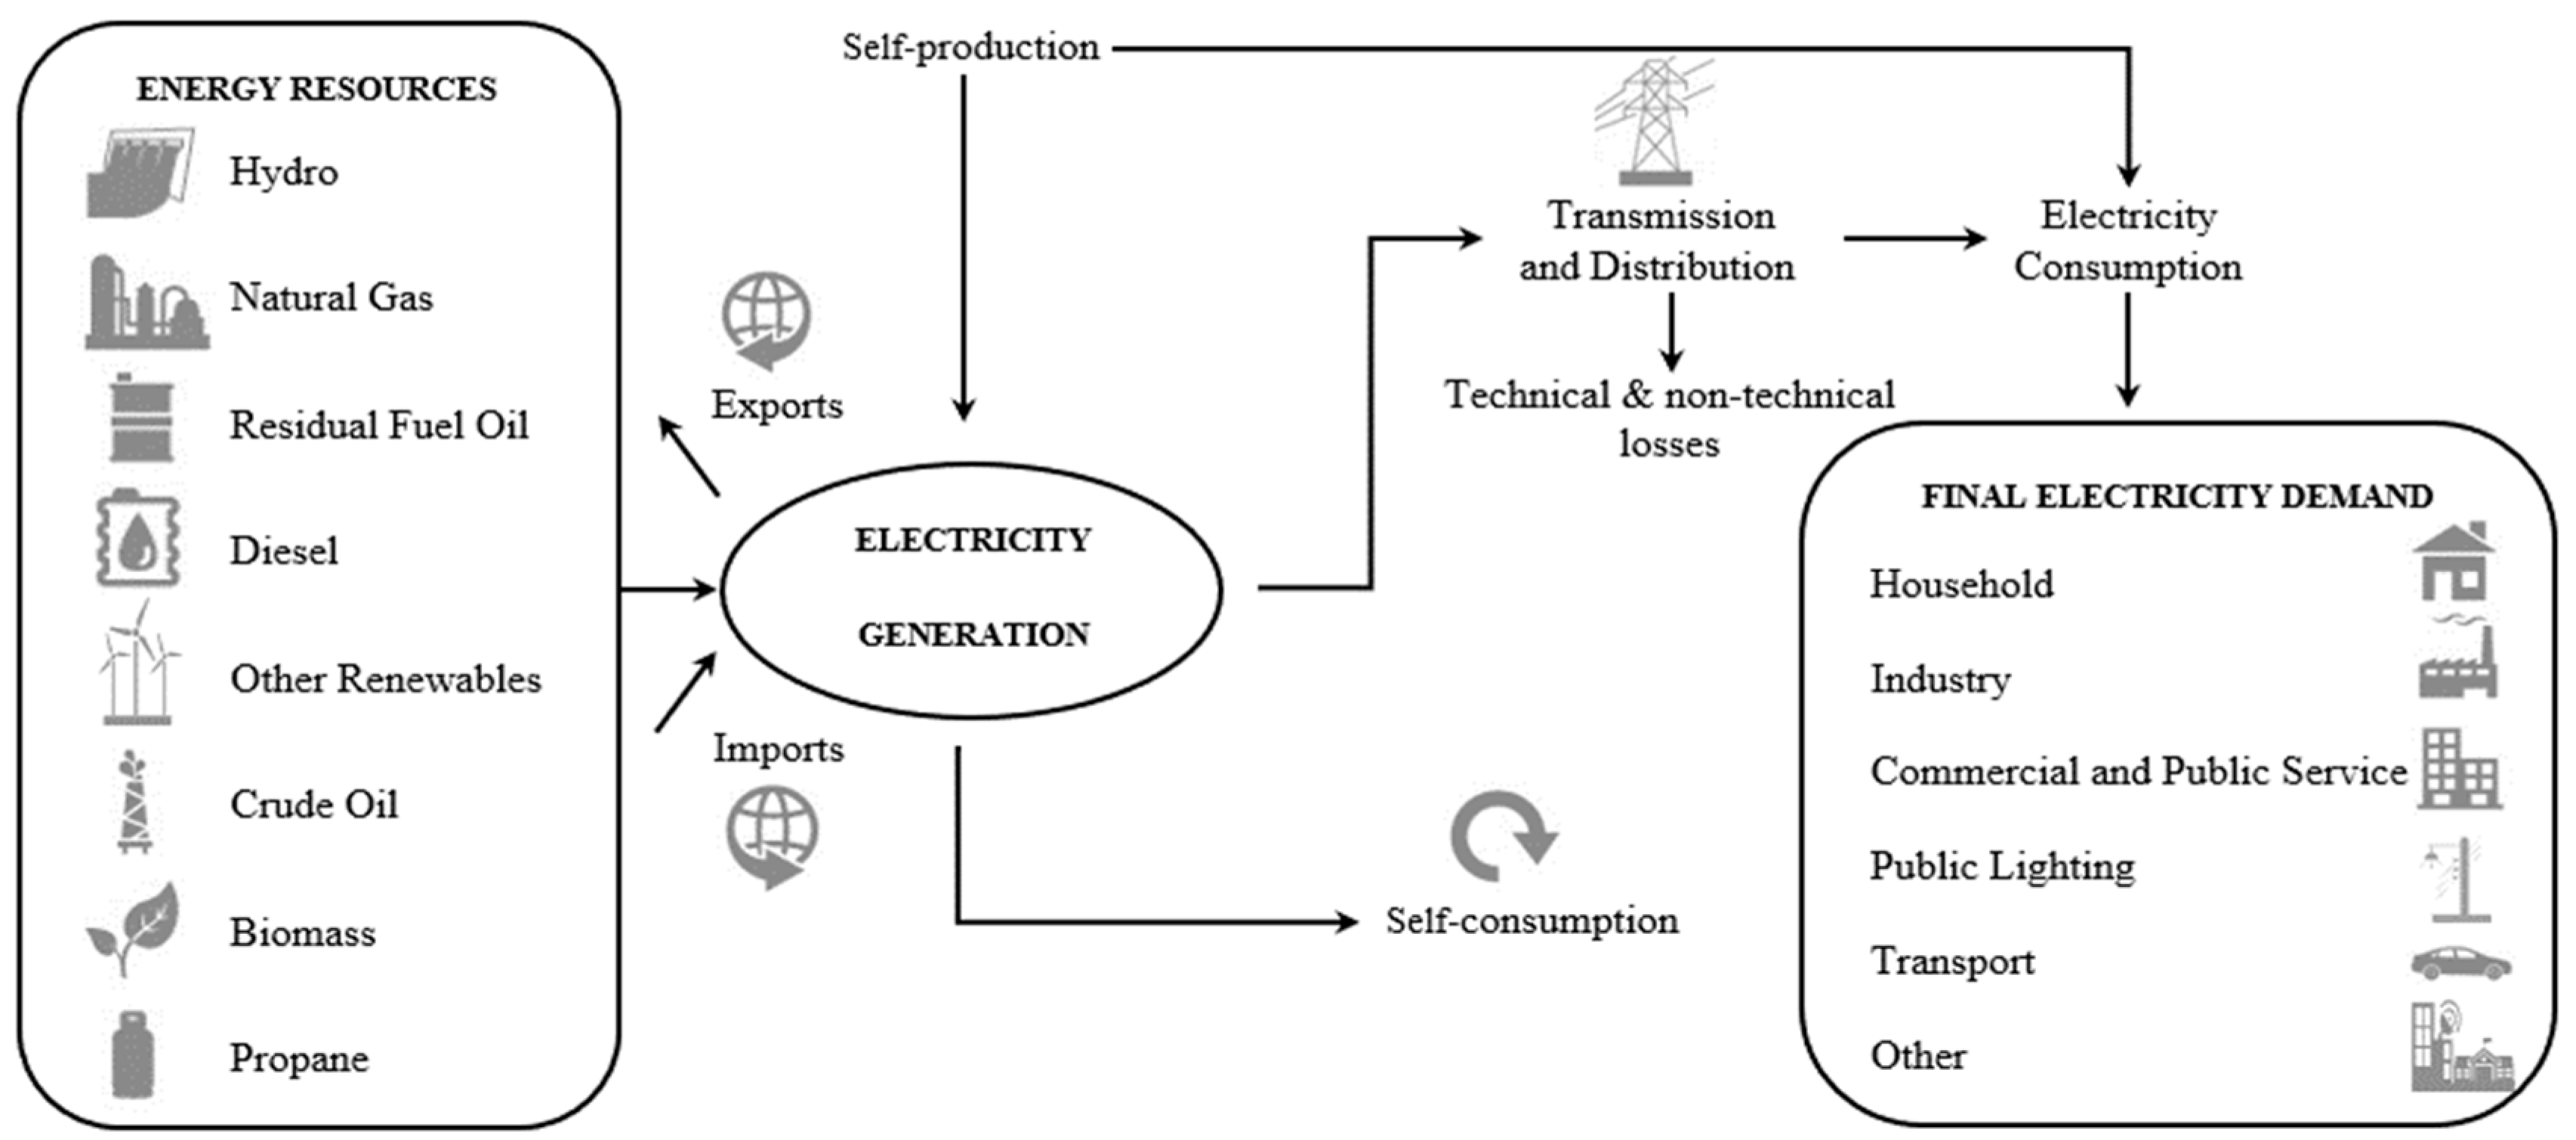
All input data used for designing the scenarios into the LEAP model is detailed in Section 3.2; this data will support the scenario design development until 2040. Thereby, Figure 1 shows the base of the power generation system framework of Ecuador´s LEAP model.

3.2. Base Values and Main Assumptions into the LEAP Model for Ecuador

The demand growth for each scenario is deliberately different attributed to the discrepancy of electricity consumption per capita in the last years. Thereby the S3 demand is higher than S2 demand, and the S2 demand is higher than the S1 demand. This decision will allow simulating different levels of demand to identify and evaluate the behavior of the future structure of the power generation system. Then, Table 5 shows the parameters, base values, and assumptions for 2017 (baseline year), which are the same for the three scenarios S1, S2, and S3, and Table 6 shows the summary of input data used in the LEAP model for the renewables, thermal, and NGCC power plants.

3.3. Scenario Design Description

The LEAP model for forecasting energy demand scenarios has no definite theory or criterion to determine the exact number of scenarios. Therefore, each scenario can represent logical forecasts of how a power generation system could develop over time according to their policies or as a combination between them [42].
Thus, in this research, the authors decided to formulate and analyze three alternative electricity demand scenarios. S1: Business As Usual; S2: Power Generation Master Plan; and S3: Sustainable Power Generation System.
Moreover, some parameters, considerations, and assumptions for S1, S2, and S3 are described in Table 7, showing the summary of six applied energy efficiency plans or programs in Ecuador´s scenarios in the LEAP model, and their particular conditions are shown in Table 8, respectively [55].

3.3.1. S1: Business as Usual

The design of this scenario is based on the behavior of the Ecuadorian electric sector during the last 11 years, which describes a trend that could be kept over the next years if no energy policy measures are introduced and only small changes of the system can happen. Additionally, the power generation plants that culminate their useful life will be replaced by power generation plants with the same technology, and the new power electricity demand will be covered mainly by hydroelectric and TPPs; while the new renewable and NGCC power plants will follow the trend of recent years.

3.3.2. S2: Power Generation Master Plan

Initially, this scenario considers the approved official proposal from CONELEC (2013c) and MEER (2017a), who developed the “Electrification Master Plan 2016–2025”. This study contemplates that new power generation plants will start operation in 2019, of which five are hydroelectric, and two are NGCC power plants. In 2020, 11 new power generation plants are planned to start operations of which eight are hydroelectric. In 2021, two NGCC power plants of 250 and 125 MW and, some TPPs are scheduled to start operation with 150 MW in the Guayas Province. In 2022, two hydroelectric power plants of 915 MW are scheduled to open, and other non-conventional renewable power generation projects of 200 MW in power.
Furthermore, the power of the TPPs remains constant between 2017 and 2040, and those power generation plants currently in operation that finish their operational cycle are replaced by electricity generations plants of the same type. It is considered that the TPPs will cover the generation deficiencies when the hydroelectric, other renewables, and NGCC power plants cannot start operations attributed to any circumstance.
Additionally, the current TPPs with obsolete technologies that consume petroleum fuels are replaced by NGCC power plants to cover the new electricity demand (see Table 6, about Merit Order Dispatch for S2).
Finally, the “Santiago” hydroelectric project of 3600 MW is included in 2030 [60], which is currently at the stage of final studies for final construction.

3.3.3. S3: Sustainable Power Generation System

In this scenario, the most relevant decisions have been taken to refurbish the current power generation system that consumes petroleum fuels by a sustainable system composed by hydroelectric, renewables, and NGCC power plants. Similar to S2, energy policy decisions are included regarding the execution of “Electrification Master Plan 2016–2025” [30]. Additionally, the “Santiago” hydroelectric project is considered to start in 2025 [60].
Furthermore, the TPPs currently in operation continue their useful life until the final closure, and no new TPPs will be installed because NGCC power plants will replace them. Additionally, replacement measures are applied to TPPs with obsolete technologies that consume petroleum fuels by NGCC power plants to supply the current and future power demand. The new hydroelectric, renewable, and NGCC power plants will open to cover the 100% of the total electricity demand, and in this way to convert the power generation system in a sustainable system until 2040, considering Ecuador´s Electric Law that puts emphasis on the promotion of renewable energy sources for electricity generation [15].

4. Results and Discussion

4.1. Forecast of the Total Net Electricity Demand

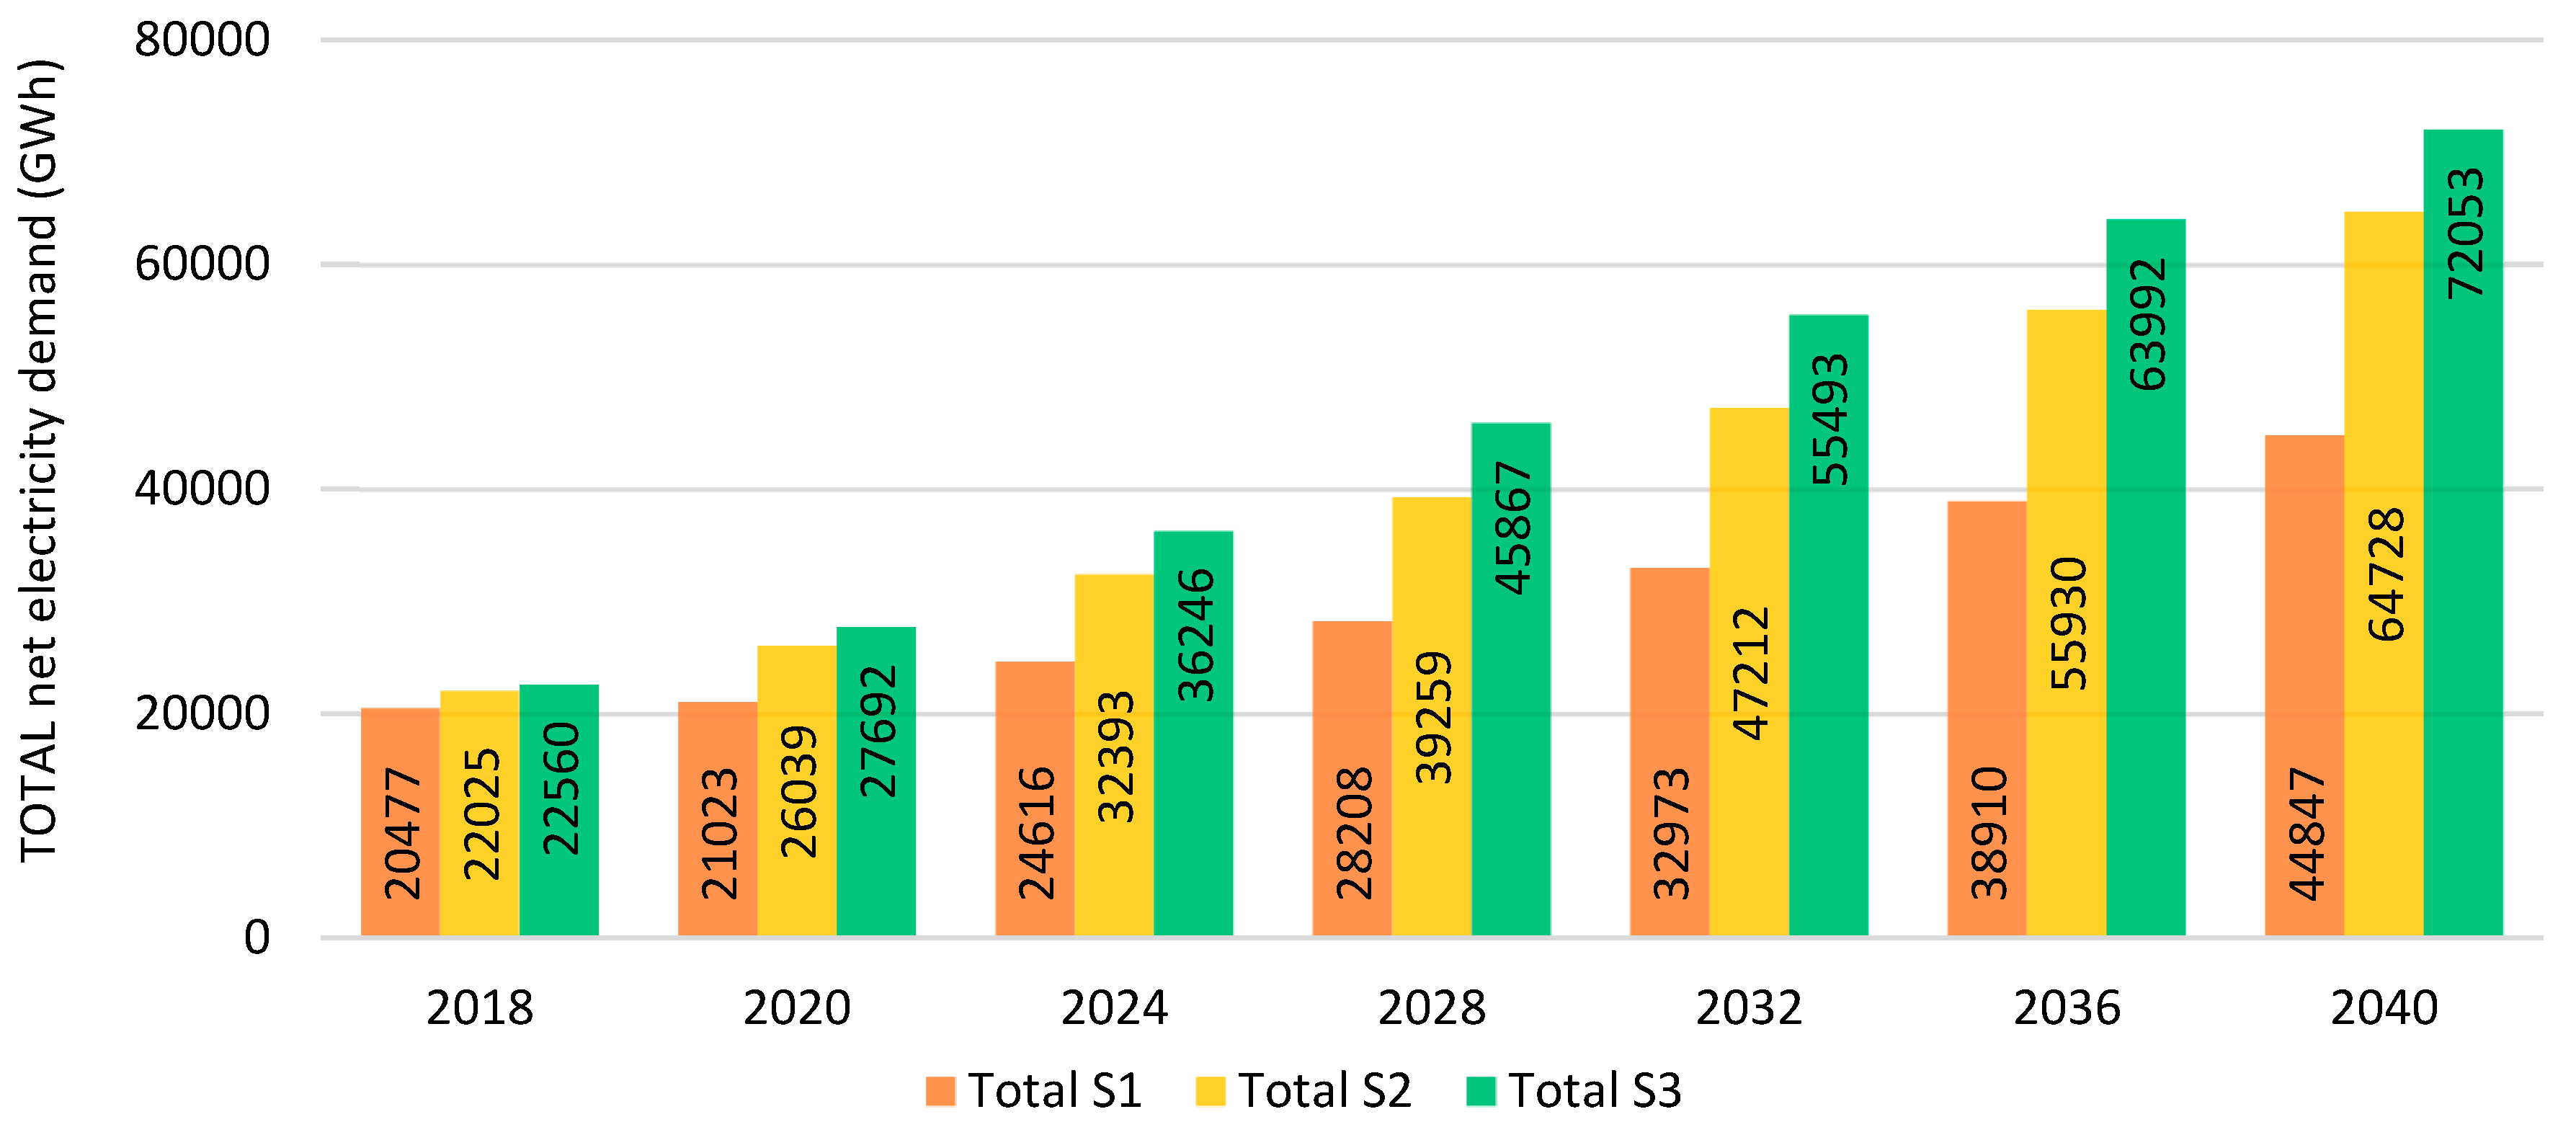
The total net electricity demand is defined by the total gross electricity generation less the electricity absorbed by the self-consumption in auxiliary systems, and the losses in transmission and distribution systems. Thus, the forecast for the total net demand in the three scenarios shows significant differences. It was divided into six different sectors for scenarios S1, S2, and S3. Figure 2 shows the total net electricity demand for the three scenarios S1, S2, and S3. S1 net electricity demand increased by 121.97%, from 20,204 GWh in 2017 to 44,847 GWh in 2040. In the case of S2, there is an increase of 220.37%, which reaches 64,728 GWh in 2040. S3 shows the most significant growth increasing 256.63%, going from 20,204 GWh in 2017 to 72,053 GWh in 2040.
On the other hand, the most significant electricity demand in the three scenarios is the residential sector, followed by the industrial, and then by the commercial and public service sectors (see Supplementary Information for electricity demand by sector in Figures SI1, SI2, and SI3). Moreover, in S1 the percentage trend in the electricity demand of the transport sector is practically maintained because there are no significant changes in the structure of the new demand. Only in S2 and S3 are important changes observed in that sector, from 0.05% in 2017 to 6.55% and 6.10% of the net demand in 2040, respectively.
Finally, on one hand, scenarios S2 and S3 show significant values of electricity demand for the transport sector since 2020. This condition is mainly due to the income of the electric vehicles fleet, but also to the massive passenger transport (The Quito Metro and Cuenca tram), and the freight train between Quito and Guayaquil. On the other hand, in S1 the growth trend of electricity demand is minimal.

4.2. Forecast of the Total Installed Capacity

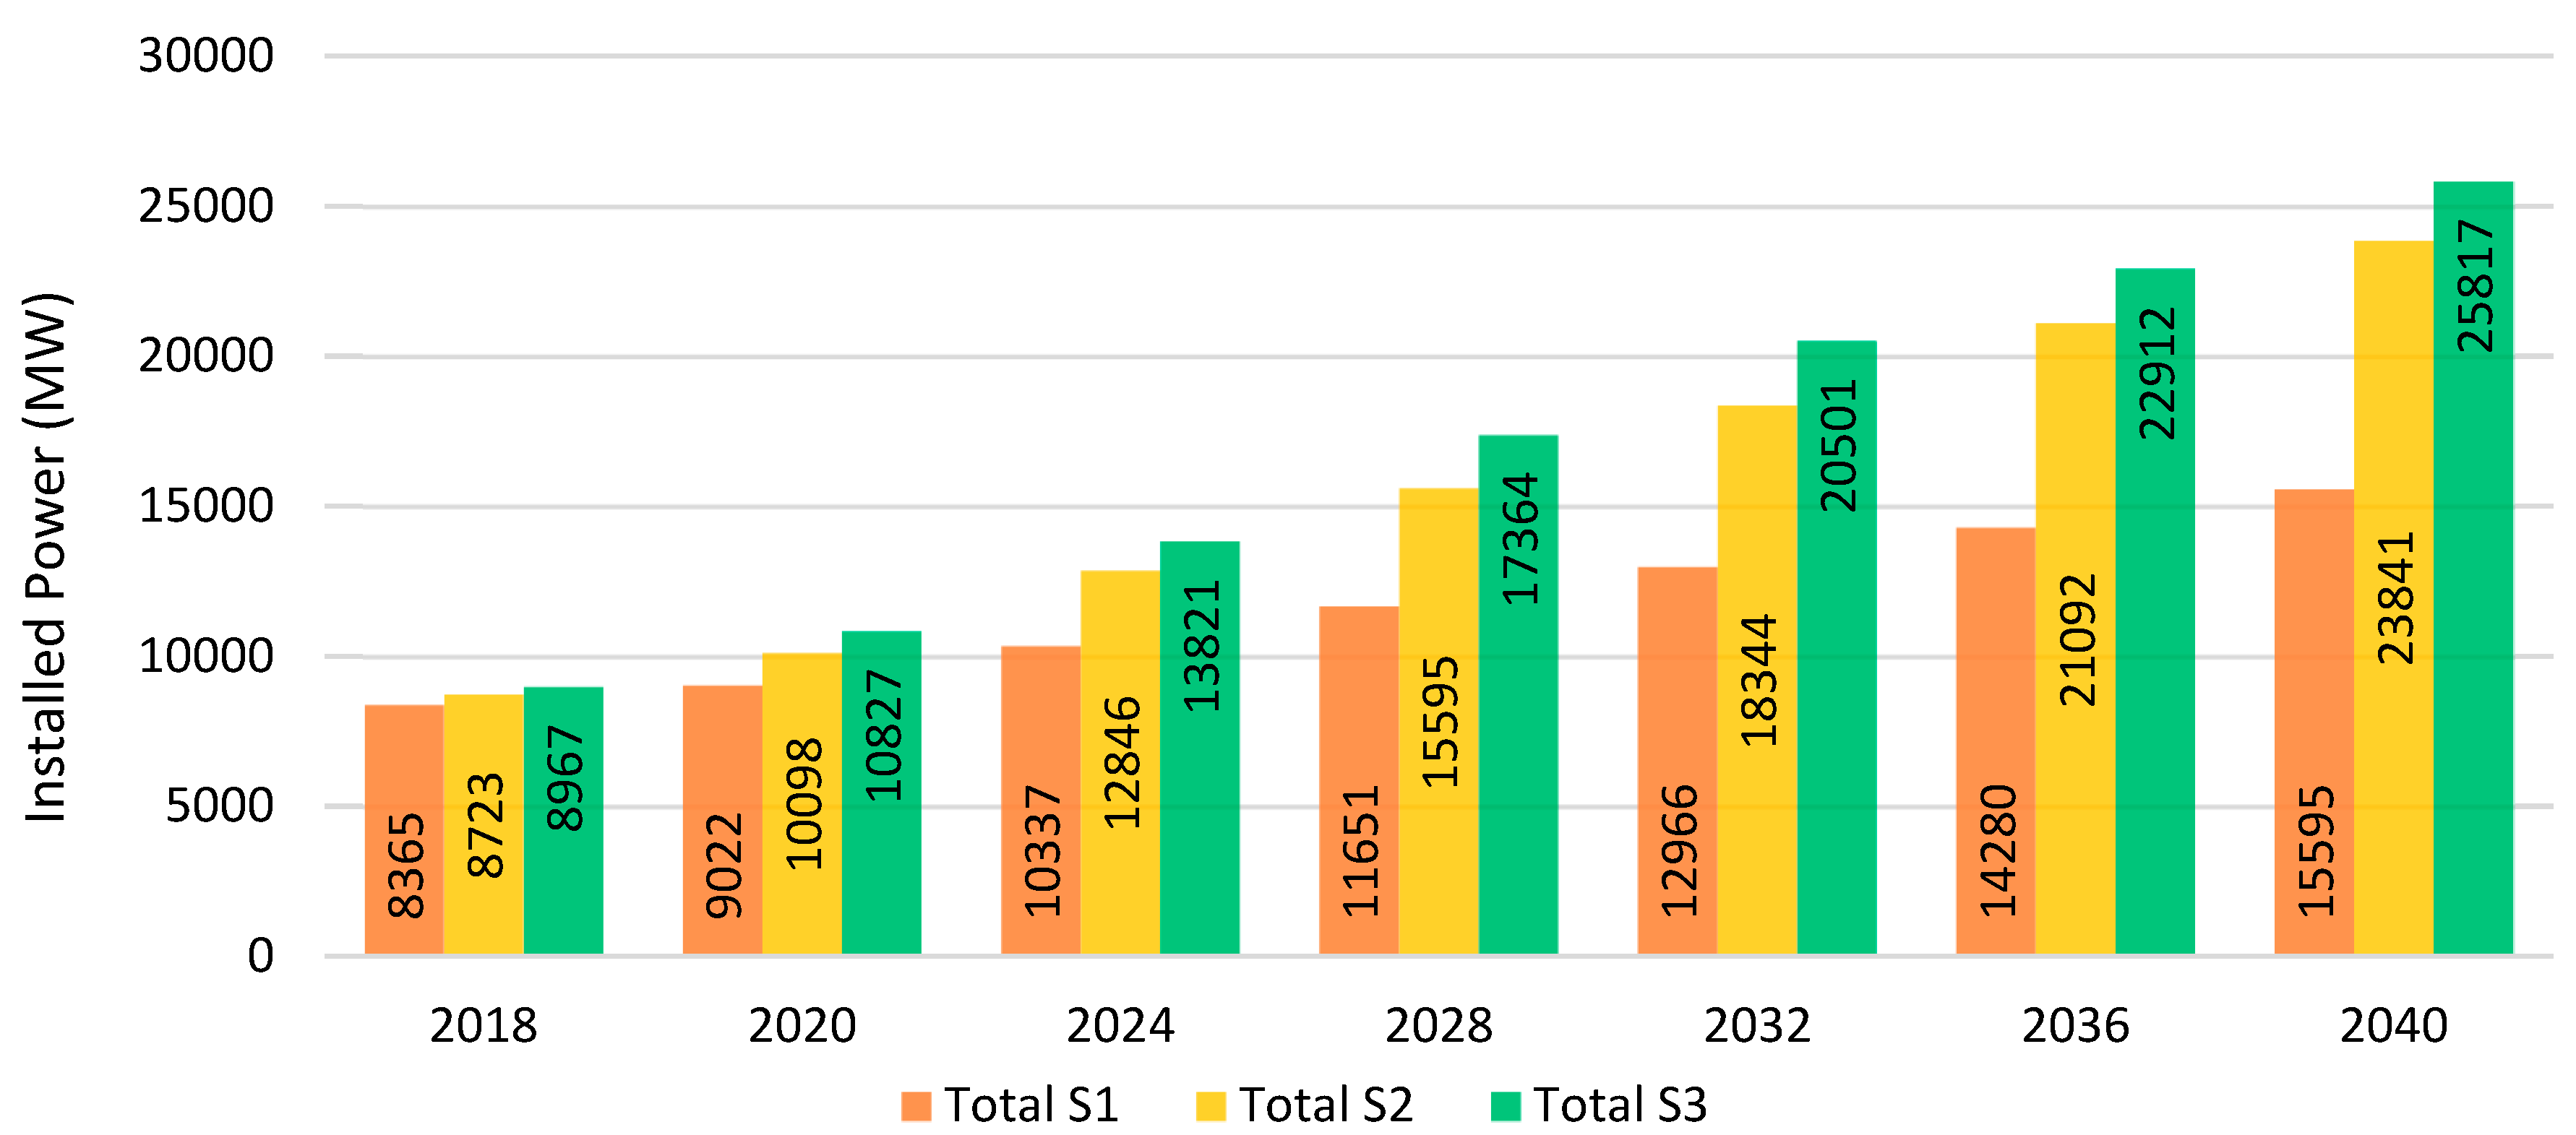
In the case of the total installed capacity in the 2017–2040 period, 
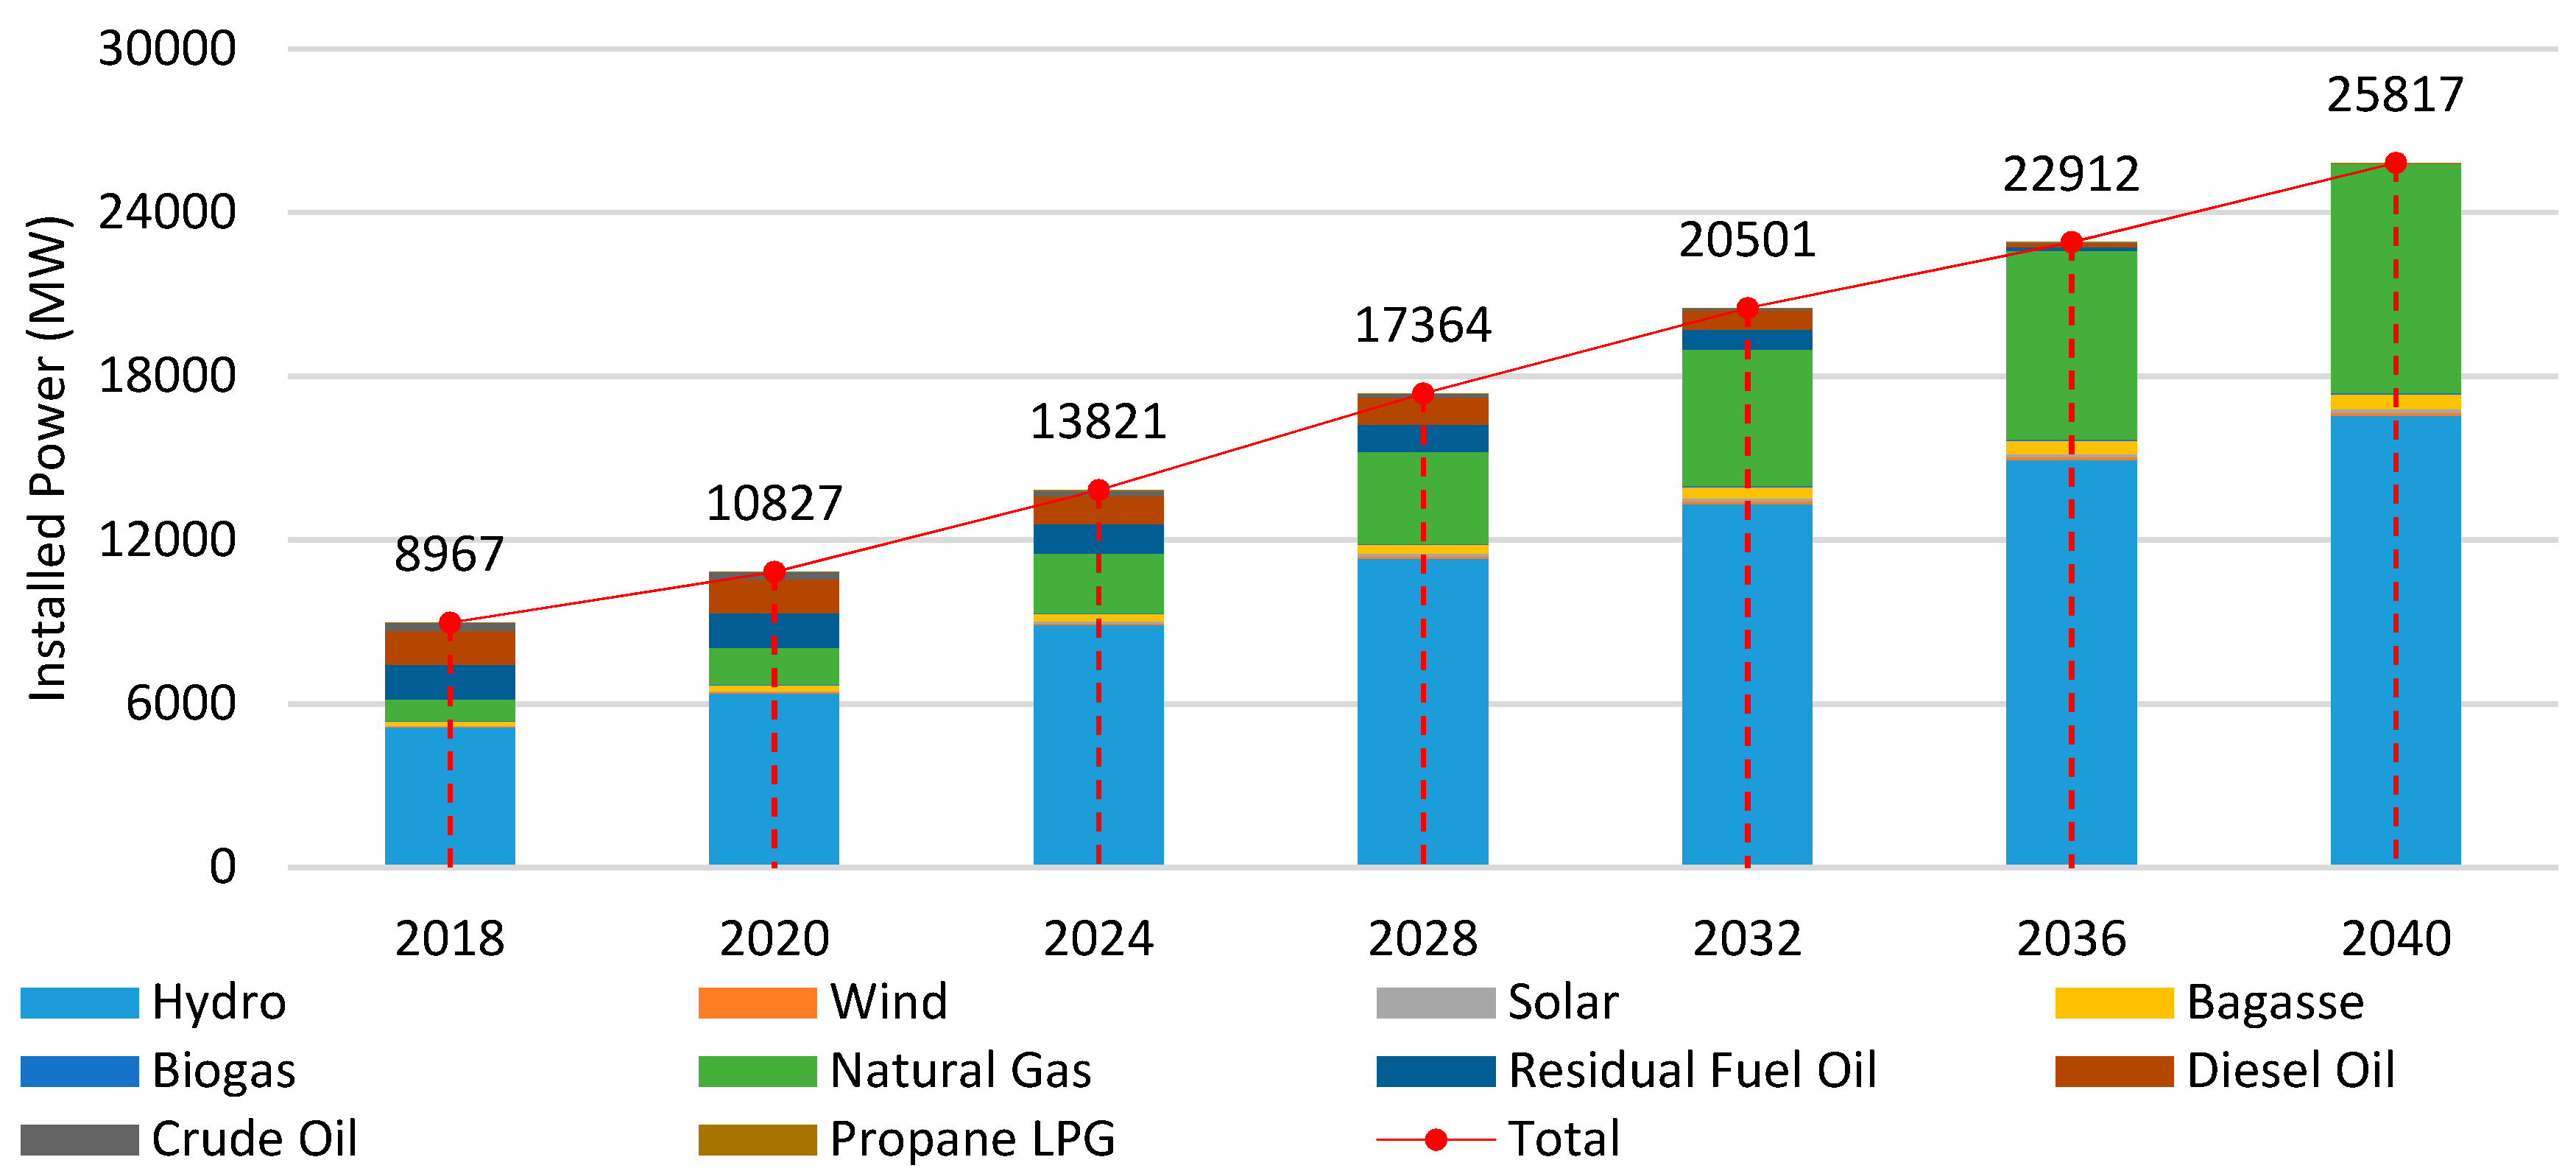
Figure 3 shows that for S1 it increases 94.06%, from 8036 to 15,595 MW, for S2 it increases 196.68%, reaching 23,841 MW, and as a result of the highest demand growth, S3 total installed capacity increases 221.27% reaching 25,817 MW, respectively. Thus, S3 installed capacity has tripled in 22 years. Therefore, S3 would be an ideal alternative scenario considering the power generation system sources, because it has a large installed capacity formed by sustainable sources to cover all the demand, sharing the generation quota with hydroelectric, NGCC, and other renewable power plants (see Figure 4). Simultaneously, it has a direct connection with the electricity generation structure shown in Figure 6.
One of the most relevant findings was that the installed capacity of renewable energies (wind, solar, biogas, and bagasse) do not become reliable support for hydroelectric and NGCC power plants in any of the three scenarios due to the current capital cost and O&M cost (see Figure 4 and Supplementary Material, Figures SI4 and SI5). The whole power generation system is supported mainly by the water resources, and due to the estimated natural gas reserves of the country.

4.3. Forecast of the Total Gross Electricity Generation

The result of the electricity generation by type of sources for S1 estimates an increase of 123.10% between 2018 to 2040, from 28,033 GWh to 62,541 GWh (see Figure 5). Then, the GEG growth in S2 is even more noteworthy (216.05%), which reaches 88,599 GWh. In this scenario, the hydroelectric and NGCC power plants would cover nearly all electricity demand. Thus, the TPPs will operate only in the case when cleaner generation power plants could not do it.
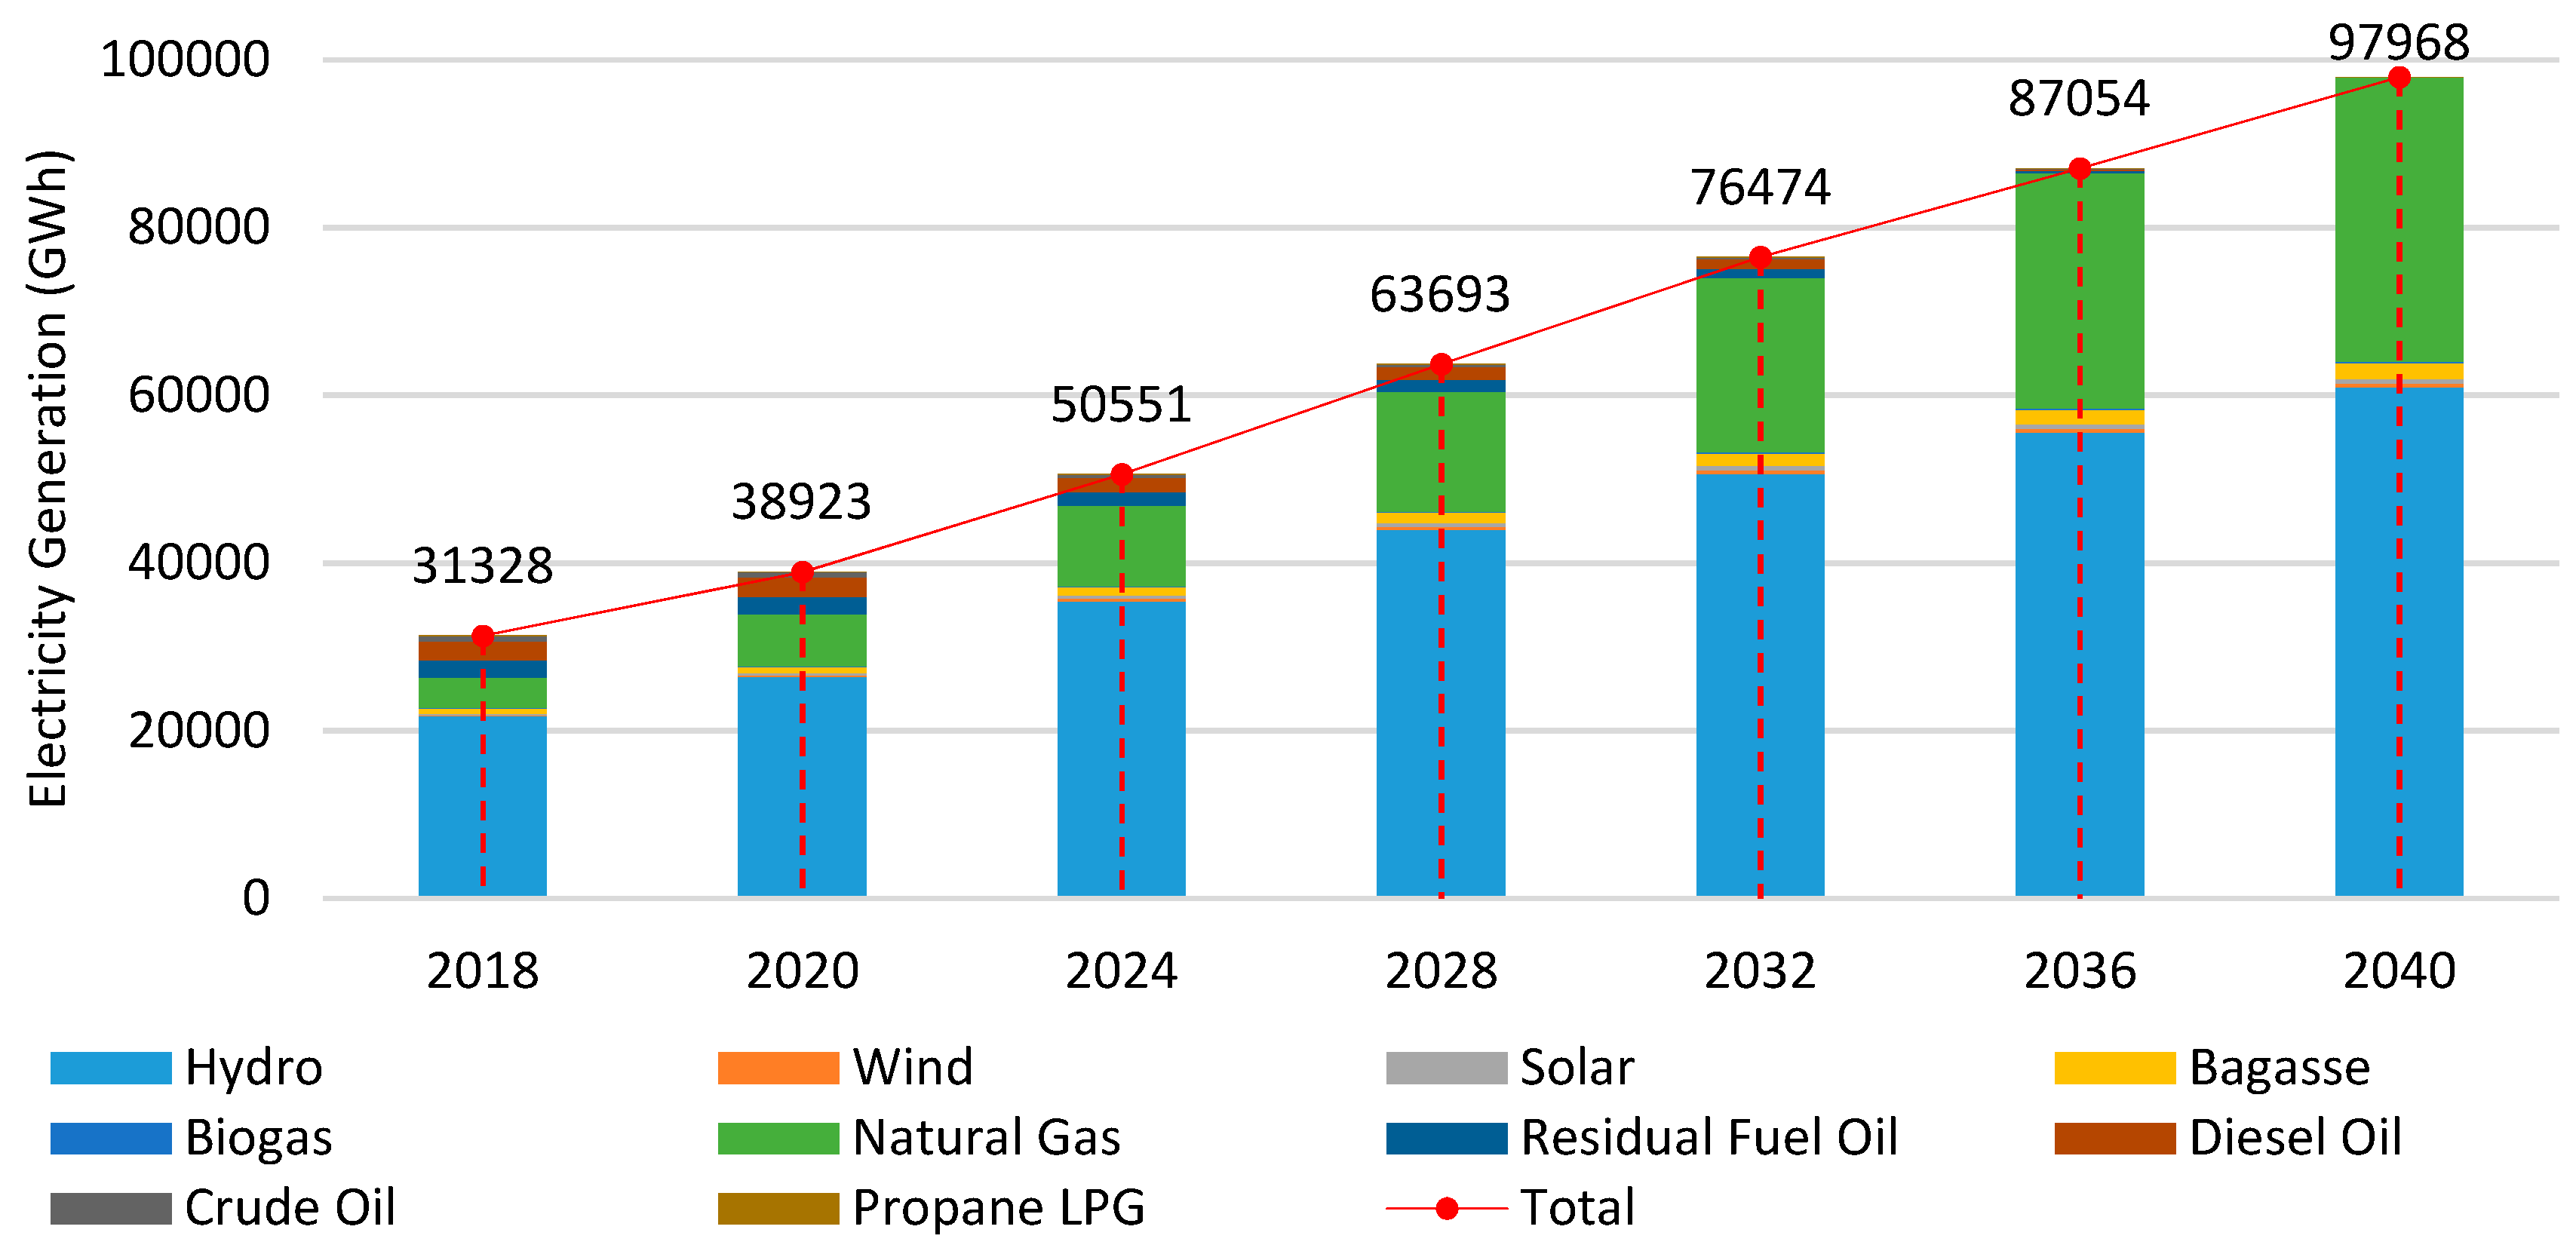
Then, in S3 the electricity generation growth would be the highest reaching 97,968 GWh, which means 249.47% more than the base year. Interestingly, the most significant result appears in 2037 onwards, where only in S3 the 100% of the total electricity generation will be covered by hydroelectric, NGCC, and other renewable power plants. Therefore, in this way, the consumption of petroleum fuels is removed, as shown in Figure 6.
Additionally, it is remarkable that the hydroelectric power plants take advantage of the abundant potential water resources available in the country. This condition gives the possibility to continue building hydroelectric power plants in “cascade”, i.e., one power plant next to another in order to use of the same reservoir water for more than one hydroelectric power plant as it happens in “Paute Integral Complex” [61]. Finally, the NGCC power plants penetrate in S2 and S3 as reliable support for the hydroelectric power plants to cover the most electricity demand, converting the current power system into a sustainable system.

4.4. Forecast of Electricity Production Cost

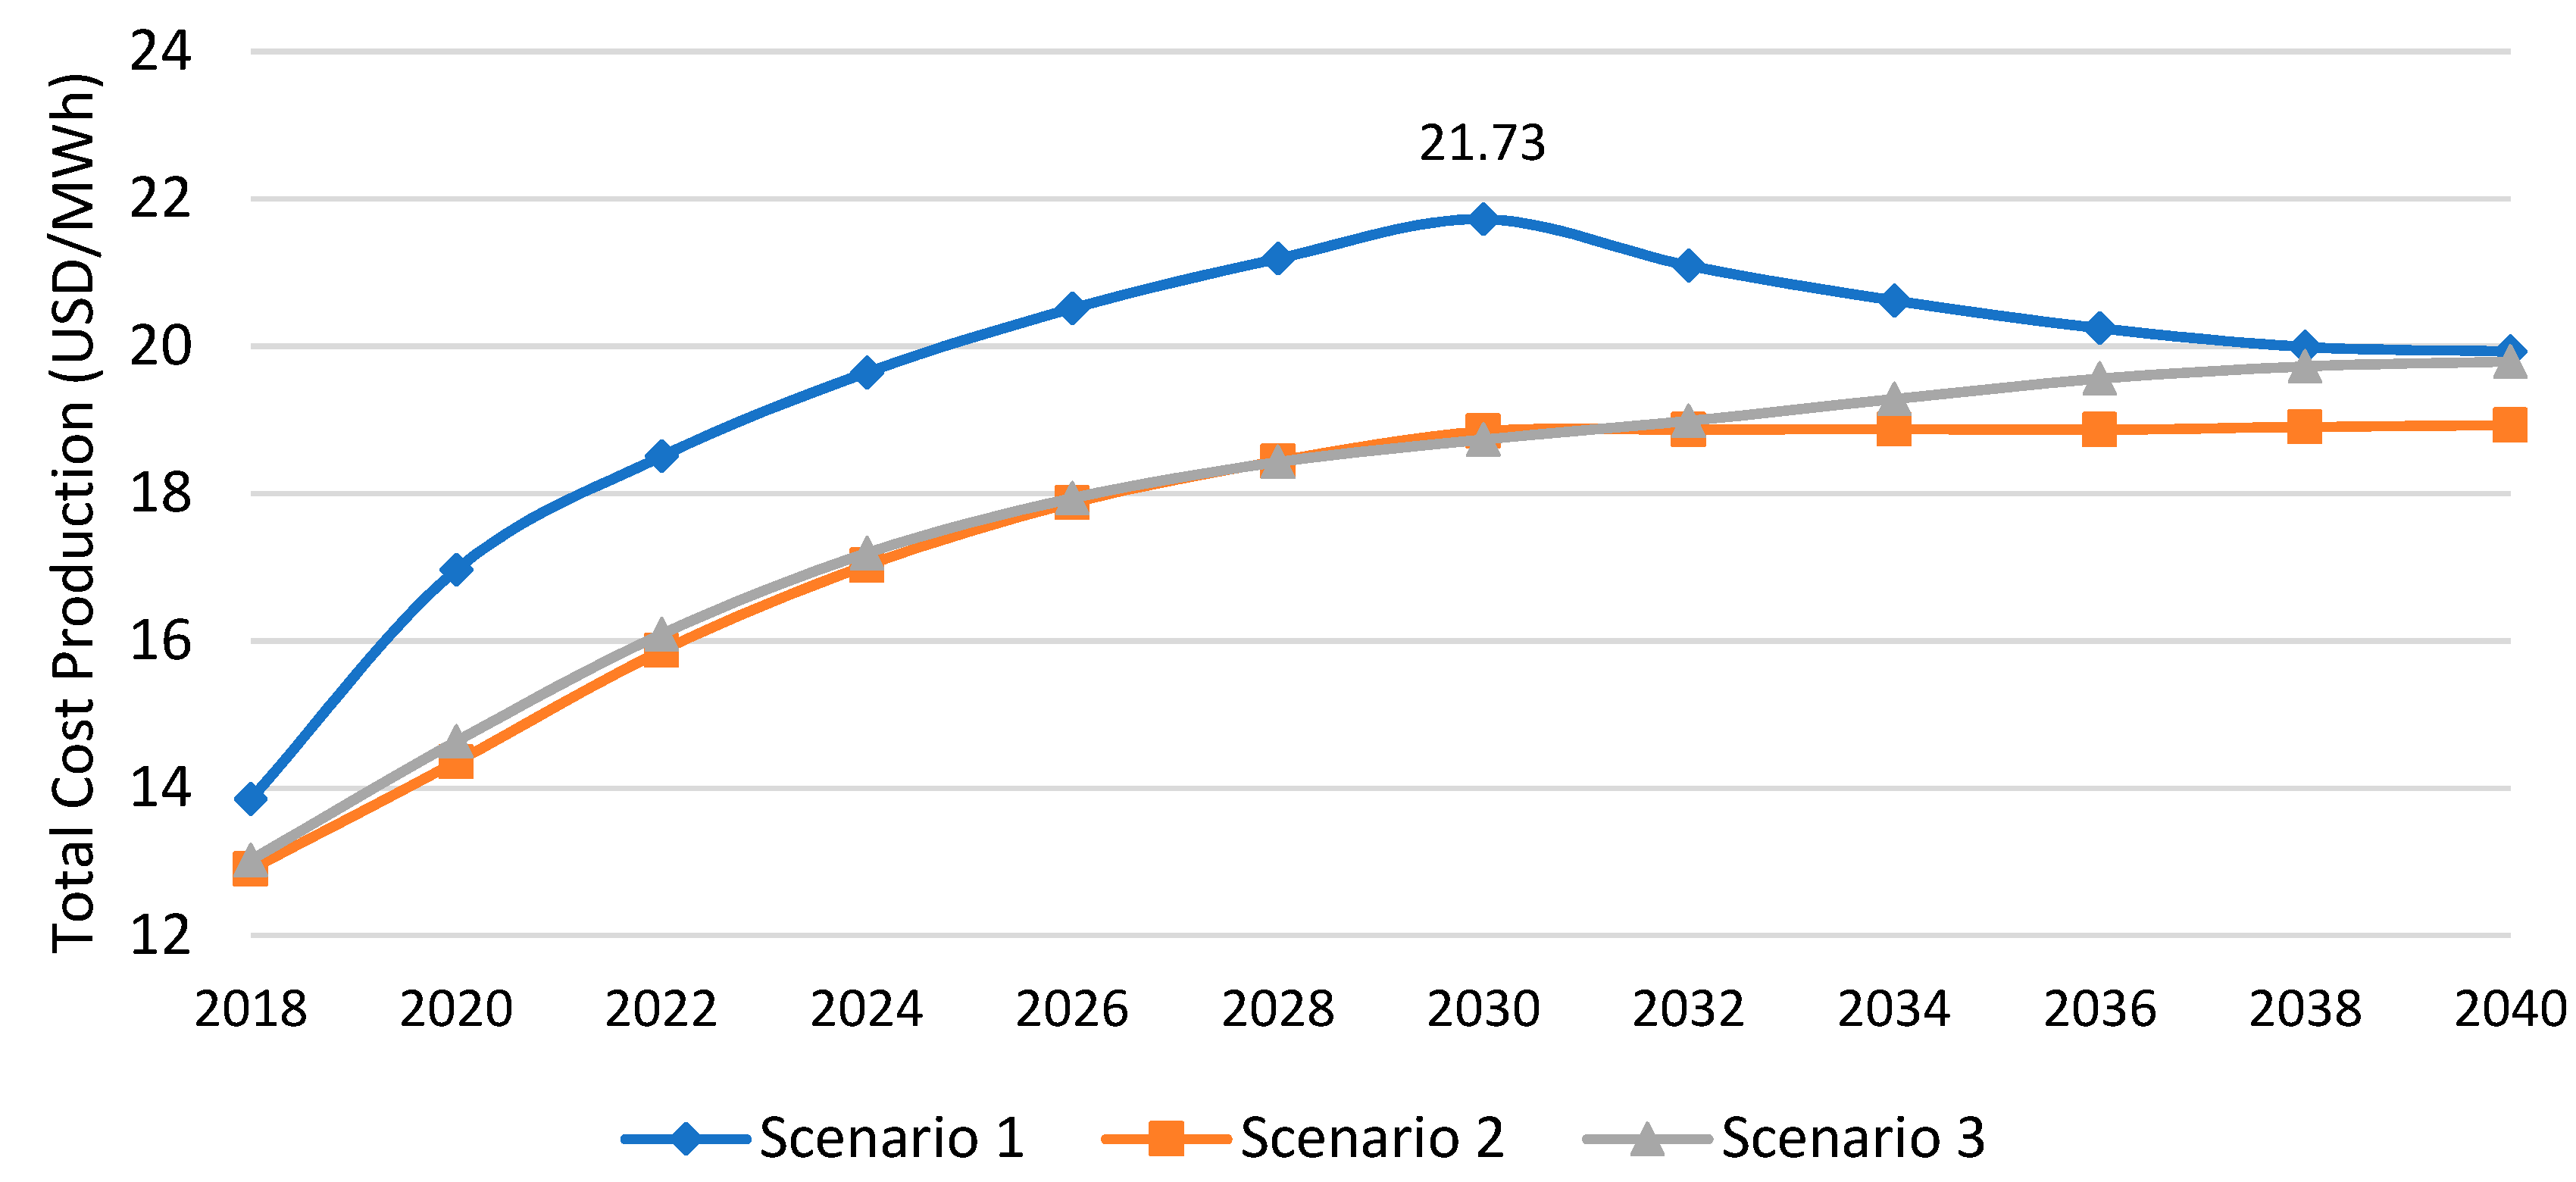
The average electricity production cost in S1 is higher than the S2 and S3 scenarios during the total analysis period, showing the highest average value of 21.73 (USD/MWh) in 2030. Closer inspection of Figure 7 shows that for S1 the average value of the electricity production cost is 19.52 (USD/MWh), for S2 is 17.48 (USD/MWh), and for S3 is 17.78 (USD/MWh).
The results estimate that the average electricity production cost for S2 and S3 is 11.67% and 9.78% less than S1, respectively, and this is a consequence of the substitution of petroleum fuels by natural gas. Significant differences there were not found between renewable sources of the average electricity production cost, where it nearly is the same for the three scenarios due to the installed capacity growth of this type of sources.

4.5. Forecast of Fuel Consumption

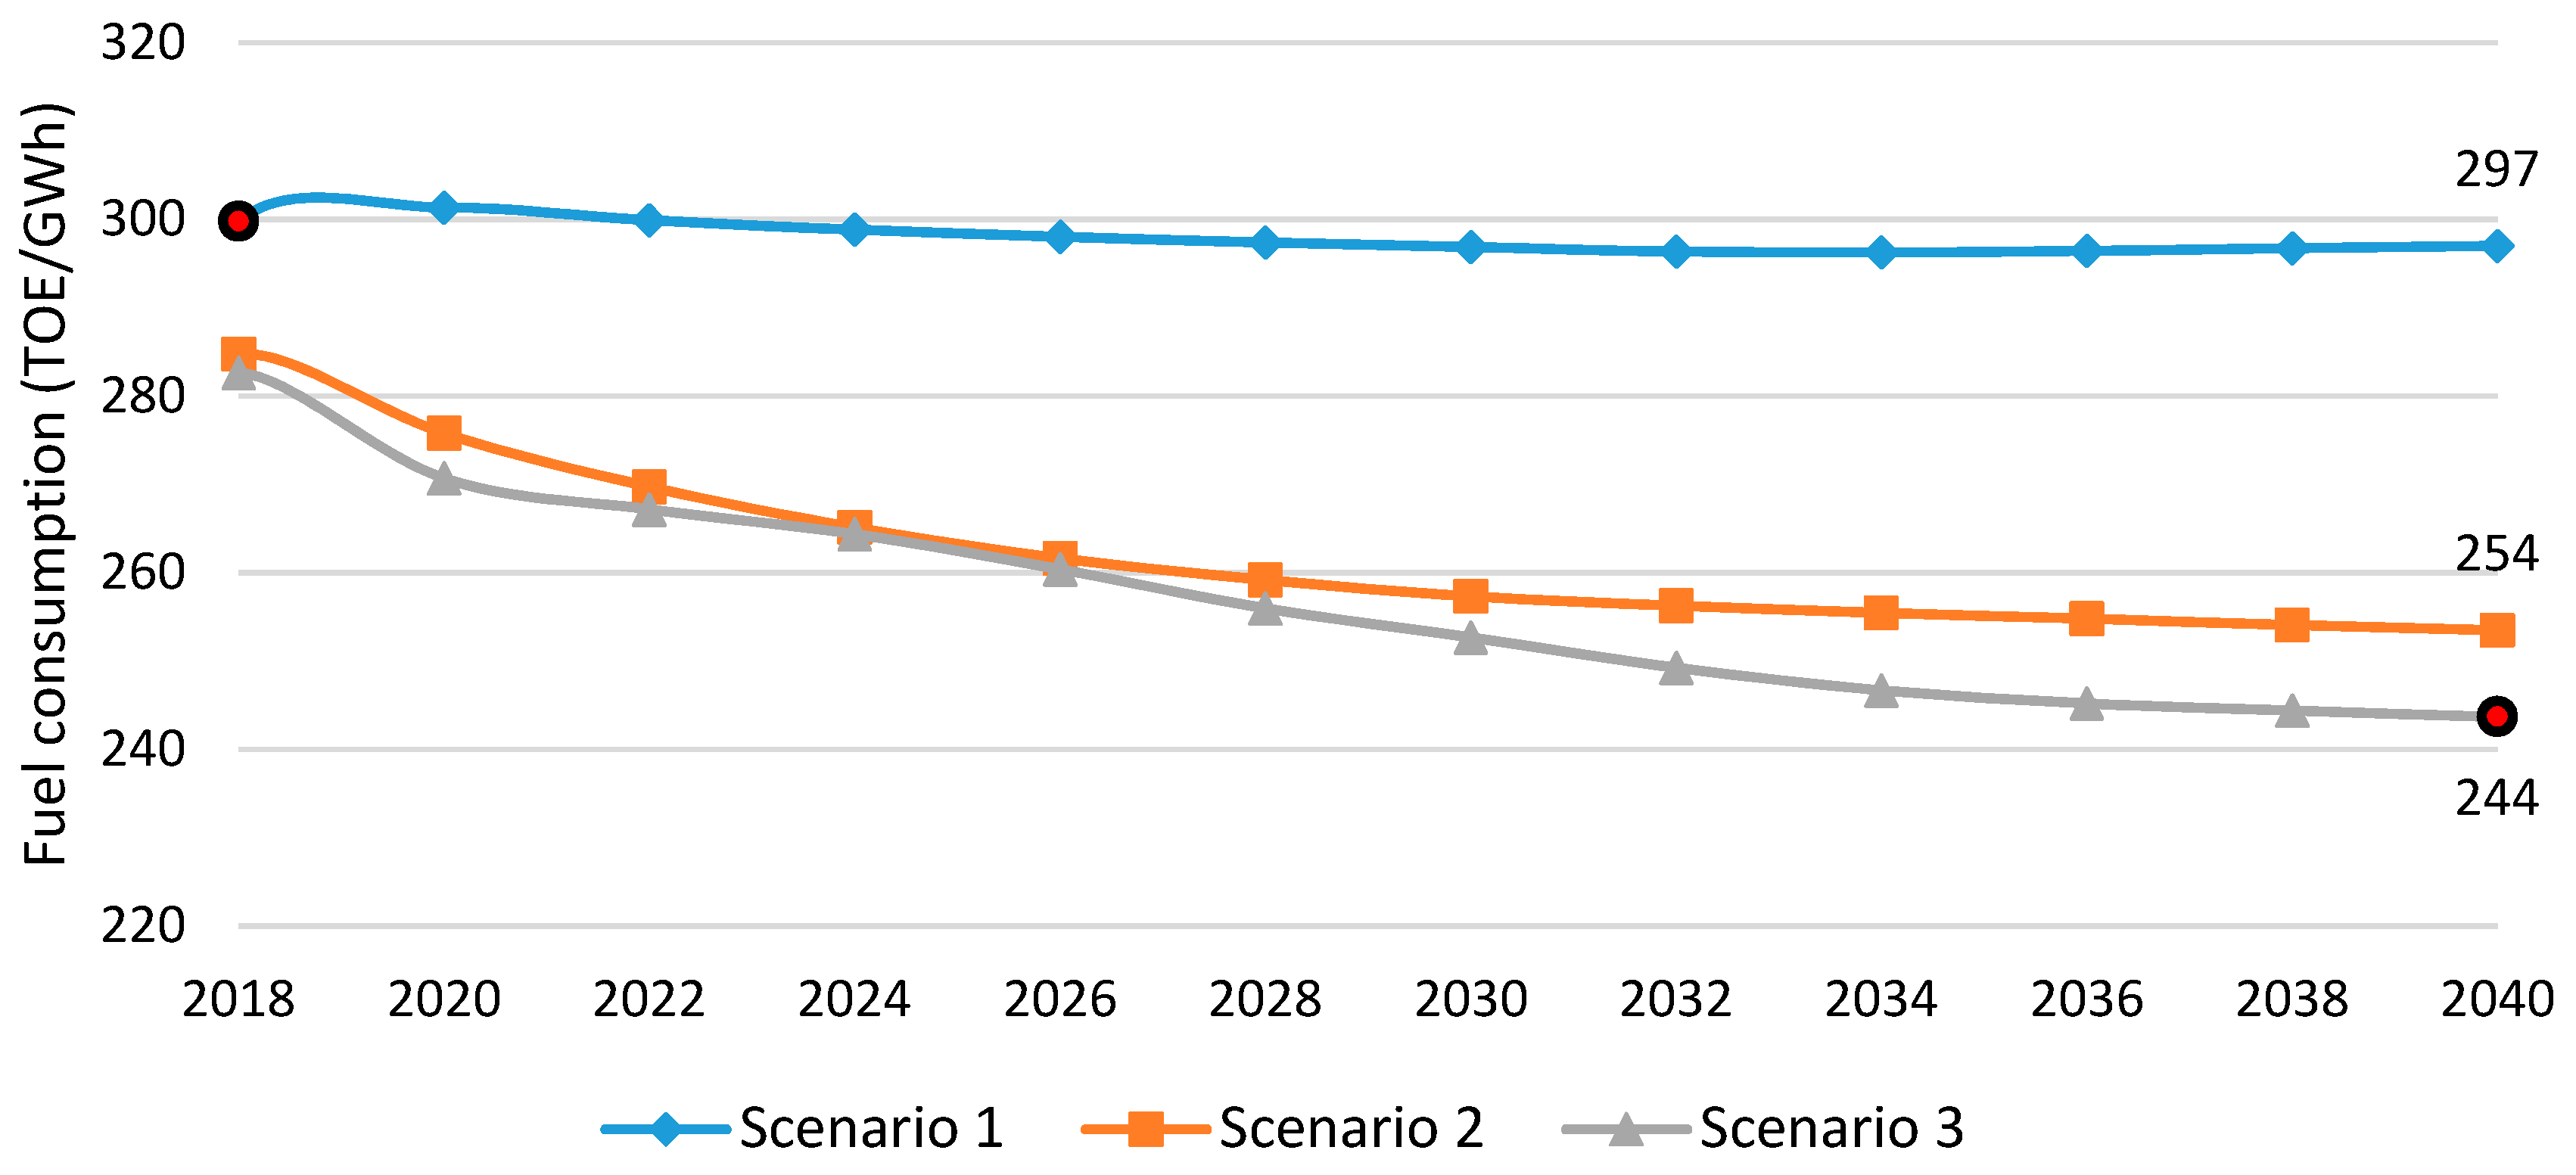
The ratio between the total fuel consumption of the power generation plants and the electricity generation for the three scenarios in the period 2018 to 2040 is shown in Figure 8. The analysis shows that the ratio is reduced from 300 TOE/GWh in S1 to 244 TOE/GWh in S3.
Hence, this effect contributes and supports the decision to transform the structure of the current power generation system and convert it in a sustainable system where the saving of petroleum fuels for electricity generation is proven due to the progressive closure of TPPs.
The ratios at the end of the analysis period of S2 and S3 compared with S1 are 16.93% and 21.72% less respectively, and it is supported in large proportion by the consumption of biogas, bagasse, and natural gas.
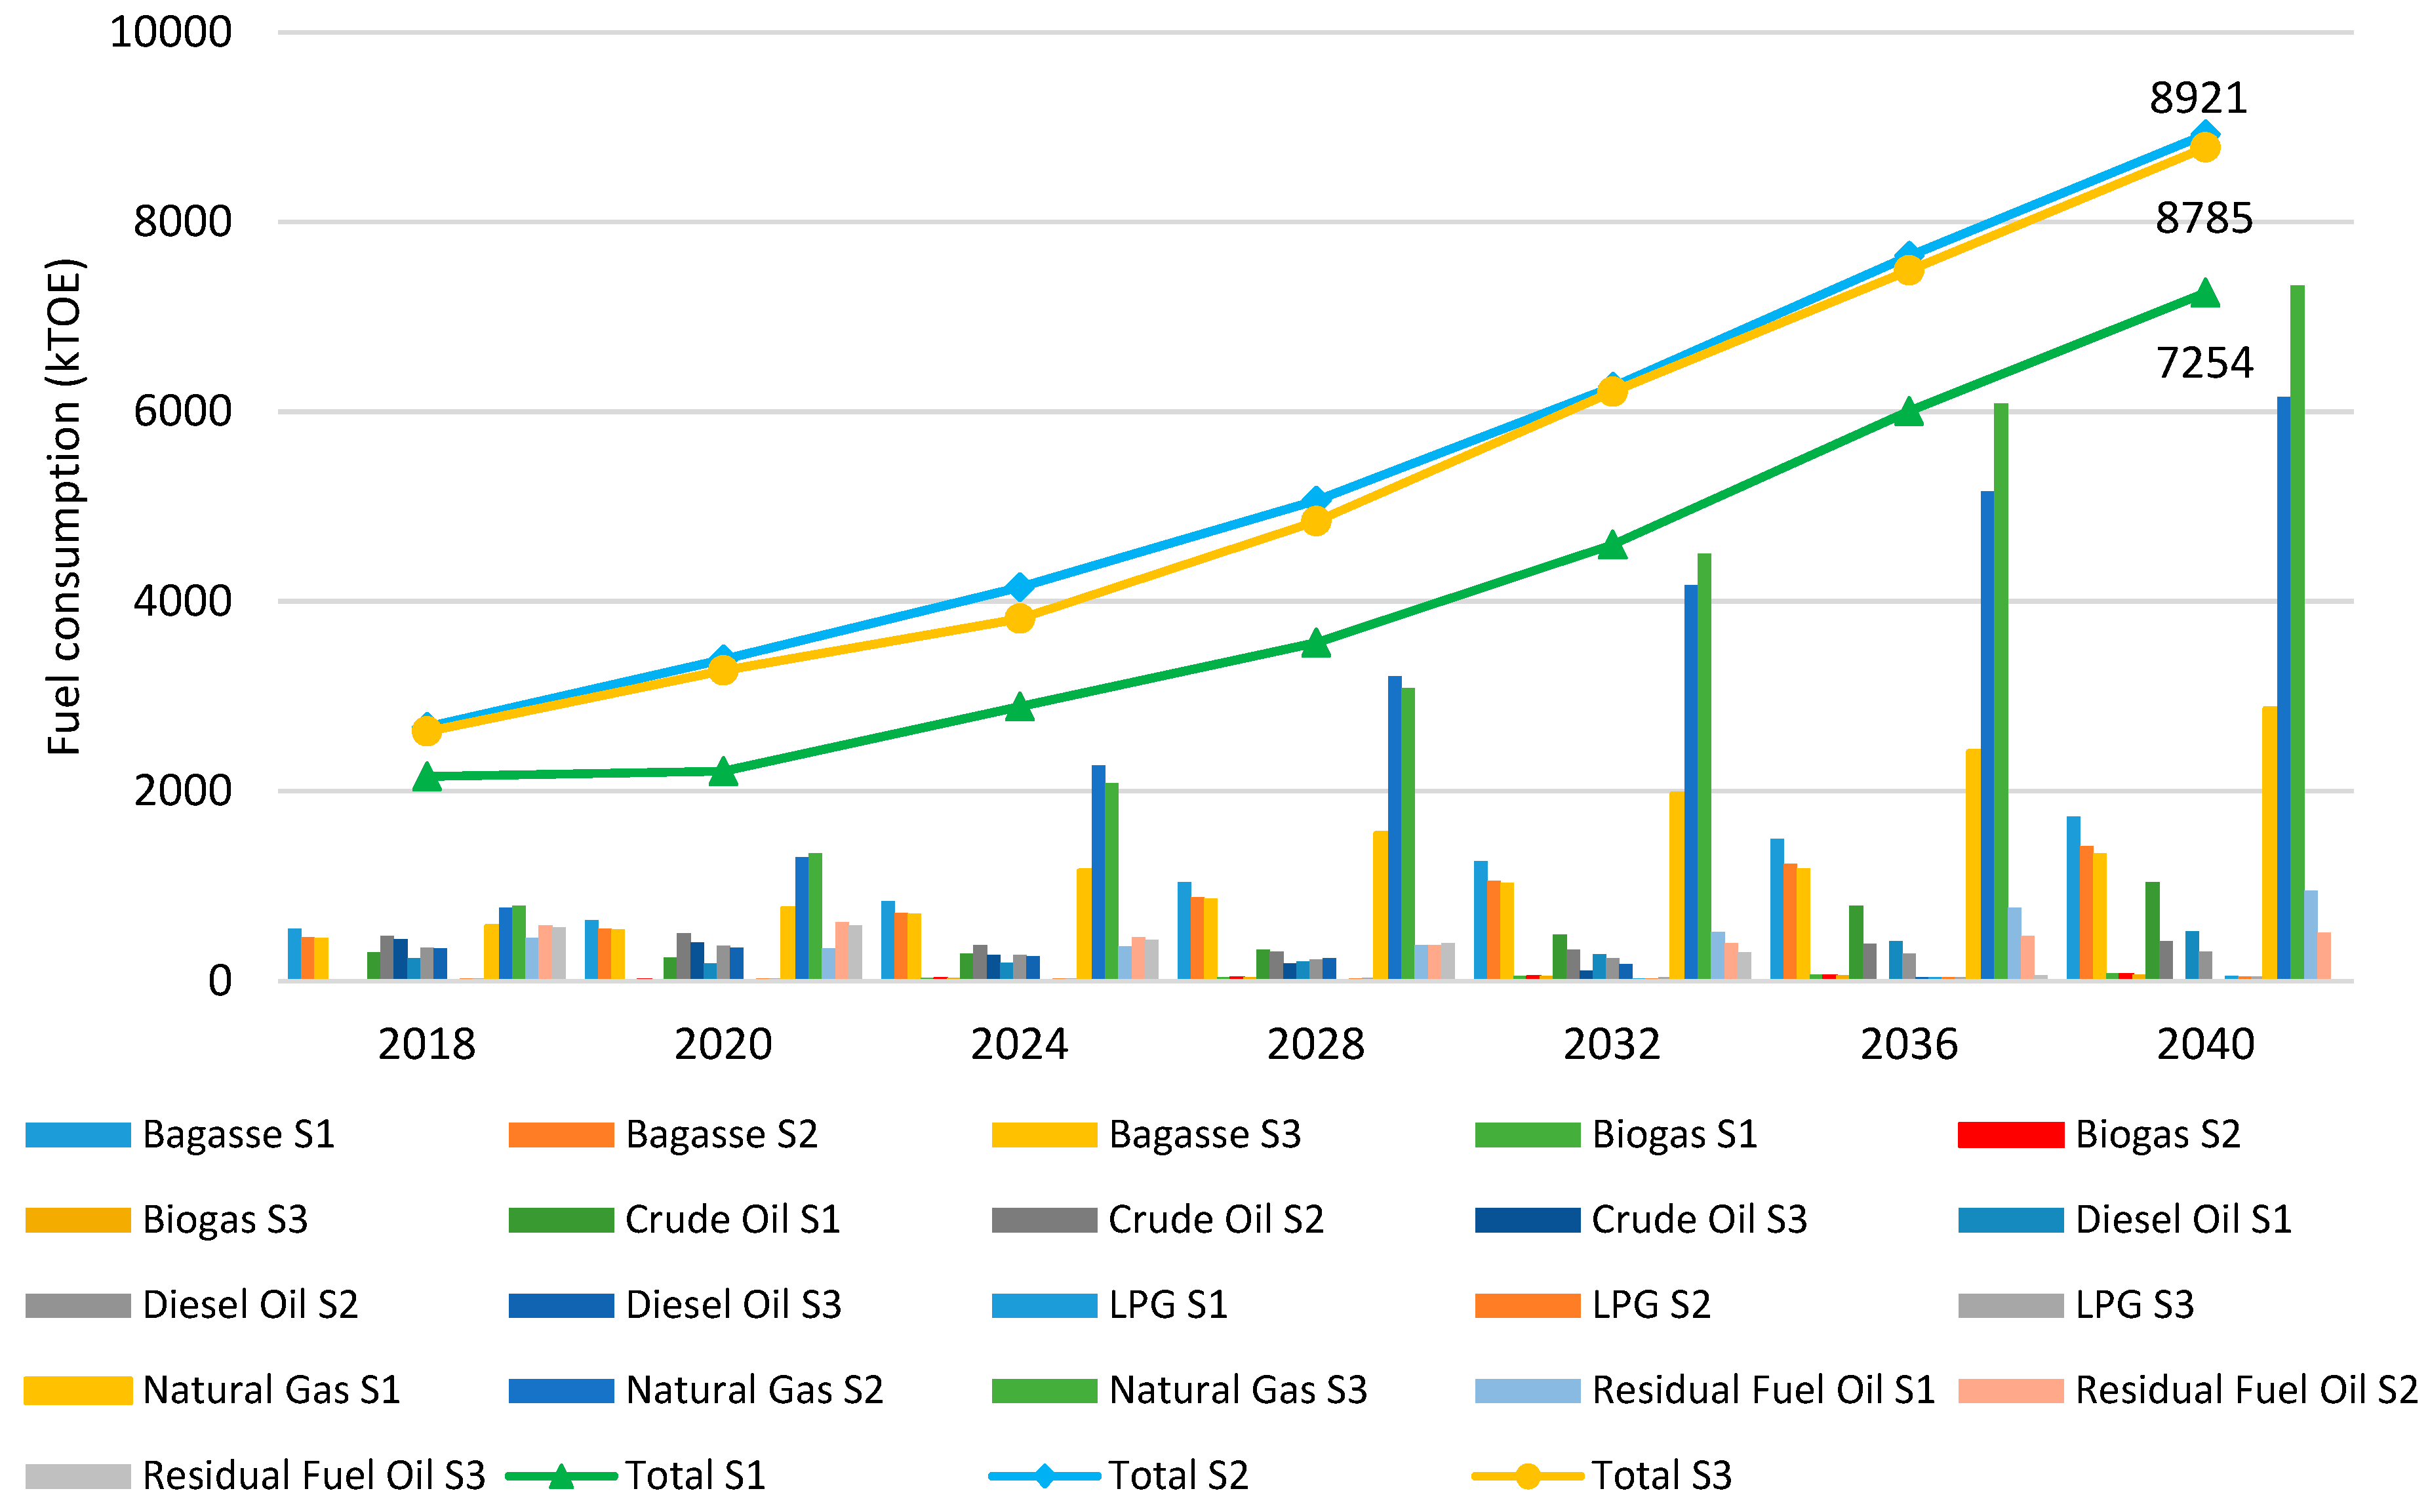
Figure 9 shows the fuel consumption forecasts for electricity generation for the three scenarios until 2040, and where the estimated reduction of petroleum fuel consumption in TPPs is proven.
In S3 the total consumption increases in 313.02%, that represents 6.41% less than S2. Then, the fuel demand will be covered mostly by natural gas with the 83.40% and bagasse with the 15.29% in 2040 (see Figure 10). Thus, the matrix of petroleum fuel consumption changes significantly between 2018 and 2040.
The total fuel consumption in S1 for electricity generation increases 241.04% from 2017 to 2040. In kTOE units, the natural gas goes from 524 to 2870 (+447.71%), diesel from 358 to 522 (+45.81%), residual fuel oil from 574 to 814 (+41.81%), crude oil from 343 to 1041 (+203.49%), bagasse from 304 to 1732 (+469.74%), propane from 16 to 55 (+243.75%), and biogas from 9 to 79 (+777.78%).
For S2, the total amount increases by 319.43%. The consumption in terms of kTOE of diesel goes from 358 to 305 −17.38%), residual fuel oil from 574 to 508 (−12.99%), crude oil from 343 to 421 (+22.74%), bagasse from 304 to 1417 (+366.12%), propane from 16 to 44 (+175%), biogas from 9 to 74 (+722.22%), and the natural gas increased significantly, where it goes from 524 to 6151 (+1073.85%), that represents 24.64% in 2017 to 68.95% in 2040 of the total fuel consumption.
For S3, the fuel consumption of different energy sources in kTOE, the natural gas goes from 524 to 7327 (+1298.28%), bagasse from 304 to 1343 (+341.78%), biogas from 9 to 70 (+677.78%) and propane from 16 to 46 (187.5%). Next, the fuel consumption of diesel reduces from 358 to 0 (−100%), residual fuel oil from 574 to 0 (−100%), crude oil from 438 to 0 (−100%) and propane from 22 to 0 (−100%) in 2037 (see Figure 10). Thus, there is a clear trend of decreasing the consumption of diesel oil, residual fuel oil, and crude oil for electricity generation.
Finally, the trend in fuel consumption in S1 is noticeably higher compared with scenarios S2 and S3, wherein for S3 the results show that petroleum fuel consumption is scarce during the final study period (2037–2040), caused by the replacement and consumption of natural gas in the scenarios of higher demand. These results show that one of the key aims of this study is reached and justified.

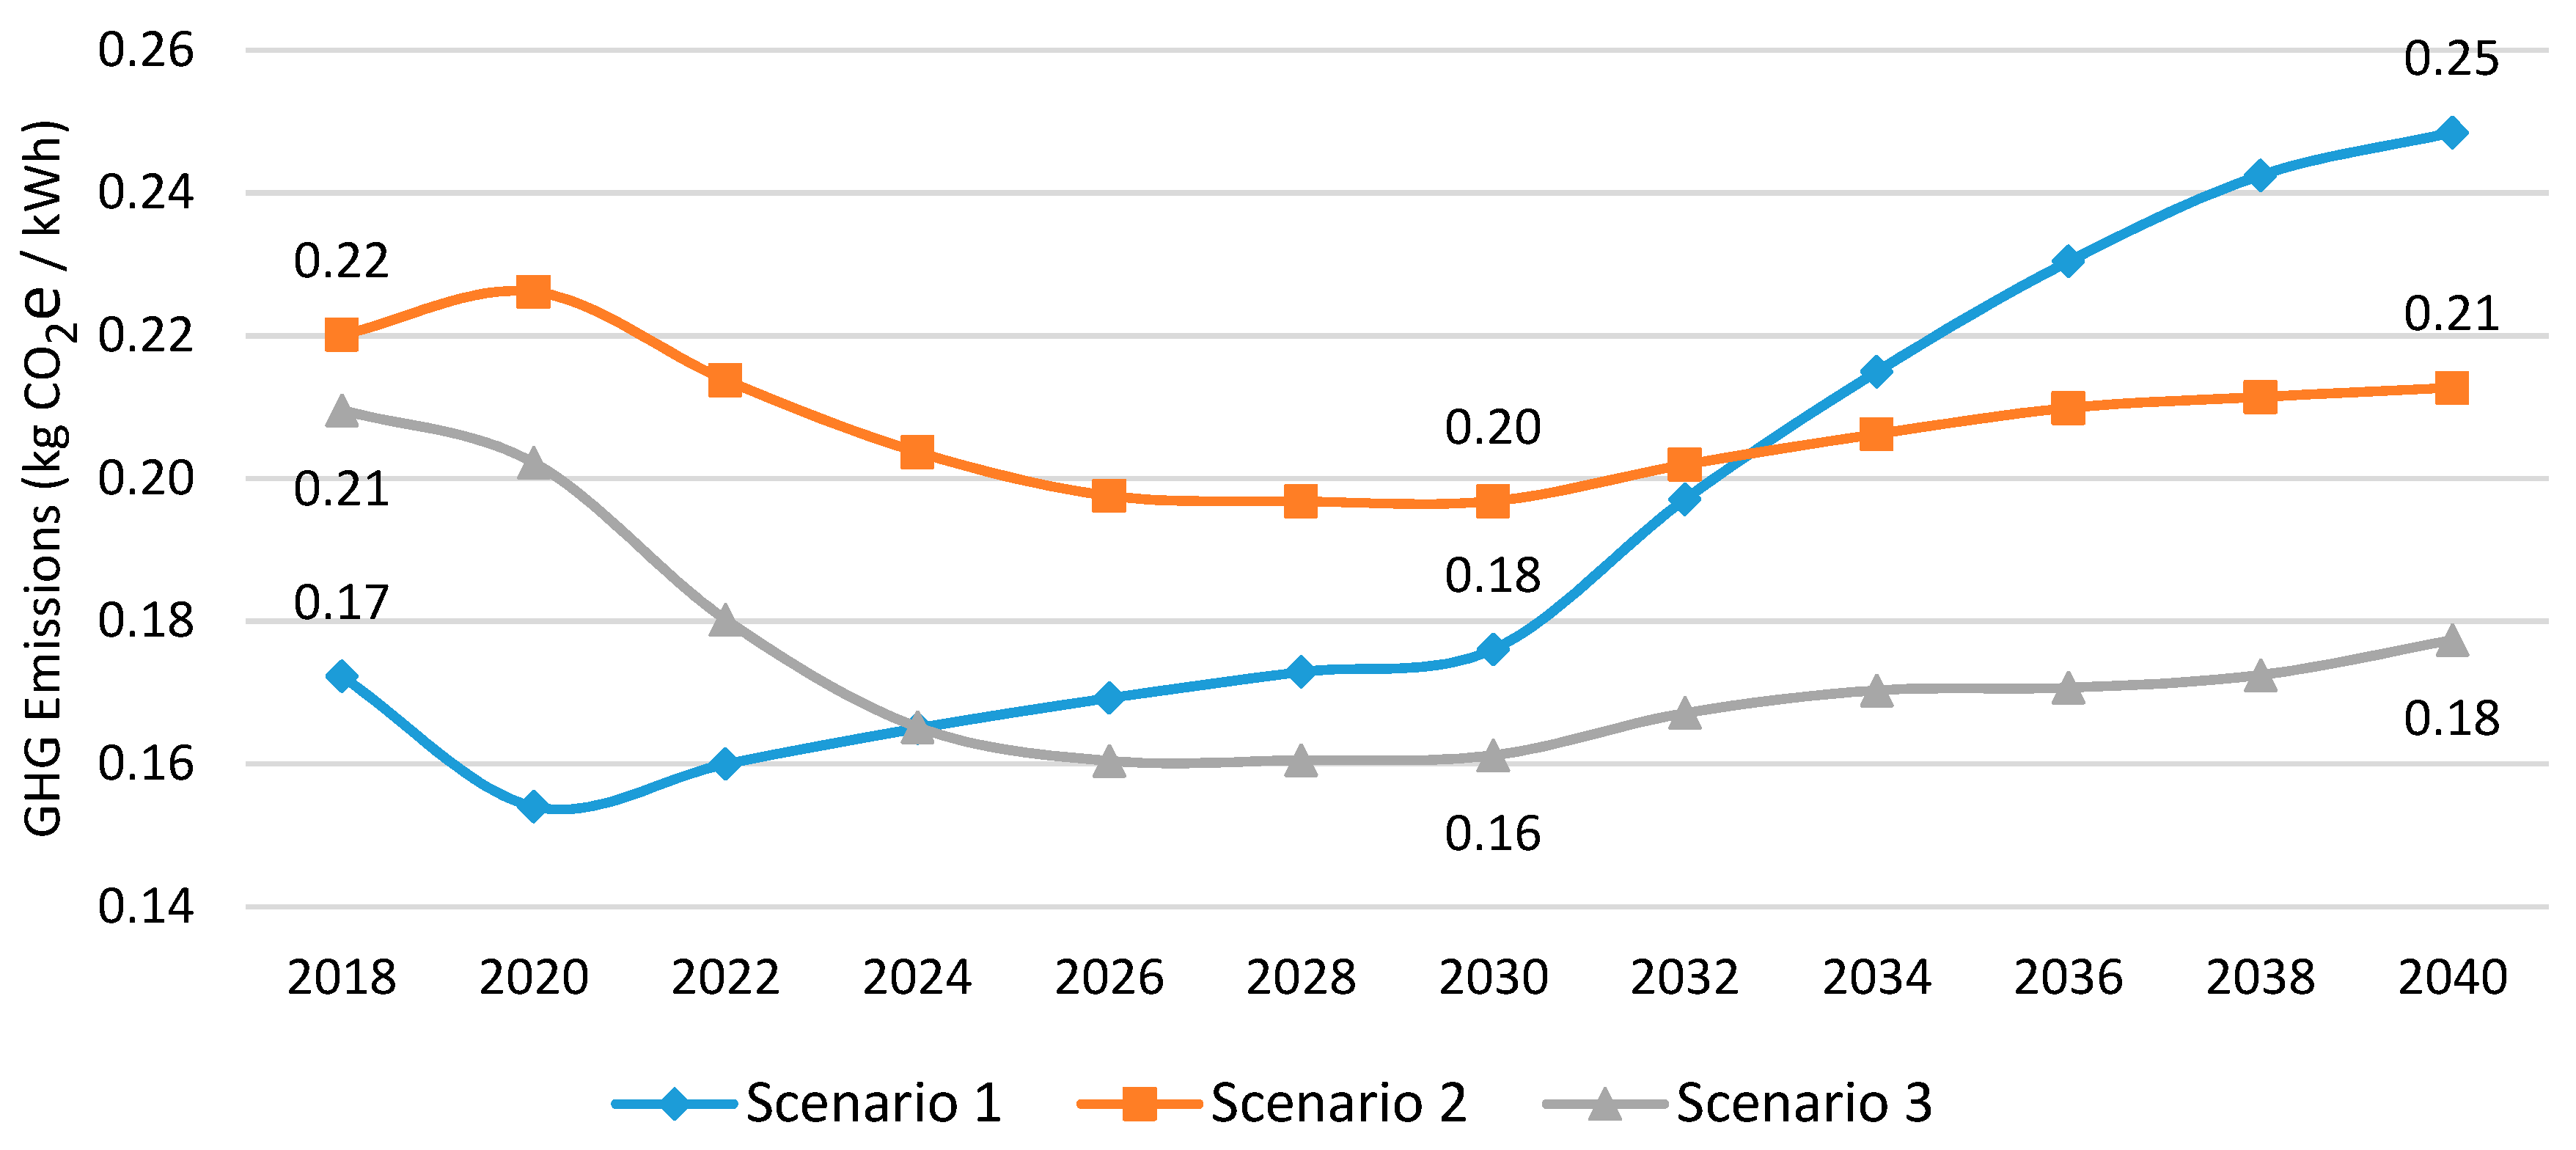
4.6. Forecast of CO2e Emissions

Another critical aspect that was analyzed is the one related to the main pollutant atmospheric gases represented by CO2 equivalent (CO2e) emissions, which are the cause of global warming and climate change. In this way, Figure 11 shows the ratio between CO2e emissions and the forecast of electricity generation for the three scenarios.
This analysis estimates that the ratio is reduced from 0.25 in S1 to 0.21 in S2 and 0.18 in S3, reducing the emission in S2 and S3 around 6.23 and 37.69 million metric tonnes CO2e respectively, compared with S1 until 2040.
The results of this study show that in S2, the CO2e emissions practically remain constant in the study period, and no significant changes can be observed. The most outstanding finding from the analysis is that the emission reduction is around 39% for S3 by 2040, this is a consequence of the applied energy policies in the model, thereby another vital aim is achieved contributing to the country’s sustainable development goals.

5. Conclusions

A detailed study of the Ecuadorian power generation system was used as a baseline to propose three different future energy scenarios based on realistic economic and political decisions. The three scenarios would cover the total electricity demand of the country. In S2 (Power Generation Master Plan), and S3 (Sustainable Power Generation System) scenarios, the total electricity demand would be mainly covered by natural gas combined-cycle (NGCC) and hydroelectric power plants, unlike the S1 scenario (Business As Usual), which remains operating with thermal power plants and continues to have a significant dependence on the consumption of petroleum products that the country imports (mainly diesel oil). Additionally, these petroleum products have unstable prices attributed to the oil price fluctuations.
In S2 and S3, the thermal power plants would operate in short periods only when the NGCC and hydroelectric power plants could not cover the electricity demand, either by meteorological circumstances or due to maintenance operations. Thus, in S3, this situation would cause to reach minimum consumption levels of crude oil, residual fuel oil, and diesel oil. The expectations are that these levels would be progressively reduced from 2026 to 2036, reaching zero consumption in 2037. In conclusion, the S3 would be the most efficient and sustainable scenario.
Additionally, the forecasted growth of solar and wind energy power plants is modest throughout the study period due to energy policy decisions that have been made in recent years. This trend is expected to continue even when these technologies become more cost-competitive over time. This situation is partly caused by the theoretical hydroelectric potential of Ecuador of 90,976 MW. Consequently, it is still technically and economically viable to increase the use of this energy. However, it is also imperative to have relevant technical information to foresee critical events such as the “El Niño” phenomenon or climate change effects that could cause critical negative consequences in the system.
According to the results found for S2 and S3, the state should promote public and private investment because it is necessary to transform and expand the power generation system in a country with steadily growing energy consumption.
Additionally, environmental benefits (reduction of greenhouse gas emissions and improve air quality) and economic profits (lower imports and higher self-production) can be achieved through the correct technical and political decisions. Hence, the proposed model can act as a planning tool to make decisions related to the upgrade and construction of new power generation system infrastructures.
This study placed in Ecuador provides a LEAP model useful to analyze other regions, especially developing countries or cities that share similar characteristics such as some from Latin America.

Supplementary Materials

The following are available online at https://0-www-mdpi-com.brum.beds.ac.uk/2071-1050/11/19/5316/s1, Figure SI1: Electricity demand by sectors in the S1 scenario from 2018 to 2040; Figure SI2: Electricity demand by sectors in the S2 scenario from 2018 to 2040.; Figure SI3: Electricity demand by sectors in the S3 scenario from 2018 to 2040. Figure SI4: Installed power capacity by sources in the S1 scenario from 2018 to 2040. Figure SI5: Installed power capacity by sources in the S2 scenario from 2018 to 2040.; Figure SI6: Electricity generation by sources in the S1 scenario from 2018 to 2040.; Figure SI7: Electricity generation by sources in the S2 scenario from 2018 to 2040.; Figure SI8: Total fuel consumption in the S1 scenario for electricity generation from 2018 to 2040.; Figure SI9: Total fuel consumption in the S2 scenario for electricity generation from 2018 to 2040.

Author Contributions

Conceptualization, L.R.-G. and L.F.; writing—review and editing, L.R.-G. and D.B.; methodology, L.R.-G. and D.B.; Formal analysis, R.V.-C.; Supervision, L.F. All authors reviewed together this paper.

Funding

This work was funded by Secretaría Nacional de Ciencia y Tecnología (SENESCYT) and Instituto de Fomento al Talento Humano (IFTH) of Ecuador [grant number 2013-AR2Q1374].

Acknowledgments

We thank the Energy and Fuels Department of the Technical School of Mining of the Universidad Politécnica de Madrid (UPM) for the technical support. We thank José Folgado, former president, and Alberto Carbajo, former chief operating officer of Red Eléctrica de España (REE) for their valuable comments and suggestions.

Conflicts of Interest

The authors declare no conflict of interest.

References

  1. Lu, J.; Ren, L.; Qiao, J.; Yao, S.; Strielkowski, W.; Streimikis, J. Corporate Social Responsibility and Corruption: Implications for the Sustainable Energy Sector. sustainability 2019, 11, 4128. [Google Scholar] [CrossRef]
  2. IEA—International Energy Agency. World Energy Outlook 2017—Presentación Español. 2017. Available online: https://www.iea.org/weo2017/ (accessed on 14 April 2018).
  3. Yoo, S.-H.; Kwak, S.-Y. Electricity consumption and economic growth in seven South American countries. Energy Policy 2010, 38, 181–188. [Google Scholar] [CrossRef]
  4. Kale, R.V.; Pohekar, S.D. Electricity demand and supply scenarios for Maharashtra (India) for 2030: An application of long range energy alternatives planning. Energy Policy 2014, 72, 1–13. [Google Scholar] [CrossRef]
  5. McPherson, M.; Karney, B. Long-term scenario alternatives and their implications: LEAP model application of Panama׳s electricity sector. Energy Policy 2014, 68, 146–157. [Google Scholar] [CrossRef]
  6. Perwez, U.; Sohail, A.; Hassan, S.F.; Zia, U. The long-term forecast of Pakistan’s electricity supply and demand: An application of long range energy alternatives planning. Energy 2015, 93, 2423–2435. [Google Scholar] [CrossRef]
  7. Hussain, N.; Aslam, M.; Harijan, K.; Das, G.; Hossain, A.; Sahin, H. Long-term electricity demand forecast and supply side scenarios for Pakistan (2015 – 2050): A LEAP model application for policy analysis. Energy 2018, 165, 512–526. [Google Scholar]
  8. Vidoza, J.A.; Gallo, W.L. Projection of fossil fuels consumption in the Venezuelan electricity generation industry. Energy 2016, 104, 237–249. [Google Scholar] [CrossRef]
  9. Bautista, S. A sustainable scenario for Venezuelan power generation sector in 2050 and its costs. Energy Policy 2012, 44, 331–340. [Google Scholar] [CrossRef]
  10. Pirker, G.; Wimmer, A. Sustainable power generation with large gas engines. Energy Convers. Manag. 2017, 149, 1048–1065. [Google Scholar] [CrossRef]
  11. Noorollahi, Y.; Itoi, R.; Yousefi, H.; Mohammadi, M.; Farhadi, A. Modeling for diversifying electricity supply by maximizing renewable energy use in Ebino city southern Japan. Sustain. Cities Soc. 2017, 34, 371–384. [Google Scholar] [CrossRef]
  12. Vandewalle, J.; Bruninx, K.; D’haeseleer, W. Effects of large-scale power to gas conversion on the power, gas and carbon sectors and their interactions. Energy Convers. Manag. 2015, 94, 28–39. [Google Scholar] [CrossRef] [Green Version]
  13. Oyedepo, S.O.; Fagbenle, R.O.; Adefila, S.S.; Adavbiele, S.A. Performance evaluation and economic analysis of a gas turbine power plant in Nigeria. Energy Convers. Manag. 2014, 79, 431–440. [Google Scholar] [CrossRef] [Green Version]
  14. Soldo, B. Forecasting natural gas consumption. Appl. Energy 2012, 92, 26–37. [Google Scholar] [CrossRef]
  15. Ferroukhi, R.; Kieffer, G.; López-Peña, Á.; Barroso, L.; Ferreira, R.; Muñoz, M.; Gomelski, R. Renewable Energy Market Analysis: Latin America; IRENA. 2016. Available online: https://www.irena.org/-/media/Files/IRENA/Agency/Publication/2016/IRENA_Market_Analysis_Latin_America_2016.pdf (accessed on 10 July 2019).
  16. CIA World Factbook Consumption of electricity per capita by country-Comparative Map of Countries-South America. Available online: https://www.indexmundi.com/map/?t=0&v=81000&r=sa&l=es (accessed on 1 May 2018).
  17. British Petroleum Statistical Review of World Energy. 2018. Available online: https://www.bp.com/content/dam/bp/en/corporate/pdf/energy-economics/statistical-review/bp-stats-review-2018-full-report.pdf (accessed on 25 April 2018).
  18. Petroamazonas Development plan “Amistad” Field. Available online: http://www.petroamazonas.gob.ec/wp-content/uploads/downloads/2018/03/CAMPOAMISTAD.pdf (accessed on 15 Mar 2018).
  19. BCE—Central Bank of Ecuador Statistics of the Ecuadorian Oil Sector. Available online: https://www.bce.fin.ec/index.php/hidrocarburos (accessed on 5 June 2018).
  20. MICSE—Coordinating Ministry of Strategic Sectors. National Energy Balance 2016; MICSE: Quito, Ecuador, 2017. [Google Scholar]
  21. CONELEC—National Electricity Council Electrification Master Plan 2013-2022 - Executive summary. Available online: https://www.regulacionelectrica.gob.ec/plan-maestro-de-electrificacion-2013-2022/ (accessed on 27 October 2017).
  22. Gould, C.F.; Schlesinger, S.; Toasa, A.O.; Thurber, M.; Waters, W.F.; Graham, J.P.; Jack, D.W. Government policy, clean fuel access, and persistent fuel stacking in Ecuador. Energy Sustain. Dev. 2018. [Google Scholar] [CrossRef] [PubMed]
  23. Cox, W. Demographia World Urban Areas 15th Annual Addition. 2019. Available online: http://www.demographia.com/db-worldua.pdf (accessed on 10 July 2019).
  24. INEC—National Institute of Statistics and Census of Ecuador Population projection Ecuador 2050. Available online: http://www.ecuadorencifras.gob.ec/documentos/web-inec/Poblacion_y_Demografia/Proyecciones_Poblacionales/presentacion.pdf (accessed on 10 October 2018).
  25. Ecuadorian Government. First Nationally Determined Contributions; 2019. Available online: https://www4.unfccc.int/sites/ndcstaging/PublishedDocuments/Ecuador First/Primera NDC Ecuador.pdf (accessed on 25 April 2019).
  26. Ministry of Mining Strategic Mining Projects 2018. Available online: http://www.mineria.gob.ec/wp-content/uploads/2018/03/Strategic-Mining-Projects-2018.pdf (accessed on 6 February 2018).
  27. Chavez-Rodriguez, M.F.; Carvajal, P.E.; Martinez Jaramillo, J.E.; Egüez, A.; Mahecha, R.E.G.; Schaeffer, R.; Szklo, A.; Lucena, A.F.P.; Arango Aramburo, S. Fuel saving strategies in the Andes: Long-term impacts for Peru, Colombia and Ecuador. Energy Strateg. Rev. 2018, 20, 35–48. [Google Scholar] [CrossRef]
  28. Ecuadorian State Yachay Ciudad del Conocimiento. Available online: http://www.yachay.gob.ec/yachay-la-ciudad-del-conocimiento/ (accessed on 10 October 2018).
  29. Fitz-Henry, E. Greening the Petrochemical State: Between Energy Sovereignty and Sumak Kawsay in Coastal Ecuador. J. Lat. Am. Caribb. Anthropol. 2015, 20, 264–284. [Google Scholar] [CrossRef]
  30. MEER—Ministry of Electricity and Renewable Energy National Energy Efficiency Plan 2016–2035. Available online: https://www.celec.gob.ec/hidroagoyan/images/PLANEE_INGLES/NationalEnergyEfficiencyPlan20162035_2017-09-01_16-00-26.html (accessed on 5 January 2018).
  31. Rimos, S.; Hoadley, A.F.A.; Brennan, D.J. Determining the economic consequences of natural gas substitution. Energy Convers. Manag. 2014, 85, 709–717. [Google Scholar] [CrossRef]
  32. Jarre, M.; Noussan, M.; Poggio, A. Operational analysis of natural gas combined cycle CHP plants: Energy performance and pollutant emissions. Appl. Therm. Eng. 2016, 100, 304–314. [Google Scholar] [CrossRef]
  33. UN—United Nations Sustainable Development Goals (SDGs). Available online: https://www.un.org/sustainabledevelopment/sustainable-development-goals/ (accessed on 30 January 2019).
  34. ARCONEL—Electricity Regulation and Control Agency Annual and Multiannual Statistics of the Ecuadorian Electricity Sector 2017. Available online: http://www.regulacionelectrica.gob.ec/wp-content/uploads/downloads/2018/07/Est_2017_borrador_publicado.pdf (accessed on 20 February 2018).
  35. Ponce-Jara, M.A.; Castro, M.; Pelaez-Samaniego, M.R.; Espinoza-Abad, J.L.; Ruiz, E. Electricity sector in Ecuador: An overview of the 2007–2017 decade. Energy Policy 2018, 113, 513–522. [Google Scholar] [CrossRef]
  36. MEER—Ministry of Electricity and Renewable Energy. National Energy Balance 2017; MEER: Quito, Ecuador, 2018.
  37. CONELEC—National Electricity Council Electrification Master Plan 2013-2022 - IV. Available online: https://www.regulacionelectrica.gob.ec/plan-maestro-de-electrificacion-2013-2022/ (accessed on 27 October 2017).
  38. CONELEC—National Electricity Council Perspective and Expansion of the Ecuadorian Electricity System. Available online: http://www.regulacionelectrica.gob.ec/wp-content/uploads/downloads/2015/12/Vol3-Perspectiva-y-expansión-del-sistema-eléctrico-ecuatoriano.pdf (accessed on 25 October2017).
  39. ARCH—Hydrocarbons Regulation and Control Agency Current Situation “Bloque 6”; ARCH: Quito, Ecuador, 2017.
  40. Claribel, L.; Zúñiga, V.; Tutor, C.; Maria, F.; Cedeño, A. Economic Behavior and Its Impact on the Hydrocarbon Sector Related to the El Guabo Gas Pipeline; Universidad de Guayaquil: Guayaquil, Ecuador, 2016. [Google Scholar]
  41. Ministry of Hydrocarbons Ecuador will Increase Natural Gas Production from 62 to 85 Million Cubic Feet per Day. Available online: http://www.hidrocarburos.gob.ec/ecuador-aumentara-la-produccion-de-gas-natural-de-62-a-85-millones-de-pies-cubicos-por-dia/ (accessed on 20 July 2017).
  42. Heaps, C.G. Long-range Energy Alternatives Planning (LEAP) system. Stockholm Environment Institute. Available online: https://www.energycommunity.org. (accessed on 25 April 2019).
  43. Nieves, J.A.; Aristizábal, A.J.; Dyner, I.; Báez, O.; Ospina, D.H. Energy demand and greenhouse gas emissions analysis in Colombia: A LEAP model application. Energy 2019, 169, 380–397. [Google Scholar] [CrossRef]
  44. Hong, S.; Chung, Y.; Kim, J.; Chun, D. Analysis on the level of contribution to the national greenhouse gas reduction target in Korean transportation sector using LEAP model. Renew. Sustain. Energy Rev. 2016, 60, 549–559. [Google Scholar] [CrossRef]
  45. Di Sbroiavacca, N. LEAP Model; La Serena, Chile. 2013. Available online: www.fundacionbariloche.org.ar (accessed on 25 July 2018).
  46. Mondal, M.A.H.; Boie, W.; Denich, M. Future demand scenarios of Bangladesh power sector. Energy Policy 2010, 38, 7416–7426. [Google Scholar] [CrossRef]
  47. Pinzón, K. Dynamics between energy consumption and economic growth in Ecuador: A granger causality analysis. Econ. Anal. Policy 2018, 57, 88–101. [Google Scholar] [CrossRef] [Green Version]
  48. INER—National Institute of Energy Efficiency and Renewable Energies Scenarios of Energy Prospects for Ecuador in 2050; INER: Quito, Ecuador, 2016.
  49. MEER—Ministry of Electricity and Renewable Energy Electricity Master Plan 2016–2025. Available online: https://www.celec.gob.ec/hidroagoyan/index.php/plan-maestro-de-electricidad-2016–2025 (accessed on 5 January 2018).
  50. Park, N.B.; Yun, S.J.; Jeon, E.C. An analysis of long-term scenarios for the transition to renewable energy in the Korean electricity sector. Energy Policy 2013, 52, 288–296. [Google Scholar] [CrossRef]
  51. EIA—Energy Information Administration. Energy Prices by Sector and Source; 2018. Available online: https://www.eia.gov/outlooks/aeo/data/browser/#/?id=3-AEO2018&region=1-0&cases=ref2018&start=2016&end=2040&f=A&linechart=&map=ref2018-d121317a.4-3-AEO2018.1-0&sourcekey=0 (accessed on 24 July 2018).
  52. U.S. Energy Information Administration. Capital Cost Estimates for Utility Scale Electricity Generating Plants; Department of Energy: Washington, DC, USA, 2016.
  53. IRENA—International Renewable Energy Agency. IRENA: Renewable Power Generation Costs in 2017; Abu Dhabi. 2018. Available online: https://www.irena.org/publications/2018/Jan/Renewable-power-generation-costs-in-2017 (accessed on 10 July 2019).
  54. Oğuz, E.; Şentürk, A.E. Selection of the Most Sustainable Renewable Energy System for Bozcaada Island: Wind vs. Photovoltaic. Sustainability 2019, 11, 4098. [Google Scholar] [CrossRef]
  55. CEPAL—OLADE—BID. Energy Efficiency in Latin America and the Caribbean: Advances and Opportunities. 2017. Available online: https://unepdtu.org/wp-content/uploads/2015/08/the-latin-american-and-caribbean-regional-report.pdf (accessed on 10 July 2019).
  56. MICSE—Coordinating Ministry of Strategic Sectors. National Energy Agenda 2016–2040; Quito - Ecuador. 2016. Available online: https://info.undp.org/docs/pdc/Documents/ECU/Version Final Informe Completo Prospectiva.pdf (accessed on 10 July 2019).
  57. MEER—Ministry of Electricity and Renewable Energy. Prospectiva Energética del Ecuador 2012–2040; Quito - Ecuador. 2015. Available online: https://info.undp.org/docs/pdc/Documents/ECU/Energy%20Outlook%20Study%20of%20Ecuador%202012-2040-%20executive%20summary.pdf (accessed on 10 July 2019).
  58. Guayanlema, V. Análisis multicriterio de implementación de medidas de eficiencia energética en el transporte e industria caso: Ecuador; Universitat de Barcelona: Barcelona, Spain, 2016. [Google Scholar]
  59. Izurieta, F.; Corral, A.; Guayanlema, V. Identificacion de las necesidades de eficiencia energetica en el transporte; INER: Quito, Ecuador, 2013. [Google Scholar]
  60. MEER—Ministry of Electricity and Renewable Energy. Santiago Hydroelectric Project. Available online: https://www.energia.gob.ec/wp-content/uploads/downloads/2018/07/CFE-Proyecto-Hidroeléctrico-Santiago.pdf (accessed on 5 April 2018).
  61. CELEC—Electric Corporation of Ecuador Hydroelectric Complex “Paute Integral”. Available online: https://www.celec.gob.ec/hidropaute/perfil-corporativo/paute-integral.html (accessed on 25 October 2017).
Figure 1. Electricity generation module framework for Ecuador in the Long-range Energy Alternatives Planning (LEAP) model.
Sustainability 11 05316 g001
Figure 2. Total net electricity demand in the three scenarios from 2018 to 2040.
Sustainability 11 05316 g002
Figure 3. Total installed power capacity in the three scenarios from 2018 to 2040.
Sustainability 11 05316 g003
Figure 4. Installed power capacity by sources in the S3 scenario from 2018 to 2040.
Sustainability 11 05316 g004
Figure 5. Electricity generation by sources in the three scenarios from 2018 to 2040 (see complete data in Figures SI6 and SI7 of the Supplementary Material and Figure 10).
Sustainability 11 05316 g005
Figure 6. Electricity generation by sources in the S3 scenario from 2018 to 2040.
Sustainability 11 05316 g006
Figure 7. Average electricity production cost in the S1, S2, and S3 scenarios from 2018 to 2040.
Sustainability 11 05316 g007
Figure 8. Ratio between fuel consumption and electricity generation from 2018 to 2040.
Sustainability 11 05316 g008
Figure 9. Total fuel consumption for electricity generation in the three scenarios from 2018 to 2040 (see complete data in Figures SI8 and SI9 of the Supplementary Material and Figure 10).
Sustainability 11 05316 g009
Figure 10. Total fuel consumption in the S3 scenario for electricity generation from 2018 to 2040.
Sustainability 11 05316 g010
Figure 11. Ratio between CO2e emissions and electricity generation from 2018 to 2040.
Sustainability 11 05316 g011
Table 1. Nominal power for electricity generation by type of sources in 2017 (MW) [34].
Type of CompanyRenewablesNon-RenewablesTotal
HydroelectricWindBiomassSolarBiogasThermal
TurbovaporPhotovoltaicICEICETurbogasTurbovapor
Generator4193.2716.50-24.467.26814.53612.53411.506080.05
Distributor142.164.65-2.02-59.06208.0734.74450.69
Self-generator180.53-144.30--1063.90101.2515.631505.60
Total Nominal4515.9621.15144.3026.487.261937.48921.85461.878036.34
Table 2. Electricity production by sources in 2017 (GWh) [34].
Type of CompanyType of Sources
HydroelectricWindBiomassSolarBiogasThermalTOTAL
Generator18,380.9667.190.0034.2427.823674.7122,184.93
Distributor625.986.210.003.240.0070.27705.69
Self-generator1081.670.00430.850.000.003629.765142.28
Total20,088.6173.40430.8537.4827.827374.7428,032.9
Table 3. Total fuel consumption for electricity generation in 2017 (kTOE) [34].
Type of CompanyFuel OilDieselNatural GasOil ResidueCrude OilPropane (LPG)BagasseBiogasTotal
Generators450.7156.33313.0459.73---8.98888.79
Distributors12.046.11------18.15
Self-generators17.14295.35211.2234.16345.0715.69303.67-1222.30
Total479.89357.79524.2693.89345.0715.69303.678.982129.24
Table 4. Total electricity demand for public service by sectors in 2007–2017 (GWh) [36].
SECTOR20072008200920102011201220132014201520162017
Residential4095.194384.864672.285114.185350.955628.675881.3963646927.717104.857297.97
Commercial2204.742367.522527.842672.012955.493209.143485.543785.723981.063838.263843.88
Industrial1782.052063.693675.64110.24480.54685.934684.274974.564972.674778.085699.62
Public765.46806.4819.57812.03882.97913.08963.731023.341081.321127.11213.75
Others **2092.582379.341516.251368.191578.891738.072057.561835.262043.152019.12149.01
Total10,940 *12,002 *13,21214,07715,24916,17517,07217,98319,00618,86720,204
* Energy was delivered to large consumers in sub-transmission: 397.81 GWh in 2007 and 264.70 GWh in 2008. ** Unusual subscribers, social assistance, water pumping, official entities, sports venues, and electric vehicles.
Table 5. Assumptions and base values in S1, S2, and S3 scenarios for the baseline year.
ParameterDescription
Gross Domestic Product (GDP)The historical average of 3.6% between 2005 and 2017 [19]
Population in 2017 and in 204016,776,977 and 21,806,740 people [24]
Gross Electricity Generation (GEG)28,033 GWh [34]
Gross Electricity per capita Consumption1670.91 kWh [36]
Consumption in Auxiliary Systems427.66 GWh (1.53% of GEG) [36]
Available for Non-Public Service3722.77 GWh (13.28% of GEG) [36]
Losses in Transmission Systems888.72 GWh (3.17% of GEG) [36]
Losses in Distribution Systems2594.65 GWh (9.26% of GEG) [36]
Merit OrderAccording to Electric Corporation of Ecuador (CELEC-EP) [34]
Environmental ParametersThe Technology and Environmental Database (TED) about the Intergovernmental Panel on Climate Change (IPCC) [42]
Table 6. Summary of input data parameters for electric power plants used in the LEAP model.
ParameterHydroelectricWind gSolar gBagasseBiogasNatural GasOil (Thermal)
Life time (year) a40252525303030
Merit Order DispatchS11111122
S21111112
S31111112
Capacity Credit (%) b1005050100100100100
Maximum Availability (%) c51401634445522
Fuel cost ($/TOE) d---102.1125.1137.8405.9
Capital Cost (Thousand USD/MW of production capacity) e
20171550187726714985650678880
20401110175013362991630614918
OandM Cost (Thousand USD/MW of production capacity) f
20171039.723.41106.9116.9
204011.541.512.11025.414.545.4
Source: a: [6,50]; b: [4]; c: [34]; d: [51]; e and f: [52,53]; g: [54].
Table 7. Summary of energy efficiency strategies.
StrategyDescription
Loss Reduction Plan1. Aims to reduce losses in transmission and distribution systems
Standardization and Labeling Plan2. In order to promote the use of efficient equipment in the residential sector
Program for energy efficient cooking (PEC)3. Induction cooking and water heating by electricity
Replacement Program4. Replacement of inefficient refrigerators, and incandescent light bulbs by energy-saving light bulbs in the residential sector and the public lighting sector
Training Public Workers Program5. In order to encourage the moderate use of electricity in public administrations
Energy Management Standards6. Implementation of energy management systems: ISO 50001.
Source: [30,38,48,49,56,57].
Table 8. Particular conditions for alternative scenario design.
DescriptionScenarios
S1S2S3
Average growth of the net electricity demand until 2040 (%) [57]5.579.7911.40
Average growth of electricity consumption in auxiliary systems until 2040 (%) [48]6.6910.4312.25
Average growth of electricity available for non-public service until 2040 (%) [48]6.8910.8312.63
Electricity losses in transmission and distribution systems until 2040 (12.42% in 2017) (%) [30] 121111
Sales growth of electric vehicles until 2040 (%) [58,59]52030
Change of LPG by electricity consumption for heating water in the household sector (%) [22]209095
Penetration of induction stoves to displace stoves that consume LPG (million) (PEC Prog) [22]1.533.5

