Article

How Does Information Transmission Influence the Value Creation Capability of a Digital Ecosystem? An Empirical Study of the Crypto-Digital Ecosystem Ethereum

Business School, Nankai University, Tianjin 300071, China
Sustainability 2019, 11(19), 5345; https://0-doi-org.brum.beds.ac.uk/10.3390/su11195345
Submission received: 10 September 2019 / Revised: 25 September 2019 / Accepted: 26 September 2019 / Published: 27 September 2019

Abstract

:
With the advancement of digitization, digital ecosystems are playing an increasingly important role in value creation. The mechanism by which digital ecosystems create value, however, has been generally deemed to be a mixed effect due to various factors. On the basis of signaling theory, this paper explores the effect of information transmission on the value creation capability of a digital ecosystem from two dimensions: the scale and sustainability of value creation. Taking a sample of weekly transaction data from Ethereum during August 2015–August 2018, our research proposes an integrated framework of information transmission in value creating, and discusses the diffusion process of the network effect within the digital ecosystem. As a generally accepted exchange medium, digital currency traffic acts as an observable proxy of information flow in a crypto-digital ecosystem, where the effects of heterogeneity in transaction attributes are filtered. Empirical results show that information transmission positively influences the scale and sustainability of value creation activities in a digital ecosystem by affecting user number and transaction frequency. Further research reveals that user number is the initial driving force of the network effect and a critical factor for the overall ecosystem market capitalization. This research provides a new insight into the design of sustainable value creation mechanisms under digital circumstances.

1. Introduction

In the digitization age, more and more value is being created in digital form [1]. In response to such an innovative trend, platforms, virtual communities and various types of ecosystems, such as business ecosystems, entrepreneurial ecosystems and digital ecosystems, have been competing to invest in digital infrastructure building. In the digital economy era, information is mostly carried and presented in the form of a certain combination of bits [2], and the quality of service (QoS) that these ecosystems provide critically depends on how competent they are in generating, transmitting and delivering information as required. Such competition in the quality of information service to get customers and complementors ‘on board’ [3,4] to some extent generates a positive spillover effect [5,6] to the entire society due to the externalities of information transmission and diffusion processes [7]. As a result, the digitization of the whole society is actually a self-enforcing cycle continually driven by competition among platforms or ecosystem enterprises for relative information advantage.
Responses to such an innovative business model from the capital market fully acknowledge its value creation capability. Table 1 shows the top ten global enterprises in market capitalization(MC)in 2007 and 2017, respectively. Enterprises in bold character all belong to the digital ecosystem. As is shown, in 2007, most of the top ten enterprises in market capitalization are from traditional industries such as manufacturing, energy and financial institutions. Only Microsoft is from the technology sector. In 2017, the composition of the top ten enterprises in market capitalization drastically changes. Seven out of the 10 enterprises are of the digital ecosystem kind, and the Apple Company even became the top one in this ranking.
However, the understanding how a digital ecosystem creates value within itself and competes with rivals has been limited to multi-sided market perspectives [3,4,8,9,10,11], literature reviews [12,13,14,15] or case studies [16]. There is no consensus so far on how value is created within the ecosystem or how to measure the value creation capability of such a business model. Therefore, with the deepening of digitization [1], a general mechanism of value creation from a digital ecosystem perspective is in urgent need.
Meanwhile, although the question of how to measure the value creation capability of digital platforms has been discussed by prior research, such as in Fumagalli et al. [17] by case studies and conceptual paradigm, the issue of how to quantify such a capability still fails to reach a commonly accepted paradigm. One main reason is that it is hard to describe value creation capability in a quantitative way. As a result, there are no appropriate identifiable variables to quantify such a capability. Without observable measures, it is difficult to tell the difference between a successful ecosystem and a failing one. These are the research gaps that we try to fill in our paper.
In our research, we measure the value creation capability of a digital ecosystem in two dimensions simultaneously: the scale and the sustainability of value creation activities. The scale measures how much value is created overall from an ecosystem perspective, and the sustainability measures how long the effect of such activities will continue.
To focus on the specialty of digital techniques in ecosystem circumstances, we empirically test our hypotheses in the context of a crypto-digital ecosystem, which is comprised of multi-facet decentralized application developers and corresponding users. One major feature of a crypto-digital ecosystem is that each user can only know information relevant to his/her participation, and any other information about the rest of the ecosystem cannot be directly observed. The only information generally observable for the whole ecosystem in time is the digital currency traffic. Even though the total transaction times and proxy of new user number during a specific period can be calculated ex post, the details of these numbers remain unknown to anyone who is at all irrelevant. The advantages of such a context include the fact that the effect of heterogeneity in transaction attributes and member identities are completely filtered due to the technical characteristics of the blockchain [18], and we can explore the mechanism of value creation on the most general level. Since digital currency traffic in the digital ecosystem is the only variable observed by all members, it is a perfect proxy of information transmission efficiency as well as a price signal [19,20] in digital ecosystems. Most importantly, it is observable by the whole ecosystem.
Overall, this article makes several contributions. First, we contribute to value creation research and explore the role of information transmission in value creation under digital ecosystem circumstances. We find that the efficiency of information transmission within a digital ecosystem has significant influences on transaction times, user numbers and the overall market capitalization of the ecosystem. Second, we also add to the literature of signaling theory by providing a new and consistent insight into information transmission mechanism design; with the help of digital currency traffic, we can track the effect of information flow on transaction times and user numbers in value creation activities within an ecosystem. Lastly, we examine the diffusion process of information flow through the change in demand force on digital currency and explain the working mechanism of network effect. Specifically, we explore the initial driving force of network effect and the interactions in value creation.
The remainder of the study is organized as follows. Section 2 reviews the literature on value creation capability in the context of digital ecosystems, and the relevance and suitability of signaling theory analyses to the research question are established as well. Section 3 further develops relevant hypotheses for the research question and proposes a general model of the theoretical mechanism. Section 4 introduces the methodology by providing sample selection, data handling and description. Key variables for the hypotheses are also identified in this section. The discussions on the research findings and the robustness test are presented in Section 5. The study is concluded in Section 6, where we summarize our findings, discuss the limitations of the current research and propose further research directions.

2. Theoretical Background

The success of digital ecosystem enterprises in the capital market has highlighted the value creation capability of such a kind of business model and has captured the attention of scholars from different areas. Amit and Zott [21,22] systematically reviewed the characteristics of value creation activities in the early stages of a digital business, or e-business, and proposed the concept of a business model from the perspective of profiting ability. In later research on value creation in digital ecosystems, researchers focus on market structure and “coopetition” with rivals and complementors, from various perspectives such as network effects [8,11,23,24,25,26], scenario analysis [1,6,27] and value co-creation [13,15,28,29,30].
The role of network effects in platform value creation has been proposed and discussed by many scholars from a network economics perspective [3,4,5,8,9,25,26]. Most of the literature on network effects is based on two-sided platform circumstances, with the advancement of the digital economy, platforms and community beginning to connect stakeholders from multiple sides and gradually evolving into ecosystem form, where multi-sided stakeholders interact simultaneously in value creation [10,11,15]. As the value creation capability of an ecosystem increases both in scale and diversity, the complexity of interactions within the ecosystem makes the mechanism of value creation even more ambiguous [13]. Some believe that variety in products and services is the key in value creation capability [1,31,32]. With a certain degree of differentiation in the supply side, the ecosystem will thrive and evolve itself by a network effect [13,15]. However, the issues of what is the initial driving force of the network effect and how to measure the influence diffusion of the network effect remain unanswered.
Zeng summarized the characteristics of a virtual community as non-realistic contact among members, interactivity and openness, and self-organization [33], all of which fit digital ecosystem circumstances as well. Under such circumstances, digital innovation and entrepreneurship aiming to provide differentiated products and services in digital forms will fully develop without serious competition threats from incumbents [34,35,36]. Along with such a trend, the payment mechanism shows several characteristics of micropayment online: small amount per trade and high frequency in transactions [37]. Under such circumstances, traditional fiat payment does not perform well, since providers and customers need to frequently switch in delivery and settlement systems between digital ecosystems and fiat payment mechanisms. Without frequent switching and status verification of two systems, a digital currency that is commonly accepted as a general exchange medium within the specific ecosystem fits such circumstances better [19,37,38,39].
Digital currency is assumed to be an exchange medium made by a combination of techniques in peer-to-peer networks, cryptography and consensus algorithms. The most significant feature of digital currency is that it can fulfill peer-to-peer payment online without any intermediary [39,40,41]. There are two main kinds of digital currencies: digital fiat currency and privately issued digital currency, such as Bitcoin, Ether and Ripple. Although there is no digital fiat currency officially put into use so far, the Bank of England and the People’s Bank of China are seriously evaluating issuing digital fiat currency. Existing research on digital currency includes the characteristics of crypto-finance circumstances [19,39,40,42,43], central bank digital currency (CBDC) and the influence on monetary policy making [44,45,46], the role of central bank digital currency in enhancing financial market security and market efficiency [42,45], and improving the intermediary ability of the banking market and limiting merchant banks’ market power [46]. Diniz et al. [47] investigated 22 digital community currencies and divided these digital currencies into four groups: local, proprietary, commons and cyber. Cong et al. [38] proposed a tokenomics circumstance and discussed the effect of token prices on token adoption by users with a dynamic asset pricing model. Other aspects of digital currency research include the adoption and diffusion mechanisms of crypto-currencies [39,40] and crypto-currency payment system establishment and application scenarios [37]. Besides, the signaling role of prices is emphasized by many scholars. Albuquerque and Miao studied the effect of advanced private information on asset prices [48]. Banerjee discussed how members in a market form and diffuse their beliefs in response to prices in the market [49]. The same signaling mechanism also works in crypto-digital contexts, where users form or shift their beliefs and expectations on the crypto-ecosystem as well as the digital currency by observing the changes in the demand force on the digital currency.
Studies on value co-creation derive from those on value co-production in the manufacturing economy era [50,51], and one common feature they share is the particular emphasis on the importance of customer participation and interaction in the value creation process [52,53,54,55,56]. The measurement of value co-creation capability largely depends on the level of service realized [28,52]. In digital ecosystems, the information transmission plays an important role in delivering interactions between customers and service providers, such as customized demand and feedback in time. Research on value co-creation includes topics such as mechanisms [55,56,57], interaction [28,29,30,31,54], the architecture of the ecosystem [6,12,13,15,16], new characteristics in the digitization era [2,6,13,15,16,18,19,58] etc. As most studies on value co-creation are based on conceptual models, there are so many value co-creation concepts [29,30,57,58,59] that scholars cannot reach an agreement in the most general sense [29]. Further, the significance of these concepts basically lacks empirical tests. Limited empirical studies in this area include those of Ceccagnoli et al. [60] and Breidbach and Maglio [61], but their works did not reach a generalized concept of value co-creation either.
Among these studies, there are two factors that are often implicitly assumed to be exogenous—the role of information transmission mechanisms and the diffusion of network effects to the market. The simplified models that set the effects of these two factors as given will focus solely on the interaction relationships among participants. However, these two factors actually play important roles in value creation activities within digital ecosystems and should be incorporated into the analysis as endogenous variables. We will relax these implicit assumptions in our research and particularly study the roles of these two factors in value creation.
Therefore, this article fills a research gap by examining the role of information transmission mechanisms in value creation capability in a digital ecosystem and exploring the diffusion process of network effects from the interactions of critical factors. Furthermore, this research also identifies key factors and how they affect the value creation capability of a digital ecosystem in terms of scale and sustainability.

3. Hypothesis Development

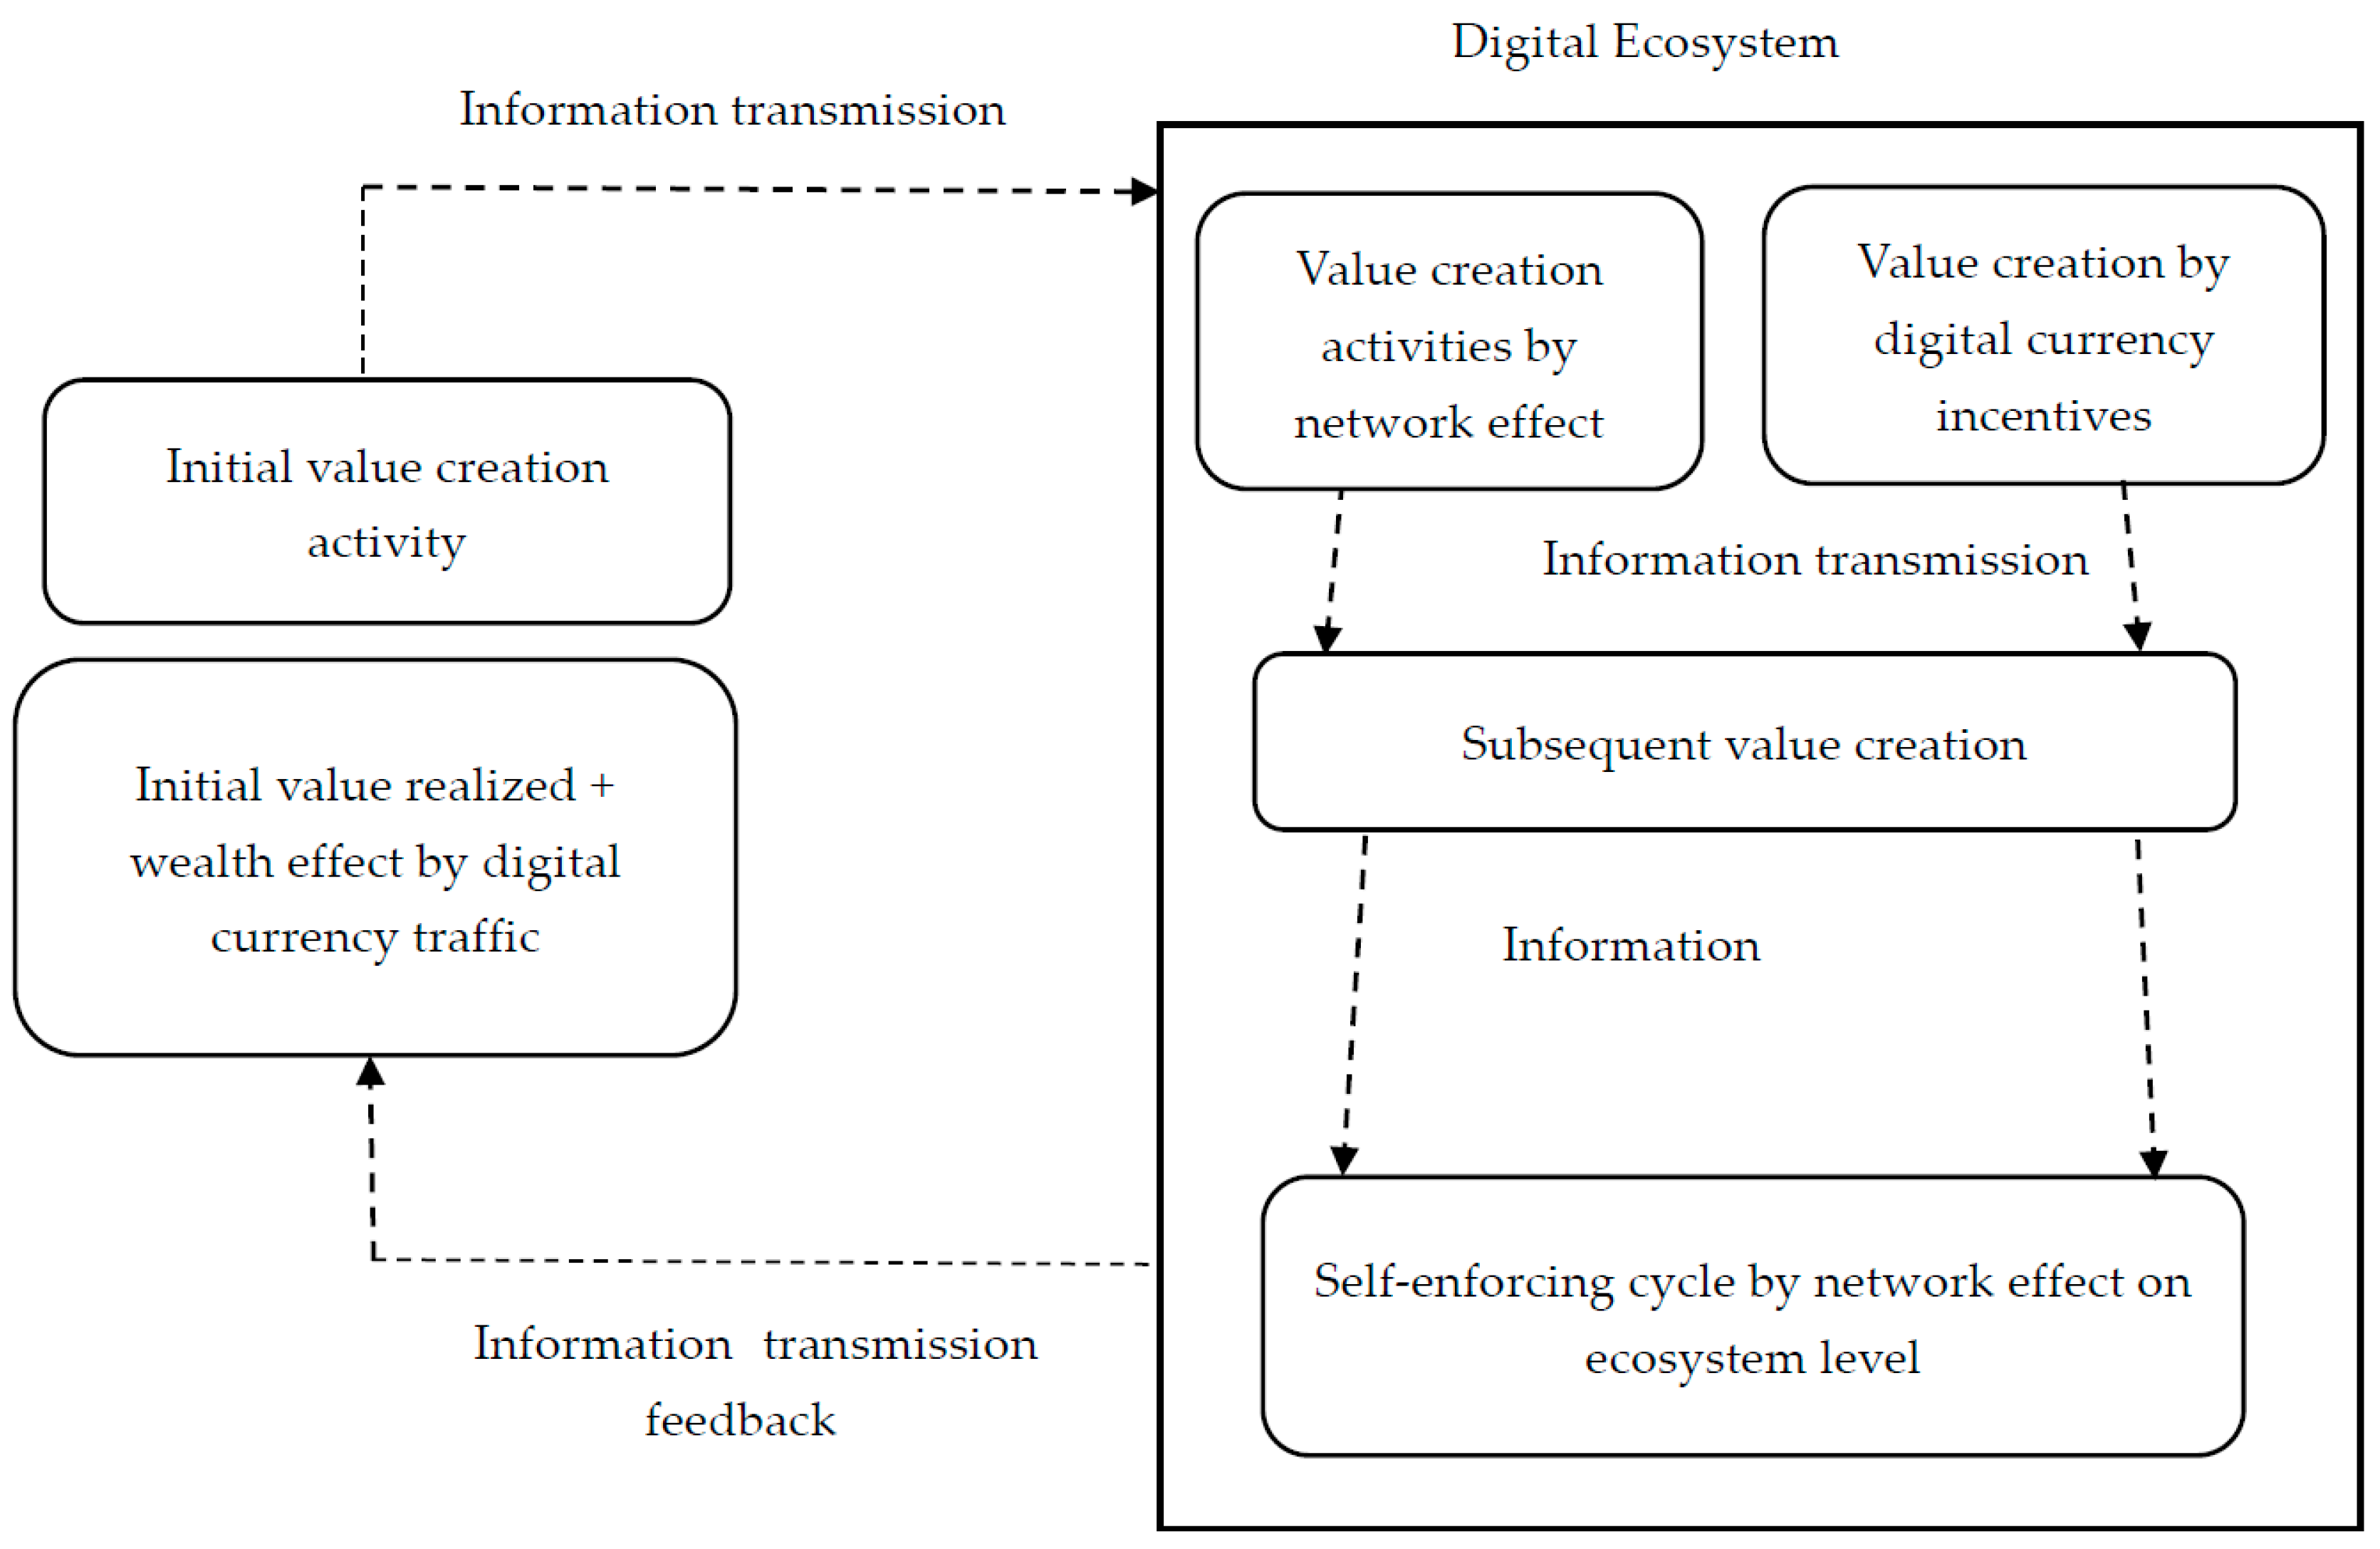
3.1. Value Creation Capability of a Digital Ecosystem

In this research, we describe the value creation capability of a digital ecosystem as the additional value created within the ecosystem due to the effect of the initial specific value creation. As stated earlier, we measure such capability in two dimensions simultaneously: the scale of value created and the sustainability of additional value creation, including the subsequent value creation activities caused by the additional value creation activity. Therefore, the scale and sustainability of value creation is actually a question of information diffusion: To what extent do the rest of the ecosystem members know the information about the initial value creation in time along with that of their responses? To answer this question, first, we need to be able to track the relevant information flow within the ecosystem; second, we need to identify the actors and activities in response; third, we explore how these interactions are influenced by information transmission and diffusion and finally propose a general mechanism of value creation in the ecosystem.

3.2. Critical Factors in Value Creation Scale and Sustainability

To better capture critical factors during value creation, we examine several variable transformations from a transaction perspective in our research. The logic behind these transformations is simple: when a transaction is known to take place, value is created and realized [28,52] denominated by a certain amount and form of exchange media. As the happening of a specific transaction is known, such a piece of information must be delivered by a certain information transmission mechanism to become a part of market information [7,48,49]. In other words, if the specific mechanism does not deliver the information in time or fully deliver the detailed information of the transaction, the influence of the transaction may only be known by few or for a short while. Any potential network effect brought by the specific information is weak due to the poor performance of the information transmission mechanism. On the contrary, if the information is fully delivered in time, the network effect may be fully unleashed. Therefore, the information transmission efficiency is a critical factor for value creation and subsequent responses.
As mentioned earlier, we use digital currency traffic in a crypto-digital ecosystem as a verifiable proxy of information transmission. As the supply of digital currency is usually fixed by consensus or algorithms [41], demand force becomes the only driving force of digital currency circulation. There are two variables that reflect the demand force from a digital ecosystem on digital currency: the price and the return of digital currency, i.e., the growth rate of digital currency prices. The former directly reflects the demand force, while the latter reflects the change in the demand force on digital currency. In Ethereum, the most widely accepted digital currency is Ether.
Meanwhile, as the information of a specific transaction becomes market information, members will respond to the new information by adjusting beliefs and expectations [49]. Under crypto-digital circumstances, members cannot observe any detail of transaction attributes except the transferring a of certain amount of digital currency from one unique address to another [18,62]. Since every change in status of crypto factors requires a certain amount of digital currency as the transaction cost [41], we can justifiably believe that digital currency transfer represents some real transaction taking place. Therefore, members will respond to the demand or the change in demand on digital currency either by entering the market to trade or by doing nothing. There are two variables under consideration: subsequent user number and transaction times. As transaction times directly reveal the level of trading activity, the critical factors for subsequent value creation activities include user number and trading activity as well. However, there is strong endogeneity in the inter-effects among the three critical factors in value creation: the change in Ether price, i.e., Ether return, trading activity and user number. We cannot clearly identify the starting point of the cycle ex ante in the timeline path. In other words, it is possible that the change in Ether return is influenced by the trading activity level earlier or the change in user number, or the change in trading activity level is influenced by either the change in Ether demand or the change in user number. The mechanism of value creation activities turns out to be a particular chicken-and-egg problem [62].
In addition, the scale of a digital ecosystem is an important signal to potential customers and complementors, such as application developers [27,32,60]. The larger an ecosystem is in scale, the stronger network effect it will have. As a network effect can generate widespread effect on factors in value creation [13,15,16], we incorporate the scale of an ecosystem into the critical factor set.
With the analysis above, our empirical strategy will include the following hypotheses on value creation capability from the perspective of market transactions:
Hypothesis 1a (H1a).
Ether return has a positive effect on trading activity.
Hypothesis 1b (H1b).
Trading activity has a positive effect on Ether return.
Hypothesis 2a (H2a).
Ether return has a positive effect on user number growth.
Hypothesis 2b (H2b).
User number growth has a positive effect on Ether return.
Hypothesis 3a (H3a).
User number growth has a positive effect on trading activity.
Hypothesis 3b (H3b).
Trading activity has a positive effect on user number growth.
Hypothesis 4a (H4a).
The scale of the ecosystem has a positive effect on trading activity.
Hypothesis 4b (H4b).
Trading activity has a positive effect on the scale of the ecosystem.
As a result, the model of our research is illustrated in Figure 1, which shows the main variables we focus on and their interaction mechanism (dash lines) to be tested.

4. Methodology

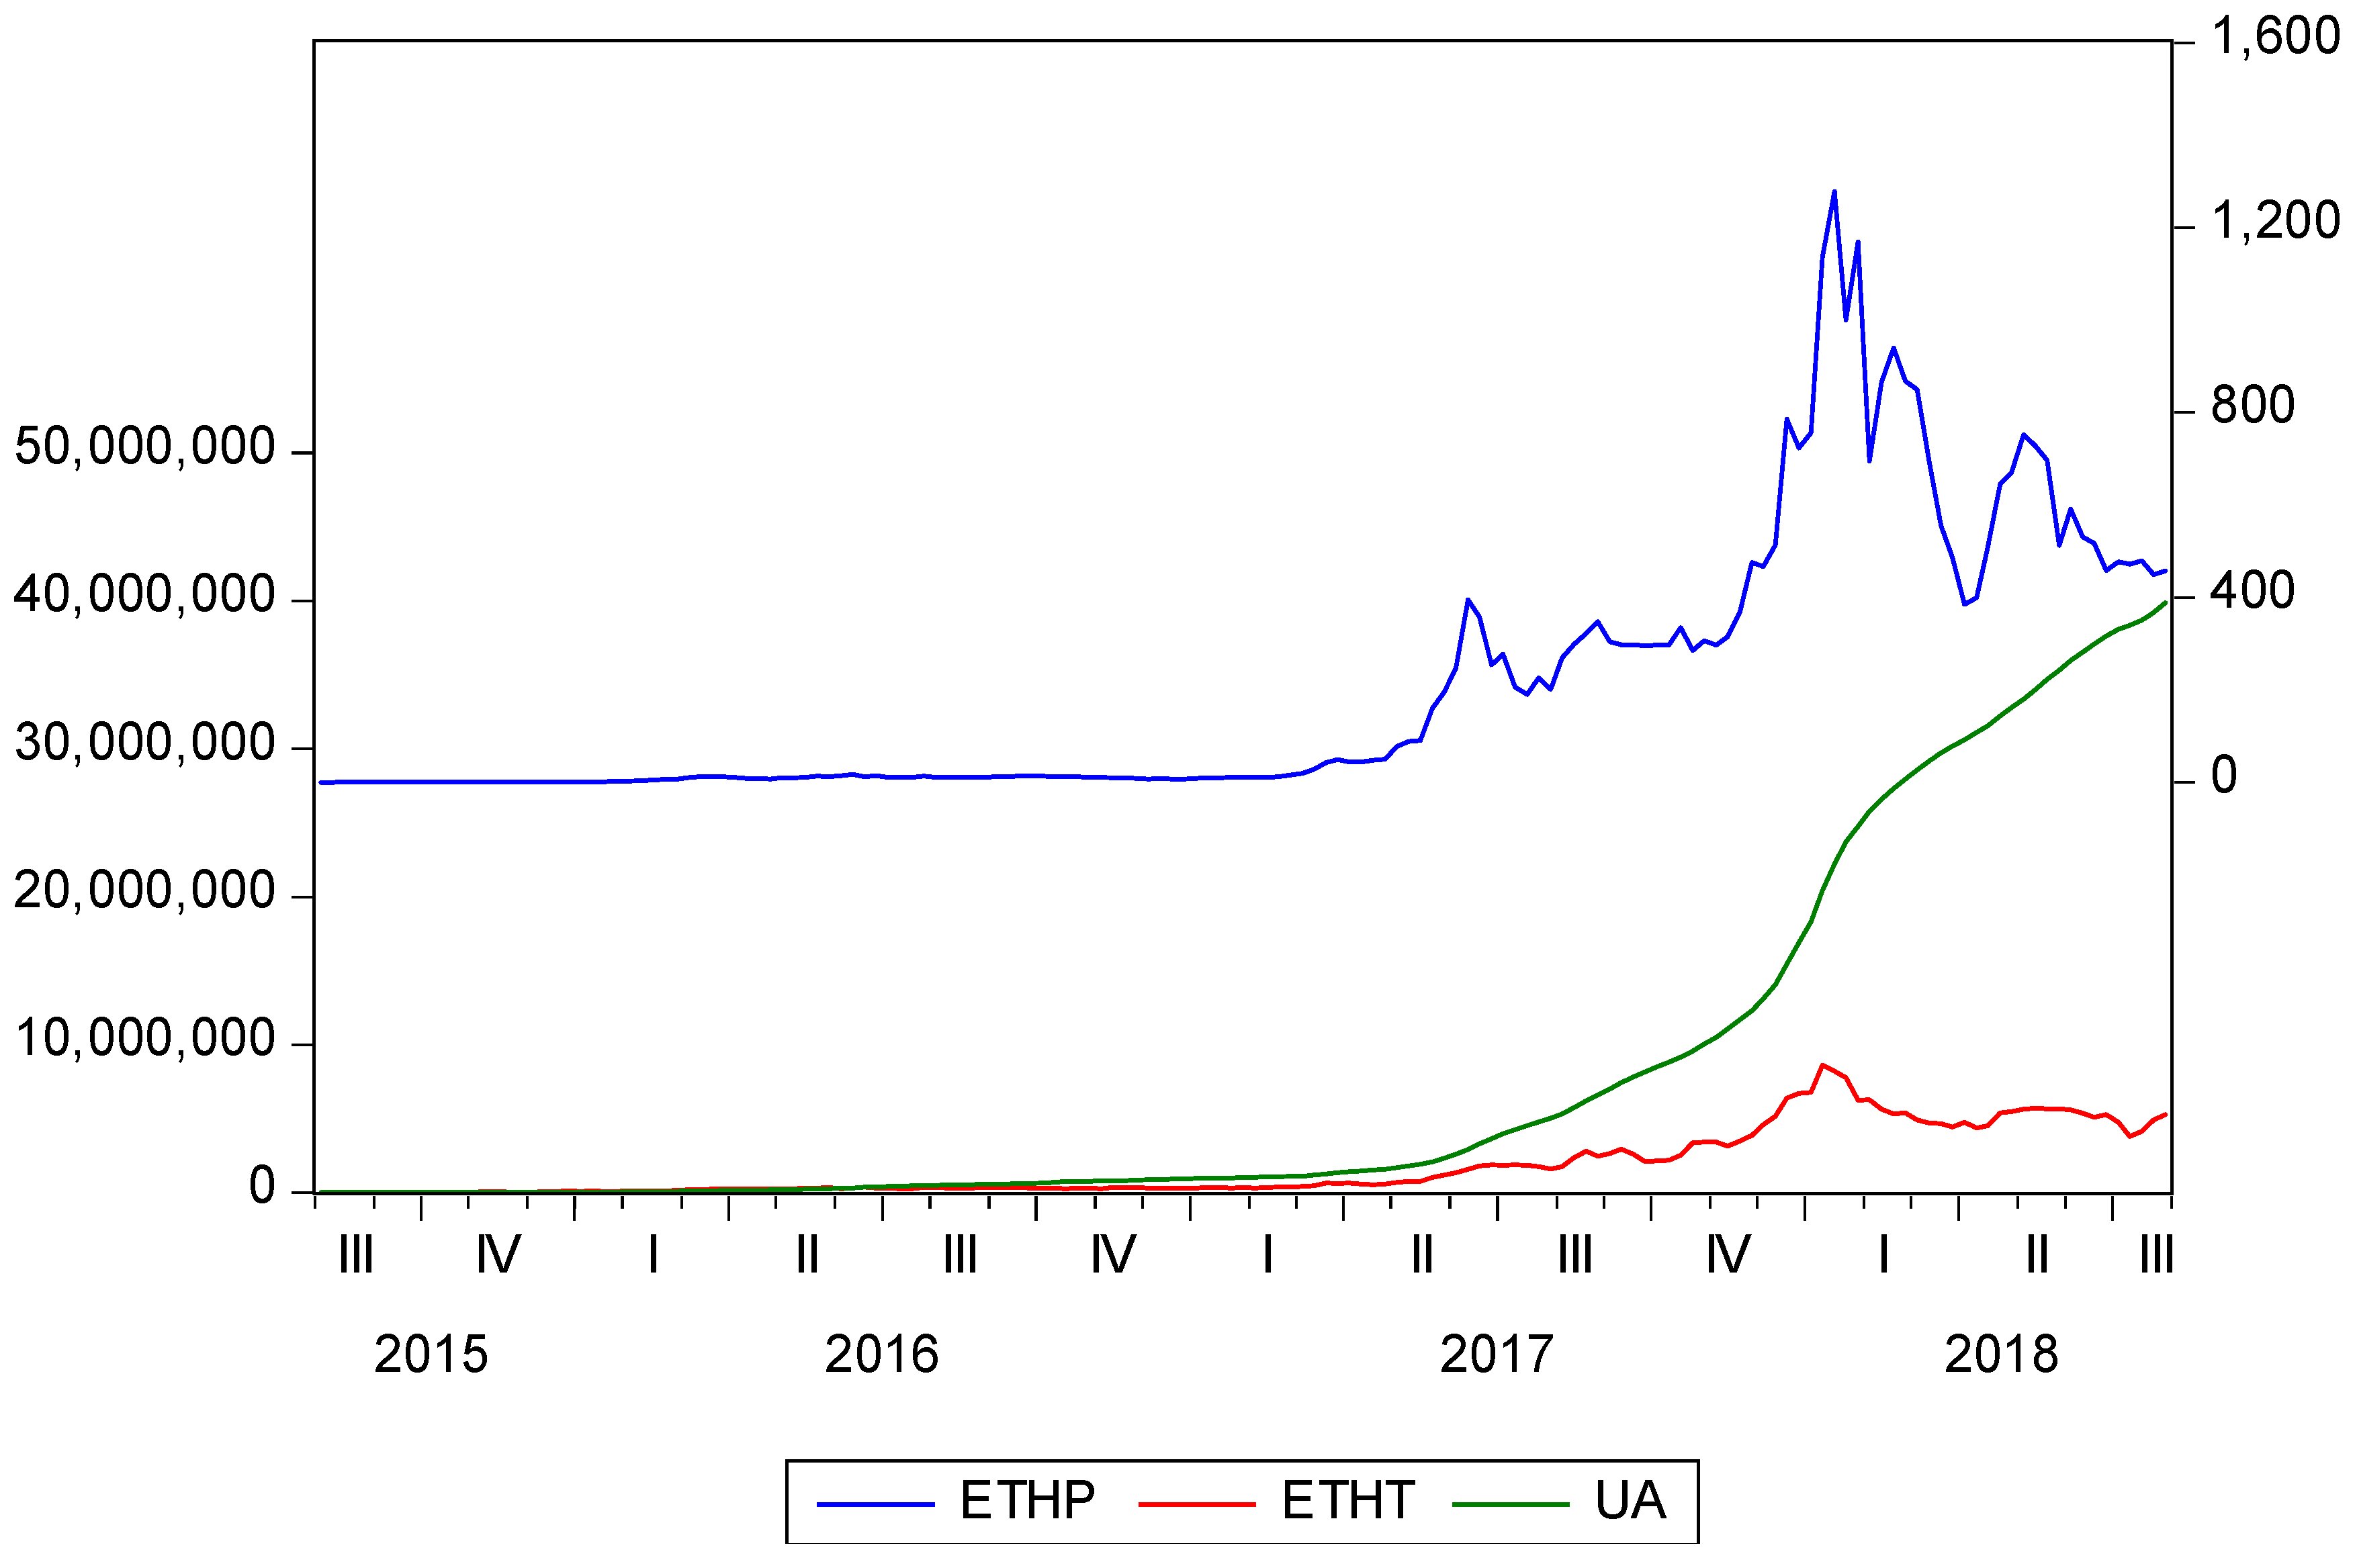
4.1. Sample and Data Collection

To control the effect of heterogeneity in transaction attributes and in participant identity, such as ‘Marque client’ [3,4], our research takes transactions in a crypto-digital ecosystem as the sample. We use two different data sources. First, with the help of a web crawling tool, we collect 282,046,578 transaction data from the Ethereum blockchain from 1 August 2015 to 1 August 2018, which includes information on participant addresses, time, value created in the form of numbers of its digital currency–Ether transferred, and the transaction cost, also in the form of numbers of digital currency transferred to the miners who validated the transaction. Second, Etherscan provides data such as daily Ether price denominated by US dollars, the number of unique addresses in the Ethereum, and the overall market capitalization of Ethereum, also denominated by US dollars. We manually adjust these data into weekly form.
Figure 2 shows the evolution of Ether price, transaction times and unique addresses over time. All three variables exhibit an upward trend and accelerate since the second quarter of 2017. After reaching their peak in the first quarter of 2018, Ether price and transaction times in Ethereum show a mean reversion feature, while the number of unique addresses increases steadily with no sign of slowing down by the end of July 2018.
Table 2 shows the descriptive statistics of these three variables. During the 3-year period, the average price of Ether (ETHP) increased from 0.3$ to 209.15$, with a peak value of 1,278.69 in January 2018. This is an impressive progression considering that the crypto-economy as a whole was still at a very early stage. However, the price was very volatile. The standard deviation of Ether price (291.25) was even larger than the average price itself. Meanwhile, there were 1,796,289 transactions taking place in Ethereum (ETHT) on average per week; the peak value was recorded during the same period when Ether price was highest, implying that there might be some endogeneity between transaction times and Ether price. The growing number of unique addresses (UA) represents the number of valid users. As shown, there were almost 8.05 million new registrations each week on average. The highest weekly registration number was also recorded during the time when transaction times and Ether price were at their peak values. We can clearly see unique address growth was accelerating from the fourth quarter of 2017 to January 2018. Since the scale and sustainability of value creation activity depend critically on the signaling role of digital currency traffic, transaction times and the number of users who participate, we will assume the effect of interaction among these variables as the value creation capability of a digital ecosystem. The dynamic mechanism among the three variables particularly affects the scale and sustainability of value creating activities.

4.2. Measures

To avoid spurious regression issues between the variables in the empirical analysis, we test for non-stationarity of the time series with the help of Augmented Dickey-Fuller (ADF) test. Results show that none of the original data series are stationary. As a result, we take the first differences of the variables to remove the unit root issue. To gain the information of the change rate of these variables, especially the Ether return series to better reveal the demand force and market reaction, we take Ether price series in log form, and the final adjustments are shown as follows:
DLOGETHP = Log (ETHP)-Log (ETHP−1)
DPETHT = (ETHT-ETHT−1)/ETHT−1  
DPUA = (UA-UA−1)/UA−1       
DLOGETHP is the Ether return series, and also reflects the demand force on Ether and, indirectly, the dependence on Ethereum, as we assume that Ethereum is the marketplace where Ether can maximize its value-in-use [21,22]. DPETHT is the change rate of transaction times that take place in Ethereum per week and a measurable proxy of trading activity and market emotion in Ethereum. DPUA represents the change rate of new user growth, partly reflecting the market emotion and the sustainability of value creation activities. All three series are stationary.

4.3. Model

As stated in Section 3, the endogeneity among all these three variables is so strong that we cannot directly separate the dependent variable from independent variables in the value creation process. To solve such a chicken-and-egg problem, we implement a non-structural linear VAR (Vector Auto regression) model to explore the inter-relationship among the variables and to identify the initial driving force in the timeline. The reduced form of the model is written as follows:
X t = C + i = 1 P A i X t i + U t
Xt is the 3 × 1 vector of endogenous variables including DLOGETHP, DETHT and DPUA, C is the vector of intercepts, Ut is the 3 × 1 vector of non-structural error terms, and Ai are 3 × 3 parameter matrices. P is the time lag. Both Schwarz criterion (SC) and Hannan–Quinn information criterion (HQ) favor a lag length of 1 for the model, while Akaike information criterion and Final prediction error (FPE) criterion support a lag length of 5. Auto-correlation testing shows that VAR (1) failed to reject autocorrelation at 5% significant level and VAR (5) eliminates the serial correlation issue. In addition, VAR (5) is stationary as all reverse roots of the AR characteristic polynomial fall into the unit circle.

5. Research Findings

Table 3 reports the Pearson correlation for each variable. The coefficient between DLOGETHP and DPETHT is 0.136, and 0.198 for DPUA; since they are both under 0.5, there is no serious multicollinearity problem. However, the coefficient between DPETHT and DPUA is 0.539, indicating that there is some degree of synchronization. Table 4 presents descriptive statistics of DLOGETHP, DPETHT and DPUA. The average weekly return of Ether is 1.6% during the period, but the volatility is even larger compared to the original data. The standard deviation of Ether return is 8.2%, almost 5 times the return rate, implying that the demand on Ether is highly volatile. The weekly change rate of transaction times is 5%, i.e., the annualized rate would be over 250%, implying that the turnover rate and frequency of transactions in Ethereum are both high. The growth rate of user number is relatively smooth, with a standard deviation of 4.5% per week. However, even if a user who registered a new unique address quits Ethereum, the unique address does not disappear, but it simply turns to sleep mode. So, unique address growth rate does not fully reveal the actual change in user number. In the robustness test section, we will introduce two alternative variables to indirectly reflect the change in user number.

5.1. Regression Results

We use the non-structural VAR (5) model to test the research hypotheses in Section 3. The regression results are reported in Table 5. Considering the case of Ether return alone, we can find that Ether return shows a long memory effect and short time latency in response. Returns of the lagged 3–5 period significantly influence the value at present, while those of the lagged 1–2 period do not. Trading activity in any lagged period has no significant influence on current Ether return. Meanwhile, the lagged 1 period of DPUA value has a strong positive effect on current Ether return (0.935) at the 1% significant level, suggesting that a change in user number in the last period strongly influences the demand on Ether in this period—H2b is thus supported.
Meanwhile, the change rate of trading activity at the current stage is positively influenced by the Ether return of the lagged 1 period at the 1% significant level, and by that of the lagged 2 period at the 10% significant level. These results support the idea that Ether return has a long memory effect. As the Ether return increased in the last period, the wealth effect makes Ether holders richer and more willing to transact. For suppliers, driven by the wealth effect brought by the increase in Ether return, they are more willing to accept Ether as a payment method as well. This also helps to explain the speculation phenomena in Ethereum and validates H1a. However, the user number in the past has no significant effect on current trading activity, thereby H3a is rejected and H4a is indirectly rejected if the scale of the ecosystem is measured by its user number.
In addition, change in user number growth is positively influenced by Ether return in the lagged 1 and 3 periods at the 1% significant level and 10% significant level, respectively. This can be explained by the wealth effect brought by Ether return as well—H2a is supported. Also, current user number change is also positively influenced by the lagged value of itself. Changes in user number in the lagged 1 and 3 periods positively affect the current value at the 1% significant level and 5% significant level, respectively. Trading activity in the lagged 5 period also influences the current user number value at the 1% significant level, but the economic significance is not strong enough (0.036). Besides, the trading activity value of lagged 1–4 has no significant influences on current user number. Therefore, it is convincing to conclude that trading activity in the past has no economically significant effect on user number—H3b and H4b are rejected if the scale of an ecosystem is measured by its user number.
One thing that deserves special attention is the fact that Ether return in the lagged 5 period has a significantly negative influence on all three variables at the current stage. Such a phenomenon can be explained by the market cycle of Ether demand. Our finding is consistent with Masiak et al. [63].

5.2. Granger Causality Tests

We put these three interactive variables into the Granger causality test to identify the initial factor in the timeline. The results are shown in Table 6. At the 5% level, DPUA is the Granger cause of DLOGETHP. At the 1% level, DLOGETHP can be used to predict DPETHT in the next period; DLOGETHP is the Granger cause of DPUA as well. Since there is no Granger cause between DPETHT and DPUA, we come to the following conclusions.
A change in user number will influence the Ether return in the next period; a changed Ether return reflects the demand force on Ether and the dependence on Ethereum, thereby influencing trading activity in the future as well as a potential user’s decision to join in Ethereum. In summary, the initial driving force of the interaction among the three variables is the change rate of user number. Meanwhile, user number is the starting point of the network effect cycle caused by information transmission and also the key to the sustainability of value creation capability.

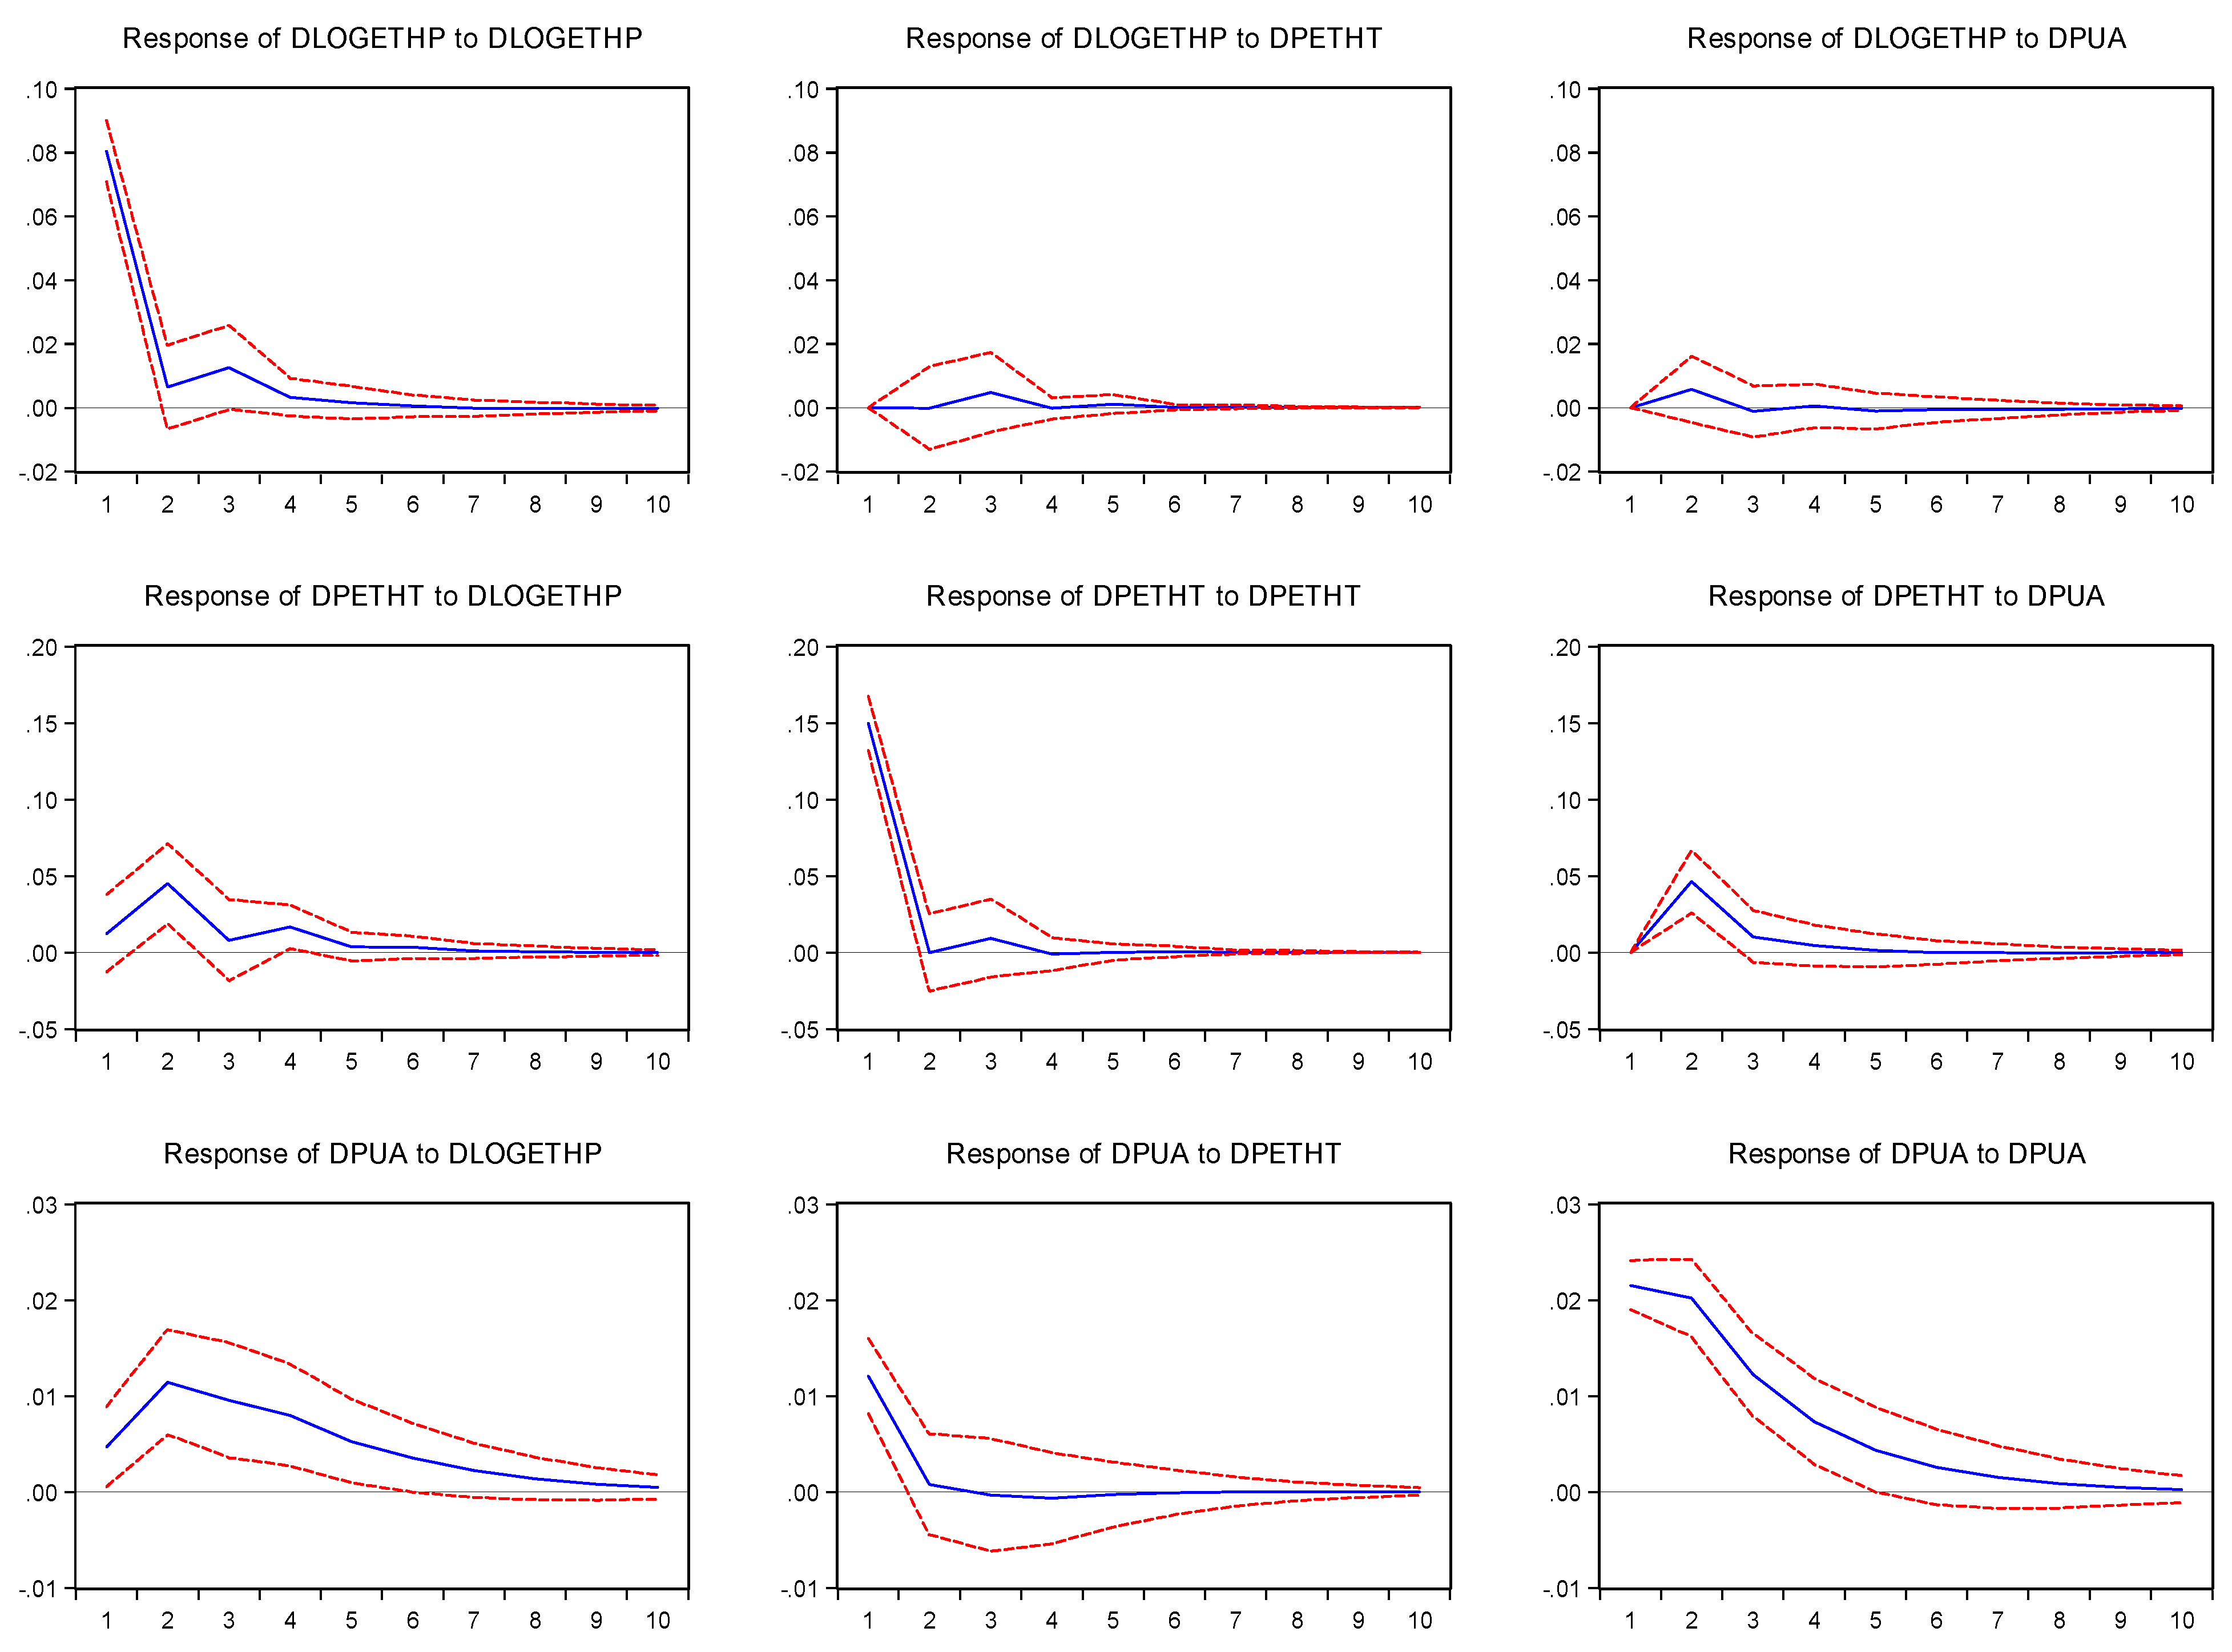
5.3. Impulse Response Functions

Figure 3 shows the impulse response functions (solid lines) alongside the 95% confidence bands (dash lines), as indicated by the impulse responses on the main diagonal. As we can see, firstly, shocks to any of the three variables are persistent for at least two periods, that is, almost 6 weeks for Ether return, 2 weeks for change in trading activity and almost 10 weeks for change in user number.
Second, Ether return shows no significant response to shocks from trading activity or user number, while trading activity significantly responds to the shock from Ether return. In the first period, Ether return increases trading activity, and the effect diminishes as time passes by. The shock from the first period will disappear between periods 5 and 6.
Third, user number significantly responds to the shock from Ether return; the positive response reaches its peak at period 2 and then slowly diminishes. Besides, user number shows limited responses to the shock from trading activity. The effect quickly diminishes at period 2. One possible reason for these results is that Ethereum is a crypto-digital ecosystem. Users can only observe the occurrence of a transaction by the change in Ether addresses, but they cannot know detailed information about the attributes of the transaction. Therefore, with the only network effect lying on Ether traffic, users respond to Ether return significantly but to the trading activities in the past with limited attention, implying that users care more about the change in Ether and take Ether return as a signal of other users’ expectation on Ethereum, whereas how many transactions were made in the past is not taken as a signal of future development.

5.4. Robustness Test

We take the following methods to test the robustness of our findings. First, we collect data of two alternative variables from Etherscan to measure the active user number: network hash rate (NHR) and block difficulty (BD). Both of these two variables can passively reflect the active user number. According to the Ethereum whitepaper, the more users participate in the mining competition, the more computing power the Ethereum gains in the form of an increasing NHR indicator [41]. Increased computing power may come from either the increased user number or the increased computing power from the existing user group. Since the consensus of Ethereum is proof of work (POW), as long as the top ten miners remain unchanged and their relative market shares remain stable, the increased computing power is most probably from the increased user number. The block difficulty (BD) variable reveals a similar mechanism. Again, according to the Ethereum whitepaper, the more members join in the mining competition, the more difficult it gets for the block to be solved. With similar adjustments to the data series, the results with the two substituted variables remain stable.
Second, we use the change rate of market capitalization to substitute Ether return. The scale of an ecosystem is a key issue for complementors such as content providers and application developers. Generally speaking, the scale of a platform, a community or an ecosystem determines the potential value it can create. By substituting Ether return for the change rate of Ethereum market capitalization, we find that the results are also robust. Since there is no significant influence between ecosystem market capitalization and trading activity, again, neither H4a nor H4b is supported if the scale of an ecosystem is measured by its market capitalization.
In addition, to avoid the period effect of sample selection, we collect 72 additional weekly data of the same variables during August 2018–August 2019 to see whether the findings of our model still stand. The results are again consistent with the previous conclusions.

6. Discussion and Conclusions

Understanding the generalized value creation mechanism of information transmission is a key issue in developing information-dependent business models, such as digital ecosystems, platforms and virtual communities. On the basis of signaling theory, we empirically investigated the role of the information transmission mechanism on the scale and sustainability of value creation in a digital ecosystem, identified critical factors and explored how their interaction affected generalized value creation on the ecosystem level. Taking a sample of 209 weekly transaction record data from Ethereum during 2015/8–2019/8, this research reveals several important characteristics.
This paper contributes to the study of signaling theory and digital economics by examining the effect of information transmission on the generalized value creation capability of a digital ecosystem. Previous studies on value creation have focused more on interactions between product and service providers and customers, and treated network and digital infrastructure efficiency as exogenous variables, or acknowledged the role of digital ecosystems in value creation but failed to incorporate that factor due to the complexity of ecosystems [13], the lack of methods to effectively track the interaction among actors or the mixed effect of heterogeneous transaction attributes. In this paper, we controlled the possible influences from all other factors to separately examine the role of information transmission by introducing a representative crypto-digital ecosystem: Ethereum. Using digital currency traffic as an observable proxy of information transmission, we could identify the initial driving force of interaction among critical factors by tracking the effect of each transaction. Different from some previous studies that treat the effect of a digital ecosystem or network in a general sense [15,28,32], we focus on the role of the information transmission mechanism alone, and our findings show that even without detailed information of transaction attributes, the simple fact that a specific transaction taking place is verified and known by all in the ecosystem in time would sufficiently enhance users’ belief and confidence in ecosystem operation. In addition, consistent with the research of Cong et al. [38], by investigating the traffic of Ether, the most commonly accepted token over Ethereum, we further observed that user number is still the initial driving force in crypto circumstances where tokens play the role of an exchange medium, and the effect of user number on digital currency demand outweighs the effect of digital currency demand on user number.
Overall, this paper provides some implications for both academic research and business practice. With respect to academic research implications, first of all, this paper contributes to the digital ecosystem building and information system literature by providing insights from a crypto-digital economy perspective to investigate the role of information transmission in value creation activities. Choosing digital currency traffic as an observable proxy of information transmission in a digital ecosystem is the first attempt so far to track information flow and how it affects members’ interaction in the ecosystem. Secondly, this paper contributes to research on digital entrepreneurship and digital innovation, emphasizes the importance of information transmission design and market orientation under digital economy circumstances, and identifies critical factors that affect the scale and sustainability of value creation capability.
With respect to practical implications, under digital circumstances, firms that aim to participate in value creation activities in an ecosystem need to assess the efficiency and completeness of its information transmission first, and then evaluate the network effect of the ecosystem from the perspectives of user number and the variety of complementors.
Nonetheless, our study has some limitations for further extending the role of the information transmission mechanism, as we only consider crypto-digital ecosystems, where the heterogeneity of transaction attributes is highly filtered. The limitations of our study suggest directions for further research. First, this paper solely investigates the role of information transmission in value creation and specifically chooses a circumstance where more detailed and various transaction attributes are encrypted; whether heterogeneous information affects the scale and sustainability of the ecosystem’s value creation capability remains unanswered. It is generally believed that a variety of transaction attributes and user identities increases the value of an ecosystem through a network effect [1,13,31,32], but there has been no research that particularly explores the effect of heterogeneity on value creation or network effects. Further research could explore the role of heterogeneity in network effects and value creation. Secondly, this paper focuses on critical factors of value creation capability from a transaction perspective; therefore, we selected variables that are highly related to transactions: transaction frequency, user number, digital currency demand and ecosystem overall scale. Whether generalized value creation capability can be represented and measured by these four variables is an open question. Further studies may explore different mechanisms formed by other alternative variables, such as generativity [64], management skills and leadership [15] and technology-enabling ability [61], all of which significantly influence the value creation capability of a digital ecosystem in the long term.

Funding

This research was supported by the National Natural Science Foundation of China (Project No. 71532005).

Acknowledgments

I particularly give thanks to the editors and anonymous referees for any helpful and kind comments.

Conflicts of Interest

The author declares no conflict of interest.

References

  1. Weill, P.; Woerner, S.L. Thriving in an Increasingly Digital Ecosystem. MIT Sloan Manag. Rev. 2015, 56, 27–34. [Google Scholar]
  2. Goldfarb, A.; Tucker, C. Digital Economics. J. Econ. Lit. 2019, 57, 3–43. [Google Scholar] [CrossRef] [Green Version]
  3. Rochet, J.C.; Tirole, J. Platform Competition in Two-Sided Markets. J. Eur. Econ. Assoc. 2003, 1, 990–1029. [Google Scholar] [CrossRef] [Green Version]
  4. Rochet, J.C.; Tirole, J. Two-Sided Markets: A Progress Report. Rand J. Econ. 2006, 37, 645–667. [Google Scholar] [CrossRef]
  5. Varian, H.R.; Farrell, J.; Shapiro, C. The Economics of Information Technology: An Introduction, 1st ed.; Cambridge University Press: London, UK, 2004; pp. 1–10. [Google Scholar]
  6. Yoo, Y.; Henfridsson, O.; Lyytinen, K. Research Commentary: The New Organizing Logic of Digital Innovation: An Agenda for Information Systems Research. Inform. Syst. Res. 2010, 21, 724–735. [Google Scholar] [CrossRef]
  7. Grossman, S.J.; Stiglitz, J.E. On The Impossibility of Informationally Efficient Markets. Am. Econ. Rev. 1980, 70, 393–408. [Google Scholar]
  8. Alstyne, M.W.; Parker, G.G. Two-Sided Network Effects: A Theory of Information Product Design. Manag. Sci. 2005, 51, 1449–1592. [Google Scholar]
  9. Armstrong, M. Competition in Two-Sided Markets. Rand J. Econ. 2006, 37, 668–691. [Google Scholar] [CrossRef]
  10. Boudreau, K.; Hagiu, A. Platform Rules: Multi-Sided Platforms as Regulators. 2008. Available online: https://papers.ssrn.com/sol3/papers.cfm?abstract_id=1269966 (accessed on 23 August 2019).[Green Version]
  11. Weyl, G.E. A Price Theory of Multi-Sided Platforms. Am. Econ. Rev. 2010, 100, 1642–1672. [Google Scholar] [CrossRef]
  12. Ramaswamy, V.; Ozcan, K. Brand Value Co-Creation in a Digitalized World: An Integrative Framework and Research Implications. Int. J. Res. Mark. 2016, 33, 93–106. [Google Scholar] [CrossRef]
  13. Autio, E.; Thomas, L.D.W. Ecosystems and Value Co-Creation. Acad. Manag. Proceed. 2018. [Google Scholar] [CrossRef]
  14. Ramaswamy, V. Co-Creation of Value: Towards an Expanded Paradigm of Value Creation. Mark. Rev. 2009, 26, 11–17. [Google Scholar] [CrossRef]
  15. Pera, R.; Occhiocupo, N.; Clarke, J. Motives and Resources for Value Co-Creation in a Multi-Stakeholder Ecosystem: A Managerial Perspective. J. Bus. Res. 2016, 69, 4033–4041. [Google Scholar] [CrossRef]
  16. Moore, J.F. Shared Purpose: A Thousand Business Ecosystems, a Connected Community, and the Future, 1st ed.; CreateSpace Independent Publishing Platform: Charleston, SC, USA, 2013; pp. 25–39. [Google Scholar]
  17. Fumagalli, A.; Lucarelli, S.; Musolino, E.; Rocchi, G. Digital Labour in the Platform Economy: The Case of Facebook. Sustainability 2018, 10, 1757. [Google Scholar] [CrossRef]
  18. Catalini, C.; Gans, J.S. Some Simple Economics of the Blockchain. 2017. Available online: https://papers.ssrn.com/sol3/papers.cfm?abstract_id=2874598 (accessed on 30 June 2019).
  19. Harvey, C.R. Cryptofinance. 2016. Available online: https://papers.ssrn.com/sol3/papers.cfm?abstract_id=2438299 (accessed on 18 August 2019).
  20. Abadi, J.; Brunnermeier, M. Blockchain Economics. 2018. Available online: https://scholar.princeton.edu/sites/default/files/markus/files/blockchain_paper_v3g.pdf (accessed on 8 September 2019).[Green Version]
  21. Amit, R.; Zott, C. Value Creation in E-Business. Strateg. Manag. J. 2001, 22, 493–520. [Google Scholar] [CrossRef]
  22. Amit, R.; Massa, L.; Zott, C. The Business Model: Recent Developments and Future Research. J. Manag. 2011, 37, 1019–1042. [Google Scholar] [Green Version]
  23. Katz, M.L.; Shapiro, C. Network Externalities, Competition and Compatibility. Am. Econ. Rev. 1985, 75, 424–440. [Google Scholar]
  24. Katz, M.L.; Shapiro, C. Systems Competition and Network Effects. J. Econ. Perspect. 1994, 8, 93–115. [Google Scholar] [CrossRef]
  25. Shapiro, C.; Varian, H.R. Information Rules: A Strategic Guide to the Network Economy, 1st ed.; Harvard Business School Press: Boston, MA, USA, 1998; pp. 173–226. [Google Scholar]
  26. Clements, M.T. Direct and Indirect Network Effects: Are They Equivalent? Int. J. Ind. Organ. 2004, 22, 633–645. [Google Scholar] [CrossRef]
  27. Tóth, Z.; Peters, L.D.; Pressey, A.; Johnston, W.J. Tensions in a Value Co-creation Context: A Network Case Study. Ind. Mark. Manag. 2018, 70, 34–45. [Google Scholar] [CrossRef]
  28. Vargo, S.L.; Maglio, P.P.; Akaka, M.A. On Value and Value Co-Creation: A Service Systems and Service Logic Perspective. Eur. Manag. J. 2008, 26, 145–152. [Google Scholar] [CrossRef]
  29. Alves, H.; Fernandes, C.; Raposo, R. Value Co-creation: Concept and Contexts of Application and Study. J. Bus. Res. 2016, 69, 1626–1633. [Google Scholar] [CrossRef]
  30. Galvagno, M.; Dalli, D. Theory of Value Co-Creation: A Systematic Literature Review. Manag. Serv. Qual. 2014, 24, 643–683. [Google Scholar] [CrossRef]
  31. Mahr, D.; Lievens, A.; Blazevic, V. The Value of Customer Co-Created Knowledge during the Innovation Process. J. Prod. Innov. Manag. 2014, 31, 599–615. [Google Scholar] [CrossRef]
  32. Autio, E.; Nambisan, S.; Thomas, L.D.W.; Wright, M. Digital Affordances, Spatial Affordances, and the Genesis of Entrepreneurial Ecosystems. Strateg. Entrep. J. 2018, 12, 72–95. [Google Scholar] [CrossRef]
  33. Zeng, S. Study on the Strategy of Customer Participation in Service Innovation in Virtual Community. Am. J. Ind. Bus. Manag. 2018, 8, 1469–1475. [Google Scholar] [CrossRef] [Green Version]
  34. Farrell, J.; Katz, M.L. Innovation, Rent Extraction and Integration in Systems Markets. J. Ind. Econ. 2000, 48, 413–432. [Google Scholar] [CrossRef]
  35. Hoyer, W.D.; Chandy, R.; Dorotic, M.; Krafft, M.; Singh, S.S.; Chandy, R.K. 2010, Customer Co-creation in New Product Development. J. Serv. Res. 2010, 13, 283–296. [Google Scholar] [CrossRef]
  36. Greenstein, S.; Lerner, J.; Stein, S. Digitization, Innovation, and Copyright: What is the Agenda? Strateg. Organ. 2013, 11, 110–121. [Google Scholar] [CrossRef]
  37. Rysman, M.; Schuh, S. New Innovations in Payments. Innov. Policy Econ. 2017, 17, 27–48. [Google Scholar] [CrossRef]
  38. Cong, L.W.; Li, Y.; Wang, N. Tokenomics: Dynamic Adoption and Valuation. 2018. Available online: https://papers.ssrn.com/sol3/papers.cfm?abstract_id=3153860 (accessed on 25 August 2019).[Green Version]
  39. Athey, S.; Parashkevov, I.; Sarukkai, V.; Xia, J. Bitcoin Pricing, Adoption and Usage: Theory and Evidence. 2017. Available online: https://siepr.stanford.edu/sites/default/files/publications/17-033_0.pdf (accessed on 5 September 2019).
  40. Budish, E. The Economic Limits of Bitcoin and the Blockchain. 2018. Available online: https://www.nber.org/papers/w24717 (accessed on 3 September 2019).
  41. Buterin, V. Ethereum: A Next Generation Smart Contract and Decentralized Application Platform. 2014. Available online: https://cryptorating.eu/whitepapers/ethereum/ethereum_white_paper.pdf (accessed on 8 July 2019).
  42. Seretakis, A. Blockchain, Securities Markets and Central Banking. 2018. Available online: https://papers.ssrn.com/sol3/papers.cfm?abstract_id=3007402 (accessed on 30 August 2019).
  43. Cong, L.W.; He, Z.G. Blockchain Disruption and Smart Contracts. Rev. Financ. Stud. 2019, 32, 1754–1797. [Google Scholar] [CrossRef]
  44. Bordo, M.D.; Levin, A.T. Central Bank Digital Currency and the Future of Monetary Policy. 2017. Available online: https://www.nber.org/papers/w23711.pdf (accessed on 8 September 2019).
  45. Raskin, M.; Yermack, D. Digital Currencies, Decentralized Ledgers, and the Future of Central Banking. 2016. Available online: https://www.nber.org/papers/w22238.pdf (accessed on 22 August 2019).
  46. Chiu, J.; Davoodalhosseini, M.; Jiang, J.; Zhu, Y. Central Bank Digital Currency and Banking. 2019. Available online: http://ssrn.com/abstract=3331135 (accessed on 8 September 2019).[Green Version]
  47. Diniz, E.H.; Siqueira, E.; Heck, E.V. Taxonomy of Digital Community Currency Platforms. Inform. Technol. Dev. 2019, 25, 69–91. [Google Scholar] [CrossRef]
  48. Albuquerque, R.; Miao, J.J. Advance Information and Asset Prices. J. Econ. Theory 2014, 149, 236–275. [Google Scholar] [CrossRef]
  49. Banerjee, S. Learning from Prices and the Dispersion in Beliefs. Rev. Financ. Stud. 2011, 24, 3025–3068. [Google Scholar] [CrossRef]
  50. Normann, R.; Ramirez, R. From Value Chain to Value Constellation: Designing Interactive Strategy. Harv. Bus. Rev. 1993, 71, 65–77. [Google Scholar]
  51. Etgar, M. A Descriptive Model of the Consumer Co-Production Process. J. Acad. Mark. Sci. 2008, 36, 97–108. [Google Scholar] [CrossRef]
  52. Vargo, S.L.; Lusch, R.F. Institutions and Axioms: An Extension and Update of Service- Dominant Logic. J. Acad. Mark. Sci. 2016, 55, 5–23. [Google Scholar] [CrossRef]
  53. Cova, B.; Dalli, D. Working Consumers: The Next Step in Marketing Theory? Mark. Theory 2009, 9, 315–339. [Google Scholar] [CrossRef]
  54. Ramaswamy, V.; Ozcan, K. What Is Co-Creation? An Interactional Creation Framework and Its Implications for Value Creation. J. Bus. Res. 2018, 84, 196–205. [Google Scholar] [CrossRef]
  55. Saarijärvi, H. The Mechanisms of Value Co-creation. J. Strateg. Mark. 2012, 20, 381–391. [Google Scholar] [CrossRef]
  56. Saarijärvi, H.; Kannan, P.K.; Kuusela, H. Value Co-creation: Theoretical Approaches and Practical Implications. Eur. Bus. Rev. 2013, 25, 6–19. [Google Scholar] [CrossRef]
  57. Ranjan, K.R.; Read, S. Value Co-Creation: Concept and Measurement. J. Acad. Mark. Sci. 2016, 44, 290–315. [Google Scholar] [CrossRef]
  58. Kohtamäki, M.; Rajala, R. Theory and Practice of Value Co-creation in B2B Systems. Ind. Mark. Manag. 2016, 56, 4–13. [Google Scholar] [CrossRef]
  59. Prahalad, C.K.; Ramaswamy, V. Co-Creation Experiences: The Next Practice in Value Creation. J. Interact. Mark. 2004, 18, 5–14. [Google Scholar] [CrossRef]
  60. Ceccagnoli, M.; Forman, C.; Huang, P.; Wu, D.J. Co-Creation of Value in a Platform Ecosystem: The Case of Enterprise Software. MIS Q. 2012, 36, 263–290. [Google Scholar] [CrossRef]
  61. Breidbach, C.F.; Maglio, P.P. Technology-Enabled Value Co-Creation: An Empirical Analysis of Actors, Resources and Practices. Ind. Mark. Manag. 2016, 56, 73–85. [Google Scholar] [CrossRef]
  62. Caillaud, B.; Jullien, B. Chicken And Egg: Competing Match-Makers. Rand J. Econ. 2003, 34, 309–328. [Google Scholar] [CrossRef]
  63. Masiak, C.; Block, J.H.; Masiak, T.; Neuenkirch, M.; Pielen, K.N. The Market Cycles of ICOs, Bitcoin and Ether. 2018. Available online: https://papers.ssrn.com/sol3/papers.cfm?abstract_id=3198694 (accessed on 2 September 2019).
  64. Zittrain, J.L. The Generative Internet. Harv. Law Rev. 2006, 119, 1974–2040. [Google Scholar]
Figure 1. Research model.
Sustainability 11 05345 g001
Figure 2. Trends of Ether price, Ethereum transaction times and unique addresses.
Sustainability 11 05345 g002
Figure 3. Response to Generalized One Standard Deviation Innovation within ±2 Standard Error.
Sustainability 11 05345 g003
Table 1. Top 10 global market capitalization enterprises in 2007 and 2017.
20072017
EnterpriseMC(Billion $)EnterpriseMC(Billion $)
Exxon Mobil467Apple815
G.E.394Alphabet637
Microsoft265Microsoft558
ICBC259Facebook485
Citi243Amazon461
AT&T238Berkshire Hathaway438
Royal Dutch232Alibaba415
BoA230Tencent394
Petro China225Johnson & Johnson357
China Mobile207Exxon Mobil323
Note: H.H. manually collected the data from the Wind database and made the table.
Table 2. Descriptive statistics of average price of Ether (ETHP), transactions taking place in Ethereum (ETHT) and unique addresses (UA).
ETHPETHTUA
Mean209.14717962898048799
Median13.843484721022347
Maximum1278.69860804539866900
Minimum082979639
Std. Dev.291.25222436212331958
Skewness1.4721.151.442
Kurtosis4.5443.0423.524
Jarque-Bera72.32634.6456.18
Probability000
Observations157157157
Table 3. Pearson correlation coefficients.
VariablesDLOGETHPDPETHTDPUA
DLOGETHP1.0000.1360.198
DPETHT1.0000.539
DPUA1.000
Table 4. Descriptive statistics of DLOGETHP, DPETHT and DPUA.
DLOGETHPDPETHTDPUA
Mean0.0160.0520.055
Median0.0050.0180.045
Maximum0.2491.4410.344
Minimum−0.266−0.2880
Std. Dev.0.0820.1690.045
Skewness0.2223.7002.476
Kurtosis3.64730.61513.502
Jarque-Bera4.0295346.961881.91
Probability0.13300
Observations156156156
Table 5. VAR (5) Regression results.
VariablesDLOGETHPDPETHTDPUA
DLOGETHP(−1)−0.0450.656 ***0.092 ***
(0.088)(0.132)(0.023)
DLOGETHP(−2)0.0950.263 *0.041
(0.095)(0.144)(0.025)
DLOGETHP(−3)0.259 ***0.0820.046 *
(0.091)(0.136)(0.024)
DLOGETHP(−4)−0.157 *−0.0420.02
(0.087)(0.131)(0.023)
DLOGETHP(−5)−0.205**−0.262 **−0.054 **
(0.089)(0.133)(0.023)
DPETHT(−1)−0.0319−0.031−0.02
(0.058)(0.088)(0.016)
DPETHT(−2)−0.008−0.094−0.01
(0.059)(0.089)(0.016)
DPETHT(−3)−0.0150.037−0.021
(0.049)(0.074)(0.013)
DPETHT(−4)0.060−0.0290.003
(0.049)(0.074)(0.013)
DPETHT(−5)0.059−0.0190.036 ***
(0.047)(0.071)(0.013)
DPUA(−1)0.935***−0.5170.653 ***
(0.336)(0.505)(0.089)
DPUA(−2)−0.2910.568−0.081
(0.399)(0.599)(0.106)
DPUA(−3)0.134−0.3640.233**
(0.367)(0.551)(0.097)
DPUA(−4)−0.5110.319−0.007
(0.347)(0.521)(0.092)
DPUA(−5)−0.2540.313−0.059
(0.264)(0.397)(0.07)
C0.0160.01680.011 ***
(0.013)(0.02)(0.003)
Observations152152152
R-squared0.2230.2240.712
Adj. R-squared0.1380.1380.68
Note: Standard errors in parentheses. * p < 0.1, ** p < 0.05, *** p < 0.01.
Table 6. VAR (5) Granger Causality Test.
Dependent Variable: DLOGETHP
ExcludedChi-sqDfProb.
DPETHT3.22450.666
DPUA12.13450.033 **
All13.52100.196
Dependent variable: DPETHT
ExcludedChi-sqDfProb.
DLOGETHP33.8250.000 ***
DPUA3.74150.587
All37.494100.000 ***
Dependent variable: DPUA
ExcludedChi-sqDfProb.
DLOGETHP31.350.000 ***
DPETHT12.20850.032 **
All41.777100.000 ***
Note: ** p < 0.05, *** p < 0.01.

